Sample Category Title
Best Instruments to Trade This Week
This week, there are a few high-probability trade ideas I'd like to recommend to you. Trading these setups, be sure to implement a proper risk management approach.
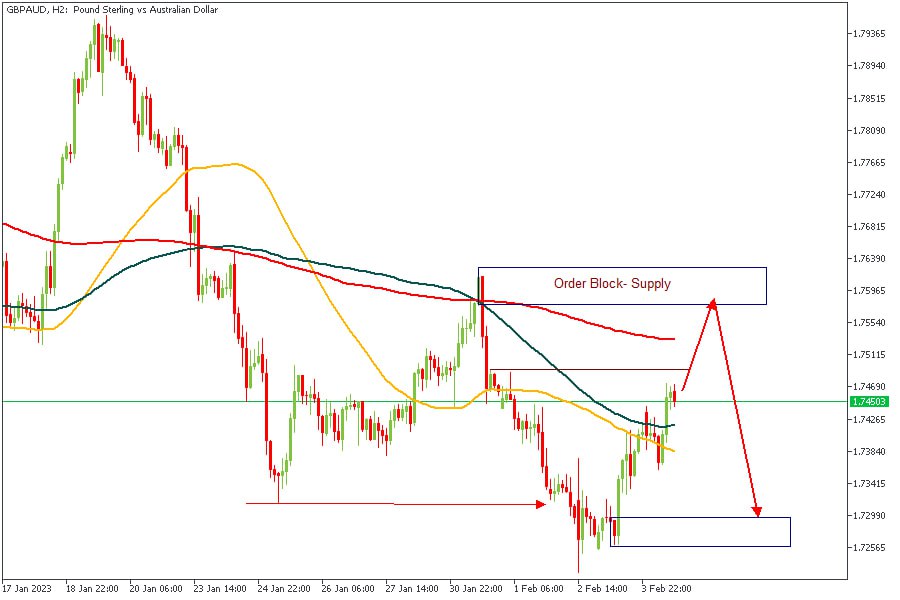
GBPAUD
After price initially broke below the low marked with the horizontal arrow, we see price create a possible retracement move up towards the Moving Average array. At the top of the previous high we also see a rally-base-drop supply zone and the 200-Period moving average acting as confluences in support of a bearish reaction from the marked supply.
Analysts’ Expectations:
- Direction: Bearish
- Target: 1.73020
- Invalidation: 1.76390
EURCAD
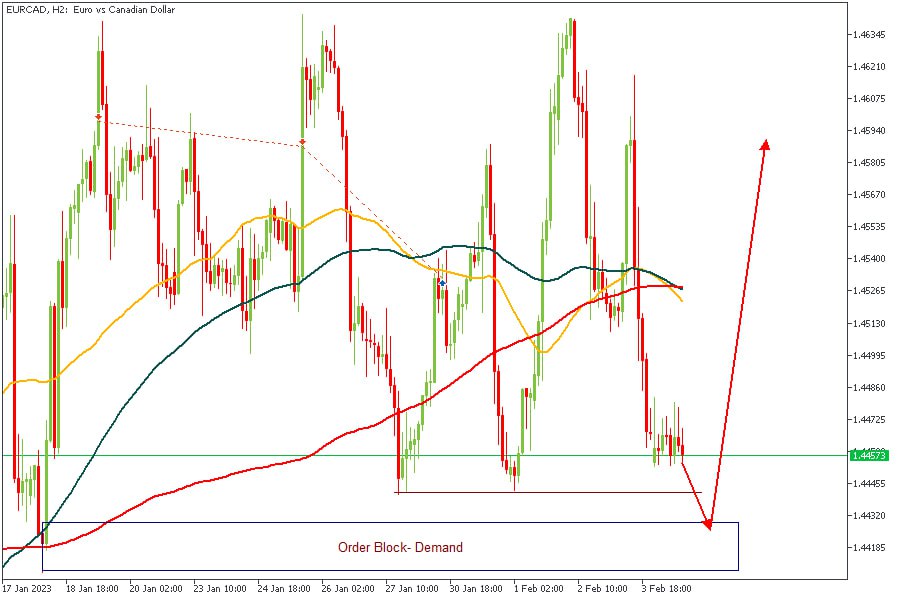
EURCAD is currently in an interesting zone. Price can be seen seemingly trying to decide whether to go a bit lower, to tap into the demand order block, or to simply react from the current area of support. Either way, there is a high probability that the price would go bullish anytime from now.
Analysts’ Expectations:
- Direction: Bullish
- Target: 1.45625
- Invalidation: 1.44050
NZDUSD
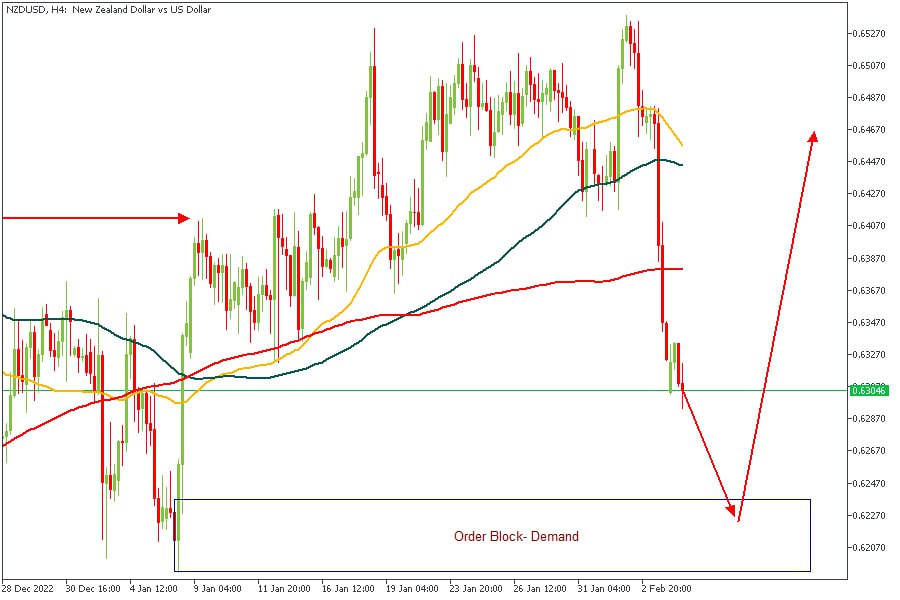
If you check NZDUSD on the Daily timeframe, you will notice that the 50-period Moving Average has already crossed above the 200-Day MA (Moving Average). When you correlate that with the chart above, you will see why I have chosen this particular setup for the week. After the break above, the high marked by the horizontal arrow, price comfortably established a bullish trend. This is why I am positive that price would provide us ample trading opportunities from the drop-base-rally demand order block.
Analysts’ Expectations:
- Direction: Bullish
- Target: 0.68370
- Invalidation: 0.61080
CONCLUSION
The trading of CFDs comes at a risk. Thus, to succeed, you have to manage risks properly. To avoid costly mistakes while you look to trade these opportunities, be sure to do your due diligence and manage your risk appropriately.
Technical Outlook and Review
USD/JPY:
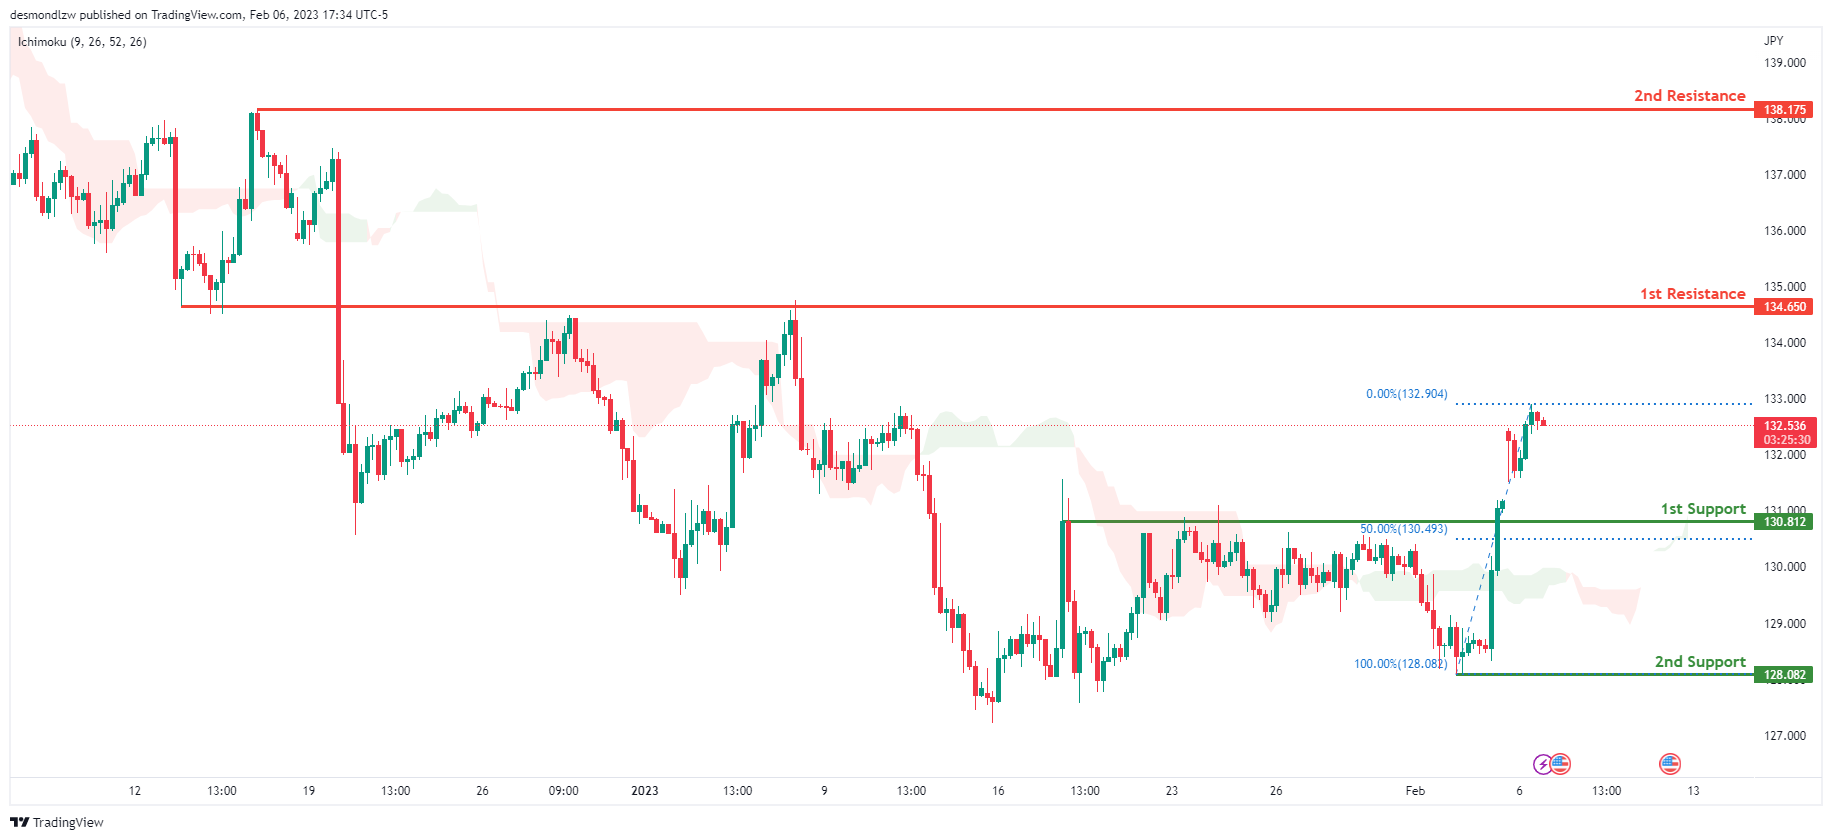
Looking at the H4 chart, my overall bias for USDJPY is bullish due to the current price crossing above the Ichimoku cloud, indicating a bullish market. If this bullish momentum continues, expect the price to possibly continue heading towards the 1st resistance at 134.632, where the overlap resistance is. In an alternate scenario, price could possibly head back down to retest the 1st support at 130.812, where the overlap support and 50% Fibonacci line is.
Areas of consideration:
- H4 time frame, 1st resistance at 134.632
- H4 time frame, 1st support at 130.812
DXY:
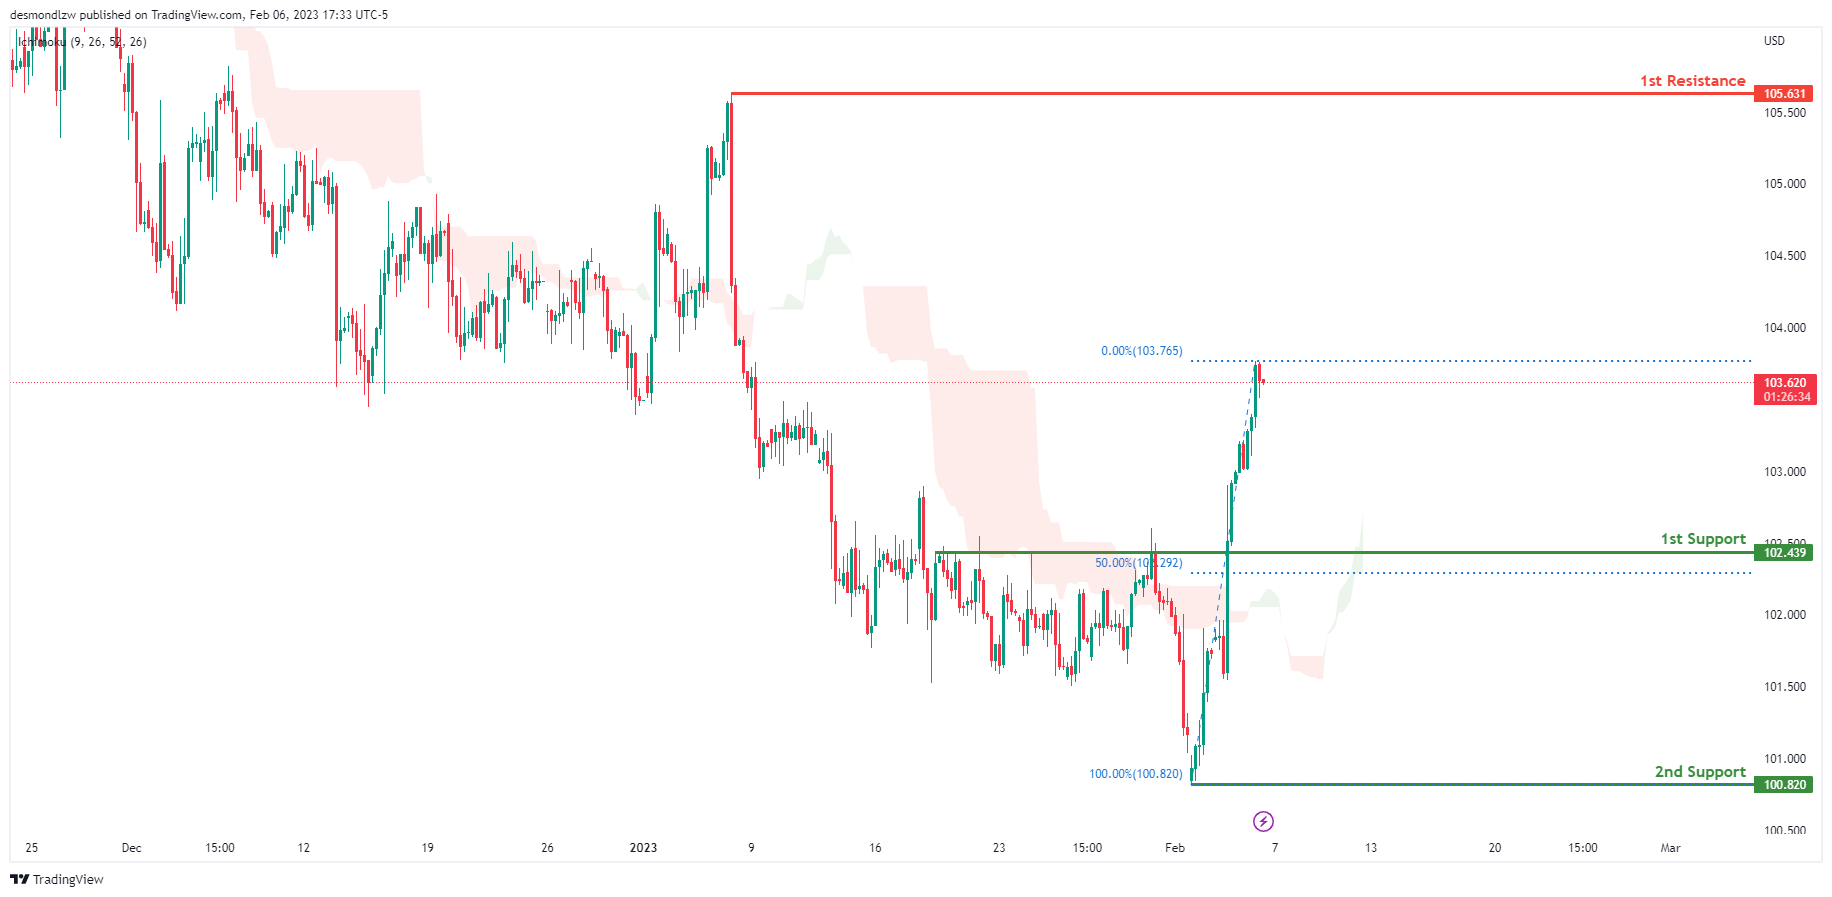
Looking at the H4 chart, my overall bias for DXY is bullish due to the current price crossing above the Ichimoku cloud, indicating a bullish market. If this bullish momentum continues, expect the price to possibly continue heading towards the 1st resistance at 105.631, where the previous swing high is. In an alternative scenario, price could head back down to retest the 1st support at 102.439, where the 50% Fibonacci line and overlap support is.
Areas of consideration:
- H4 time frame, 1st resistance at 103.463
- H4 time frame, 1st support at 99.241
EUR/USD:
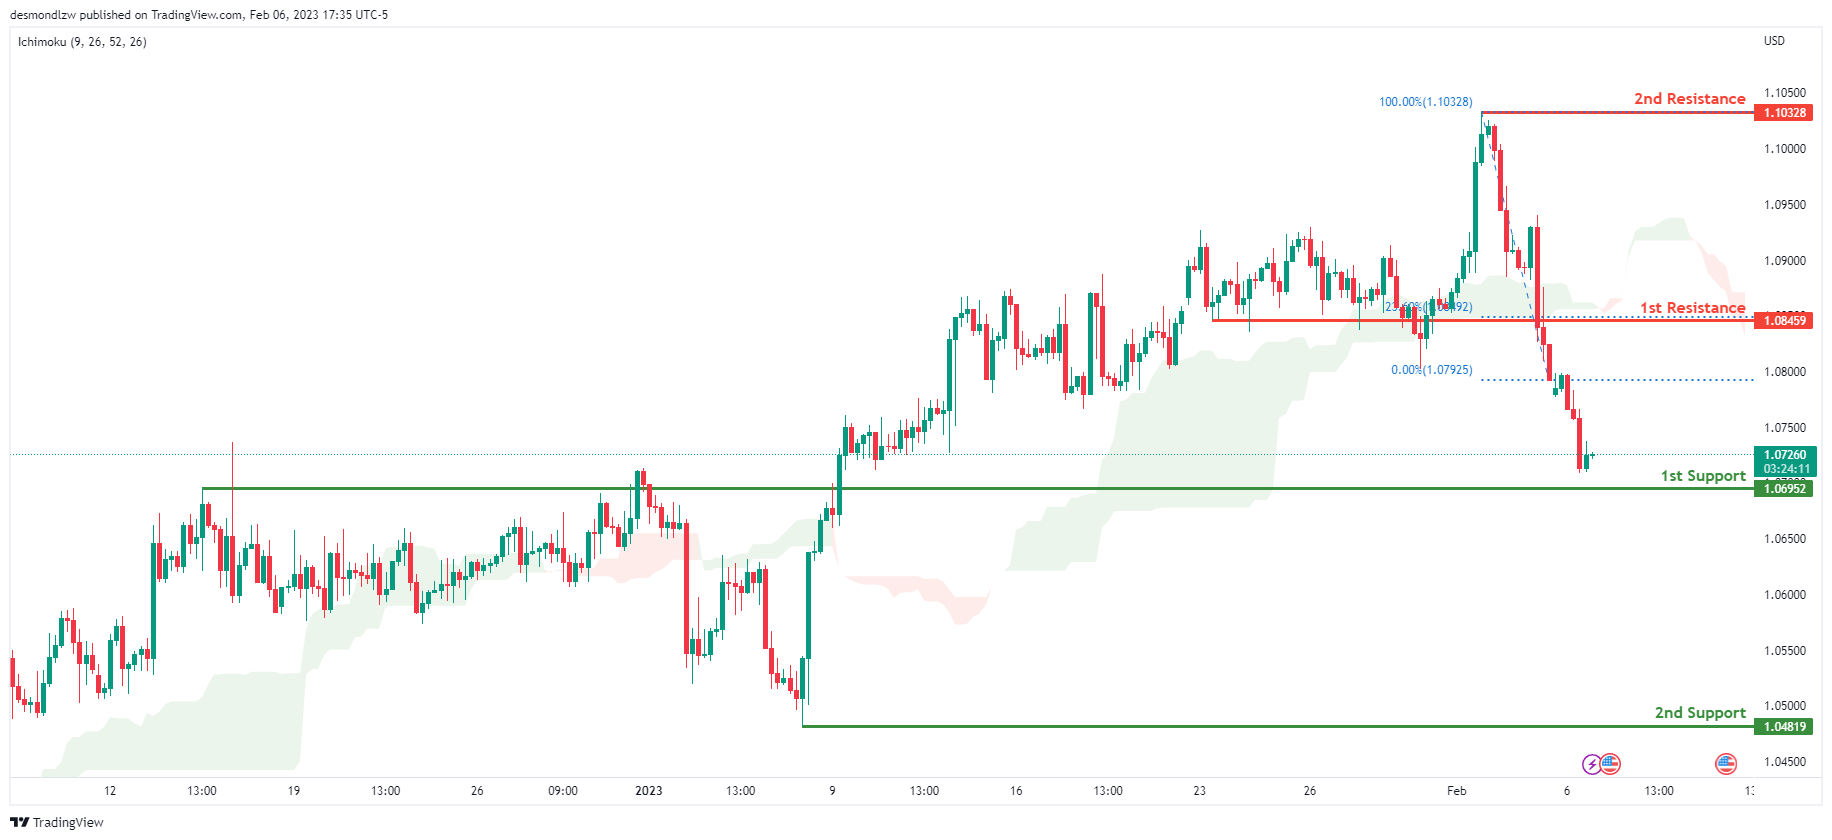
Looking at the H4 chart, my overall bias for EURUSD is bearish due to the current price crossing below the Ichimoku cloud, indicating a bearish market structure. If this bearish momentum continues, expect the price to possibly continue heading towards the 1st support at 1.06952, where the overlap support is. In an alternate scenario, price could possibly head back up to retest the 1st resistance at 1.08459, where the overlap resistance and 23.6% Fibonacci line is.
Areas of consideration :
- H4 1st resistance at 1.08459
- H4 1st support at 1.06952
GBP/USD:
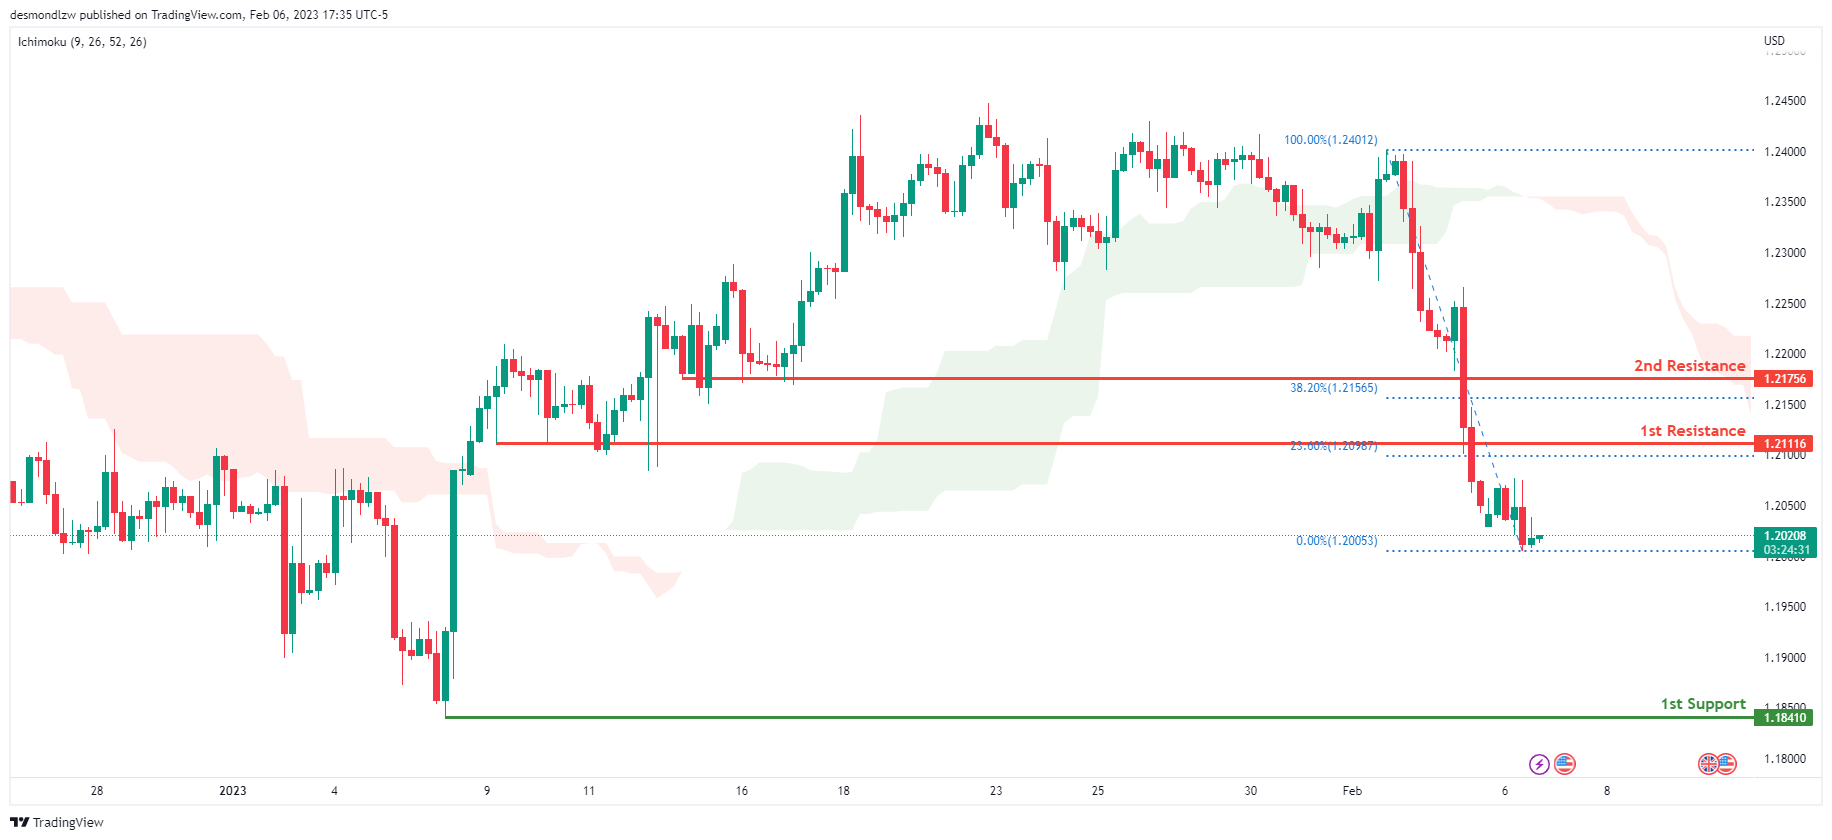
Looking at the H4 chart, my overall bias for GBPUSD is bearish due to the current price crossing below the Ichimoku cloud, indicating a bearish market. If this bearish momentum continues, expect the price to possibly continue to head towards the 1st support at 1.18410, where the previous swing low is. In an alternate scenario, price could head back up to retest the 1st resistance line at 1.21116 where the overlap resistance and 23.6% Fibonacci line is.
Areas of consideration:
- H4 1st resistance at 1.21116
- H4 1st support at 1.18410
USD/CHF:
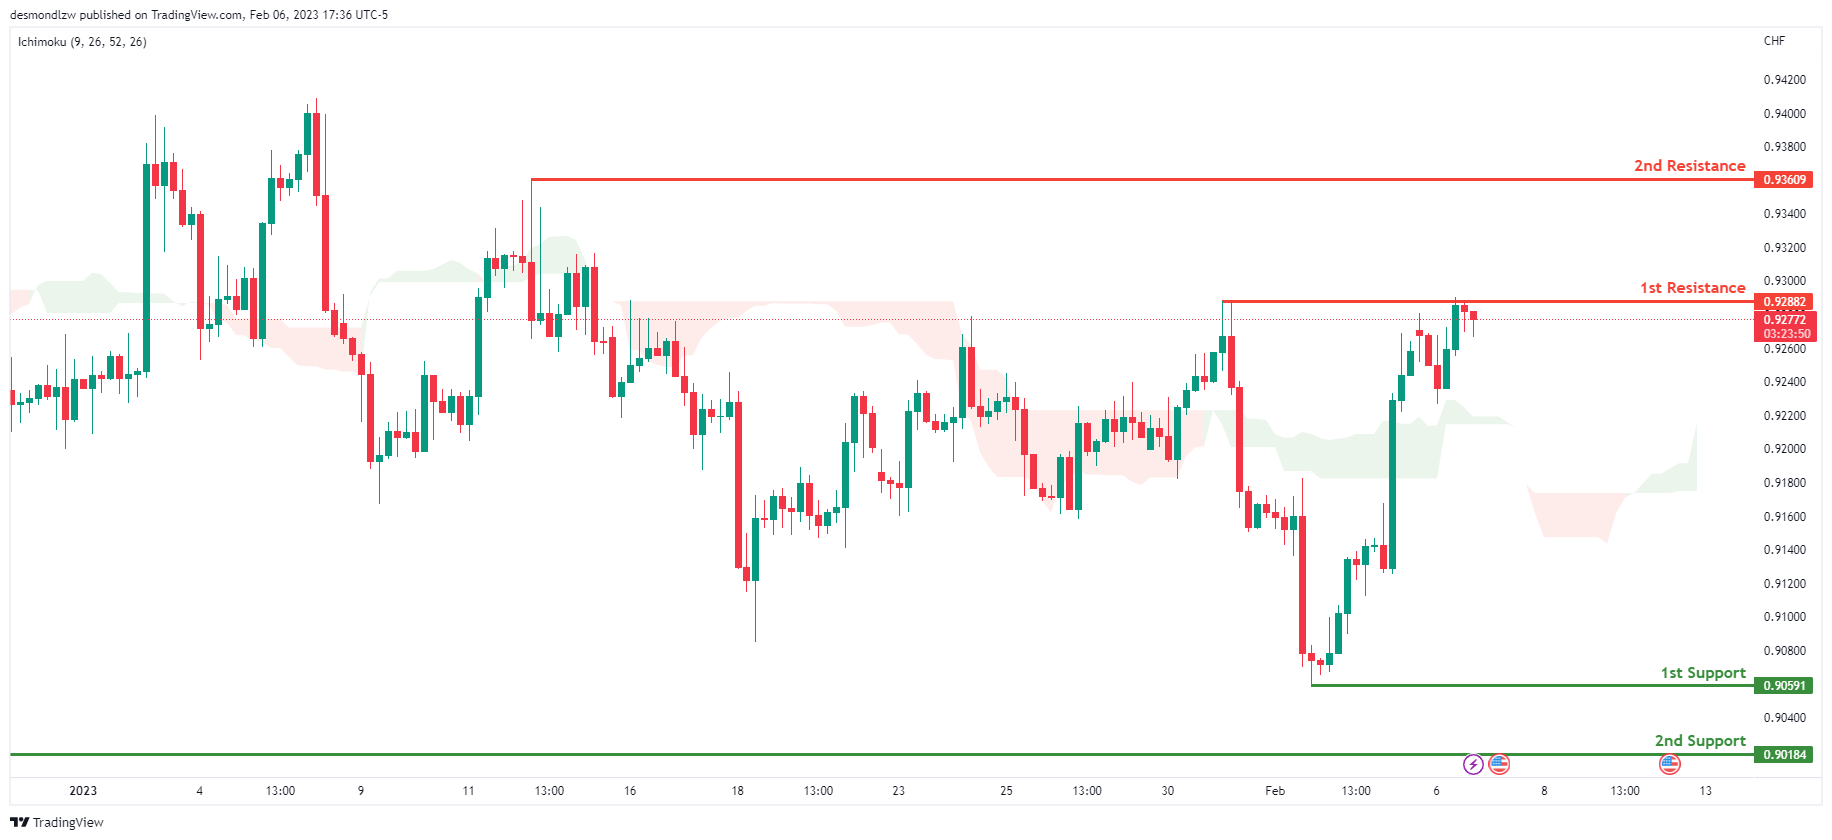
Looking at the H4 chart, my overall bias for USDCHF is bullish due to the current price being above the Ichimoku cloud, indicating a bullish market. If the current bullish trend continues, expect the price to possibly break the 1st resistance at 0.92882, where the previous swing high is, before heading towards the 2nd resistance at 0.93609 where the intermediate high is. In an alternative scenario, price could possibly head back down to retest the 1st support at 0.90591, where the recent swing low is.
Areas of consideration
- H4 1st support at 0.90591
- H4 1st resistance at 0.92882
- H4 2nd resistance at 0.93609
XAU/USD (GOLD):
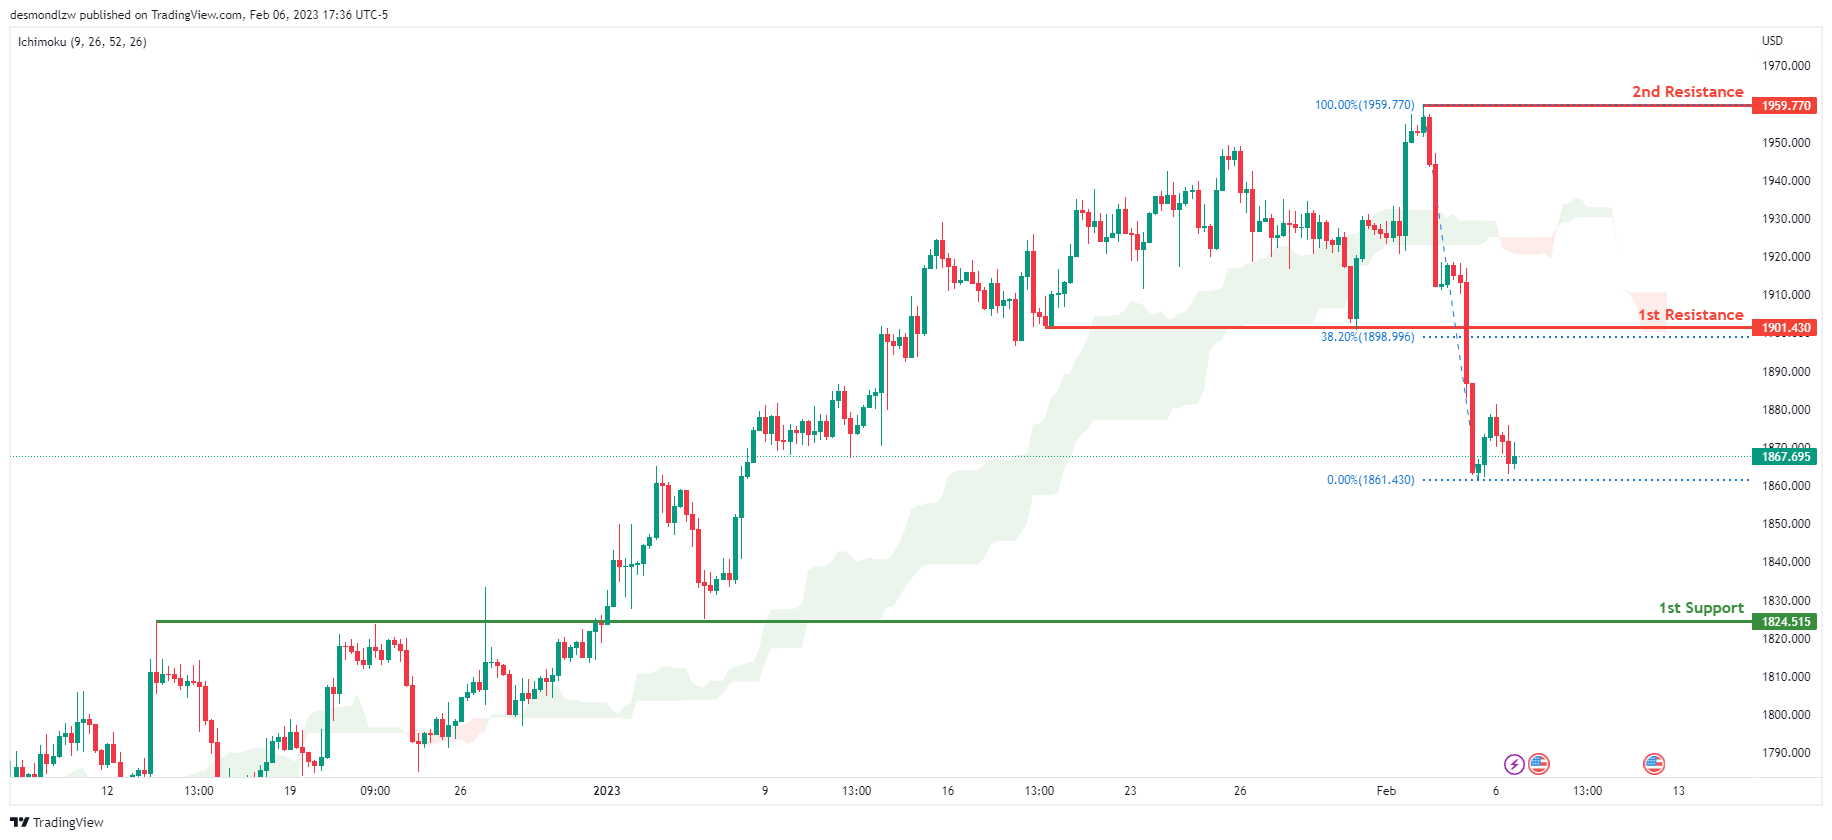
Looking at the H4 chart, my overall bias for XAUUSD is bearish due to the current price being below the Ichimoku cloud, indicating a bearish market. If this bearish momentum continues, expect the price to possibly continue heading towards the 1st support at 1824.515 where the overlap support is. In an alternative scenario, price could possibly head back up to retest the 1st resistance at 1901.430, where the overlap resistance and 38.2% Fibonacci line is.
Areas of consideration:
- H4 time frame, 1st resistance at 1901.430
- H4 time frame, 1st support at 1824.515
AUD/USD:
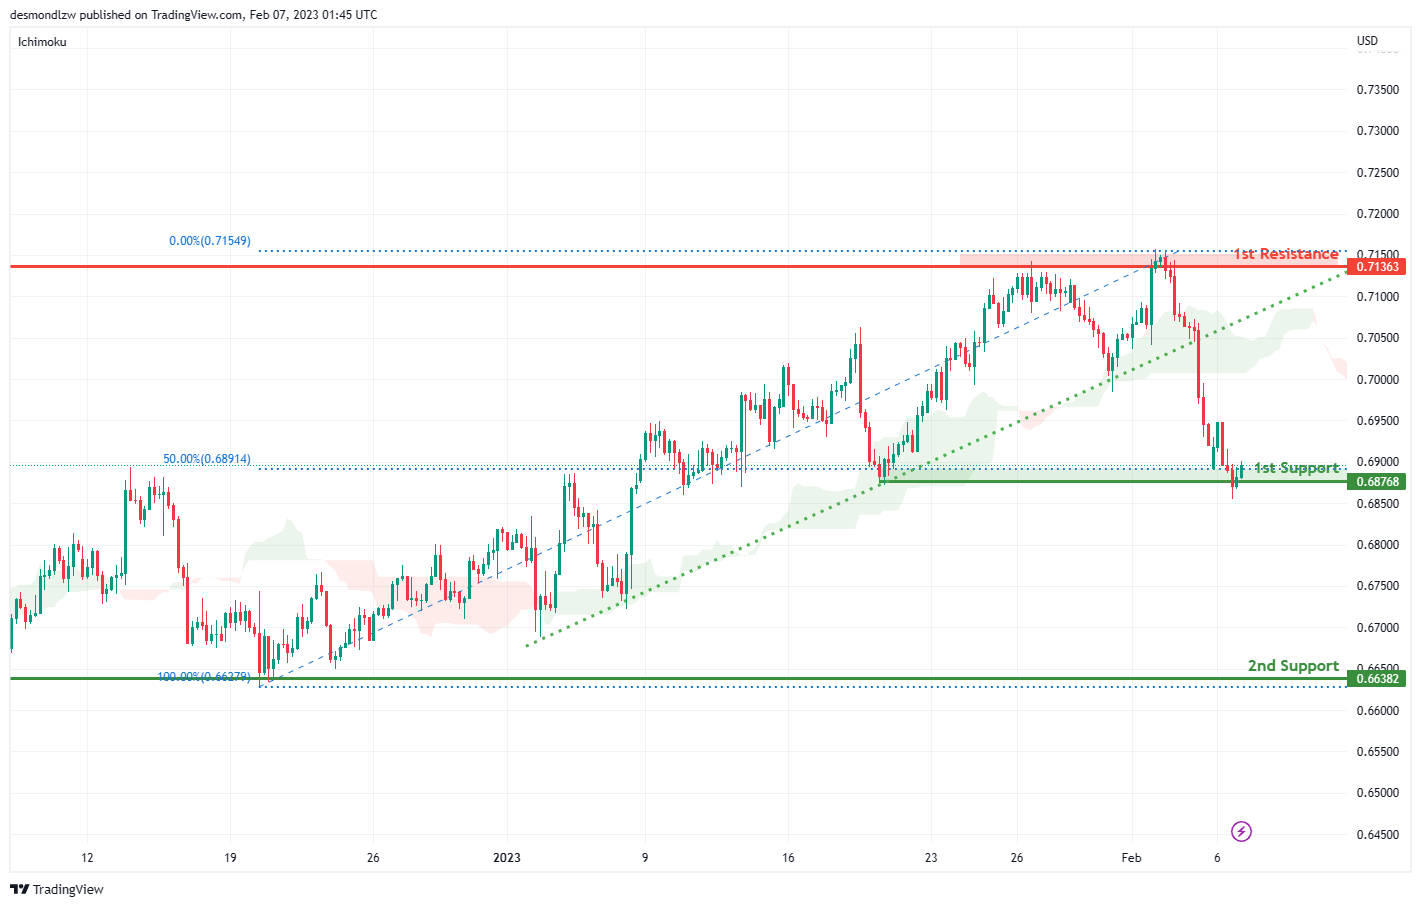
Looking at the H4 chart, my overall bias for AUDUSD is bearish due to the current price is below the Ichimoku cloud, and the ascending trend line has been broken, indicating a change of market structure.
The 1st support is at 0.68768 which in line with the 50% Fibonacci retracement. The 2nd support is at 0.66382 which is the overlap and recent swing low.
In an alternate scenario, the price could possibly go back up towards the 1st resistance level at 0.71363 which is the recent swing high.
Areas of consideration
- H4. 1st resistance at 0.71363
- H4, 1st support at 0.68768
- H4, 2nd support at 0.66382
NZD/USD:
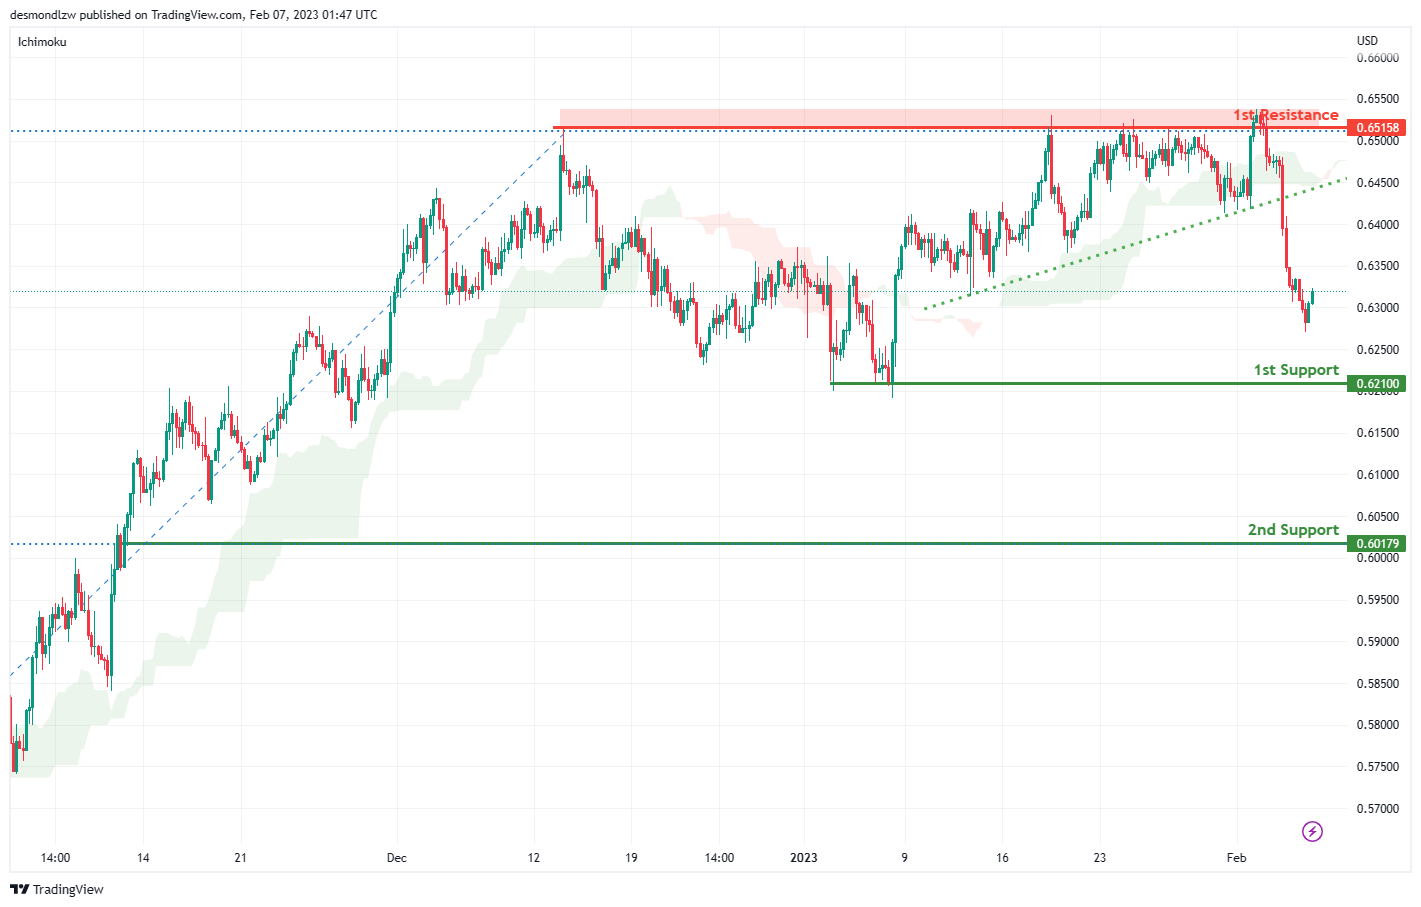
Looking at the H4 chart, my overall bias for NZDUSD is bearish, as the current price is below the Ichimoku Cloud, and the ascending trend line has been broken, indicating a change of market structure. Expecting the price go down towards the 1st support at 0.62100 which is the recent overlap swing low. The 2nd support is at 0.60179 which is in line with 50% Fibonacci retracement.
In an alternate scenario, price could possibly up towards the 1st resistance level at 0.65158 which is the recent overlap swing high.
Areas of consideration:
- H4 time frame, 1st resistance at 0.65158
- H4 time frame, 1st support at 0.64147
- H4 time frame, 2nd support at 0.62106
USD/CAD:
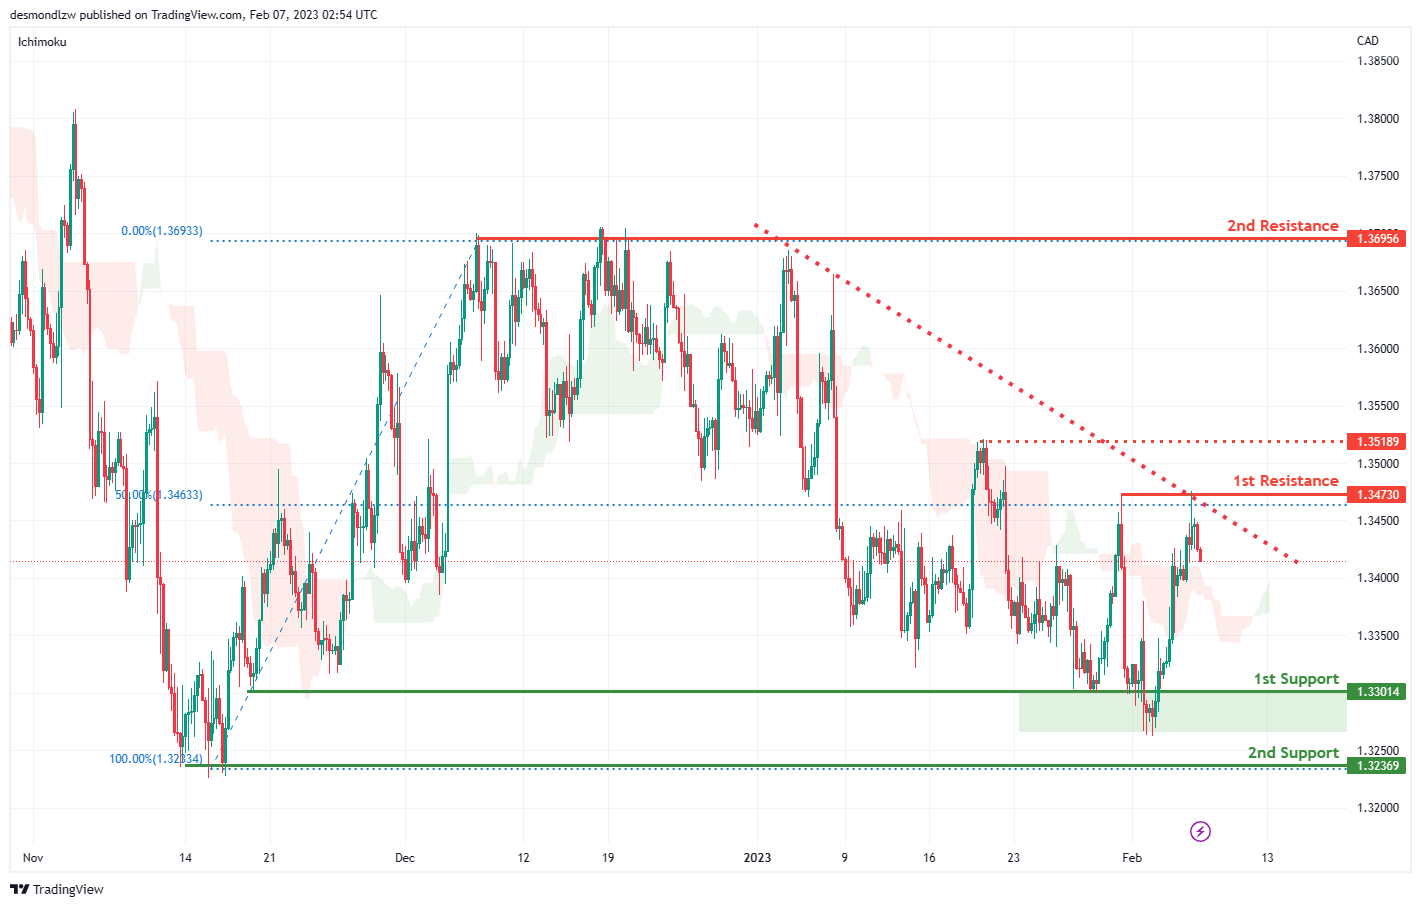
Looking at the H4 chart, my overall bias for USDCAD is bearish , as there is a descending trend line. Expecting the current price is head down towards the 1st support at 1.33014. The 2nd support is at 1.32369 which is the previous swing low.
In an alternative scenario, the price could possibly head up to the 1st resistance at 1.34730 which is the recent swing high and also in line with the 50% Fibonacci retracement. The 2nd resistance is at 1.36933 which the previous swing high.
Areas of consideration:
- H4 time frame, 2nd resistance at 1.36933
- H4 time frame, 1st resistance at 1.34730
- H4 time frame, 1st support at 1.33014
- H4 time frame, 2nd support at 1.32369
OIL:
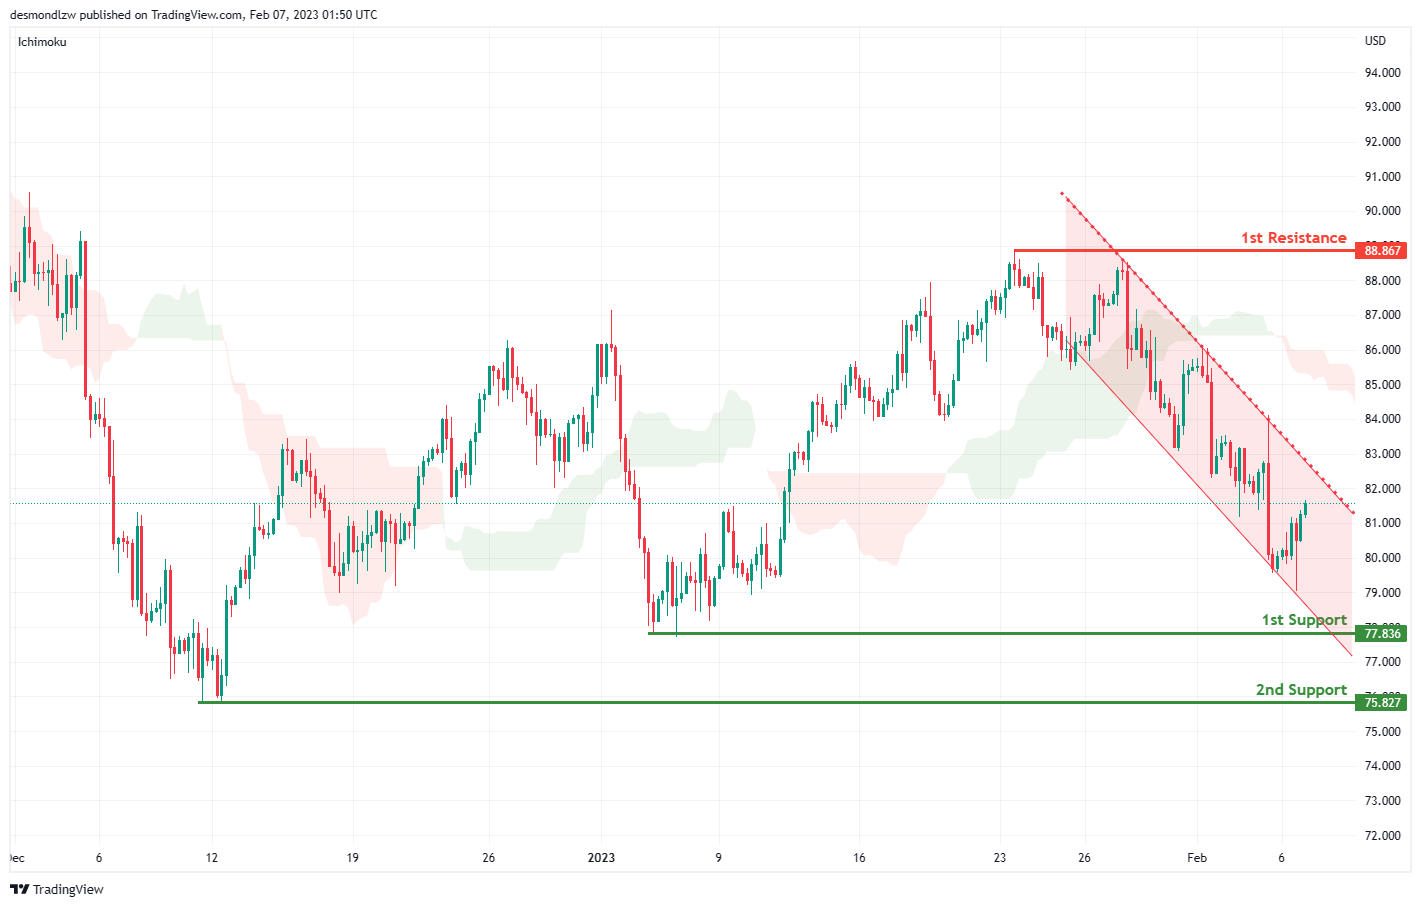
Looking at the H4 chart, my overall bias for BOC is bearish.as the current price is below the Ichimoku cloud, and a descending channel add confluence to my bias. Expecting the pricehead down towards the 1st support level at 77.836, before it heads down to the 2nd support at 75.827 which is the recent swing low.
In an alternate scenario, the price could possibly head up towards the 1st resistance level at 88.867 which is the recent swing high.
Areas of consideration:
- H4 time frame, 1st resistance at 88.867
- H4 time frame,1st support at 77.836
- H4 time frame, 2nd support at 75.827
Dow Jones Industrial Average:
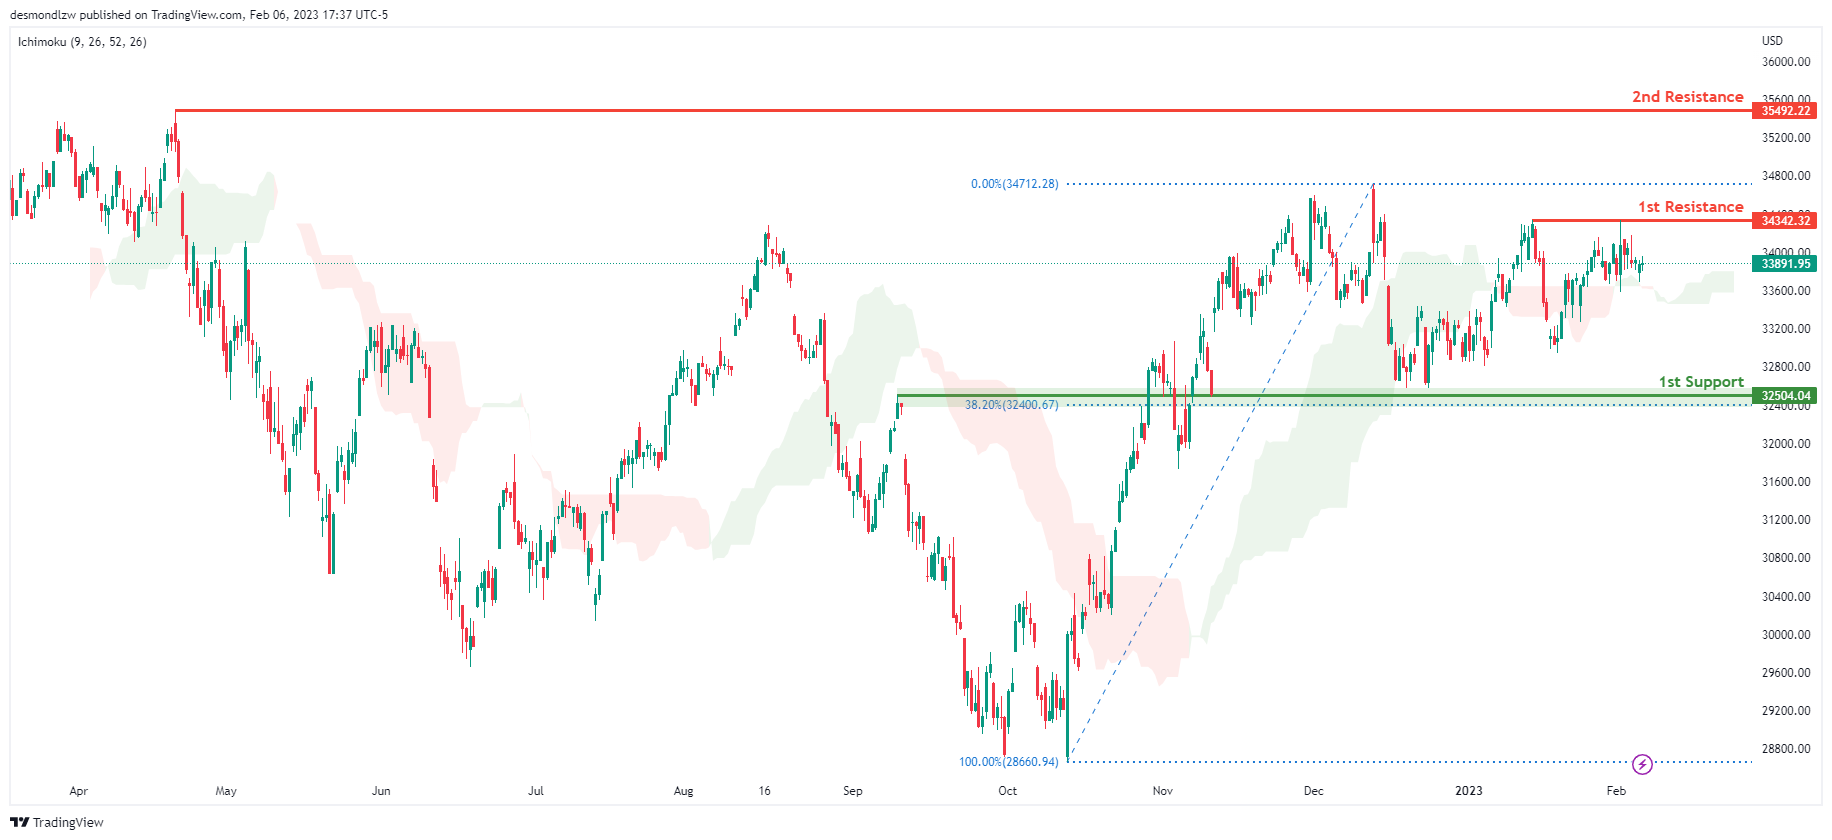
On the H4 chart, the overall bias for DJI is bullish. To add confluence to this, the price is crossing above the Ichimoku cloud which indicates a bullish market. If this bullish momentum continues, expect the price to possibly continue heading towards the 1st resistance line at 34342.32, where the recent swing high is. In an alternative scenario, price could possibly head back down towards the 1st support at 32581.97, slightly above where the 38.2% Fibonacci line is.
Areas of consideration:
- H4 time frame, 1st support at 32581.97
- H4 time frame, 1st Resistance at 34342.32
DAX:
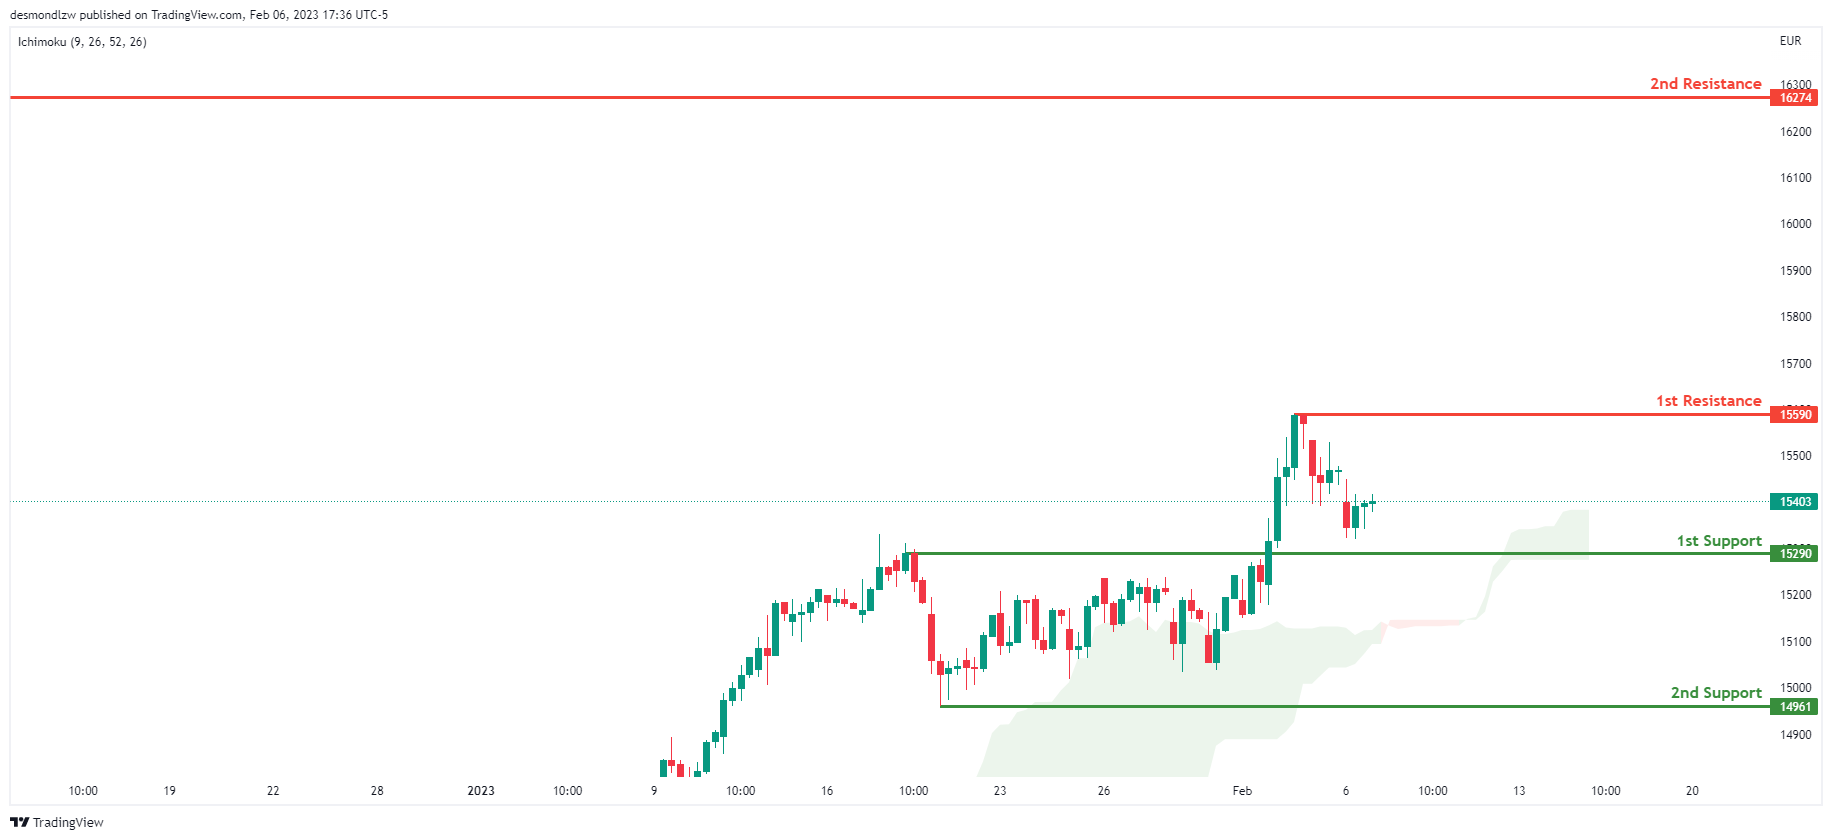
Looking at the H4 chart, my overall bias for DAX is bullish due to the current price crossing above the Ichimoku cloud, indicating a bullish market. If this bullish momentum continues, expect the price to possibly head towards the 1st resistance line at 15590, where the recent high is. In an alternative scenario, price could possibly head down to retest the 1st support at 15290, where the overlap support is.
Areas of consideration:
- H4 time frame, 1st resistance is at 15590
- H4 time frame, 1st support is at 15290
ETHUSD:
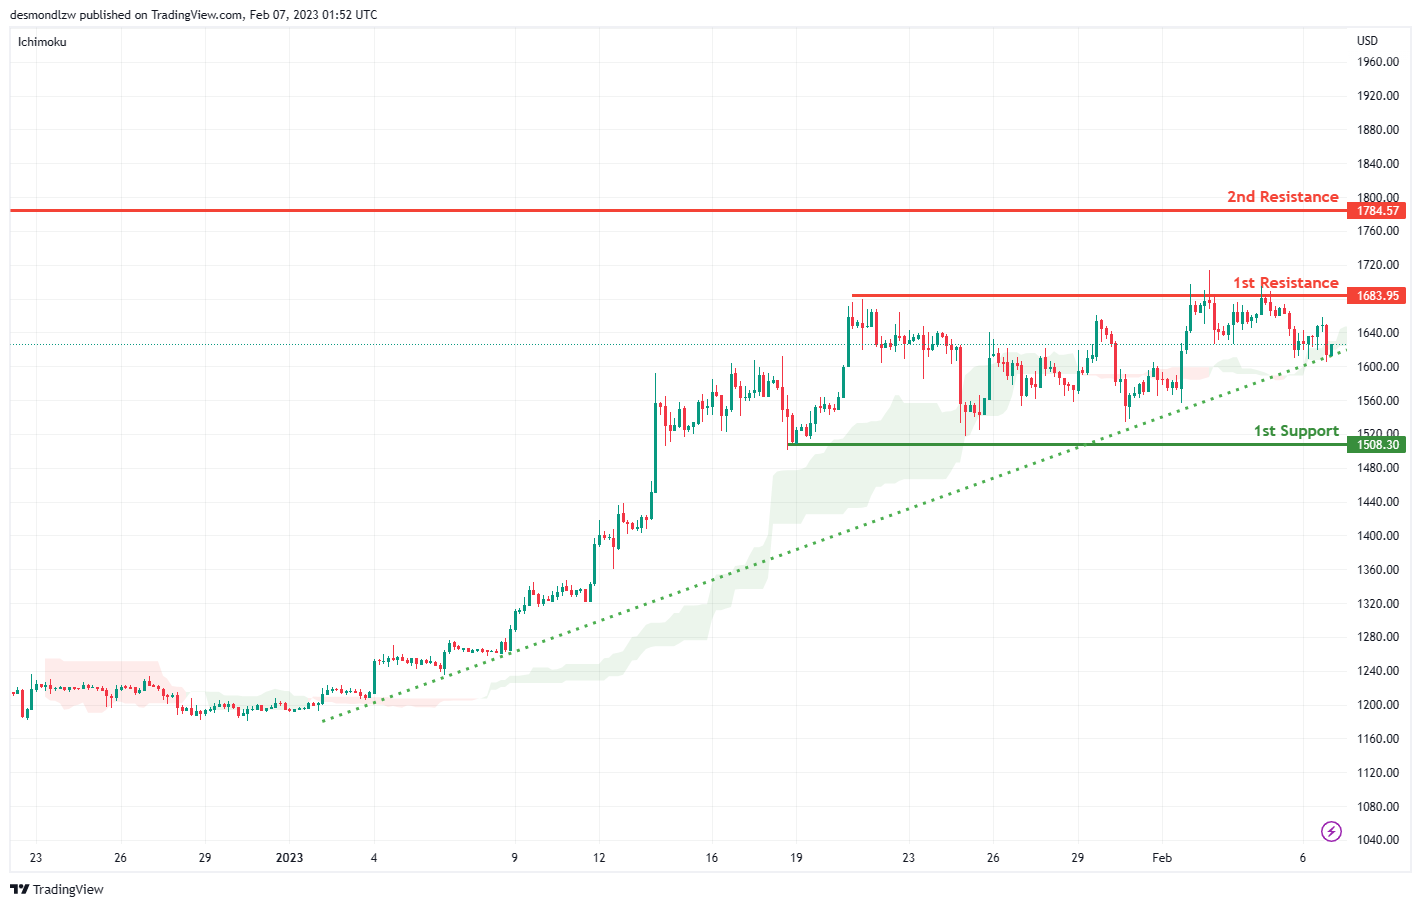
Looking at the H4 chart, my overall bias for ETHUSD is slightly bullish, the strong ascending trend line has been created. Expecting the price to break the 1st resistance line at 1683.95 which is the recent swing high, before it heads towards the 2nd resistance 1784.57.
In an alternate scenario, the price may go down to the 1st support at 1508.30 which is the recent swing low.
Areas of consideration:
- H4 time frame, 2nd resistance of 1784.57
- H4 time frame, 1st resistance of 1683.95
- H4 time frame, 1st support at 1508.30
BTCUSD:
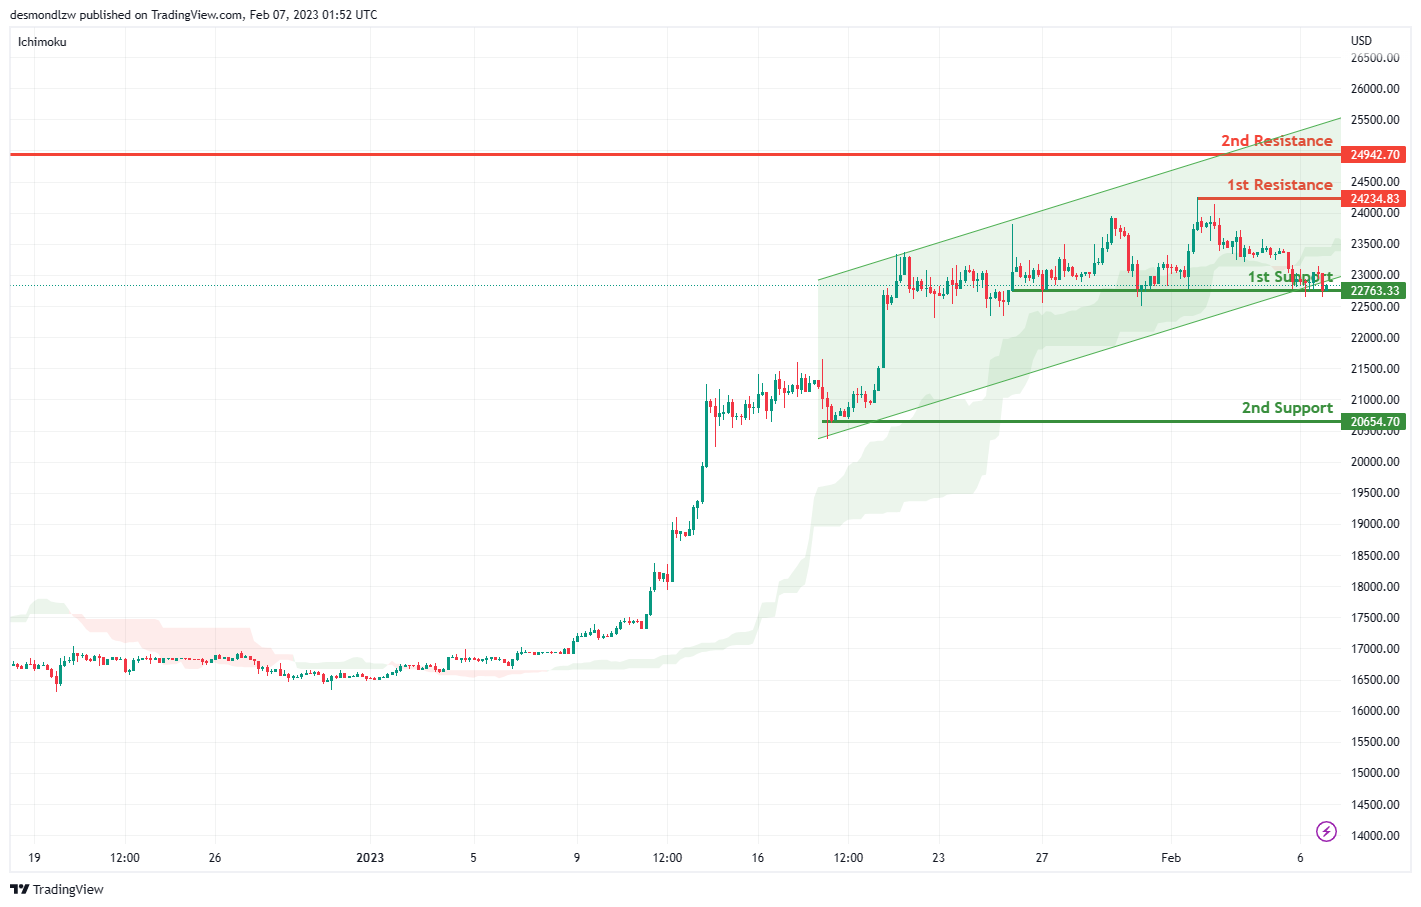
Looking at the H4 chart, my overall bias for BTCUSD is bullish. An ascending channel was created, expecting the price to break the 1st resistance line at 24234.83 which is the recent overlap resistance, before heading towards the 2nd resistance at 24942.70 which is the previous swing high.
In an alternative scenario, the price could possibly head down to the 1st support at 22763.33 which is the overlap support.
Areas of consideration:
- H4 time frame, 2nd resistance 24942.70
- H4 time frame, 1st resistance 24234.83
- H4 time frame, 1st support at 22763.33
S&P 500:
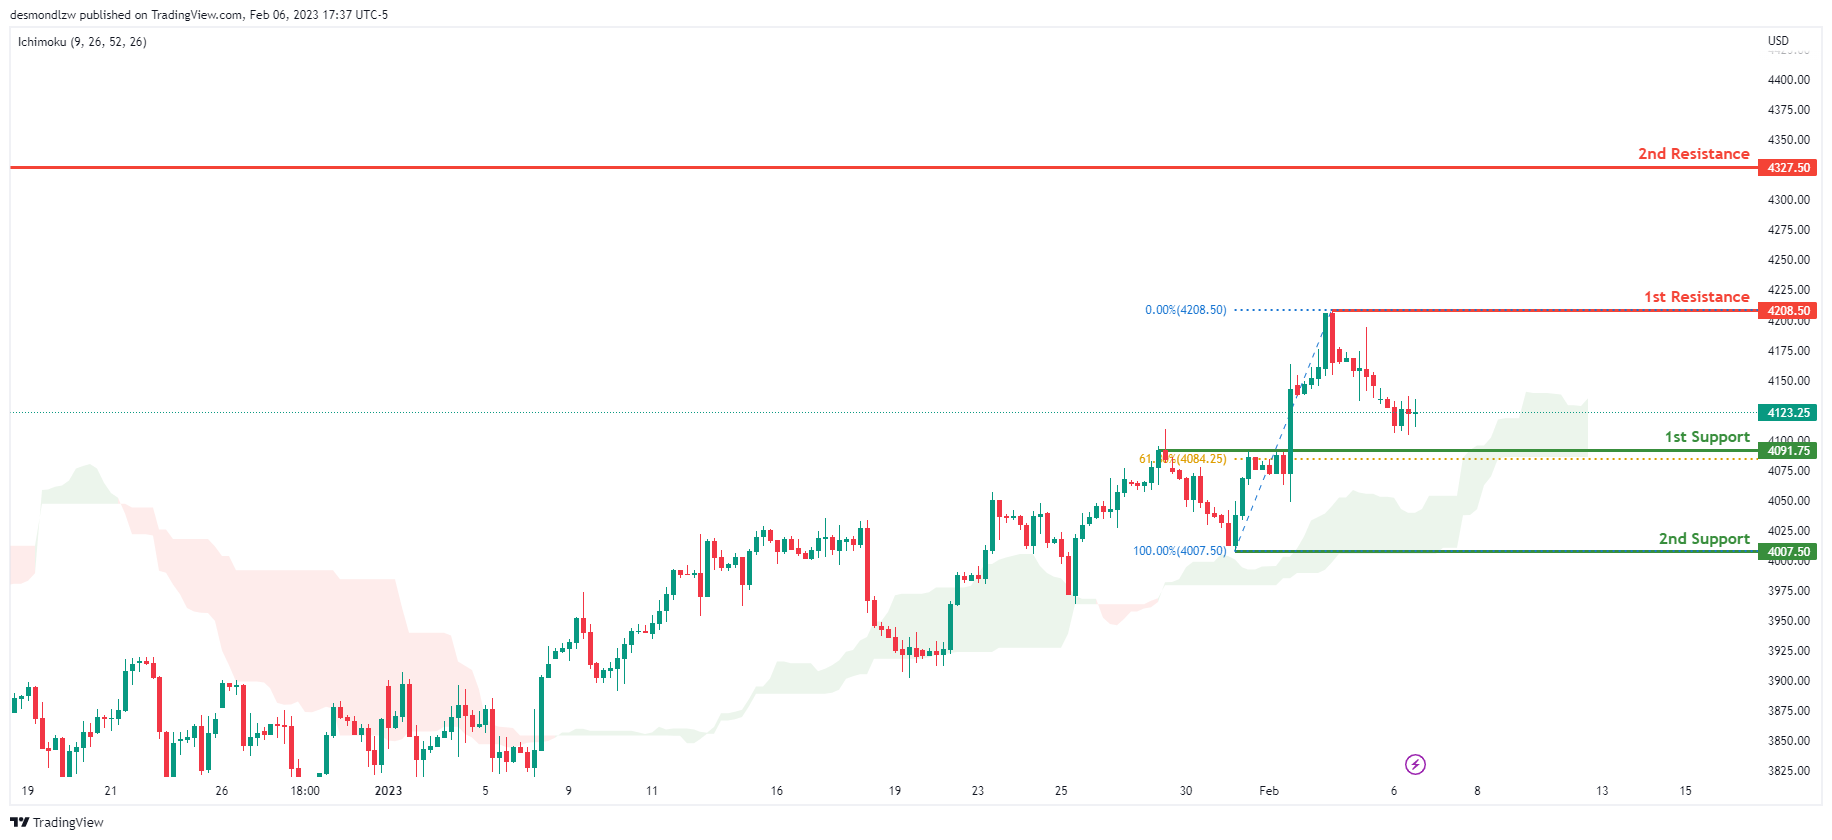
Looking at the H4 chart, my overall bias for S&P500 is bullish due to the current price being above the Ichimoku cloud, indicating a bullish market. If this bullish momentum continues, expect the price to possibly break the 1st resistance at 4208.50, where the recent swing high is, before heading towards the 2nd resistance at 4327.50 where the previous swing high is. In an alternative scenario, price could possibly head back down to retest the 1st support at 4091.75, where the 50% Fibonacci line is.
Areas of consideration:
- H4 time frame, 1st support at 4091.75
- H4 time frame, 1st resistance at 4208.50
- H4 time frame, 2nd resistance at 4327.50
GBP/USD Reverses Gains and Now At Risk of More Losses
Key Highlights
- GBP/USD declined sharply below the 1.2250 support.
- It traded below a major bullish trend line at 1.2370 on the 4-hours chart.
- EUR/USD extended its decline below the 1.0800 support.
- Gold price might decline further towards the $1,850 support.
GBP/USD Technical Analysis
The British Pound made a few attempts to clear the 1.2450 resistance against the US Dollar. However, GBP/USD failed and started a fresh decline below 1.2400.
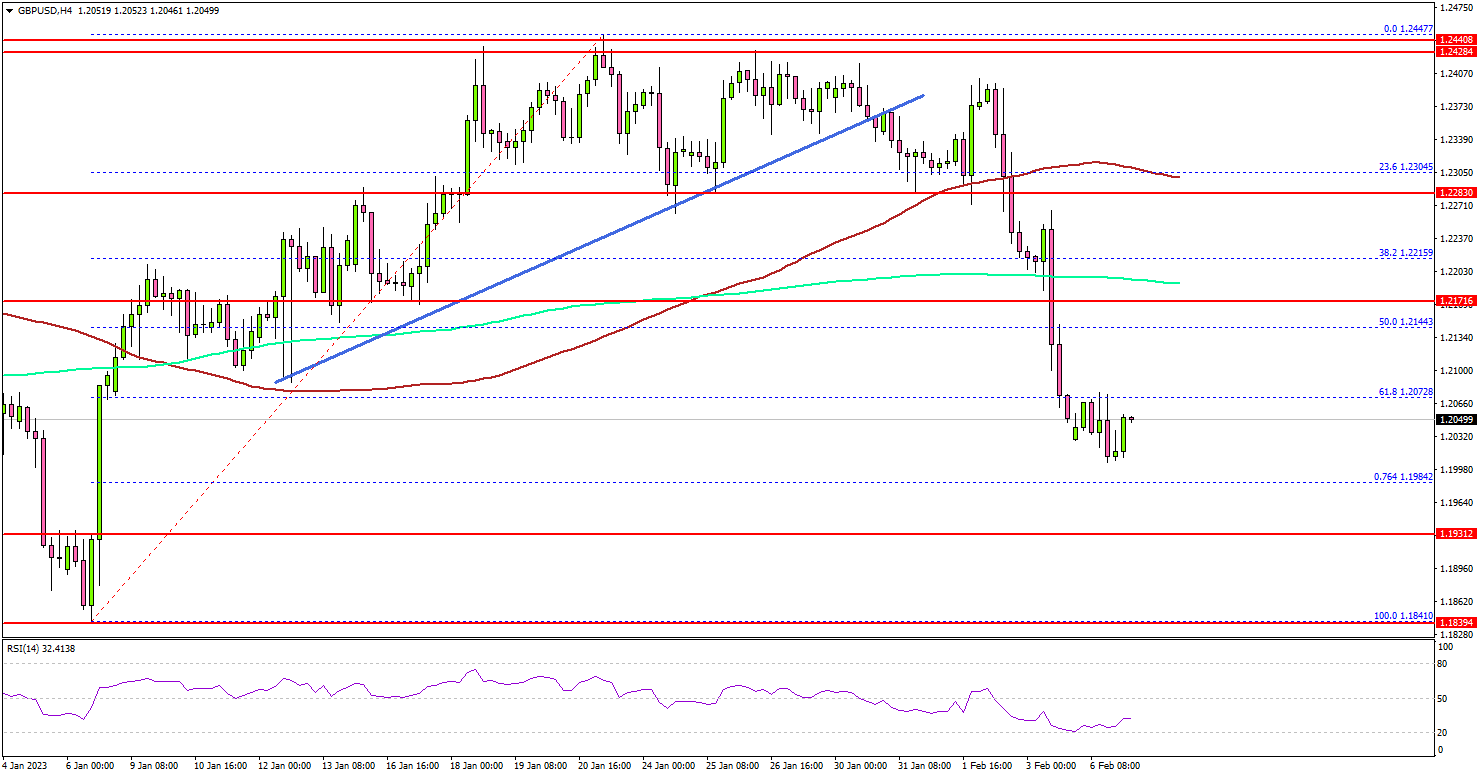
Looking at the 4-hours chart, the pair declined below the 1.2320 and 1.2250 support levels. There was break below a major bullish trend line at 1.2370. The pair even declined below the 61.8% Fib retracement level of the upward move from the 1.1841 swing low to 1.2447 high.
The pair settled below the 1.220 level, the 100 simple moving average (red, 4-hours), and the 200 simple moving average (green, 4-hours).
An immediate support is near the 1.2000 level or the 76.4% Fib retracement level of the upward move from the 1.1841 swing low to 1.2447 high. The next major support is near the 1.1850 zone or the last key swing low.
If there is a downside break, the pair could decline towards the 1.1750 level. On the upside, the pair is facing resistance near 1.2110.
The first major resistance is near the 1.2180 level and the 200 simple moving average (green, 4-hours). A clear move above the 1.2180 resistance might start a steady increase towards the 1.2250 resistance zone.
Any more gains could open the doors for a move towards the 1.2320 level. The next key hurdle is near 1.2450, above which the pair could climb towards the 1.2620 resistance zone.
Looking at gold price, the bears remained active and it seems like they might aim a move towards the $1,850 level in the near term.
Economic Releases
- US Goods and Services Trade Balance for Dec 2022 - Forecast $-68.5B, versus $-61.51B previous.
USDJPY Wave Analysis
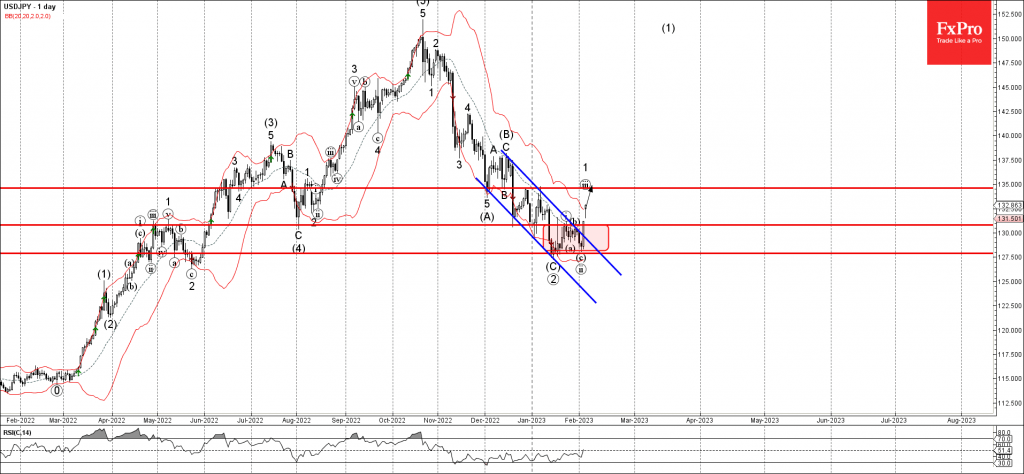
- USDJPY broke resistance level 130.80
- Likely to rise to resistance level 135.00
USDJPY recently broke sharply above the resistance level 130.80, which is the upper boundary of the sideways price range inside with the pair has been trading from January.
The breakout of this sideways price range was preceded by the breakout of the daily down channel from December – which accelerated the active impulse wave 1.
USDJPY can be expected to rise further toward the next resistance level 135.00 (target for the completion of the active impulse wave 1).
EURUSD Is “Suspended”
On Monday, the market major is neutral near 1.0800. The market has got all the info at hand: the decision of the Federal Reserve System to lift the interest rate by 25 base points and the confirmation of the ECB mood for it has lifted the rate by 50 base points.
The Fed will go on lifting the rate smoothly but is “mentally” preparing to put an end to the cycle. As for the ECB, it is decisive about lifting the rate until it gets inflation under control. As long as it lost quite a lot of time on monitoring the situation, things look quite logical.
The US employment market in January proved strong. The unemployment rate dropped to 3.4%, average wage grew by 0.3% m/m as expected. 517 thousand new workplaces were created by the NFP report, which is much more than forecast. The data taken together gave great support to the USD.
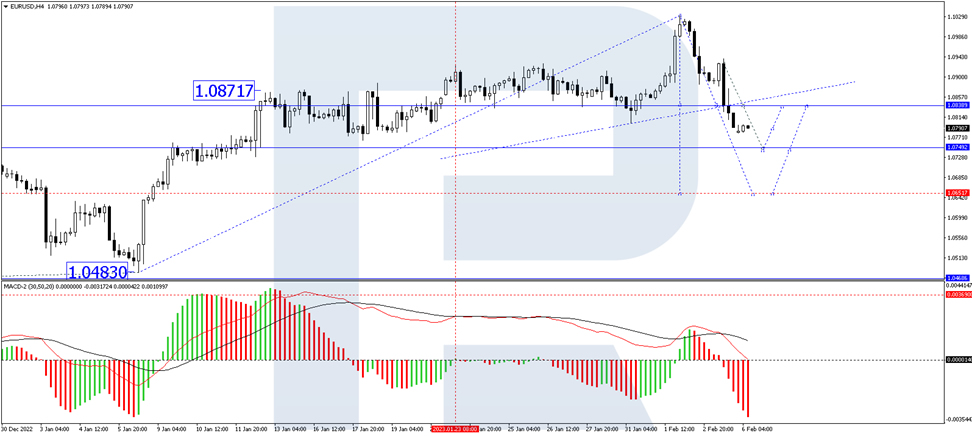
On H4, EURUSD has completed a wave of decline to 1.0840. Practically, this level has become a breakthrough for the ascending channel. At the moment, the market formed a consolidation range around this point, and with an escape downwards it opened a pathway for decline to 1.0750. After it is reached, a correction to 1.0840 should follow, and after that – a decline to 1.0650. Technically, this scenario is confirmed by the MACD. Its signal line is heading strictly downwards, getting ready to break through the zero level.
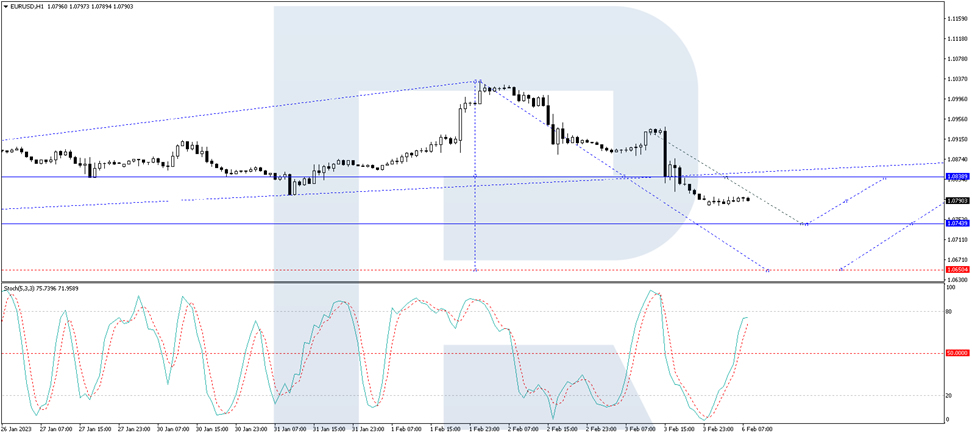
On H1, the pair has formed a structure of a consolidation range around 1.0840. With an escape downwards, a pathway for decline to 1.0750 will open. Then a correction up to 1.0840 and a decline to 1.0650 should follow. Technically, this scenario is confirmed by the Stochastic oscillator. Its signal line is above 50. A decline to 20 is expected.
Sunset Market Commentary
Markets
Last Friday’s stellar US payrolls (labour market even tighter than expected) and non-manufacturing ISM (US economy more resilient than feared) continue feeding into markets. Recall their dovish reaction to Fed (and ECB) meetings last week even if they were already disobeying central bank’s guidance. From Friday, they had to back down on those dovish bets. Fed fund futures now discount a policy rate peak of 5%-5.25% (in line with Fed dots) compared with 4.75%-5% ahead of the data. The December23 future now trades at 4.75% compared with 4.4%. US yields add another 6 bps (30-yr) to 12.3 bps (2-yr) today. This week is extremely thin from a data point of view. On Friday, we’ll get University of Michigan consumer confidence (February) and the annual CPI revisions when seasonal adjustment factors are recalculated to reflect price movements from the previous calendar year. They come on the heels of next Tuesday’s January US CPI figures which is the next big data point. We look out for comments by Fed governors and their interpretation of Friday’s figures. Tomorrow’s interview at the Economic Club of Washington of Fed Chair Powell is the key one. In light of recent events/market moves, we think markets will no longer snub any hawkish references or solely pick out the dovish twists as they during Wednesday’s Q&A. Look out for extra details for example financial conditions. German Bunds followed US Treasuries south. German yields add 5.6 bps (2-yr) to 10 bps (10-yr) with the belly of the curve underperforming the wings. UK Gilts are even more in sell-off mode with yields surging 14 bps (30-yr) to 22 bps (2-yr). The underperformance is linked to hawkish comments by BoE policy maker Mann. She vowed her colleagues to stay the course, in a reference to ECB Lagarde’s inflation fighting language: “The consequences of under tightening far outweigh the alternative. We need to stay the course and the next step is still more likely to be another hike than a cut or hold. A tighten-stop-tighten-loosen boogey looks too much like fine-tuning to be good monetary policy. It is both hard to communicate and to transmit through markets to the real economy.”
The sell-off on bonds markets spreads to stock markets again. Geopolitics add to the heavy picture (China – US over alleged spy balloon). Main European indices suffer losses to the tune of 1.5%. US benchmarks open a half percent lower. The dollar holds to Friday’s momentum. The trade-weighted greenback is testing support-turned-resistance at 103.45 (Dec22 low). EUR/USD is drifting from the 1.08 area to 1.0750. First support stands at 1.0735. Higher core bond yields and denied rumours that current deputy governor (and dove) Amaniya is in pole-position to succeed governor Kuroda from April, push USD/JPY above 132.50 despite the risk-off climate. Sterling gets some breathing room thanks to relative yield dynamics. EUR/GBP slides from 0.8960 to 0.8930. Less liquid currencies or EM FX face difficulties in today’s overall climate. EUR/SEK for example tested the 2020 top at 11.43, the weakest level for the Swedish krone apart from the 2009 SEK-bottom at EUR/SEK 11.79.
News & Views
Saudi Arabia raised oil prices for its main market of Asia and lifted prices for the US and Europe as well. The decision to increase its flagship Arab Light grade to $2 a barrel above the regional benchmark (Oman crude) came as a surprise given that crude prices have dropped about 7% this year so far. Many OPEC members have sounded optimistic about China and its reopening. The group’s secretary-general al-Ghais said consumption in the country has already been on the rise. But for commodity markets the (anticipated) growth slowdown in Europe and the US after interest rates increased sharply is an at least equally important factor. Oil prices do rise about 1.5% today. Brent oil is currently being sold at $81.2/barrel.
Spanish rents soared to record levels, with gains in the country’s two largest cities propelling prices. January rents in Barcelona rose a staggering 25% y/y while jumping 12% in Madrid, Idealista data showed today. It helped bring the national average to €11.6 per square meter. The phenomenon is the result of the historical tightening spree by the ECB. Increased financing costs pushes people away from home ownership to the rental markets, where supply is tight.
Possible Market Implications for Chinese Balloon
The big story over the weekend, at least as far as social media was concerned, was the Chinese balloon. The US claims it contained spy equipment, China says it was a weather balloon that went off course. The incident has plenty of political fodder, and has heightened tensions between Washington and Beijing. The first policy impact was US Secretary of State Blinken suspending a trip to China.
The incident has been both entertaining and worrying, depending on perceptions. But what does it mean for the markets? What can we trade here?
Is there more than just chips?
Even before the balloon was shot down, the issue of advanced semiconductors was already being discussed. Recently, the US, the Netherlands and Japan agreed on new restrictions on supplying technology to manufacture advanced semiconductors to China. Presumably, a spy balloon would need a substantial amount of chips to gather, process and retransmit information.
The main reason given for shooting down the balloon was to retrieve the payload. The analysis of the contents could reveal what kind of chips were used, and if they were supplied by the US or allies. The potential consequences imply another round of export curbs, particularly relating to advanced chips, on China. This is already an issue of growing tension between Taiwan, the US and China, since Taiwan is the world's pre-eminent manufacturer of advanced semiconductors, which in many cases are used by the US' defense mechanisms. (The Sidewinder missile used to take out the balloon likely had guidance chips manufactured in Taiwan).
Isolated incident or escalation?
China claims that it's a meteorological balloon that drifted off course. There have been reports of other balloons entering Latin American airspace, as well. Taiwan had previously reported similar balloons traversing its airspace, suggesting they were military meteorological balloons. China contends that it's a civilian balloon.
Both the US and China have announced they have "reserve the right" to take actions in response to what both are calling violations of international norms. However, beyond suspending a diplomatic trip, neither country has taken more concrete measures. With the balloon already shot down, internal US politics could overshadow the entire incident.
Possible next steps
The increased tensions between the world's two largest economies could contribute to some risk aversion in the near term. Particularly in the context of major central banks having just raised rates a few days ago.
Beyond that, the question is what happens if or when the payload is analyzed. The balloon was shot down over US territorial waters, and the debris are in relatively shallow waters that should allow at least some of the components to be recovered. However, analysis could take several months, meaning the incident could be revived in the future depending on what kind of components are found.
With global growth uncertain as China reopens from covid, potential of further export curbs could hurt risk appetite. Beyond that, the incident could end up being much more consequential to social media than to the currency markets.
Fourth-Quarter GDP Print to Ease Sterling Problems?
Last week was dominated by the US, particularly the impressive data releases on Friday. Other regions could steal the limelight this week, particularly the UK where developments across the board are not encouraging. Friday’s fourth-quarter GDP figure could potentially offer some respite, but will this be enough for sterling to recover some of its recent losses?
UK issues remain unsolved
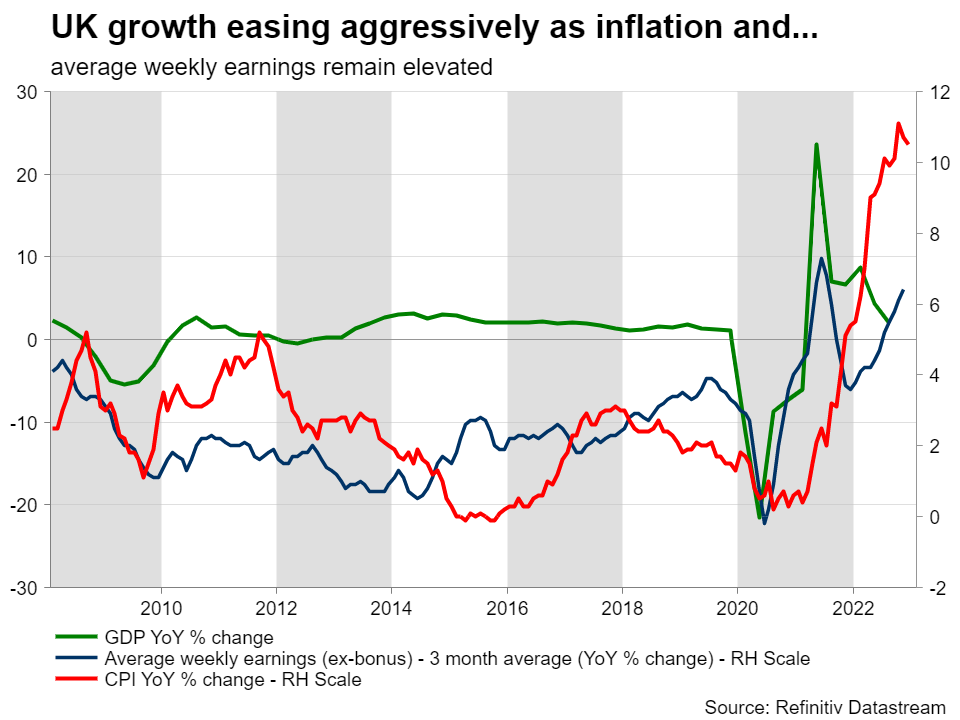
The UK continues to be seen as the problematic child of Europe. It remains a laggard among developed countries in terms of output recovery since the breakout of the COVID pandemic and it is currently facing the strongest and most stubborn inflationary pressures. The various rate hikes by the Bank of England have yet to slow the inflation momentum suggesting that: 1) the BoE has not been aggressive enough in the current hiking cycle, fearing it will cause a recession, and 2) the impact from Brexit is complicating the economy’s reaction to the higher price of money. The BoE is tasked to solve the hardest puzzle among the key central banks, and it cannot rely on any help from the fiscal side of the equation. The UK government under PM Sunak has set priorities that include halving inflation, reducing debt and growing the economy. These intentions appear sensible, but Sunak remains hamstrung by the Conservative party backbenchers, a powerful portion of the government’s members of parliament that have essentially ousted the previous two prime ministers. If we add the fact that the opinion polls show a significant lead of the opposition Labour party, it looks like the current government has a mountain to climb to return the country to solid economic ground. Inevitably, this fluid political environment is not inspiring confidence in the UK economy, as seen at the recent performance by sterling.
Key piece of data on Friday
On Friday morning the ONS will publish the preliminary GDP figure for the fourth quarter of 2022. The Reuters poll points to 0% quarter-on-quarter growth with the year-on-year figure dropping to just +0.4%. Confirmation of these forecasts would not bring a smile to sterling fans, but could instead offer some consolation that the pessimistic expectations of a technical recession do not appear to have materialized. Having said that, the outlook is not encouraging. The recent IMF forecasts showed the UK is forecast to be the only advanced key economy contracting in 2023. In this context, on Thursday morning we have the usual visit of BoE Governor Bailey et al at the Treasury Select Committee. Provided that the participating members of parliaments do not feel the need to ask tougher questions on the Bank’s perceived inability to tackle inflation, the message from the oral testimonies is unlikely to be much different from last Thursday’s press conference.
The housing sector is another worry for sterling fans
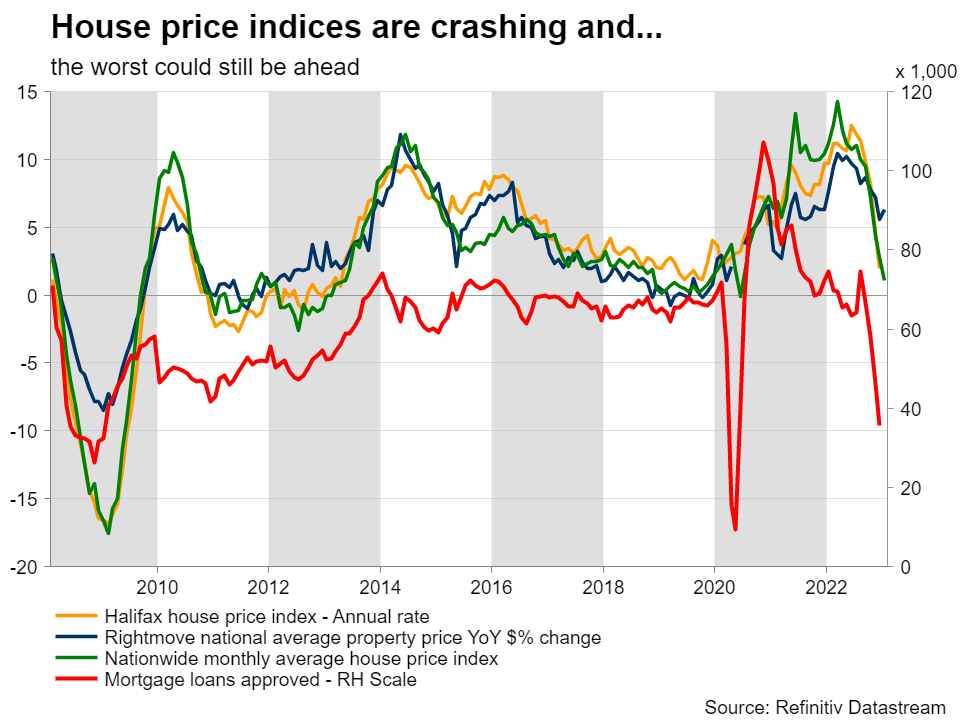
The January Halifax house price index will be published on Tuesday. The housing sector is especially crucial for the UK economy as property wealth is almost 30% of the total household wealth. The overall negative economic sentiment along with the numerous interest rate hikes by the BoE have put the sector under significant pressure. This is pretty evident by the various indicators measuring price changes. However, the short-term outlook is seen as even more negative due to the recent crash in mortgage approvals. The December print dropped to levels seen during the COVID pandemic breakout in 2020 and amidst the 2007-09 economic crisis.
First taste of January retail sales
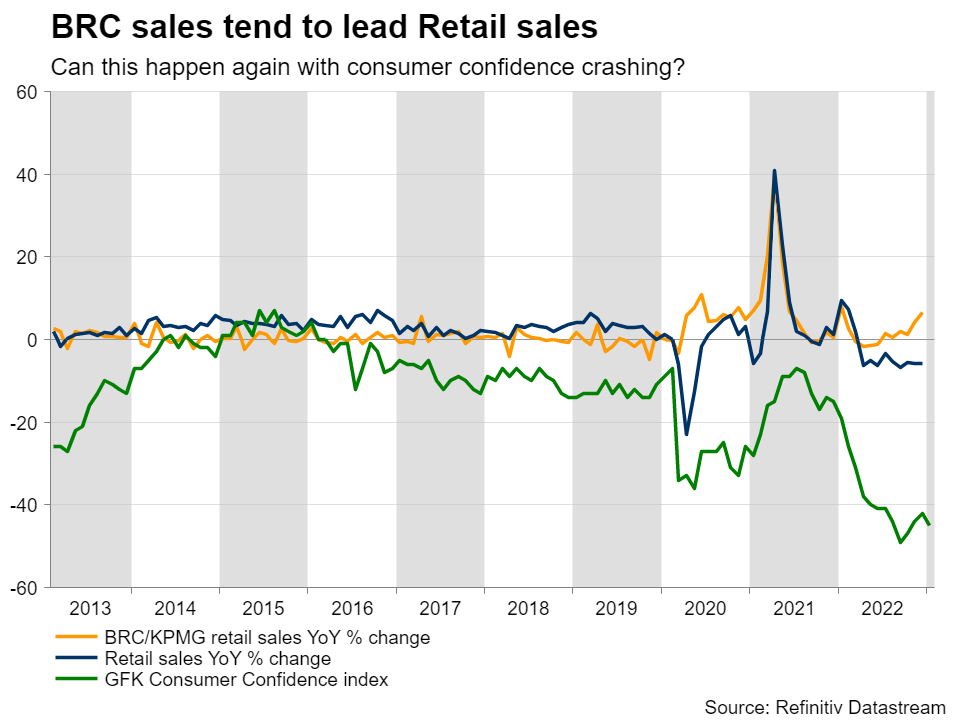
Additionally, on Tuesday morning we will get the first real data of consumers’ behaviour in the post-Christmas period as the January BRC retail sales figures will be released. The December year-on-year print showed a promising 6.5% increase, but we have yet to see this figure translating into a similar change in the overall retail sales data. A gap between these two data series has been developing since April 2022. A similar situation was seen during the first part of the COVID pandemic, with retail sales growth eventually recovering aggressively to match the BRC prints in the later part of 2022. However, it could be a while before we see a similar recovery this time as consumer confidence, depicted below using the GfK Consumer confidence index, is close to record lows.
Sterling fans under severe pressure
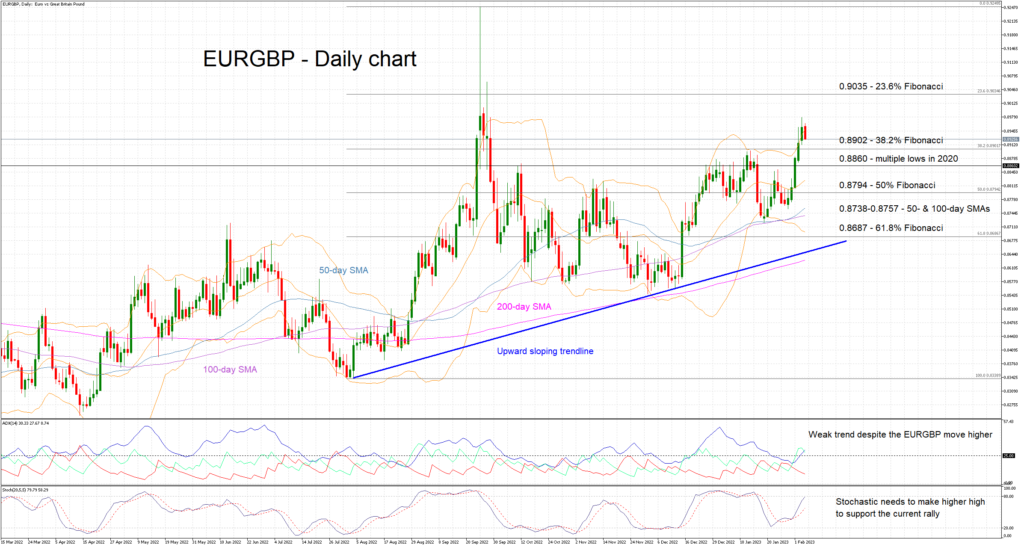
It has been 11 months since EURGBP touched 0.8200, the lowest level since June 2016, but it probably feels like ages for sterling followers. The continued underperformance of sterling against the euro currency has pushed the pair to the 0.8950 area, testing the September 2022 highs. The latest upward move has been somewhat aggressive, but mostly justified by the momentum indicators. However, there seem to be signs of rally exhaustion developing, which could dent the sterling bears’ appetite at this juncture. A drop towards the 0.8860 would be welcomed by the sterling bulls, but a move closer to the 0.8720 area looks to be more important as it could potentially result in a short-term trend reversal.
USDJPY Jumps Above a Downtrend Line
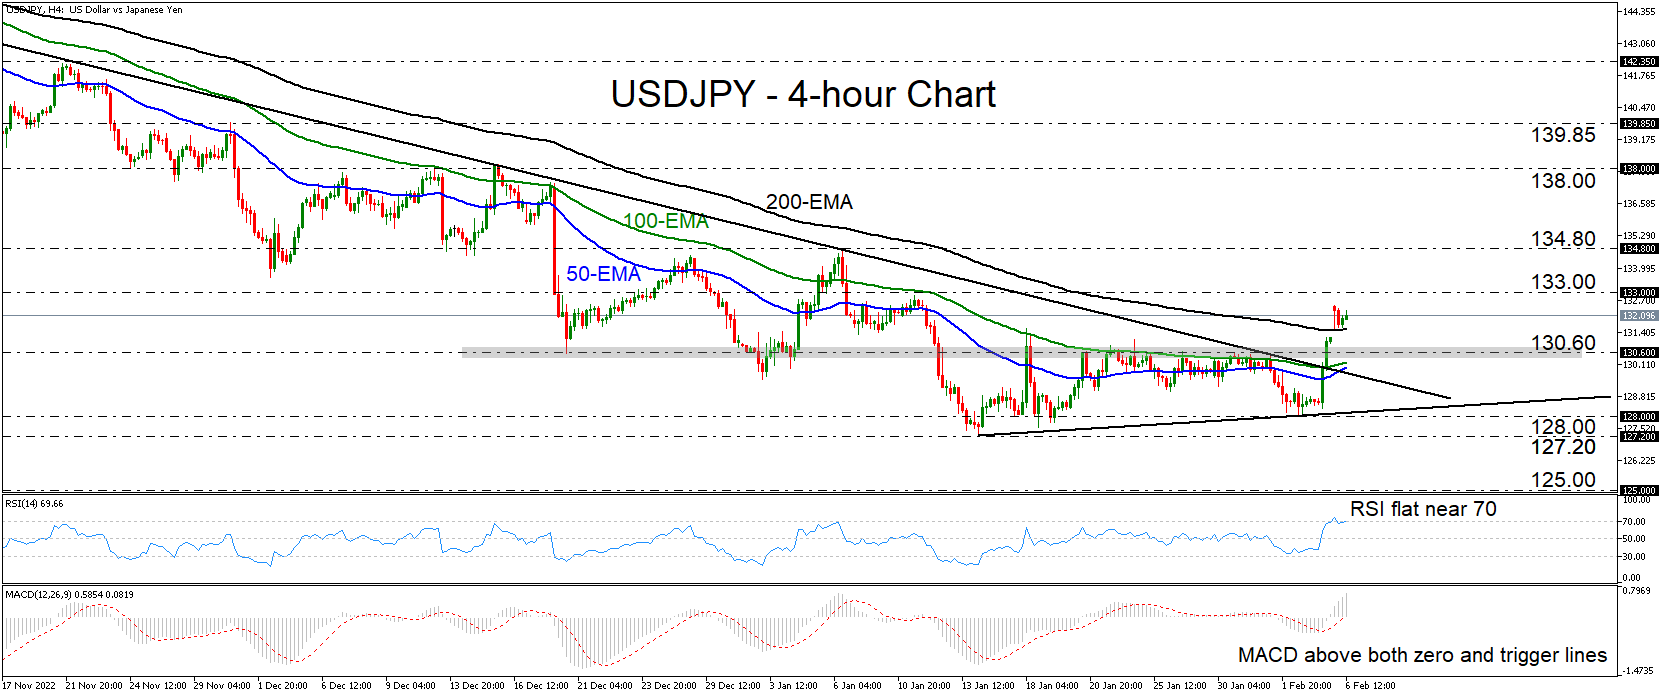
USDJPY shot up on Friday following the robust US employment report and opened with a positive gap today. The rally took the pair above the downtrend line drawn from the high of November 21, as well as above the key resistance (now turned into support) zone of 130.60. On top of that, today, the pair is trading above the 200-EMA, which adds credence to a short-term reversal case.
The RSI has flattened near 70, while the MACD, although well above both its zero and trigger lines, shows signs of slowing down. These signs suggest that due to the overstretched rally, a small pullback could occur before the next leg north.
The bulls could recharge from near the 130.60 zone and push for a test at the 133.00 territory, defined as resistance by the high of January 11. If they are not willing to stop there, then they may extend their march towards the next key territory of 134.80, marked by the peak of 134.80. That zone provided support as well back on December 13 and 14.
For the outlook to turn bearish again, USDJPY may need to dive below the 127.20 barrier, marked by the low of January 16. This may validate the break below an upside line drawn from that low, but most importantly, it will confirm a lower low on bigger timeframes. The next stop could be at 125.00, marked by the low of April 14, 2022, and the inside swing high of March 28, 2022.
Wrapping everything up, USDJPY surged on Friday, breaking above the key zone of 130.60. This likely signals a short-term bullish reversal and increases the case for higher resistance zones to be tested soon.