Sample Category Title
GBP/JPY Daily Outlook
Daily Pivots: (S1) 157.00; (P) 157.87; (R1) 159.02; More...
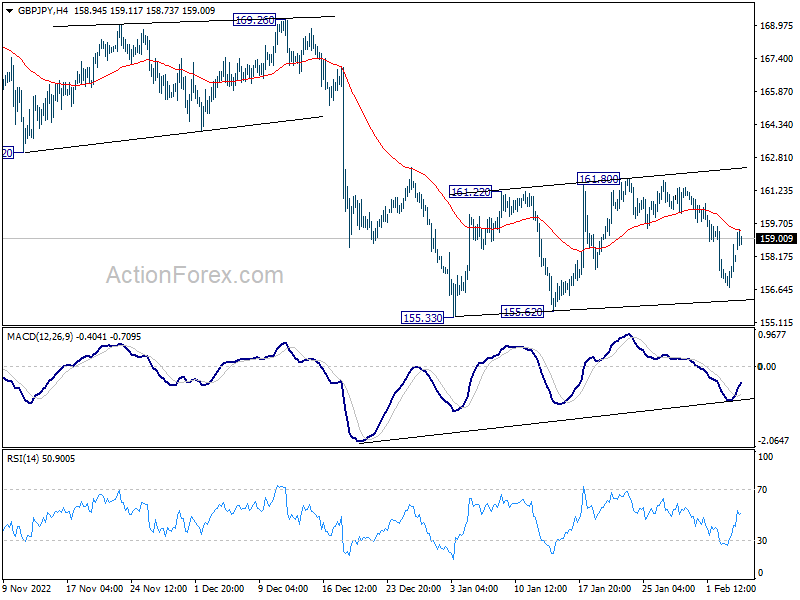
Intraday bias in GBP/JPY remains neutral as range trading continues. On the downside, break of 155.33 low will resume the fall form 172.11 to 153.70 fibonacci level next. On the upside, sustained trading above 55 day EMA (now at 161.42) will turn bias to the upside, for stronger rise back to 169.26/172.11 resistance zone.
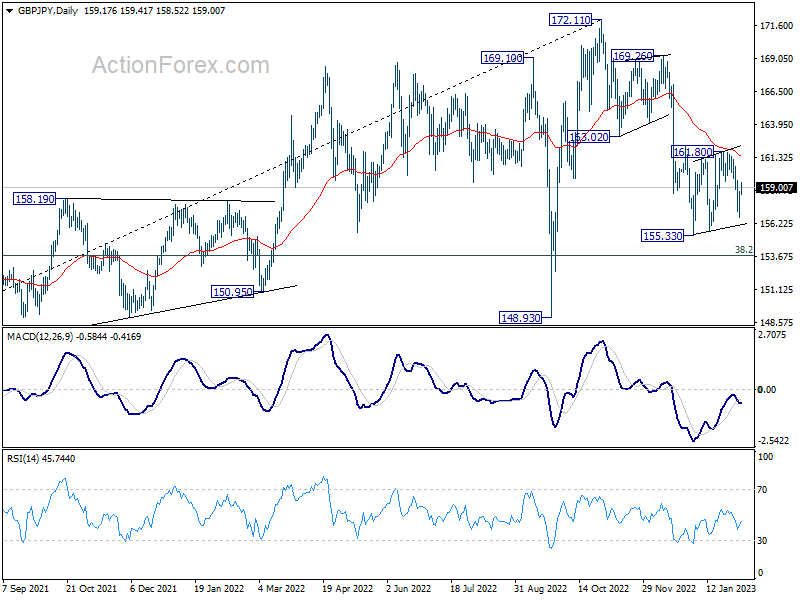
In the bigger picture, as long as 163.02 support turned resistance holds, decline from 172.11 medium term top is expected to continue to 38.2% retracement of 123.94 to 172.11 at 153.70. Sustained break there will raise the change of trend reversal and target 61.8% retracement at 142.34. Nevertheless, break of 163.02 support turned resistance will argue that the decline has completed, and retain medium term bullishness.
EUR/JPY Daily Outlook
Daily Pivots: (S1) 140.23; (P) 141.29; (R1) 142.65; More....
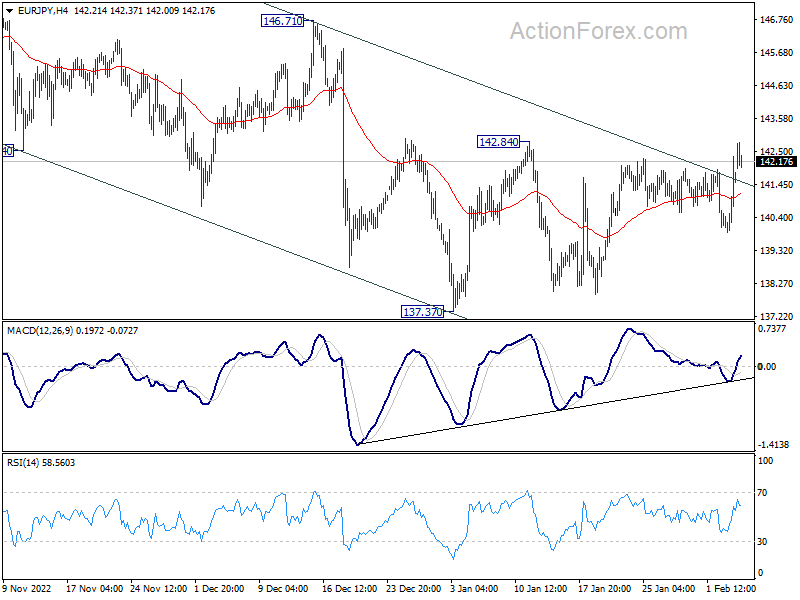
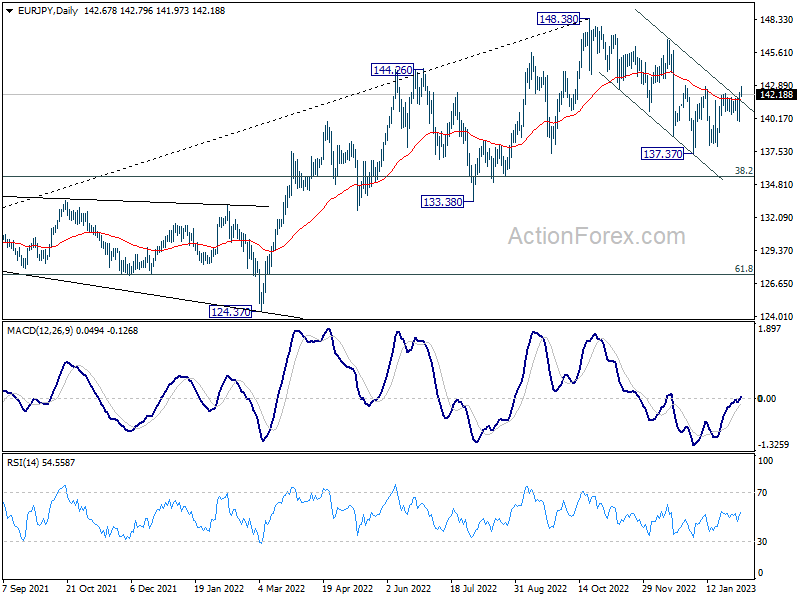
Intraday bias in EUR/JPY remains neutral with immediate focus on 142.84 resistance. Decisive break there will argue that the correction from 148.38 has completed at 137.37 already. Further rise would be seen to 146.71 resistance next. On the downside, firm break of 155.33 will resume the whole decline from 148.38 to 135.40 fibonacci level.
In the bigger picture, as long as 55 week EMA (now at 138.82) holds, larger up trend from 114.42 (2020 low) is still in progress for 149.76 long term resistance. However, firm break of 55 week EMA will bring deeper fall to 38.2% retracement of 114.42 to 148.38 at 135.40. Sustained break there will raise the chance of trend reversal, and target 61.8% retracement at 127.39.
EUR/GBP Daily Outlook
Daily Pivots: (S1) 0.8920; (P) 0.8949; (R1) 0.8986; More...
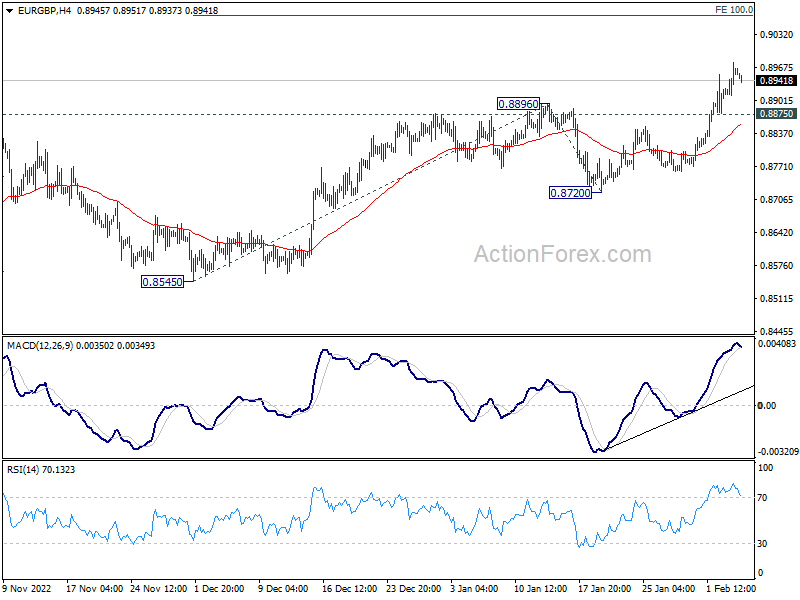
EUR/GBP's rally is still in progress and intraday bias stays on the upside. Next target is 100% projection of 61.8% projection of 0.8545 to 0.8896 from 0.8720 at 0.9071. On the downside, below 0.8875 minor support will turn intraday bias neutral first. But outlook will stay bullish as long as 0.8720 support holds.
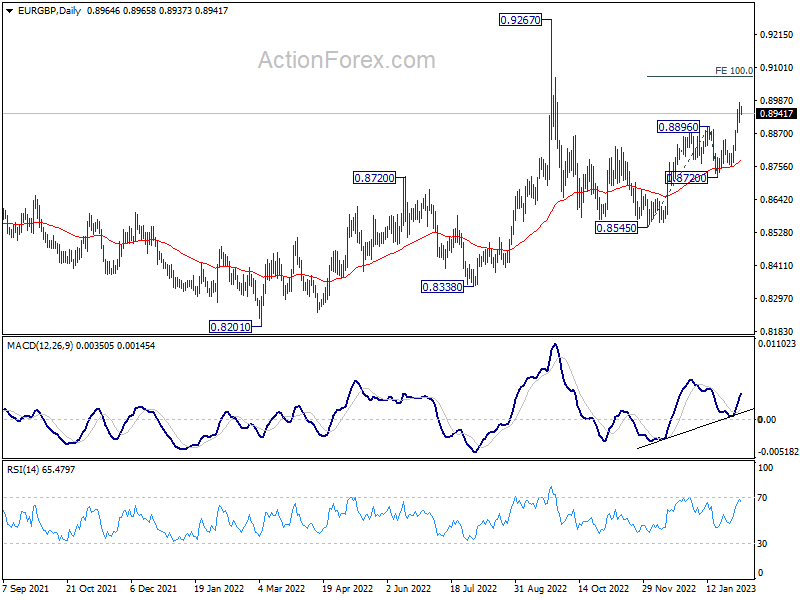
In the bigger picture, the notable support from 55 day EMA (now at 0.8780) retains near term bullishness. Break of 0.8896 should target 0.9267 (2022 high) and possibly above, to resume whole up trend from 0.8201 (2022 low). However, break of 0.8270 support and sustained trading below 55 day EMA will set the stage for 0.8545 and below.
EUR/AUD Daily Outlook
Daily Pivots: (S1) 1.5464; (P) 1.5534; (R1) 1.5665; More...
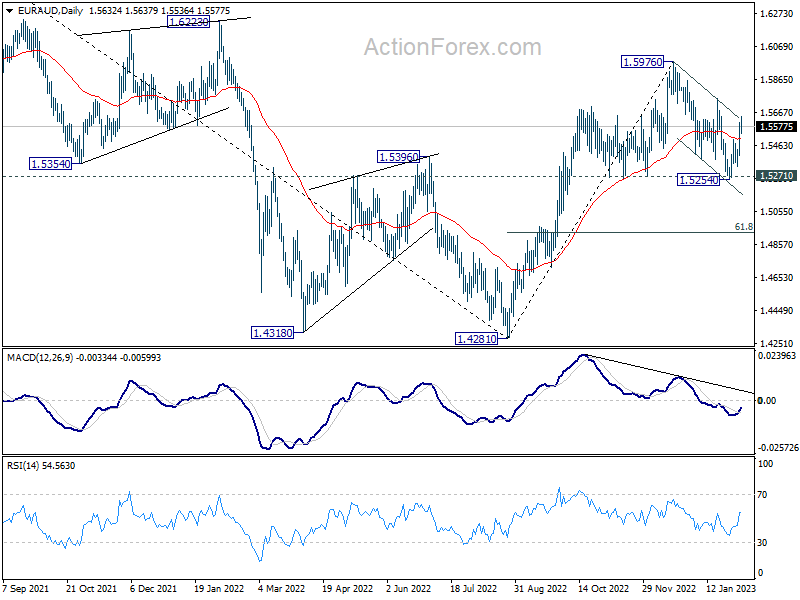
As EUR/AUD's rebound from 1.5254 extends, intraday bias in back on the upside for 1.5749 resistance. Decisive break there will confirm that correction from 1.5976 has completed with three waves down, after drawing support from 1.5271. Further rally would be seen back to retest 1.5976 high. On the downside, break of 4 hour 55 EMA (now 1.5441) will turn bias back to the downside for retesting 1.5254 instead.
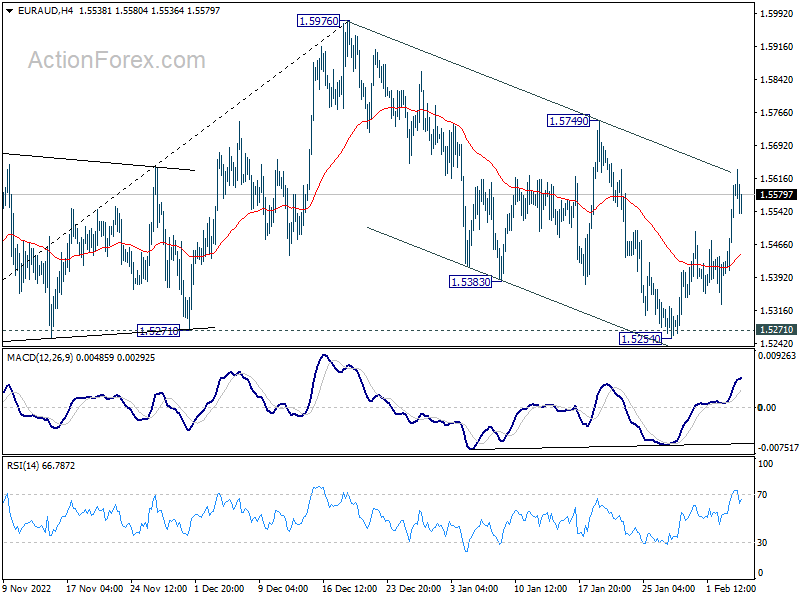
In the bigger picture, it's still early to confirm if rise from 1.4281 represents bullish trend reversal. But as long as 1.5271 support holds, such rally is in favor to continue. Break of 1.5976 will target 1.6434 key resistance next. On the other hand, firm break of 1.5271 will retain medium term bearishness instead.
EUR/CHF Daily Outlook
Daily Pivots: (S1) 0.9956; (P) 0.9994; (R1) 1.0034; More....
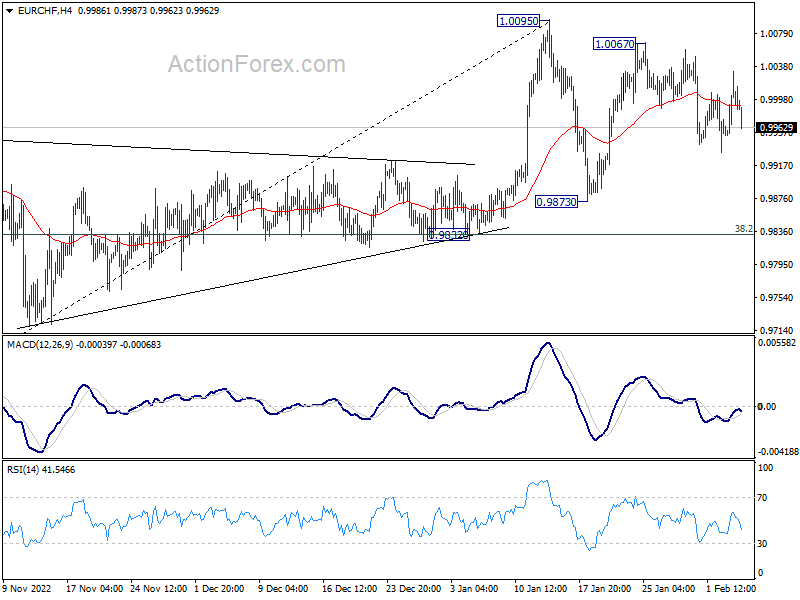
Intraday bias in EUR/CHF remains neutral for the moment. Consolidation from 1.0095 would extend further, and deeper fall to 0.9873 cannot be ruled out. But downside should be contained by 38.2% retracement of 0.9407 to 1.0095 at 0.9832 to bring rebound. For now, risk will stay on the downside as long as 1.0067 resistance holds, in case of recovery.
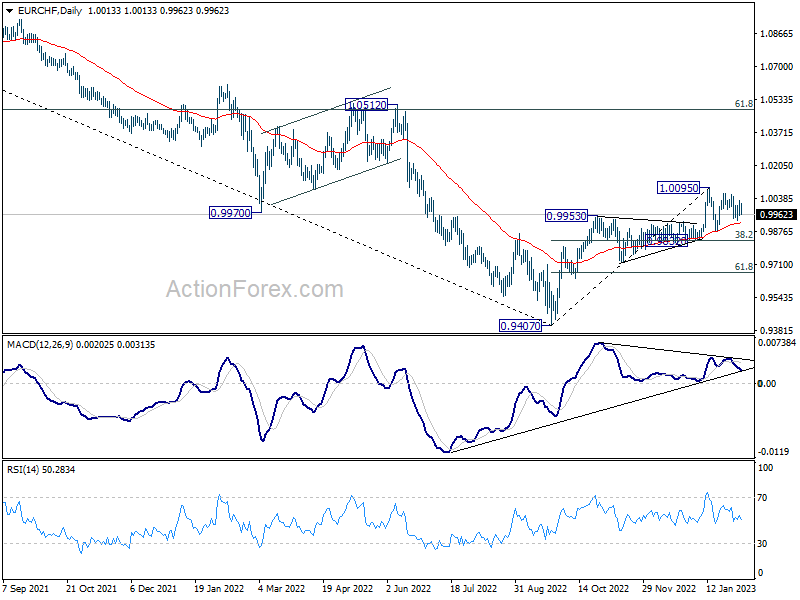
In the bigger picture, the initial rejection by 55 week EMA (now at 1.0039) mixed up the outlook. On the upside, sustained trading above 55 week EMA will raise the chance of bullish trend reversal. Rise from 0.9407 should then target 1.0505 cluster resistance (2020 low at 1.0505, 61.8% retracement of 1.1149 to 0.9407 at 1.1484). However, firm break of 0.9832 support will revive medium term bearishness and bring retest of 0.9407 low instead.
ECB Holzmann: Monetary policy must continue to show its teeth
ECB Governing Council member Robert Holzmann said in a conference, "the risk of over-tightening seems dwarfed by the risk of doing too little."
"Monetary policy must continue to show its teeth until we see a credible convergence to our inflation target," he added.
Holzmann also hailed that the central bank's timely tightening helped keep inflation expectation anchored, but people were still feeling the impact. "Ultimately, the losses we as euro-area policymakers incur by consistently missing our inflation target come at our own peril."
Gold Recoups Come Losses After Strong Sell-off
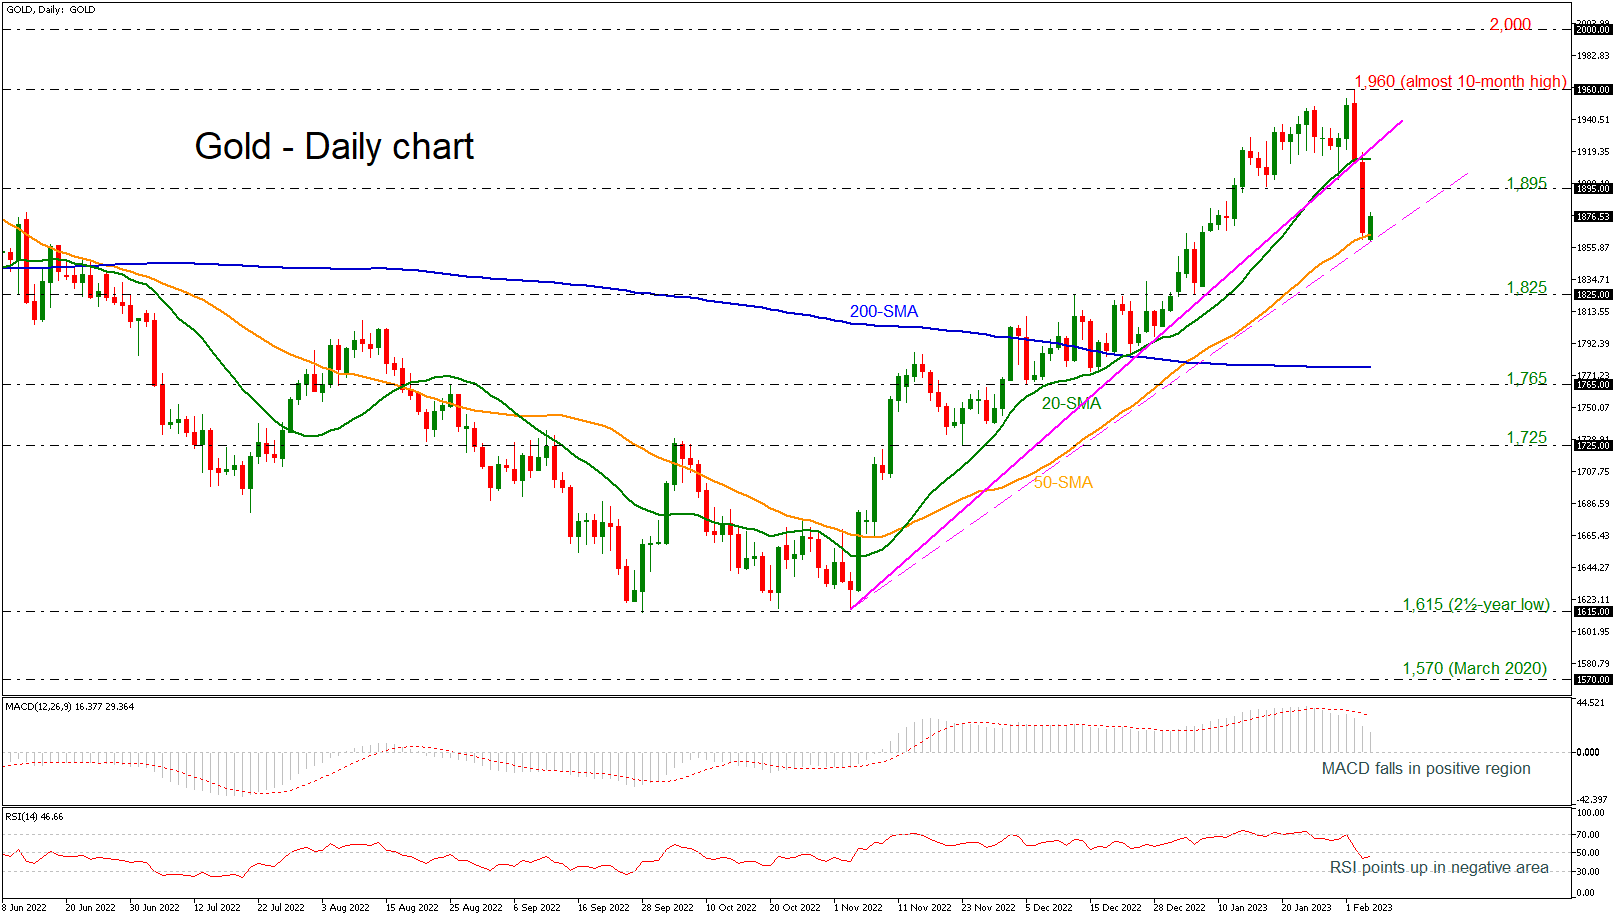
Gold prices experienced a steep bearish move in the preceding week, losing more than 5% from the recent ten-month top of 1,960 and breaking the uptrend line to the downside. The price found a support level near the 50-day simple moving average (SMA) at 1,864, failing to continue the bearish move. The RSI is picking up speed near 50; however, the MACD continues to distance itself below its red signal line.
A reversal to the downside could stall at the 1,825 barrier, before challenging the crucial 200-day SMA at 1,765. Further below, the 1,725 region could also provide support, triggering another sell-off in the longer-term timeframe.
Otherwise, a successful rebound off the 50-day SMA could open the way towards the inside swing peak of 1,895 ahead of the 20-day SMA at 1,914. Higher still, the almost ten-month zenith of 1,960 would increasingly come into scope; not far above this point lies the 2,000 round number as well, shifting the outlook to a more bullish one.
The medium-term picture continues to look predominantly bullish, with trading activity taking place above both the 50- and 200-day SMAs.
Overall, the short-term outlook appears mostly bearish, but the medium-term one remains bullish for the most part.
USD/CHF: Skewed Triangle is Completed – A Good Signal for Sales
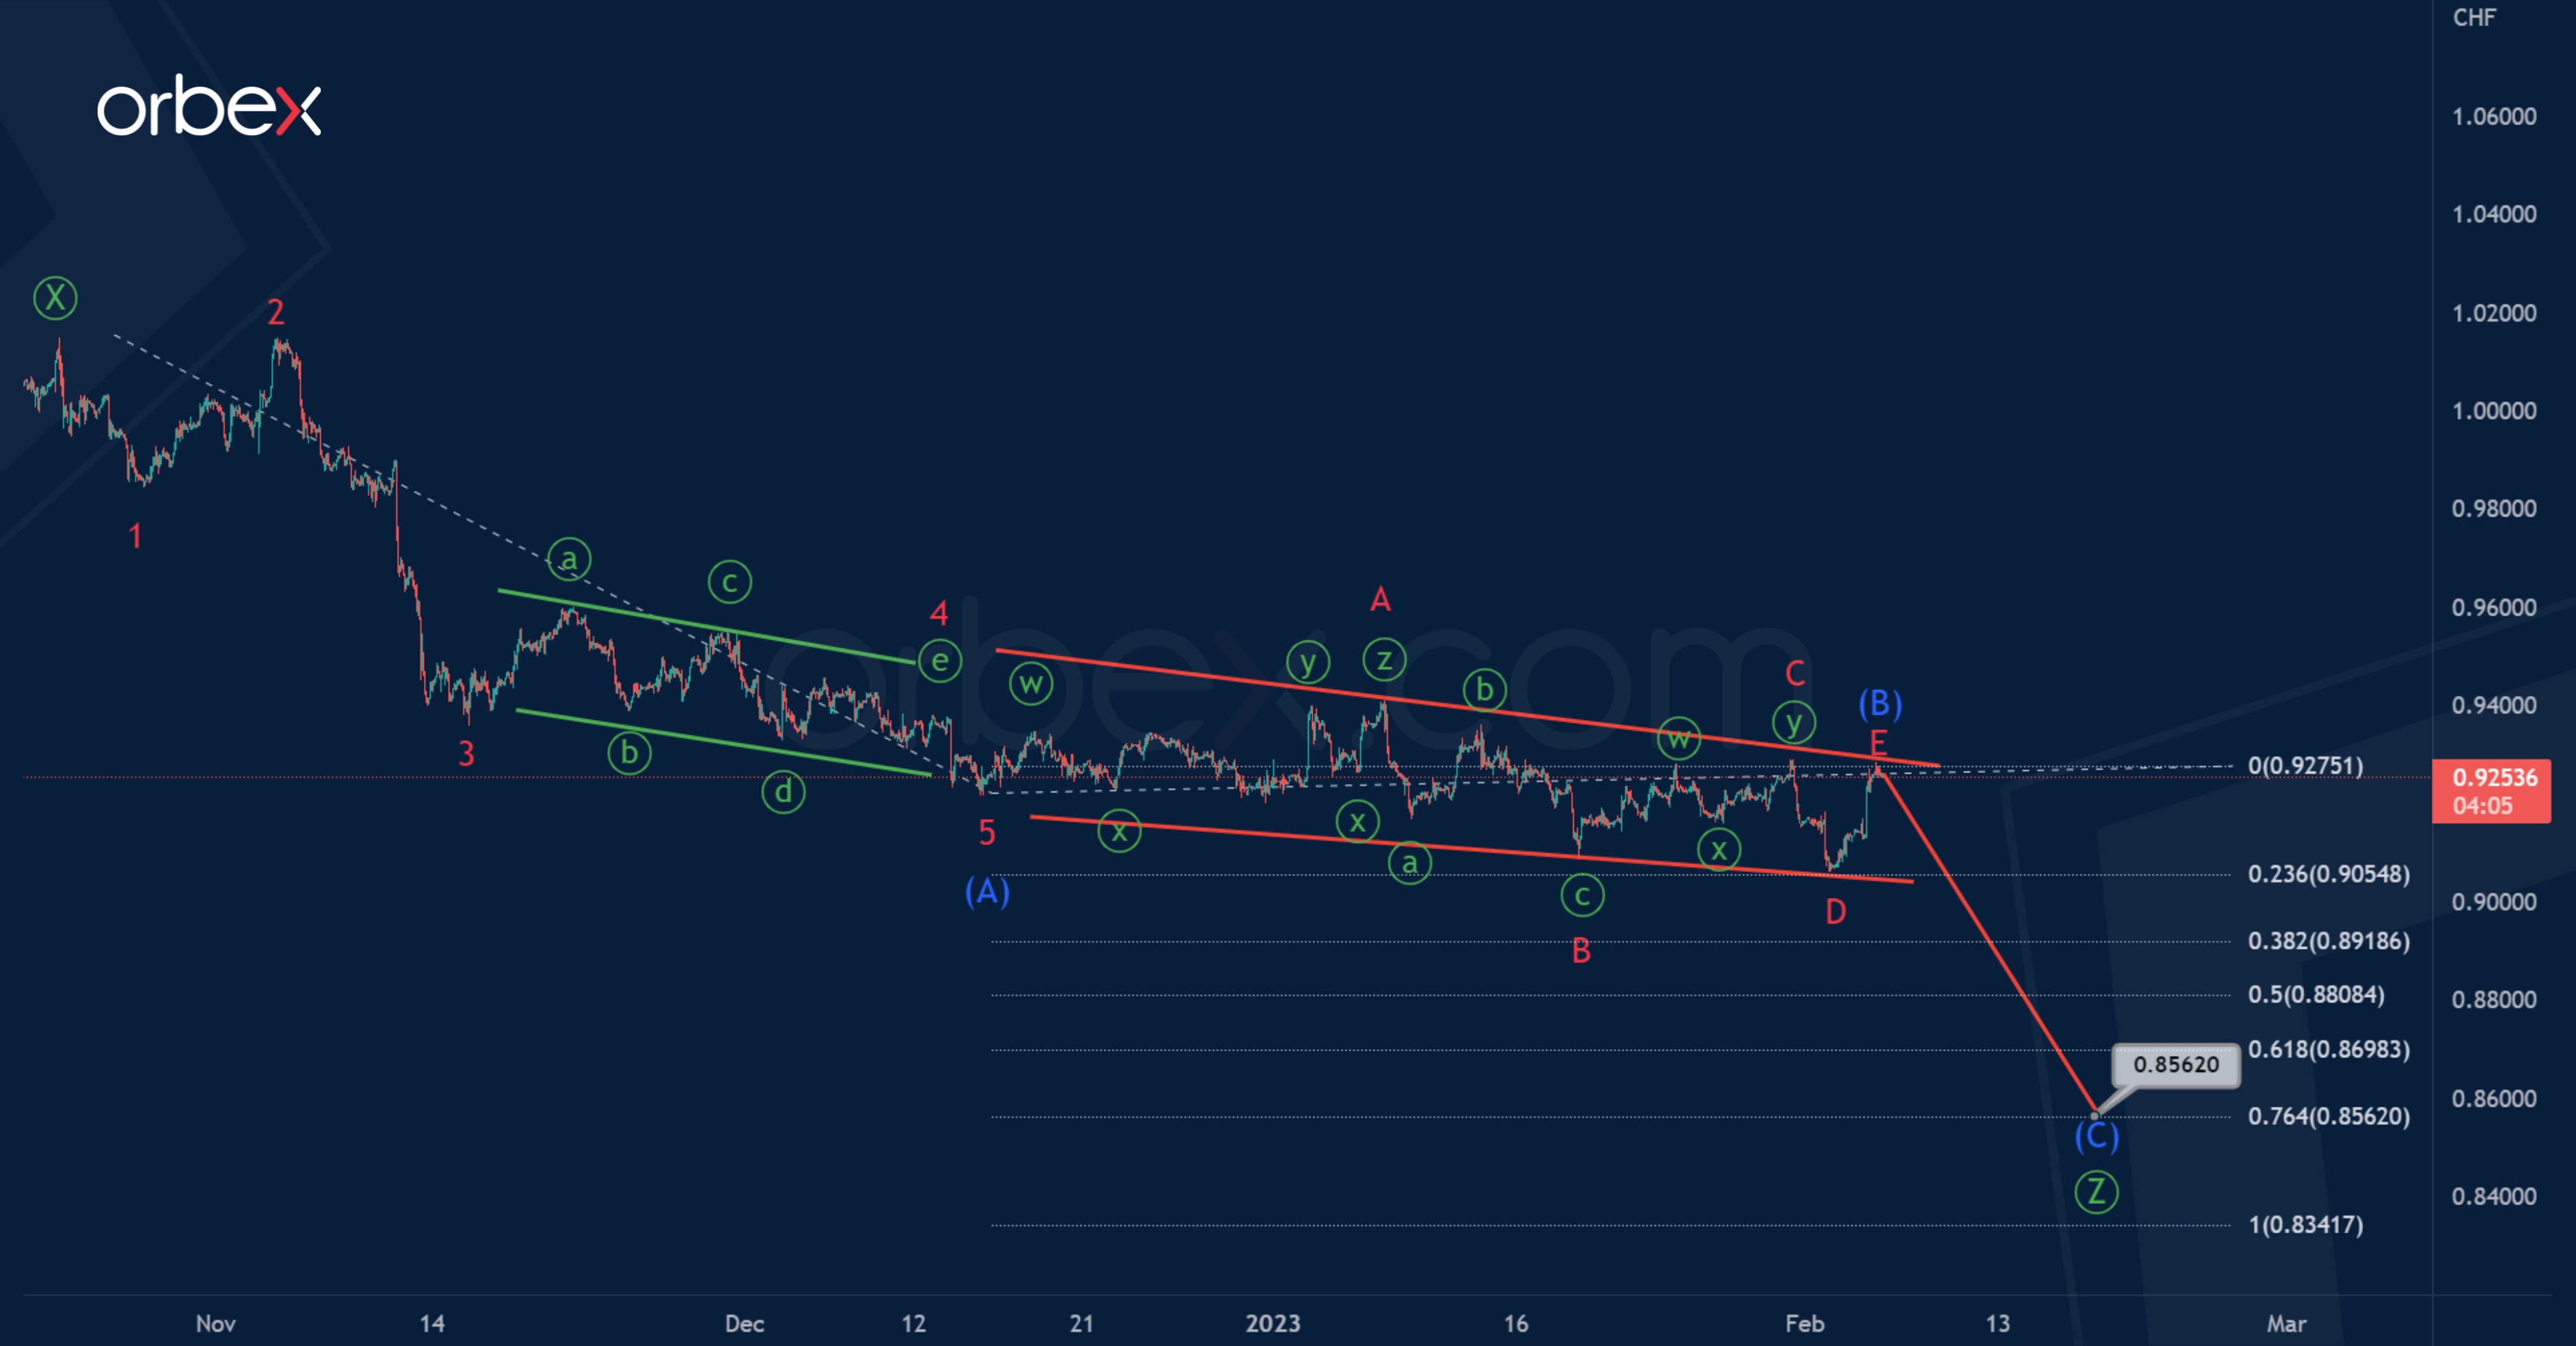
In the long term, the USDCHF pair can build a primary corrective trend – a triple zigzag Ⓦ-Ⓧ-Ⓨ-Ⓧ-Ⓩ. Its final part, wave Ⓩ, is under development.
It is assumed that the wave Ⓩ may end in the form of a standard intermediate zigzag (A)-(B)-(C). Wave (A) is a 5-wave bearish impulse, wave (B) is a skewed triangle that looks finished.
Usually, after the end of a skewed triangle, the trend continues to move in the same direction in which it moved before the beginning of the triangular pattern, in our case downwards. Thus, the formation of the final intermediate wave (C) can be expected in the near future.
Using the Fibonacci extension, the potential end of the wave (C) is determined. Most likely, it will be at 76.4% of impulse (A), and will end near 0.856.
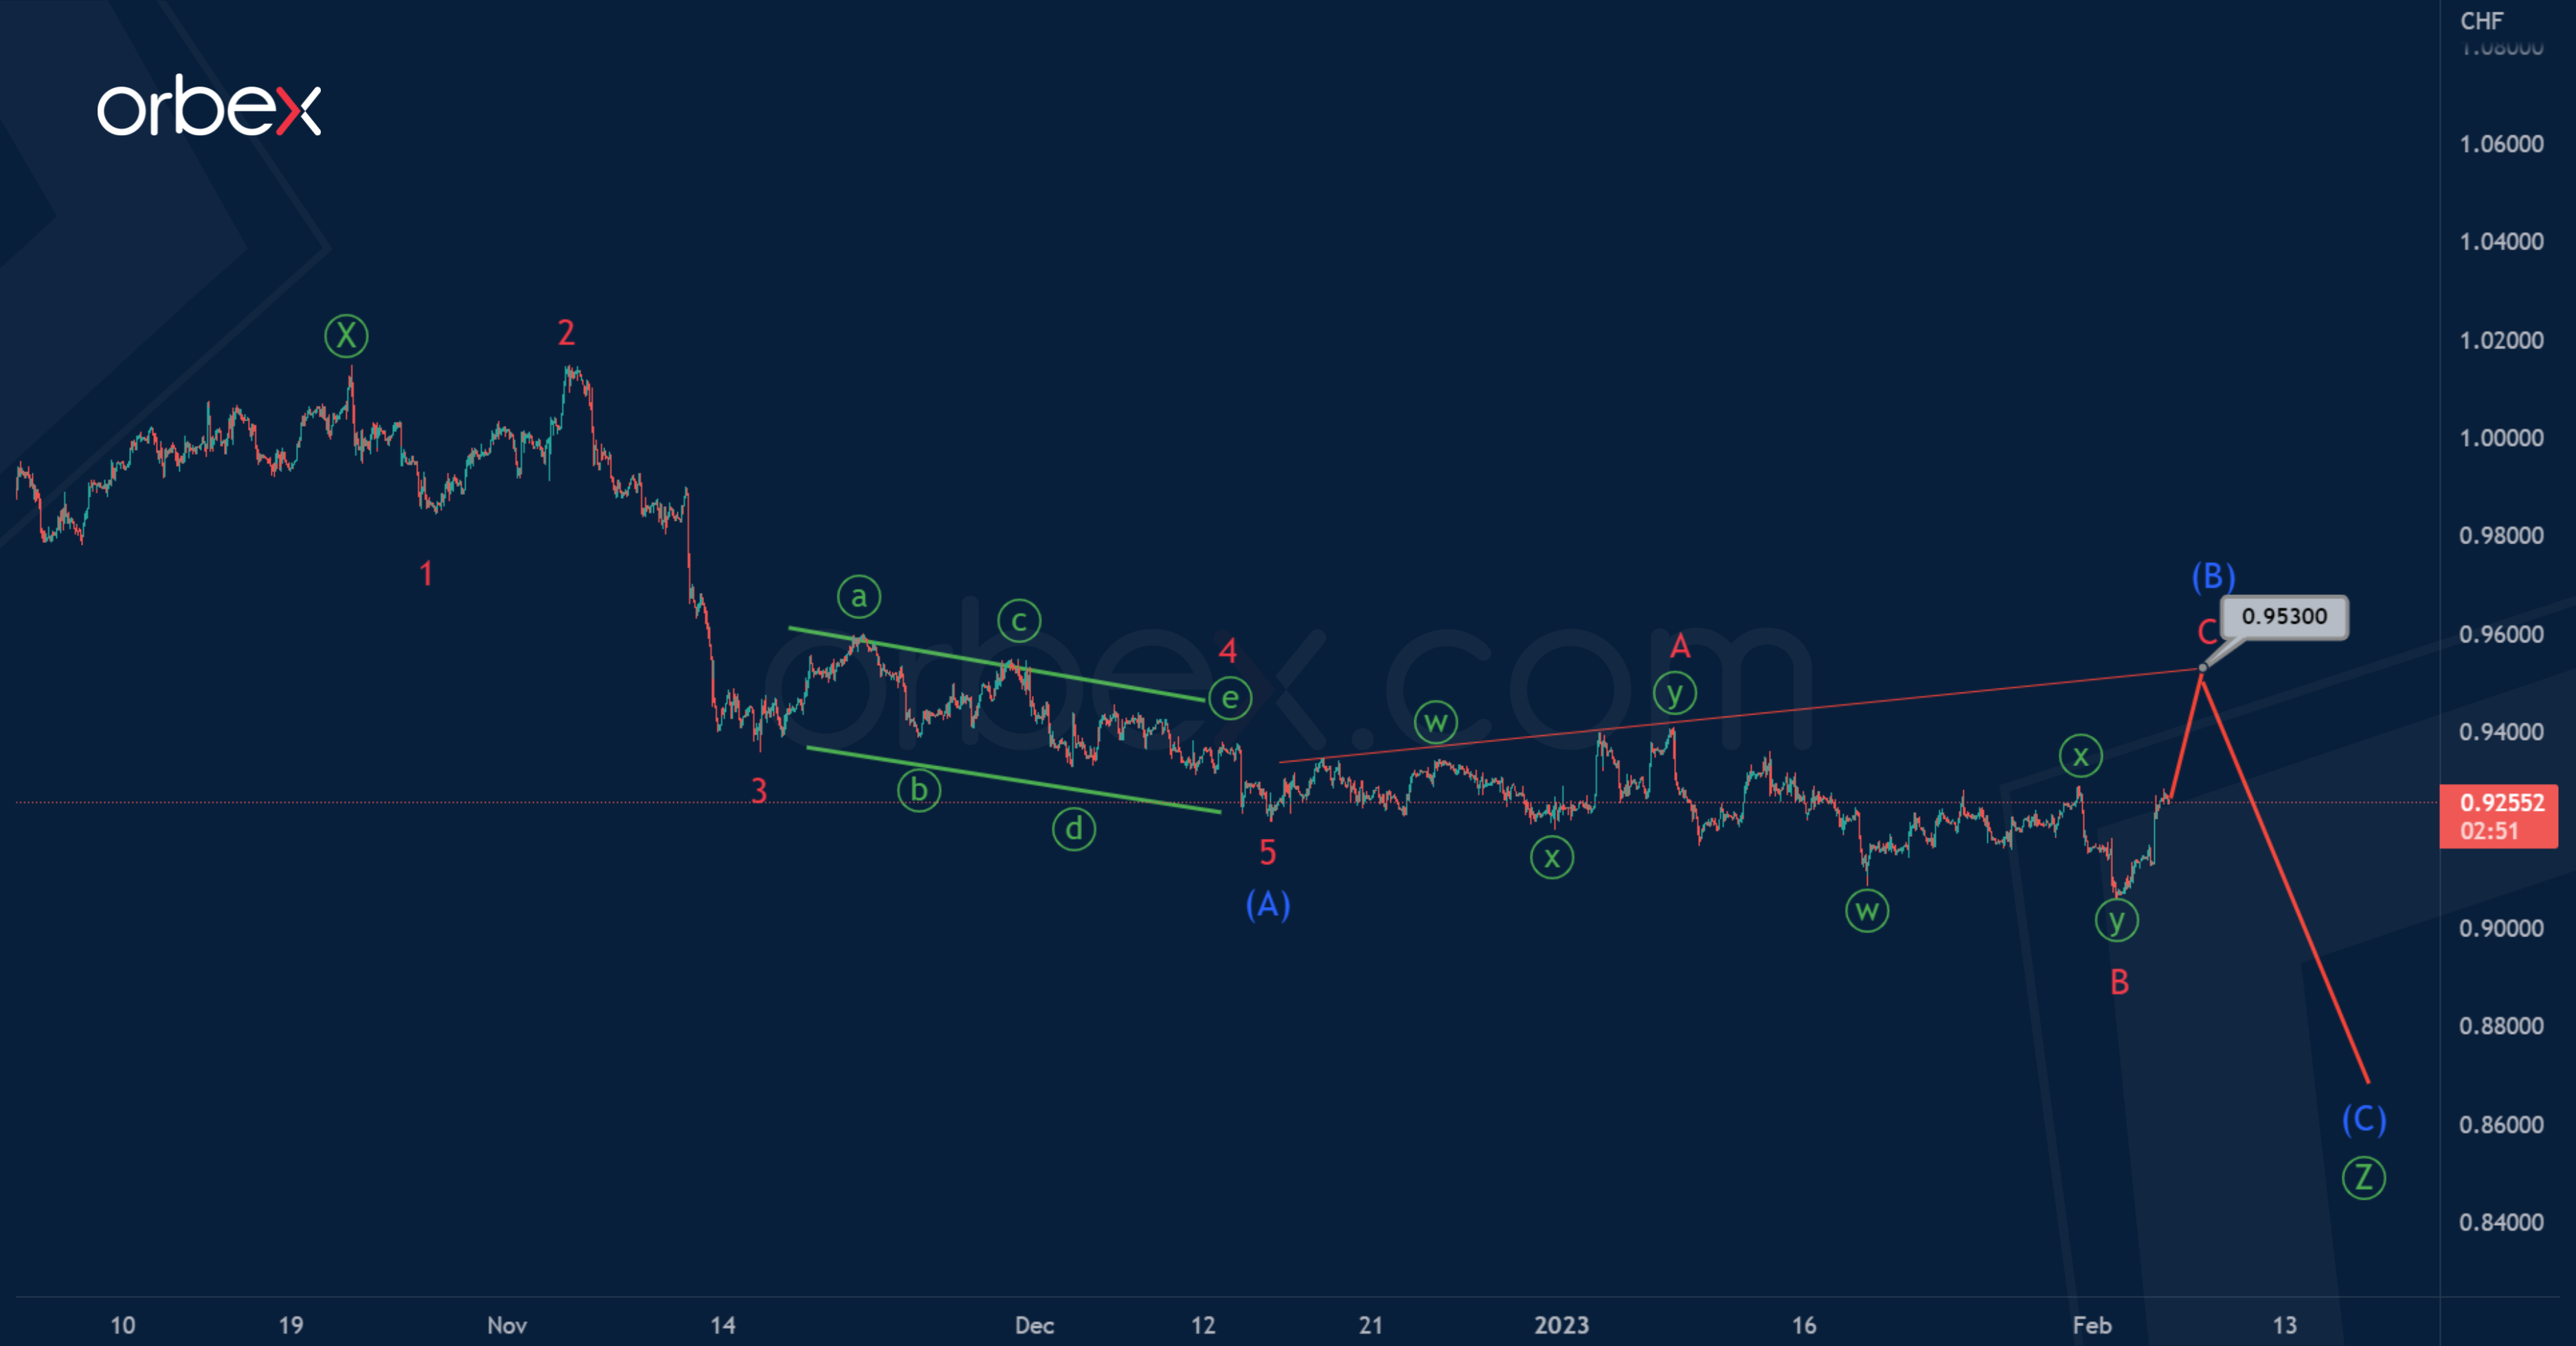
Let's look at an alternative scenario. According to this view, the development of correction (B) can be continued. Perhaps it takes the form of a flat A-B-C.
At the moment, two parts of the potential flat have been completed – the minor sub-waves A and B. Both of these sub-waves are similar to double zigzags of the minute degree ⓦ-ⓧ-ⓨ.
To confirm this scenario, the last part is needed – impulse C, and perhaps the price has already begun to climb up within this impulse.
It is likely that the impulse C will end near 0.953, located on the resistance line.
DAX 40 Consolidates Gains
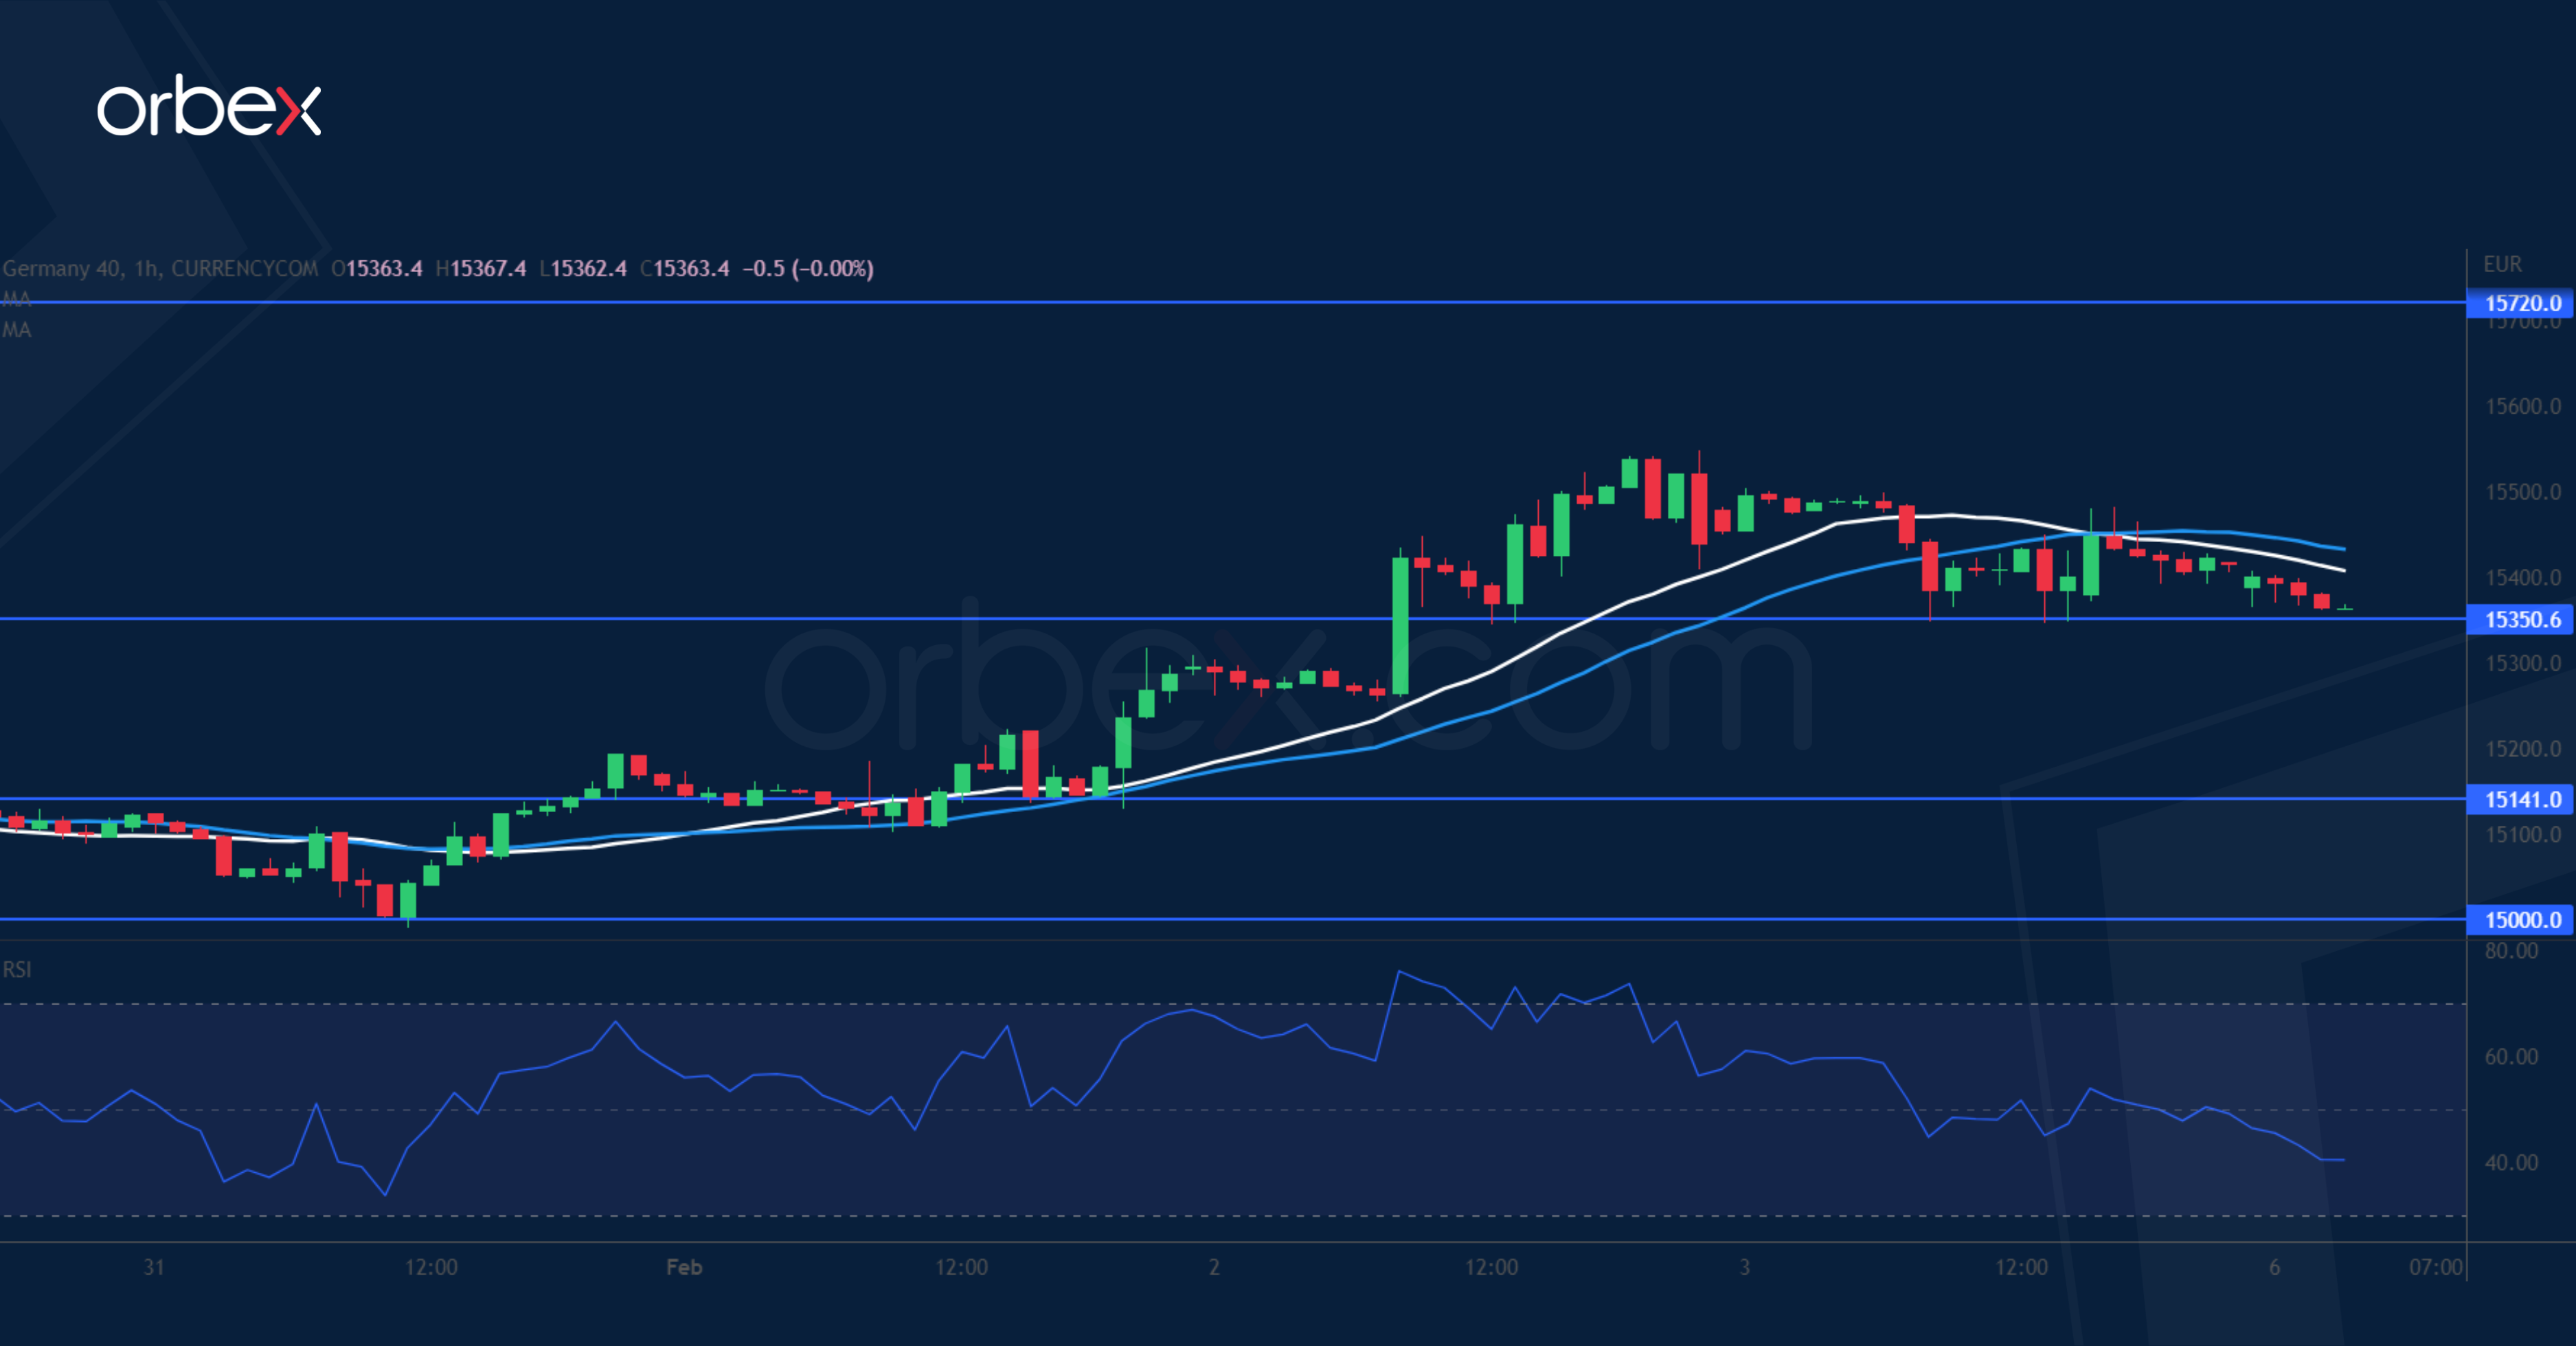
The Dax 40 steadies as investors hope that the ECB is in the later stage of its hiking cycle. Sentiment saw a boost after a bounce off the 20-day SMA (15000), potentially sending the index to a 12-month high (15720). The rally has tempered its pace after an overbought RSI showed signs of overextension. 15350 is the first support and a bounce would carry the bullishness to the aforementioned target. A bearish breakout, however, would force leverage positions out and send the price back to the moving average now at 15140.
XAG/USD seeks floor
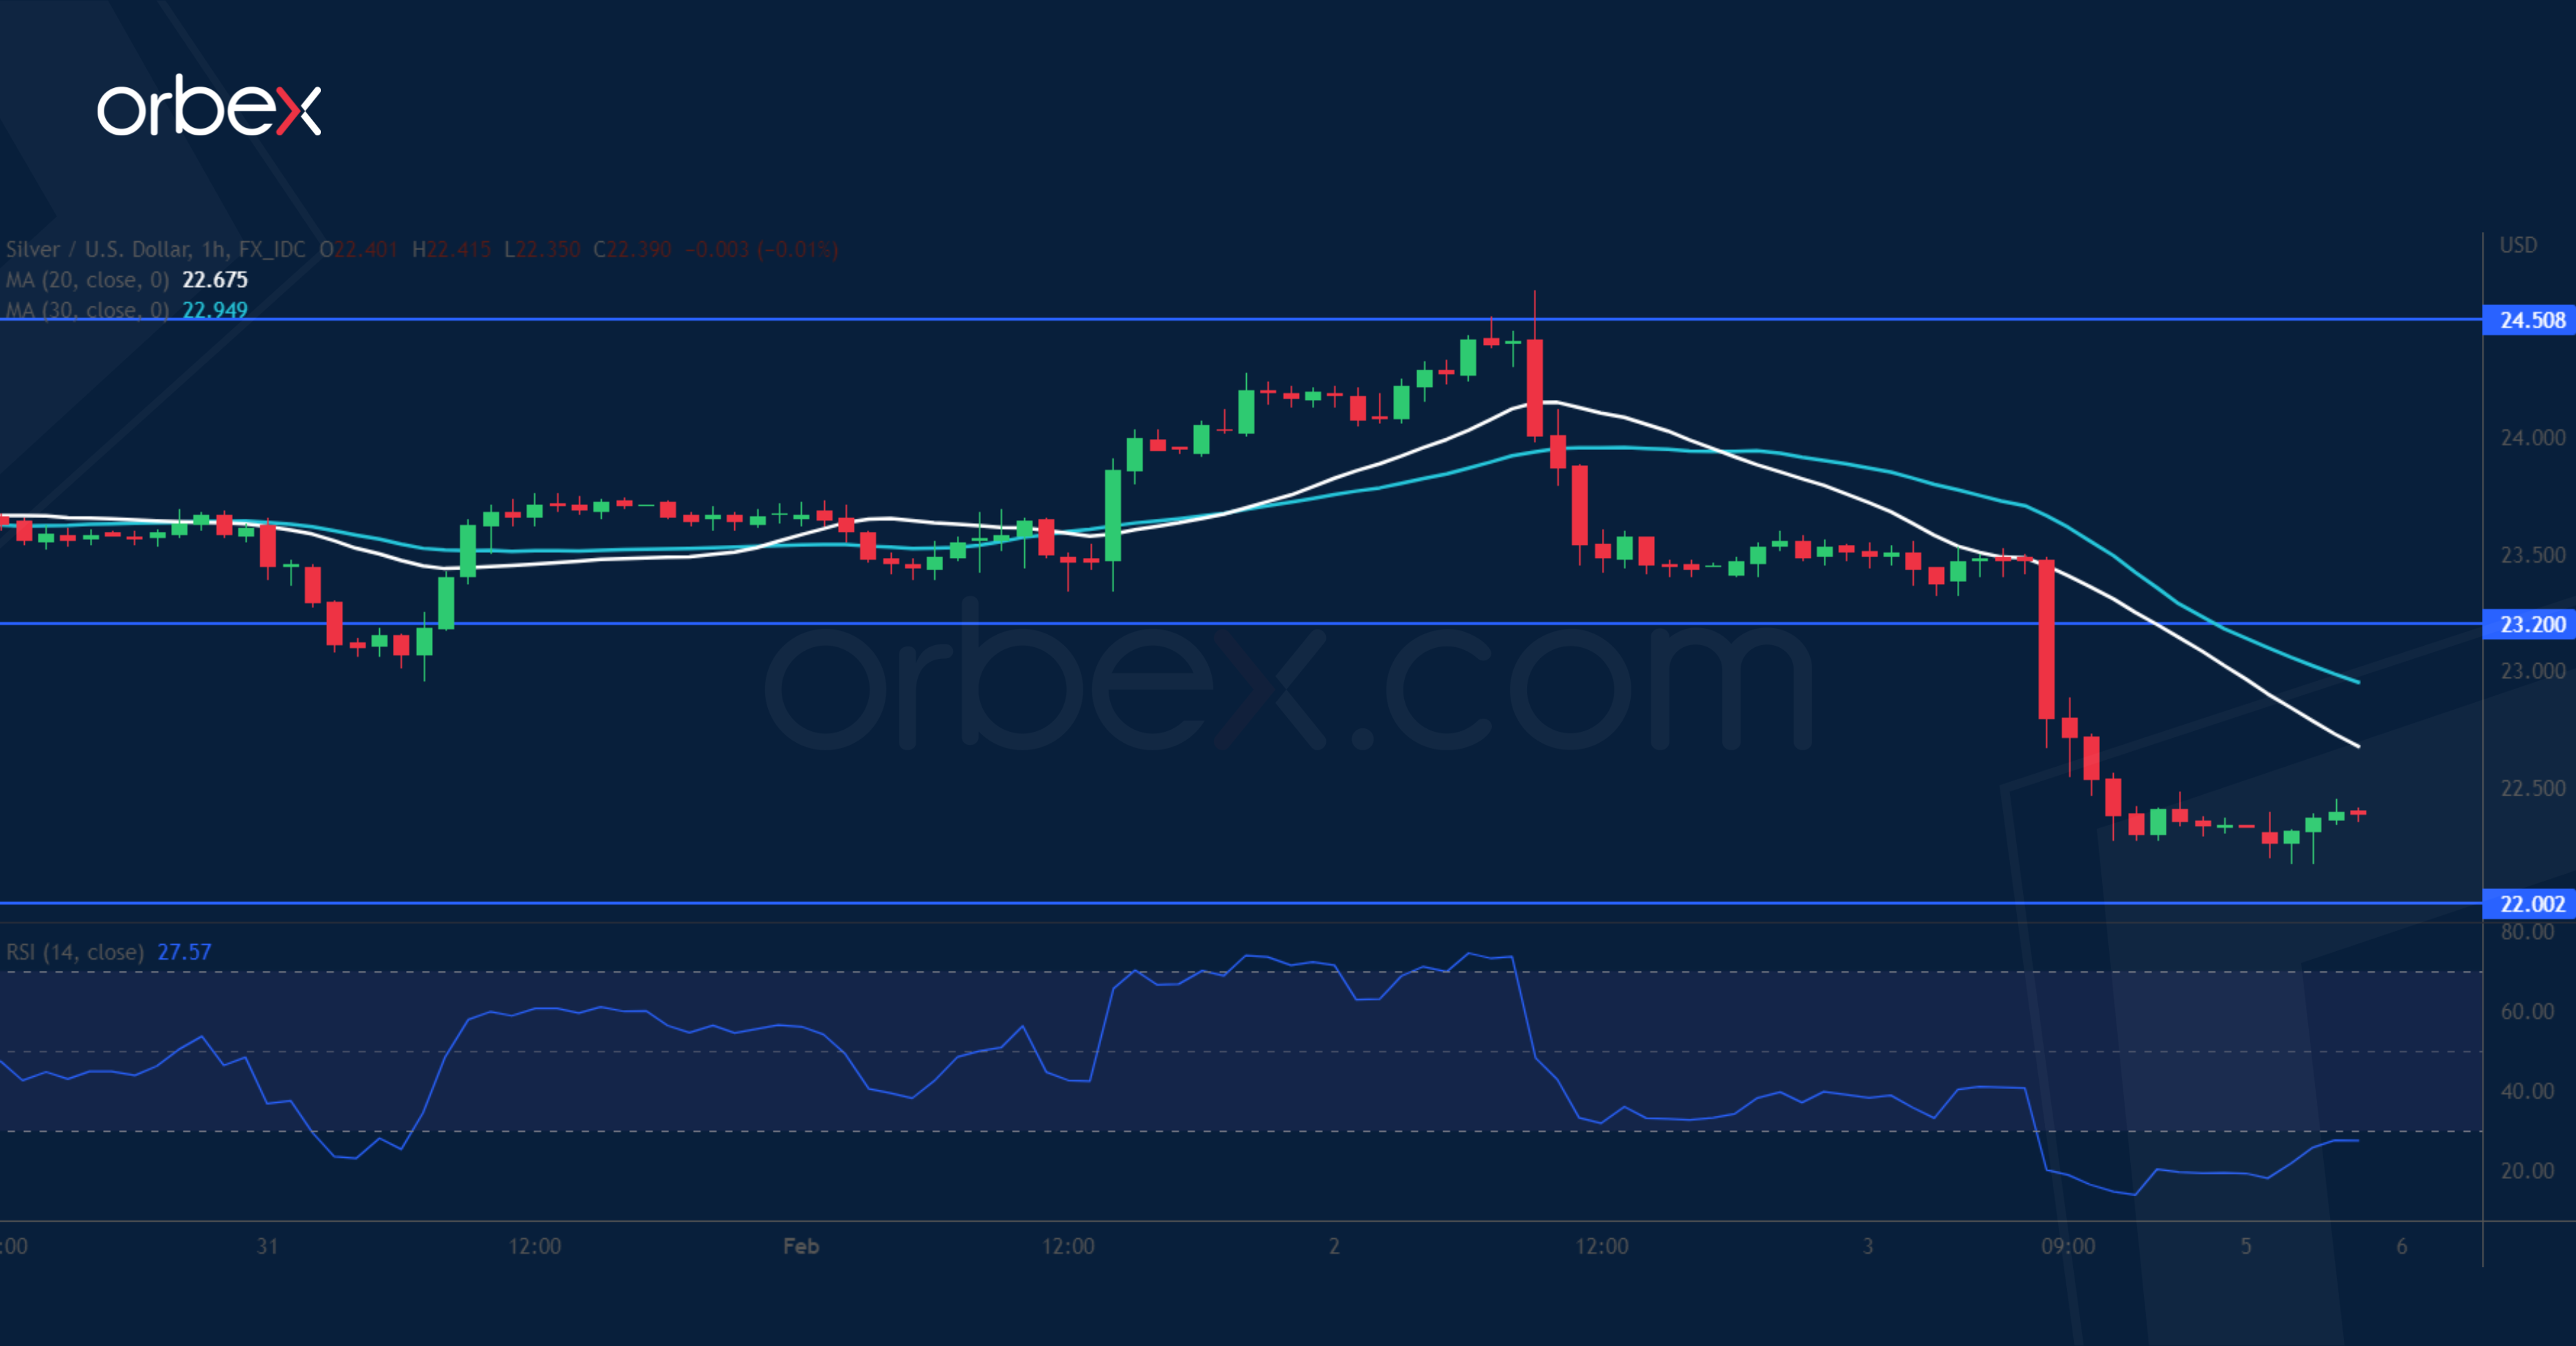
Silver plunges as Treasury yields and the US dollar leap forward post-NFP. The metal was struggling to sustain its momentum in the major supply zone around 24.50 despite another tentative breakout. The lengthy choppy action at the top was a sign of indecision and a fall below 23.40 prompted the bulls to exit. The liquidation below the critical floor at 23.00 suggests that the path of least resistance has turned south. The round number 22.00 is next to see if buying interest would show up with 23.20 as the first hurdle.