Sample Category Title
EUR/USD Goes into Correction
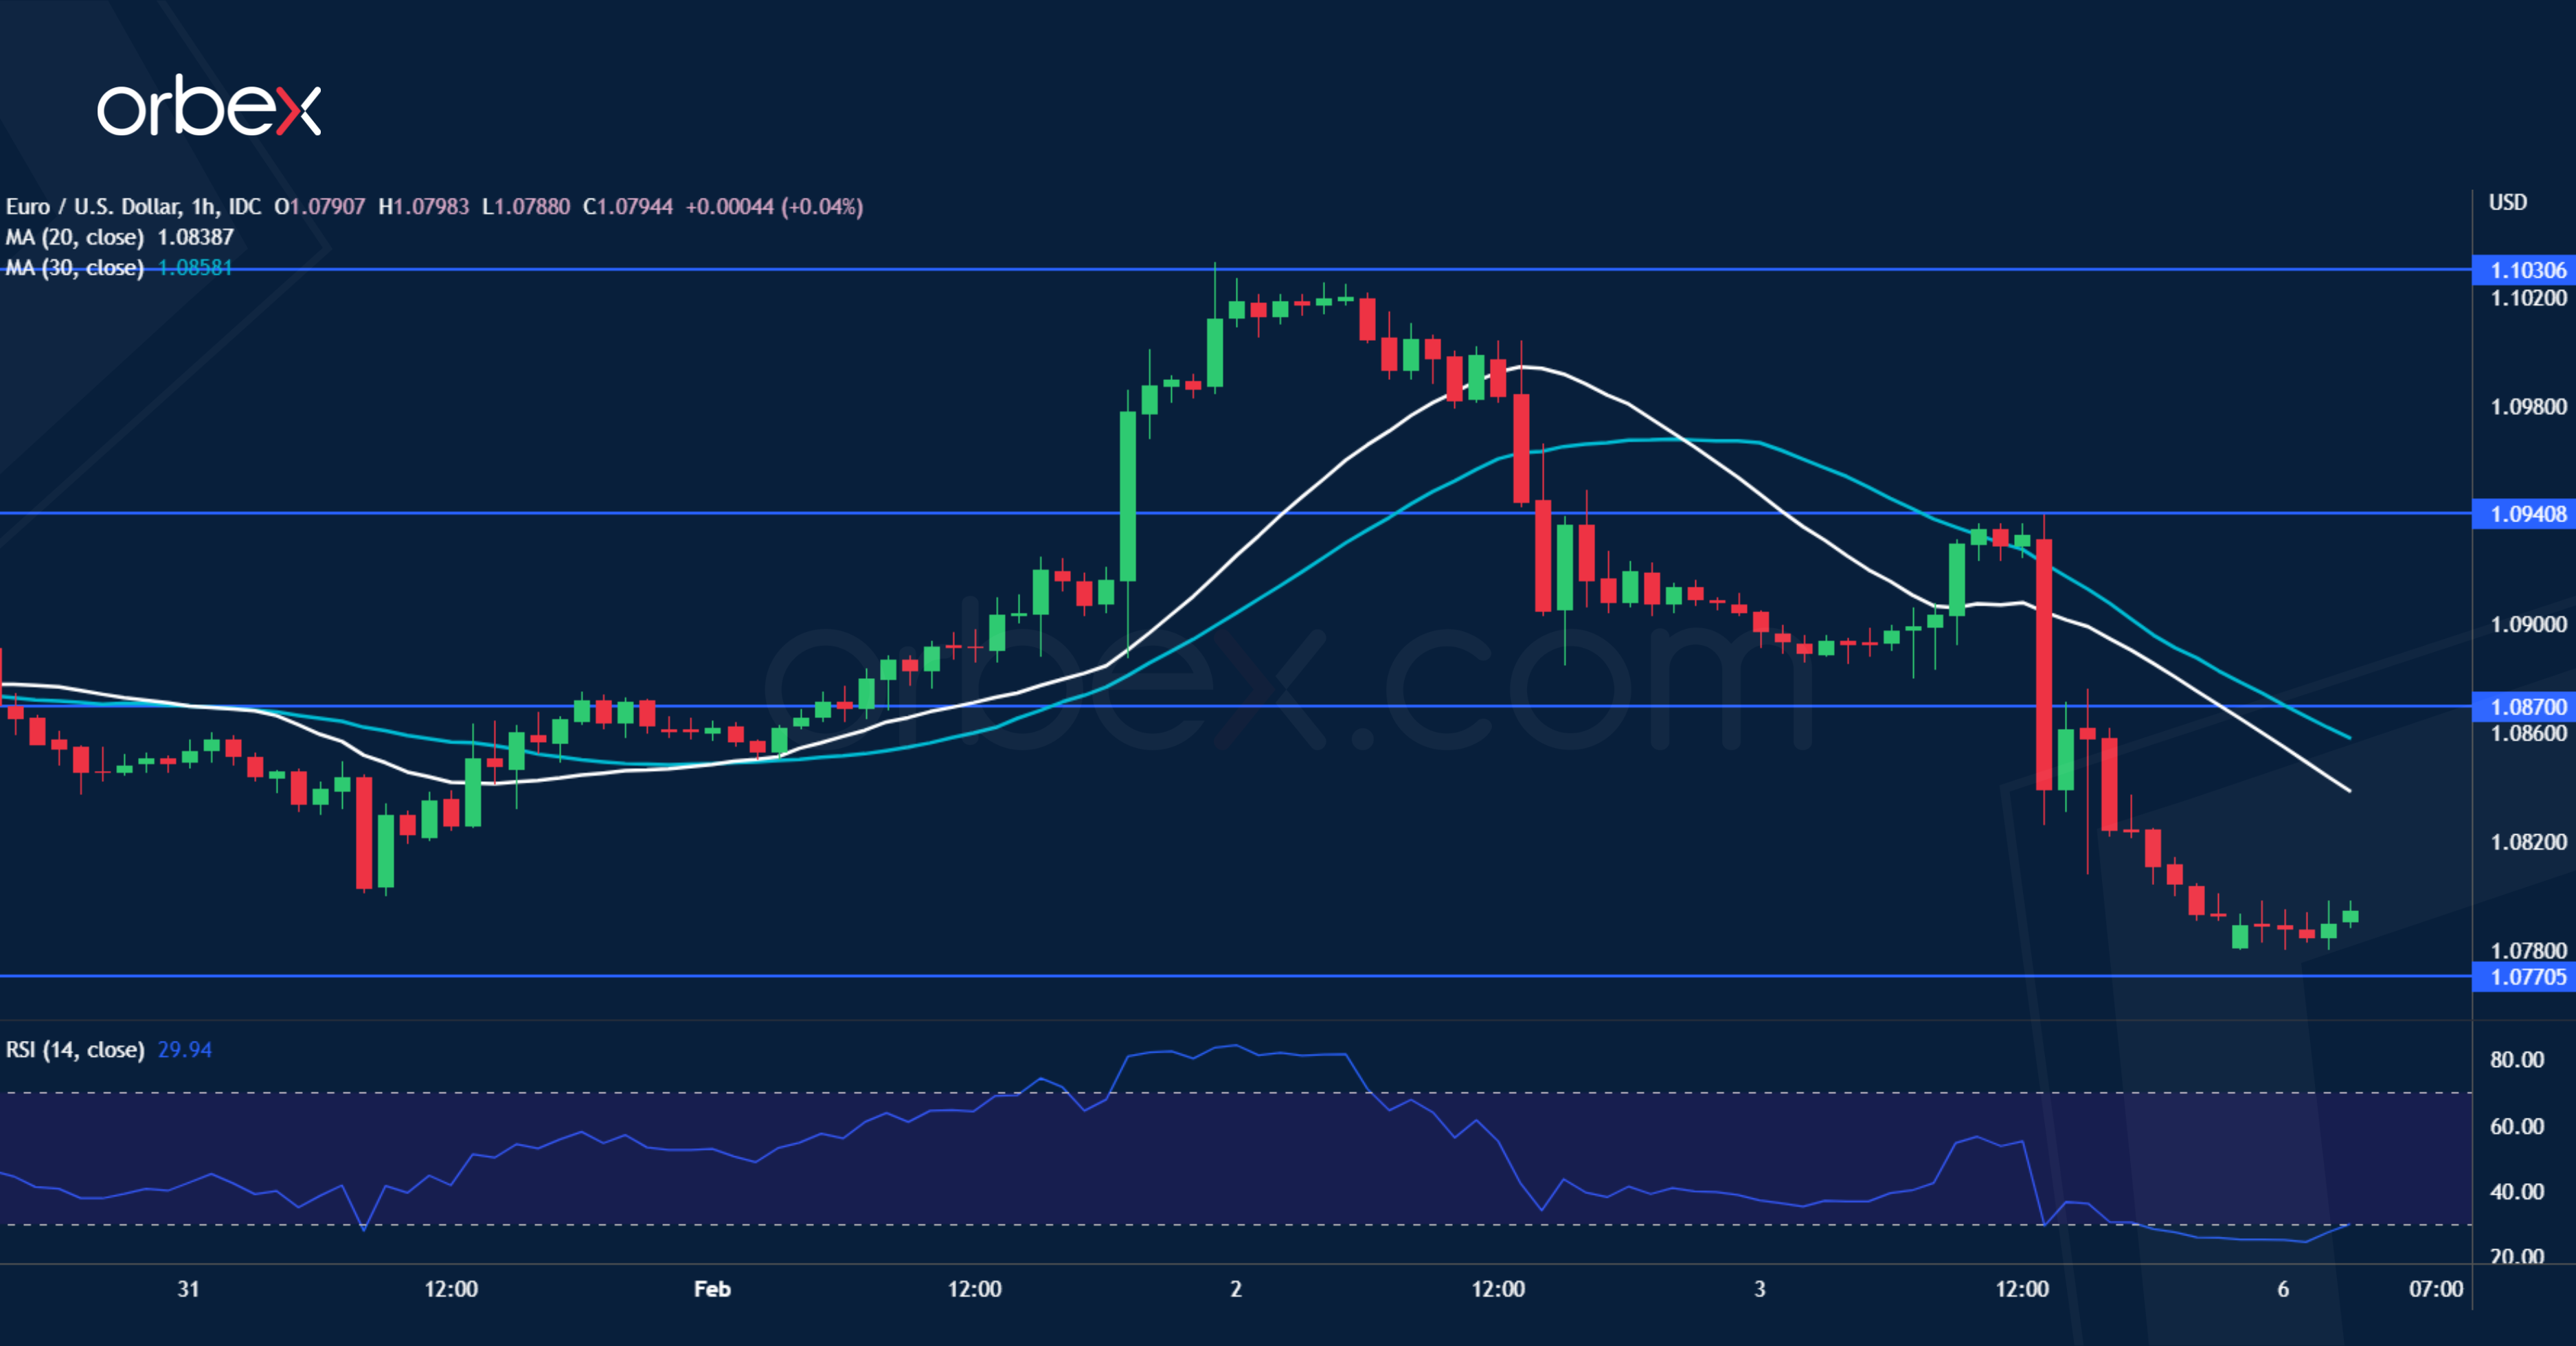
The US dollar soared after January’s jobs report far exceeded estimates. The pair came to a halt in the supply zone around 1.1000 from last April’s sell-off. A drop below the bullish engulfing candle at 1.0890 was already a sign of weakness with the euro struggling to hold on to recent gains. A sharp fall below 1.0850 (20-day SMA) and 1.0800 indicates that the bulls have bailed out. 1.0770 on the 30-day SMA is the next level to see whether the price would stabilise, and 1.0870 is a fresh resistance in case of a bounce.
Stocks and Bonds Down, Dollar Up
Markets
Friday was all about exceptionally strong US payrolls and a sharp rebound in the services ISM. The former showed a 517k job creation in January with details strong across the board. The unemployment rate fell to a 54-y low of 3.4% while the participation rate edged higher to 62.4%. Earnings rose 0.3% to 4.4% following an upward revision for the month before. Some referred to seasonal factors explaining the consensus smashing outcome but even if that has something to do with it, the labour market is simply on fire. The services ISM in January rebounded from 49.2 to 55.2, well beyond the 50.5 analyst consensus and suggesting the sudden sub 50 drop in December was an outlier. The gain was supported by business activity and new (export) orders both jumping above (or close to) 60. Employment narrowly escaped from contraction territory (50 from 49.4). It was a one-two blow for US Treasuries and investors doubting the Fed’s inflation commitment. Yields shot up 6.7 bps to 18.4 bps with the curve’s inversion deepening again. German yields rose in the slipstream, supported by a slew of hawkish central bank speeches and comments (Vasle, Simkus, Kazimir, Muller, Rehn). They added 5 to 12.5 bps with the long end underperforming. A risk-off equity environment (WS up to -1.6% lower) and the front end rate differential gave wings to the dollar. DXY rose towards the 103 resistance area (2020 panic high), up from 101.83. EUR/USD tested 1.0942 going into the payrolls before sliding into a 1.0795 close. USD/JPY soared from 128.68 to 131.19. Sterling lost out, especially against the USD. GBP/USD dropped from 1.222 to 1.205. EUR/GBP rose from 0.892 to 0.895. UK gilt outperformance and risk-off (in US dealings) were the main factors. Bank of England chief economist Pill said the central bank needs to seek a balance in setting monetary policy and said they must “guard against” doing too much. He added that markets interpret the BoE’s guidance correctly, implying an end to the tightening cycle soon.
Asian markets start the week on softer footing. The US downing the alleged Chinese spy balloon adds to geopolitical uncertainties. An upcoming trip to China by Secretary of State Blinken has been postponed because of the matter, dampening hopes for a thaw in US-Sino relations. Stocks in China drop up to 3%. The Japanese yen underperforms on FX markets (cfr. infra). Core bonds extend Friday’s decline this morning with US cash yields dropping up to 5.9 bps at the front. The economic calendar is all but empty. The strong batch of US eco data on Friday served as a wake-up call that may continue to set the tone today in a way that’s reminiscent of much of 2022: stocks and bonds down, the dollar up. Geopolitics will linger as well. From a technical point of view, the US 10y yield weekly close above 3.50% is a positive sign. We look out for core bond yields to bottom out further. Support/dollar resistance in EUR/USD is located at 1.0735.
News and views
Japanese newspaper Nikkei reported that the Japanese government approached BoJ deputy governor Amaniya to succeed current governor Kuroda after his term ends in March. Amaniya is considered the candidate who’ll opt for continuity in the BoJ’s ultra-easy monetary policy given that he’s a long term Kuroda ally and architect of some the policy instruments. The report was later denied by the Japanese government, but can’t prevent the Japanese yen from losing ground this morning despite risk-off market sentiment. Ever since the BoJ unexpectedly widened the 25 bps corridor around the 0% target for the 10y yield to 50 bps, the market has been trying to frontrun next normalization steps. USD/JPY hovers around 132. On Friday, JPY already suffered a serious beating on rising US interest rates.
Australian inflation-adjusted retail sales (volumes) declined by 0.2% Q/Q in the final quarter of last year (vs -0.5% expected). Retail volumes fell for the first time since Q3 2021 with volumes falling across all non-food industries as consumers tightened discretionary spending in response to mounting cost of living pressures. Retail prices remain high, but price growth slowed to 1.1% Q/Q in December due to flat food retailing prices and additional discounting during Black Friday sales. This was the smallest rise in retail prices for 2022. In a separate release, Melbourne Institute monthly inflation numbers rose by 0.9% M/M with the Y/Y-reading rising from 5.9% to 6.4%, the highest on record. Today’s data are the final input before tomorrow’s RBA meeting which is expected to deliver another 25 bps rate hike (to 3.3%).
Market Dynamics Change at the Wake of the Monstrous NFP Beat
US NFP printed 517’000 last Friday. More than half a million.
It’s a monstrous gap with the 185’000 expected by analysts. And even if the seasonal factors may have affected the January report… 517’000 jobs, is quite a STRONG number for a monthly NFP report.
The unemployment rate unexpectedly fell to 3.4%. That’s the lowest level since 1969.
And the wages growth has been parallel to the 0.3% expectation by analysts on a monthly basis, and fell from last month’s 4.8% to 4.4% on yearly basis. But that 4.4% was, again, higher than the 4.3% expected by analysts.
So, Friday’s jobs report was a monstrous beat, from all perspectives. It was a monstrous slap on the Federal Reserve (Fed) doves’ face, as the latest US jobs data was nowhere close to an economy that’s supposed to be slowing down, and eventually enter recession and call for a rate cut.
And it’s another reminder that the huge layoffs in big companies, and especially in big tech stocks remain the exception to the rule.
Strong jobs is bad news for the market, at least until the next US CPI release
Now, it’s too early to say whether the latest jobs data is good or bad news for the market.
It is bad news for the Fed, which is trying to loosen the US jobs market, which wouldn’t loosen.
But it would be less bad news if the impact on inflation isn’t significant.
To tell whether the latest jobs data is bad news, because the tight labour market continues boosting inflation, or good news, inflation remains on an easing path despite the rock-solid jobs market, we will have to wait until next Tuesday, when the US will reveal the January CPI report. Until fresh news, Friday’s jobs data is bad news for the market. Even more so, as the latest tech earnings, including Apple, Amazon and Google easily missed expectations.
In the FX
The latest US jobs data will likely support the US dollar bulls this week, as we don’t have much on the economic calendar that could temper Friday’s monstrously strong NFP read, and remind us that the US economy is still slowing.
Fed Chair Jerome Powell will speak at an event in Washington on Tuesday, and he will probably sound hawkish faced with the latest jobs report, if he says anything about it at all.
Plus, the fresh selling pressure on the Japanese yen will likely give an extra hand to the Fed hawks, on weekend news that the potential new Bank of Japan (BoJ) Governor, Masayoshi Amamiya will be dovish.
In the light of the latest macroeconomic developments, a revision to medium term outlook is necessary.
The dollar-yen’s latest jump above the 130 mark could be sustainable in the short to medium run, and the recovery could extend past the 50-DMA (132.60), into the 133 level, the minor 23.6% Fibonacci retracement on October to January decline, and into the 136.67, the major 38.2% retracement and which will distinguish between the actual bearish trend and a medium term bullish reversal. I still don’t expect the dollar-yen to reverse the medium-term bearish trend, but the upside potential is interesting before the major Fibonacci level is challenged for a real change in sentiment.
The EURUSD was hit last Thursday after the European Central Bank (ECB) lifted the interest rates by 50bp as expected, but the number of other 50bp hikes to come was reduced from ‘many many’ to ‘one more’ at Lagarde’s press conference following the meeting. So the softening ECB hawks after the ECB decision, and the confused Fed doves after the US jobs report sent the EURUSD below the 1.08 mark in more than two weeks. And because the EURUSD hit the psychological 1.10 mark just before the ECB decision, many traders were and will be happy to call it a good trade and retreat to the sidelines. We will likely see some support between 1.0685/1.0750 area, which shelters the 50-DMA, the positive trend base, and the minor 23.6% retracement on the September to last week rally. But the EURUSD will remain in the positive trend as long as it stays above 1.0475, the major 38.2% retracement. And I don’t see the pair sink below 1.05 with the information we have in hand today.
For Cable, things look ugly. Anyone who looks at the price chart could easily tell that this pair is under a decent selling pressure and it’s just a matter of time before the pair slips below the 1.20 mark. The next major technical level stands near 1.1950, including the 200-DMA, and the major 38.2% retracement on September to January selloff. A decline below that level could smash the last sterling bulls. But at least, the falling sterling helps the FTSE 100 to hit fresh all-time highs.
Elsewhere, the Adani selloff enters the third week, and things go from bad to worse as in increasing number of banks don’t accept Adani holdings as collateral anymore.
The Chinese spy balloon that was flying over some strategic points in the US, and that has been shut down, and that resulted in Blinken cancelling his trip to China is a sign of renewing tensions between US and China, and that could throw a floor under the gold’s selloff. But the price of an ounce will likely see a strong resistance into the $1900 level.
Red Hot US Labour Market Report
Market movers today
After a very busy week, this week should be much slower, at least in terms of scheduled events and data releases. Today, we have a few data points out from the euro area, namely retail sales for December and Sentix investor confidence for February, and also December factory orders in Germany. Probably more importantly, we will have the postponed German CPI data for January out Thursday.
Other highlights this week are the rate decision from the Reserve Bank of Australia, where we look for a 25bp hike but markets price a small probability of unchanged rates, the University of Michigan consumer survey in the US including inflation expectations, and an EU summit on Thursday-Friday that will discuss Europe's response to the US IRA, but probably not reach any firm conclusions.
Thursday we have the Riksbank meeting in Sweden where we look for a 50bp hike.
The 60 second overview
US data: The US labour market report came in red hot on Friday with 517k in the NFP figure, vs. consensus of below 200k. The unemployment rate continued to decline to 3.4%, from 3.5%. Also the ISM report was strong, in particular new orders. Also prices paid remained elevated. Markets reacted strongly to Friday's non-farm payrolls report and the rebound in ISM services. Both indicated a surprise rebound in the underlying consumption engine of the US economy: the wage sum soared back to post-Covid trend lines and new services orders rebounded sharply to levels above 60. Both support the notion that it is far too early for the Fed to declare victory against elevated inflation. This was also reflected in the market reaction with 2Y USD swap rates rose 16bp on both markets pricing in more short-term hikes as well as markets removing some of the cuts embedded into the curve post summer. EUR/USD fell sharply by 1.5 big figure returning the cross to the levels of early-mid January below 1.08.
ECB: After the strong market rally on Thursday on the back of the ECB meeting, we saw a number of governing council members affirming the 50bp in March view and also a hike in May. Only Holzmann said that they may only reach the policy rate in Q3.
Euro area data: Euro area PPI inflation continued to decline to 24.6% in December (from 27.0% in November 2022), mostly due to energy. But PPI for core consumer goods edged up a tad again (9.3% after 9.2% in November), which suggests that cost-push inflation for core inflation is not yet done, although a peak for goods inflation should come probably fairly soon. In a new piece; Euro macro notes - From recession to stagnation, we revise our view of the near-term prospects of the euro area economy which have brightened amid a more balanced risk picture.
BoJ: During the weekend, BoJ deputy governor Amamiya was rumoured to take over from Kuroda later this year. If chosen, he would probably continue the current monetary policy setting.
Geopolitics: While the US shot down the Chinese 'spy baloon' during the weekend, this is yet to be noted in financial market pricing of the Asian trading session.
FI: Markets corrected higher in yields Friday morning reserving some of the massive rally on Thursday's ECB induced rally. The US labour market report came in very hot and sent yields significantly higher which left 10y US treasuries 15bp higher on the day. That took European rates higher and 10y German yields ended 12bp higher, and is now broadly unchanged compared to the level pre-announcement. Intra-euro area spreads were broadly unchanged on the day amid bear steepened in the curves.
FX: Broad based USD rally on Friday after strong US data releases. EUR/USD fell below 1.08 and USD/JPY rose above 130. The later found further support overnight from news that Japanese government may pick current Bank of Japan deputy governor Amamiya for new governor. EUR/DKK rose sharply to around 7.4450 on Friday after Danmarks Nationalbank (DN) widened the policy rate spread to ECB Thursday.
Credit: CDS indices were marginally tighter on Friday following Thursday's ECB-induced rally. Meanwhile, the primary market was almost quiet, with only Nordea being active in the EUR benchmark segment, printing a 3NC2 EUR1bn SNP deal.
Technical Outlook and Review
USD/JPY:
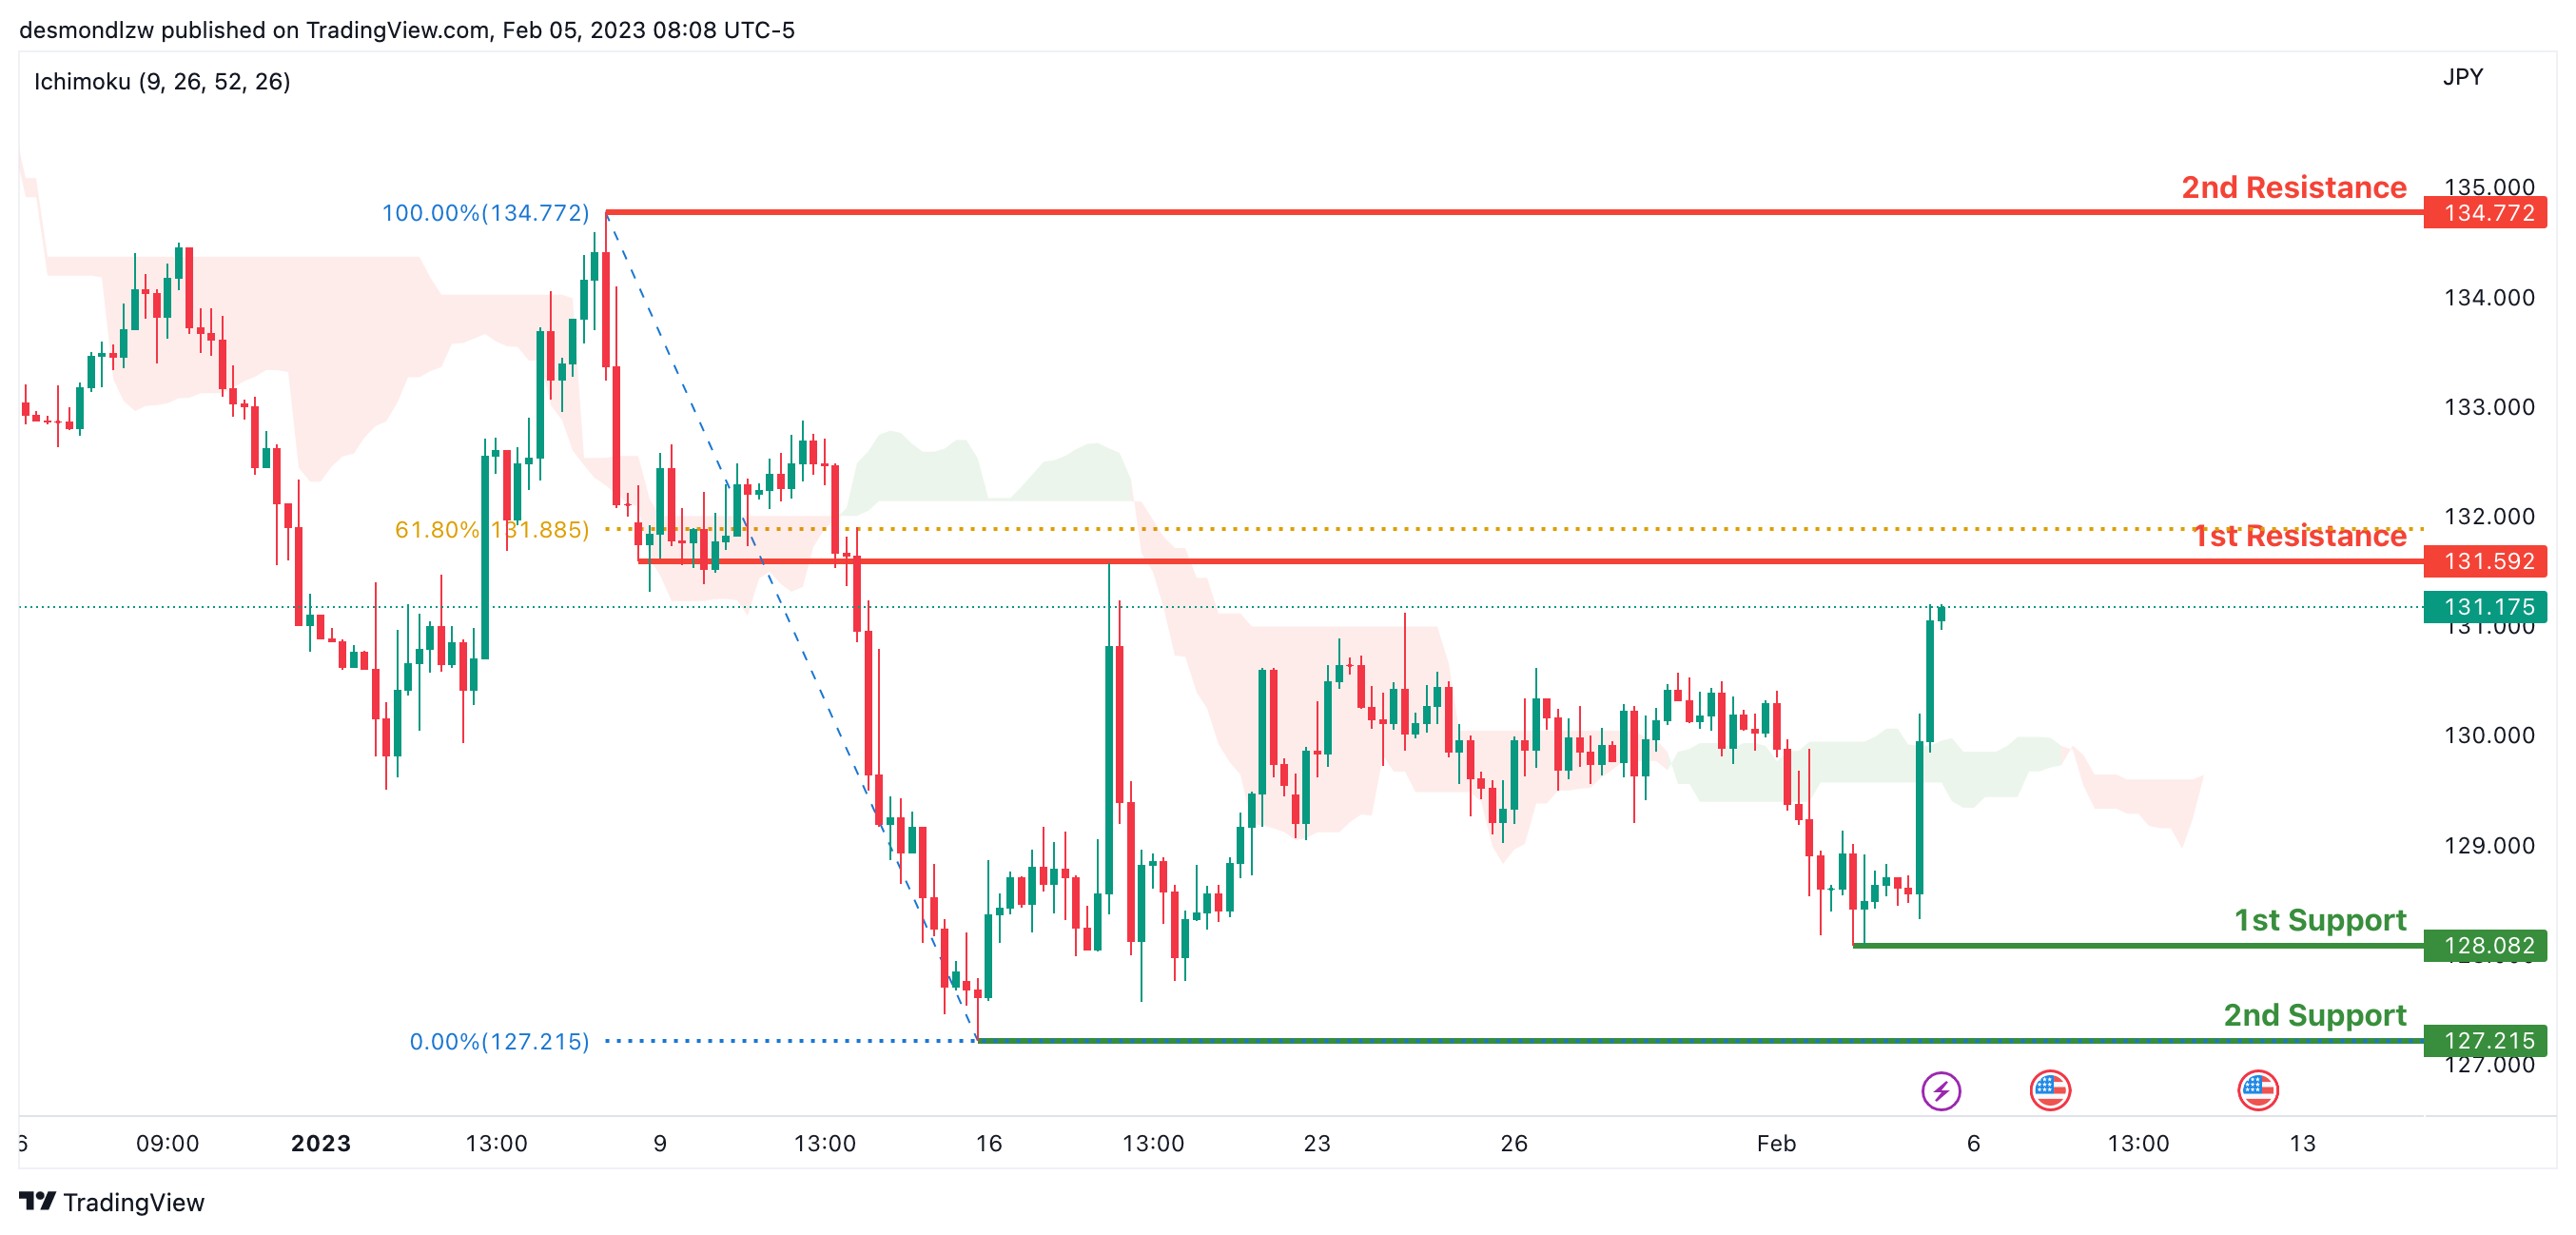
Looking at the H4 chart, my overall bias for USDJPY is bullish due to the current price crossing above the Ichimoku cloud, indicating a bullish market. If this bullish momentum continues, expect the price to possibly continue heading towards the 1st resistance at 129.204, where the overlap resistance is. In an alternate scenario, price could possibly head back down to retest the 1st support at 128.082, where the previous swing low is.
Areas of consideration:
- H4 time frame, 1st resistance at 129.204
- H4 time frame, 1st support at 128.082
DXY:
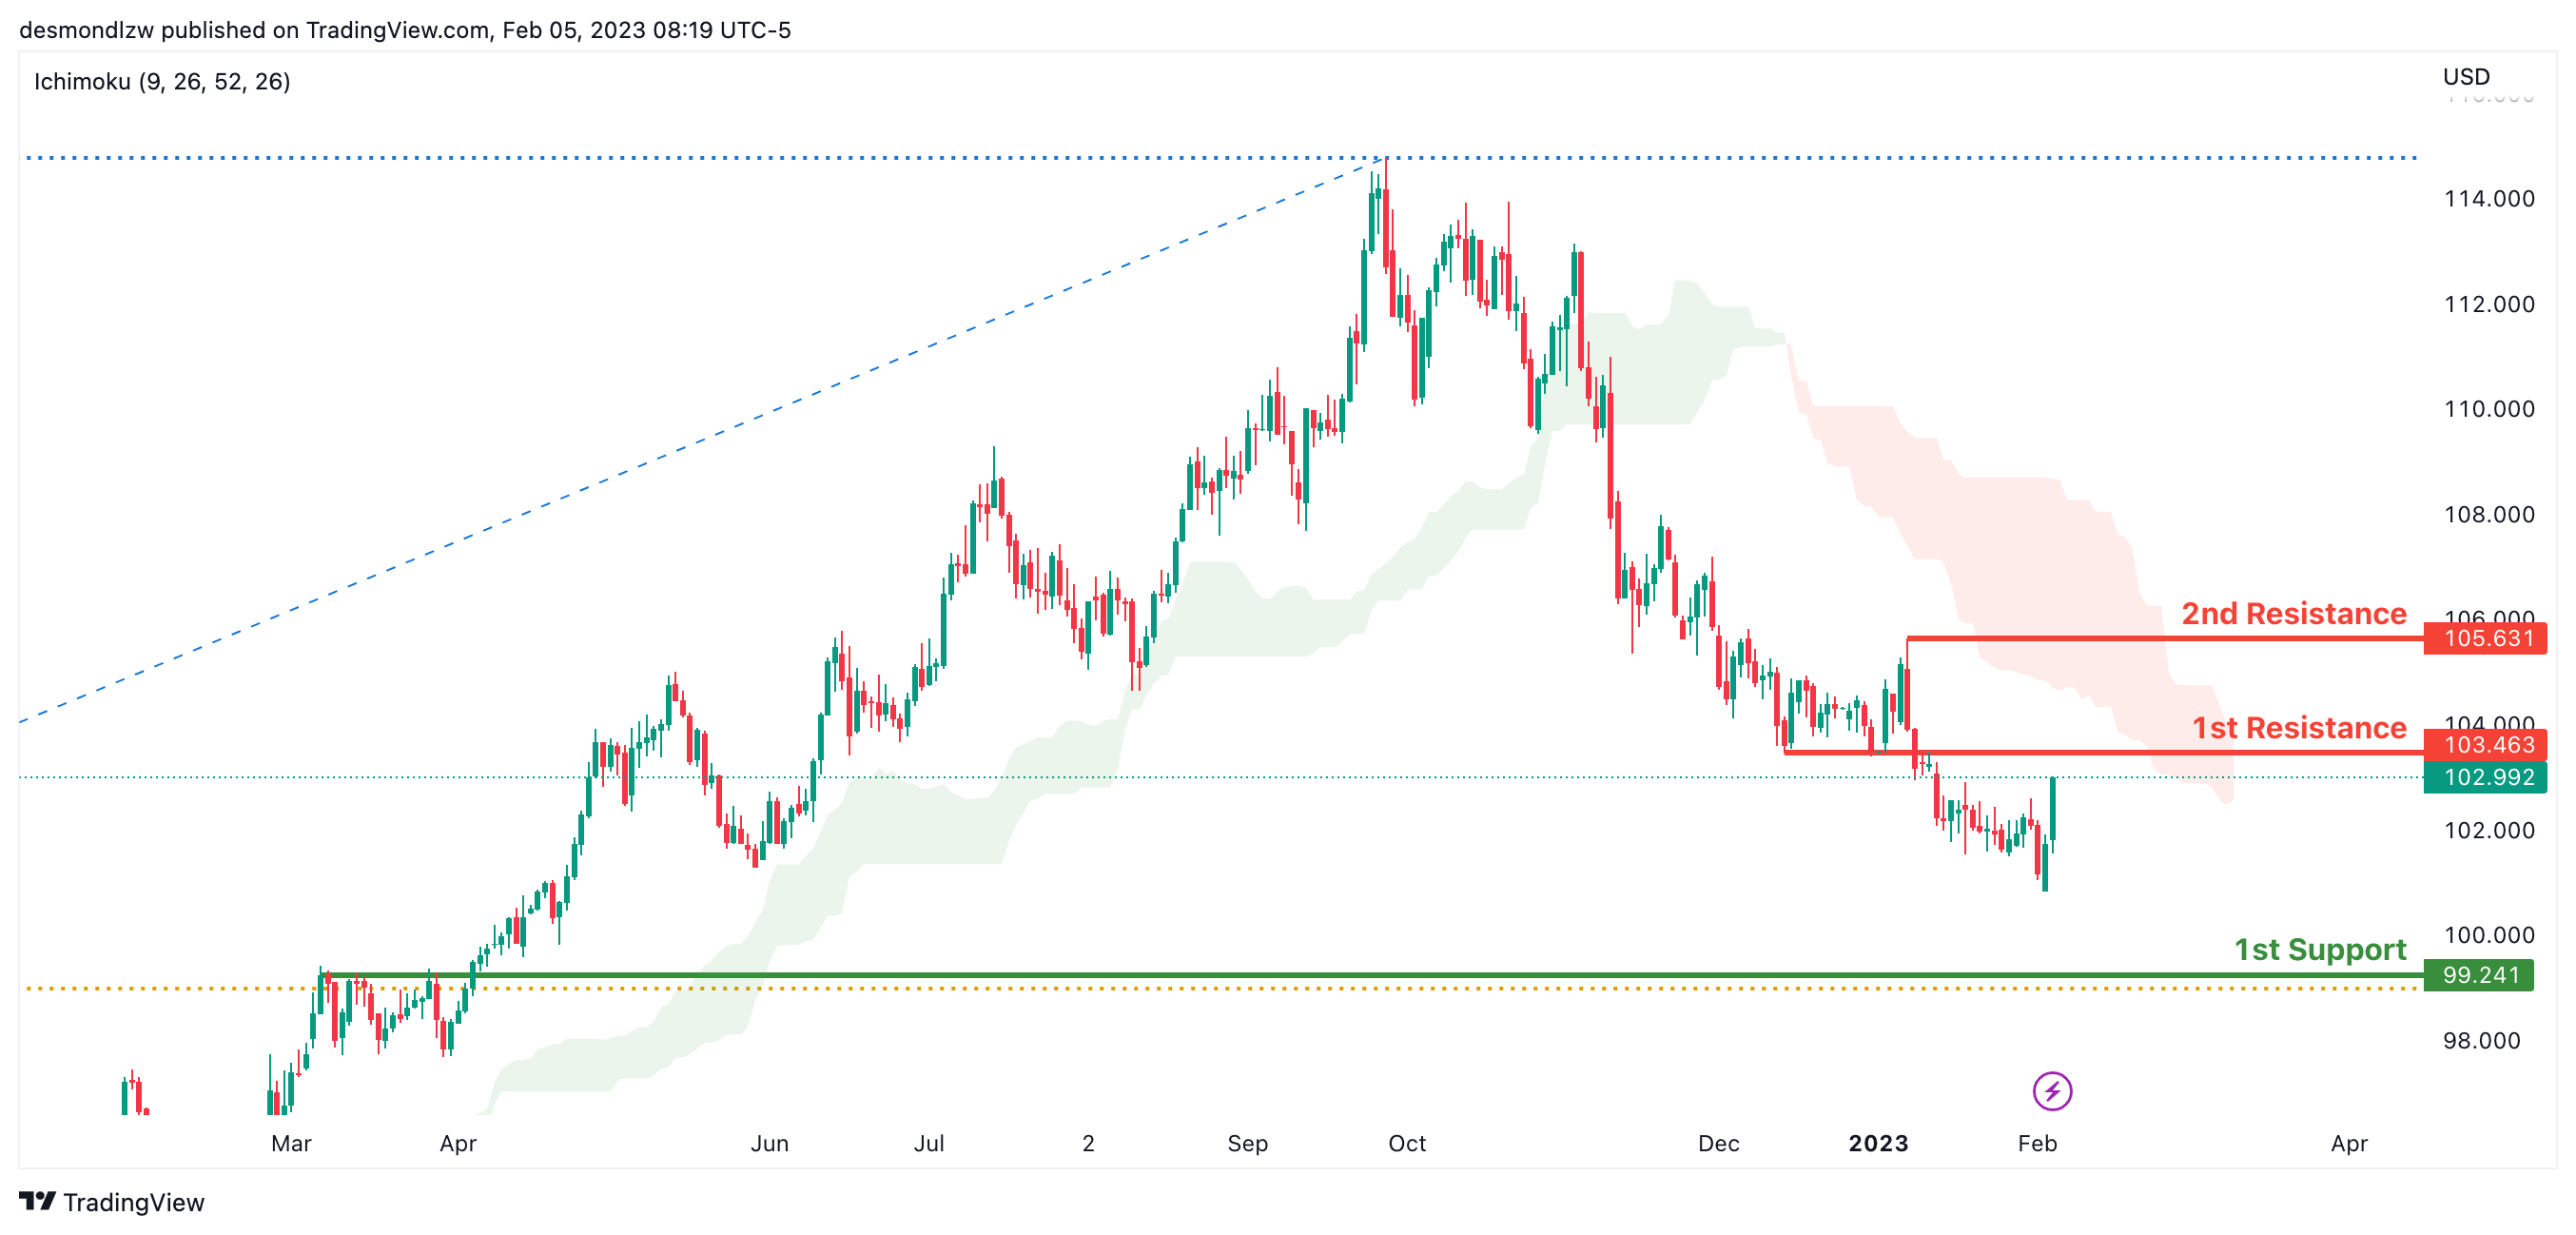
Looking at the Daily chart, my overall bias for DXY is bearish due to the current price crossing below the Ichimoku cloud, indicating a bearish market. If this bearish momentum continues, expect the price to possibly continue heading towards the 1st support at 99.241, where the 61.8% Fibonacci line and overlap support is. In an alternative scenario, price could head back up to retest the 1st resistance at 103.463, where the overlap resistance is.
Areas of consideration:
- H4 time frame, 1st resistance at 103.463
- H4 time frame, 1st support at 99.241
EUR/USD:
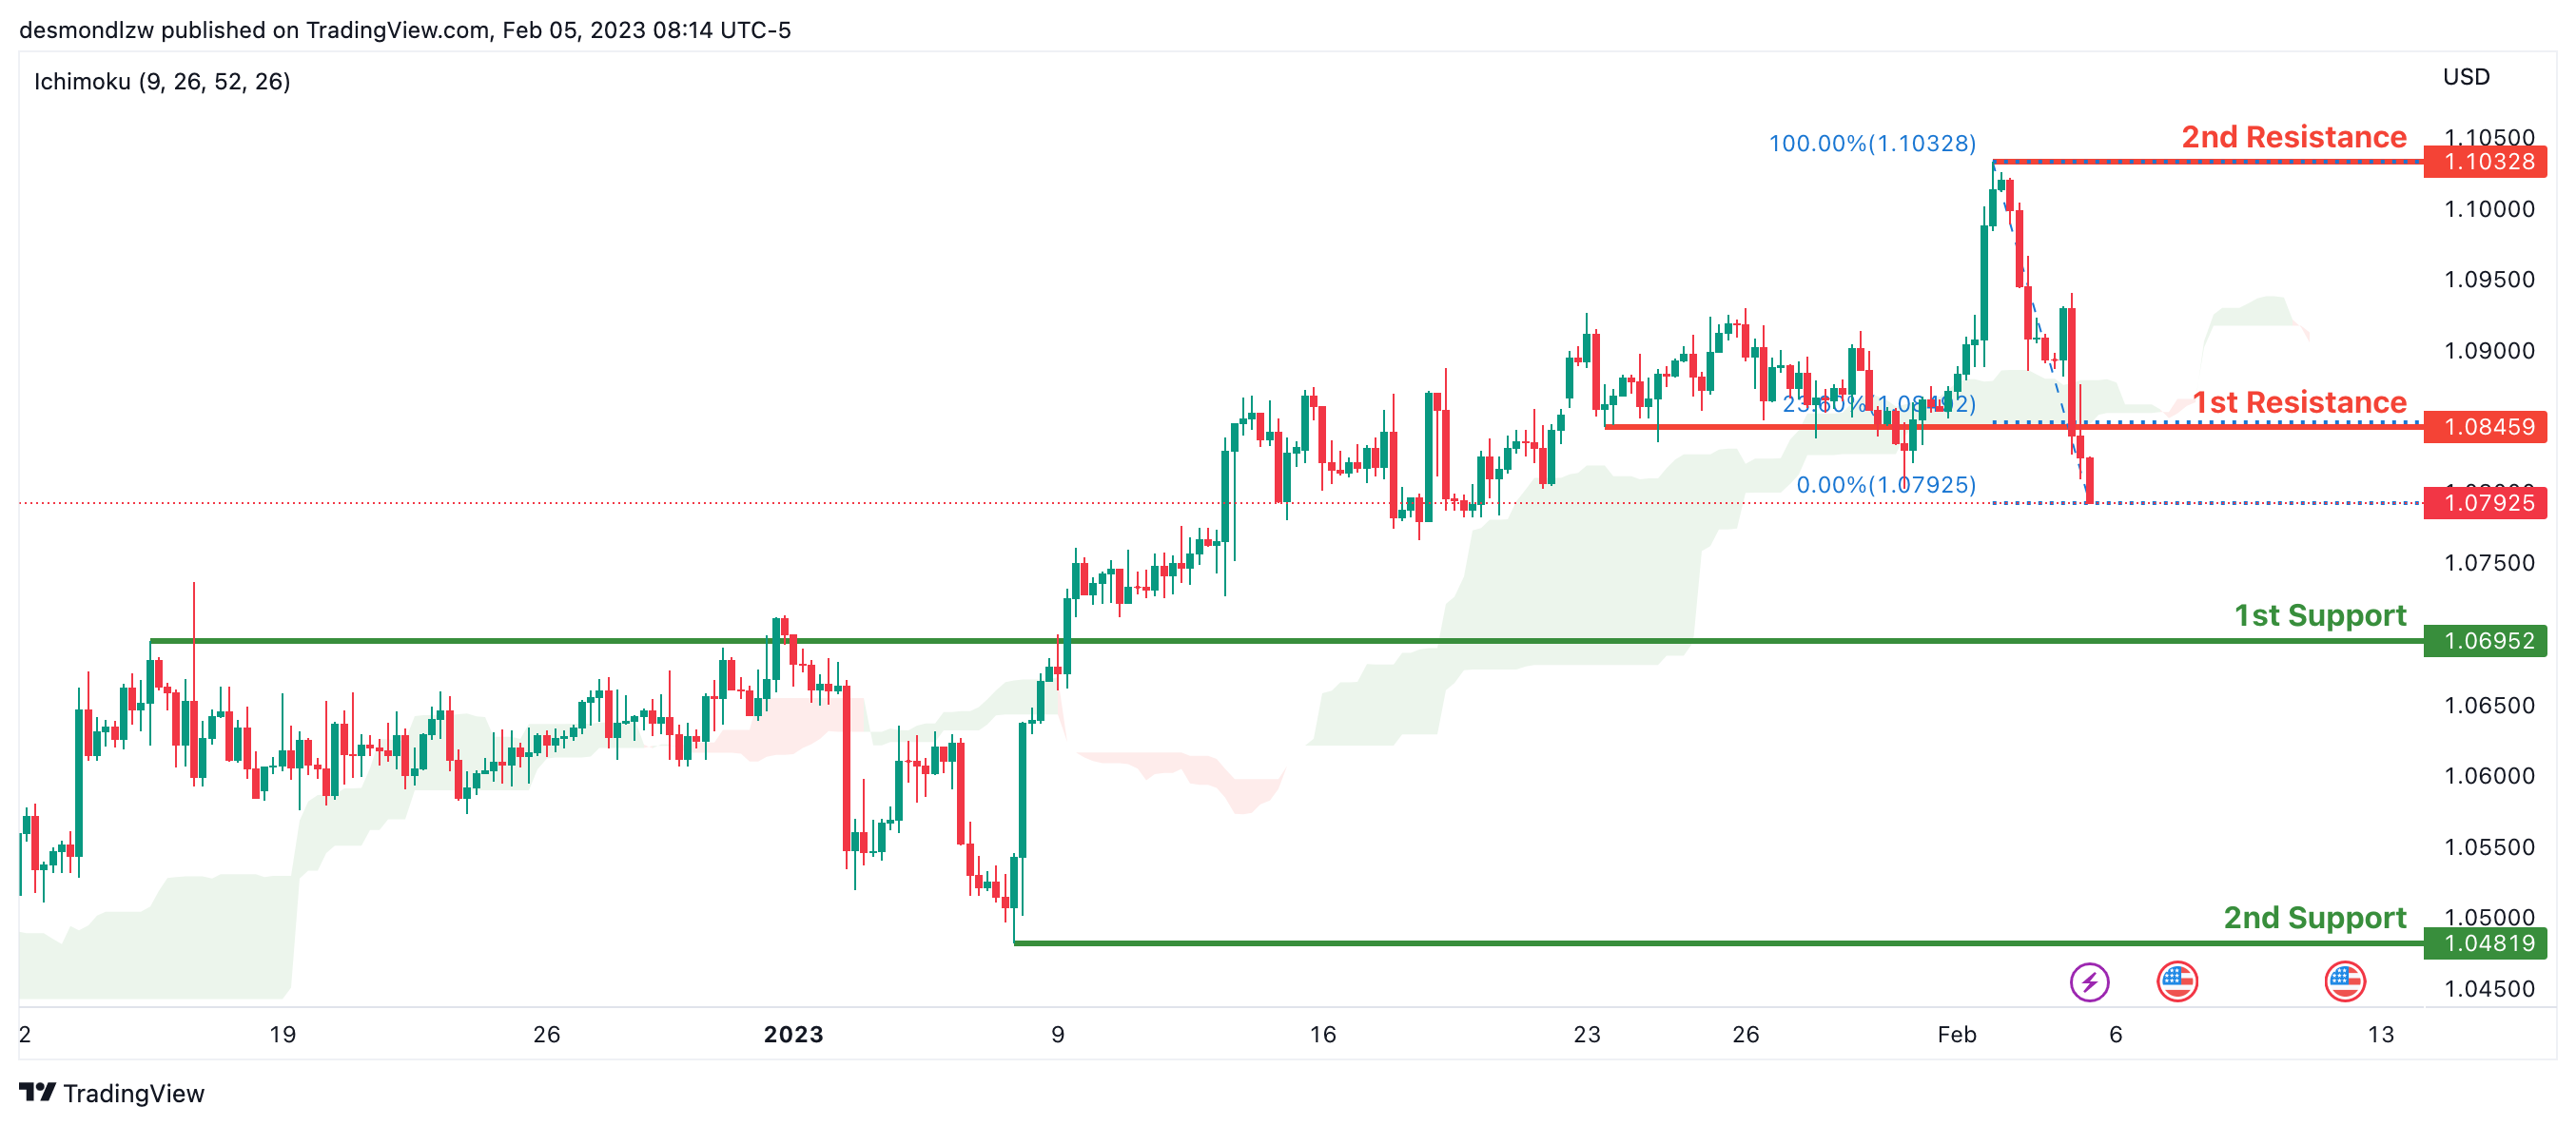
Looking at the H4 chart, my overall bias for EURUSD is bearish due to the current price crossing below the Ichimoku cloud, indicating a bearish market structure. If this bearish momentum continues, expect the price to possibly continue heading towards the 1st support at 1.06952, where the overlap support is. In an alternate scenario, price could possibly head back up to retest the 1st resistance at 1.08459, where the overlap resistance and 23.6% Fibonacci line is.
Areas of consideration :
- H4 1st resistance at 1.08459
- H4 1st support at 1.06952
GBP/USD:
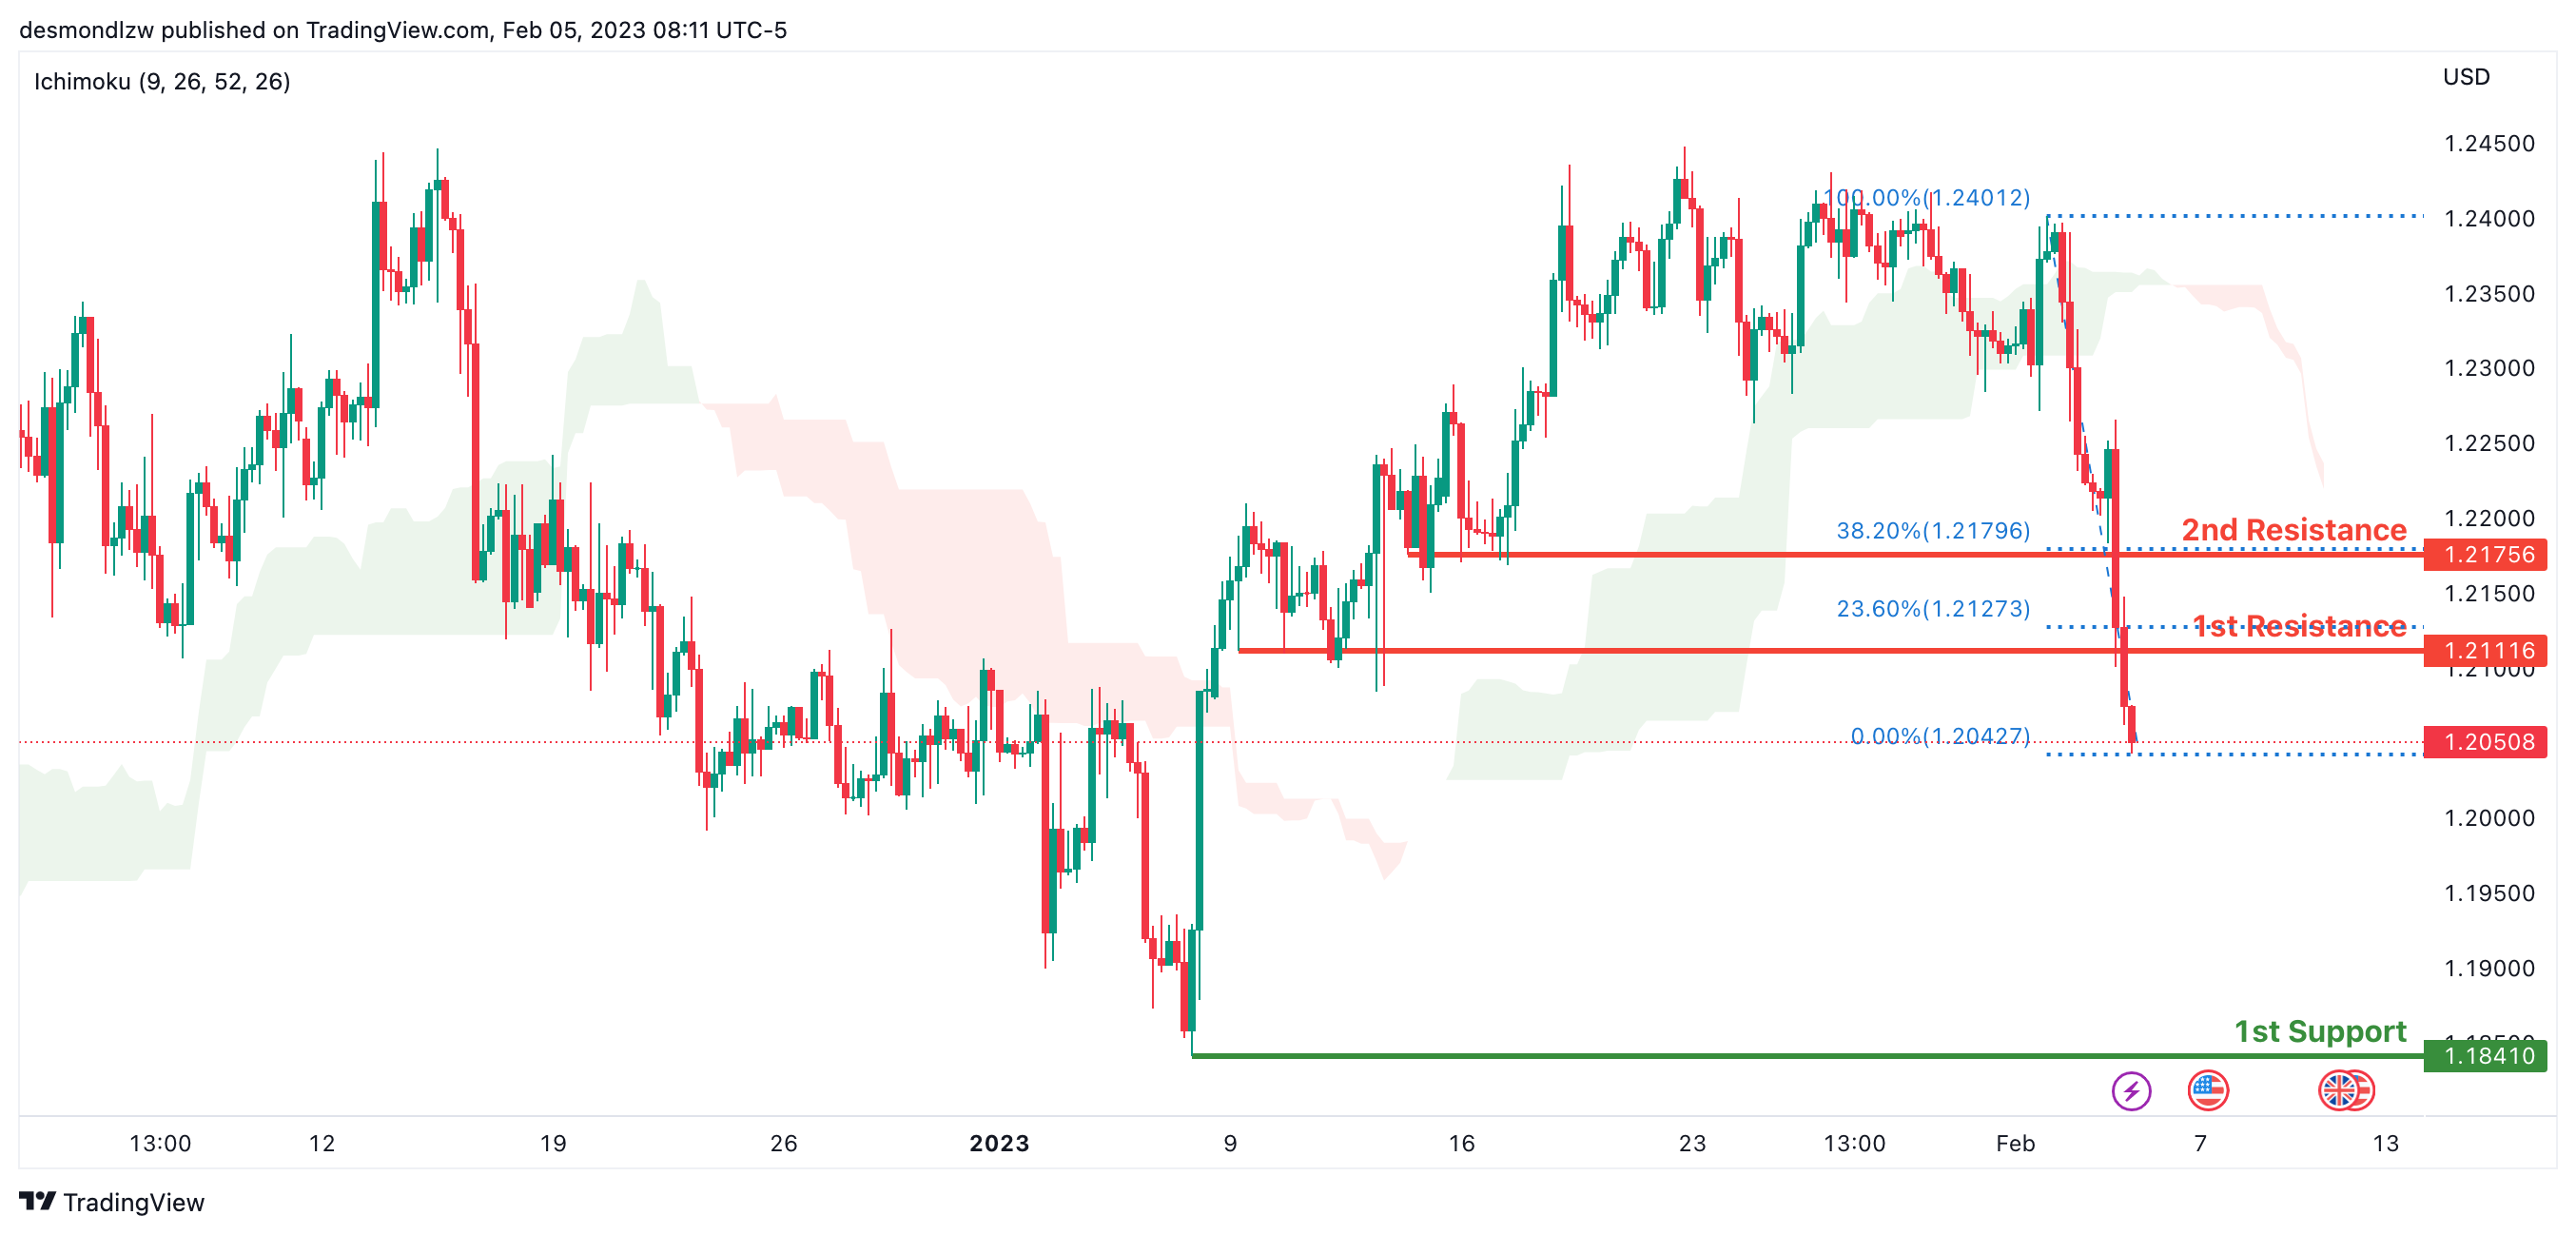
Looking at the H4 chart, my overall bias for GBPUSD is bearish due to the current price crossing below the Ichimoku cloud, indicating a bearish market. If this bearish momentum continues, expect the price to possibly continue to head towards the 1st support at 1.18410, where the previous swing low is. In an alternate scenario, price could head back up to retest the 1st resistance line at 1.21116 where the overlap resistance and 23.6% Fibonacci line is.
Areas of consideration:
- H4 1st resistance at 1.21116
- H4 1st support at 1.18410
USD/CHF:
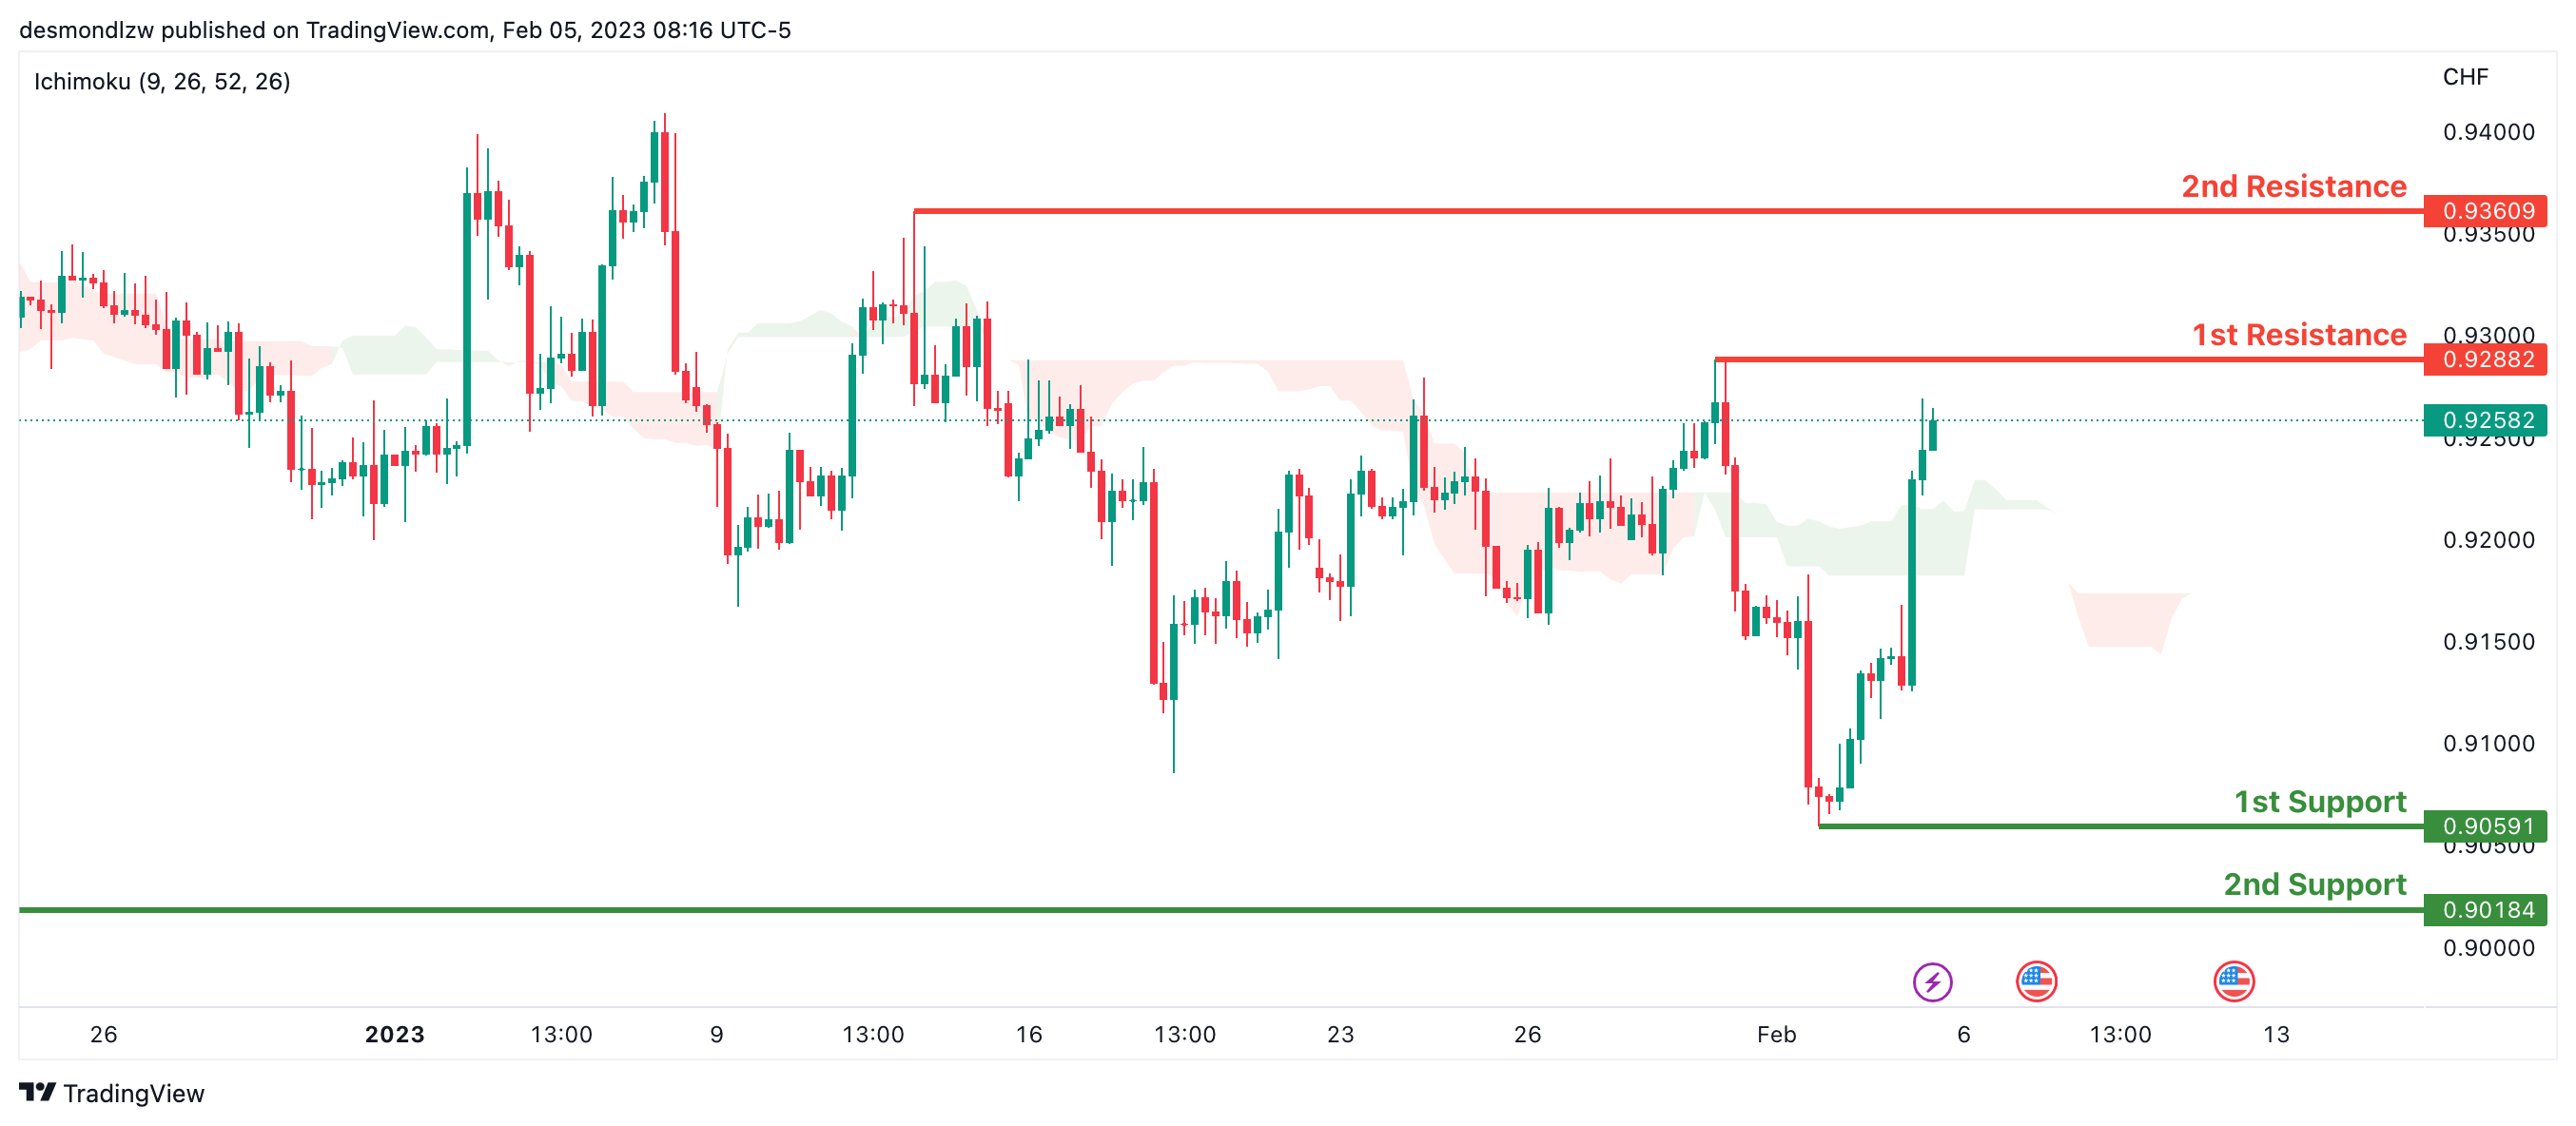
Looking at the H4 chart, my overall bias for USDCHF is bullish due to the current price being above the Ichimoku cloud, indicating a bullish market. If the current bullish trend continues, expect the price to possibly break the 1st resistance at 0.92882, where the previous swing high is, before heading towards the 2nd resistance at 0.93609 where the intermediate high is. In an alternative scenario, price could possibly head back down to retest the 1st support at 0.90591, where the recent swing low is.
Areas of consideration
- H4 1st support at 0.90591
- H4 1st resistance at 0.92882
- H4 2nd resistance at 0.93609
XAU/USD (GOLD):
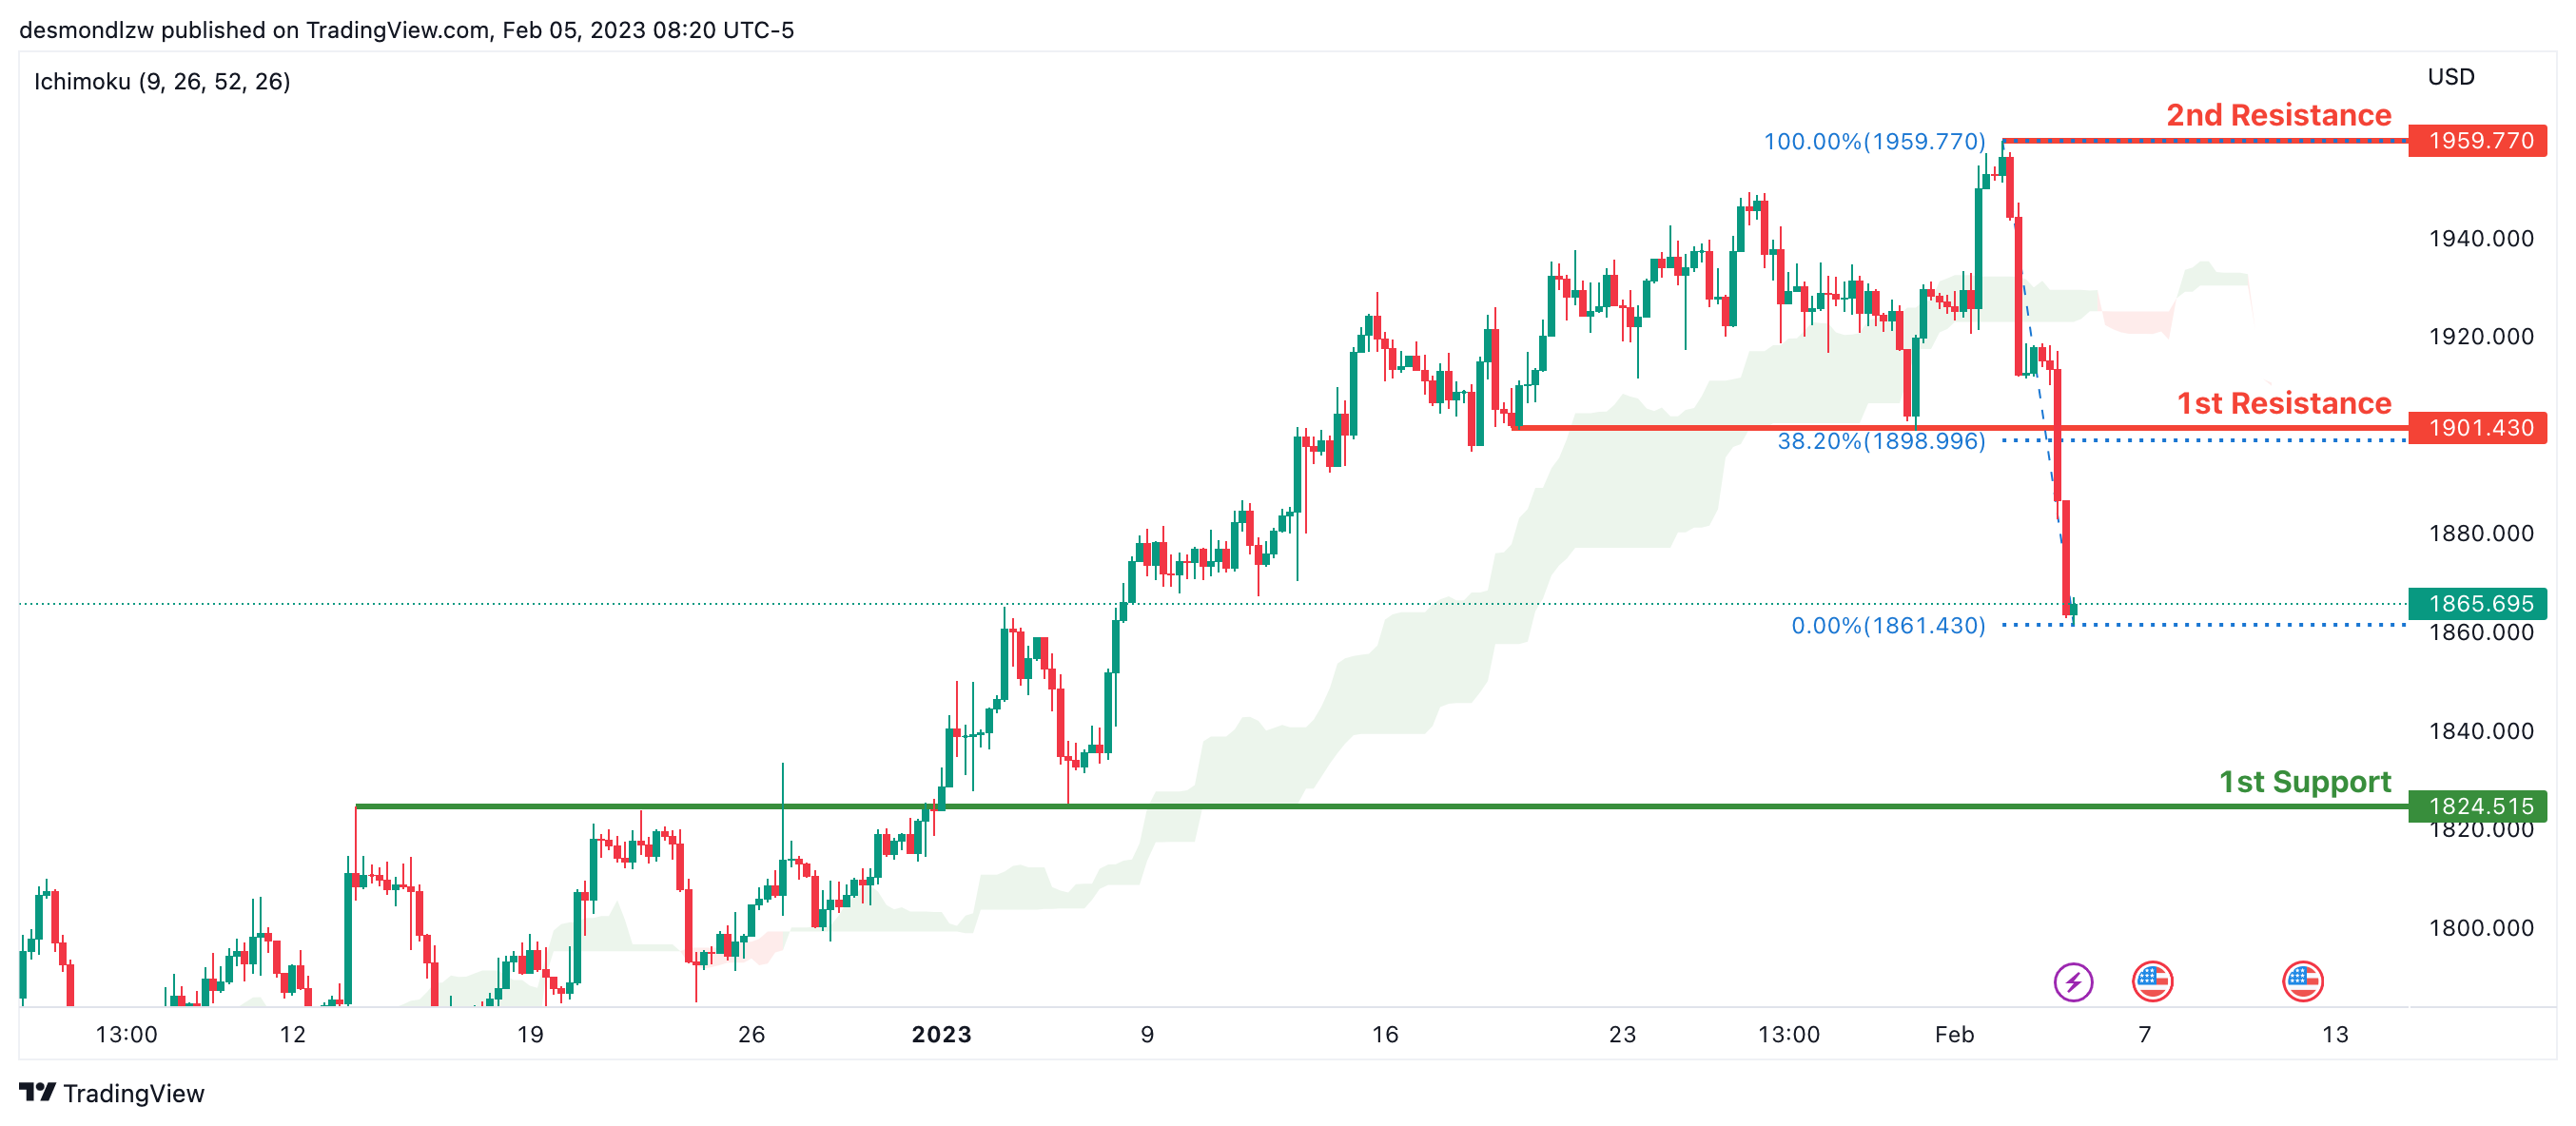
Looking at the H4 chart, my overall bias for XAUUSD is bearish due to the current price being below the Ichimoku cloud, indicating a bearish market. If this bearish momentum continues, expect the price to possibly continue heading towards the 1st support at 1824.515 where the overlap support is. In an alternative scenario, price could possibly head back up to retest the 1st resistance at 1901.430, where the overlap resistance and 38.2% Fibonacci line is.
Areas of consideration:
- H4 time frame, 1st resistance at 1901.430
- H4 time frame, 1st support at 1824.515
AUD/USD:
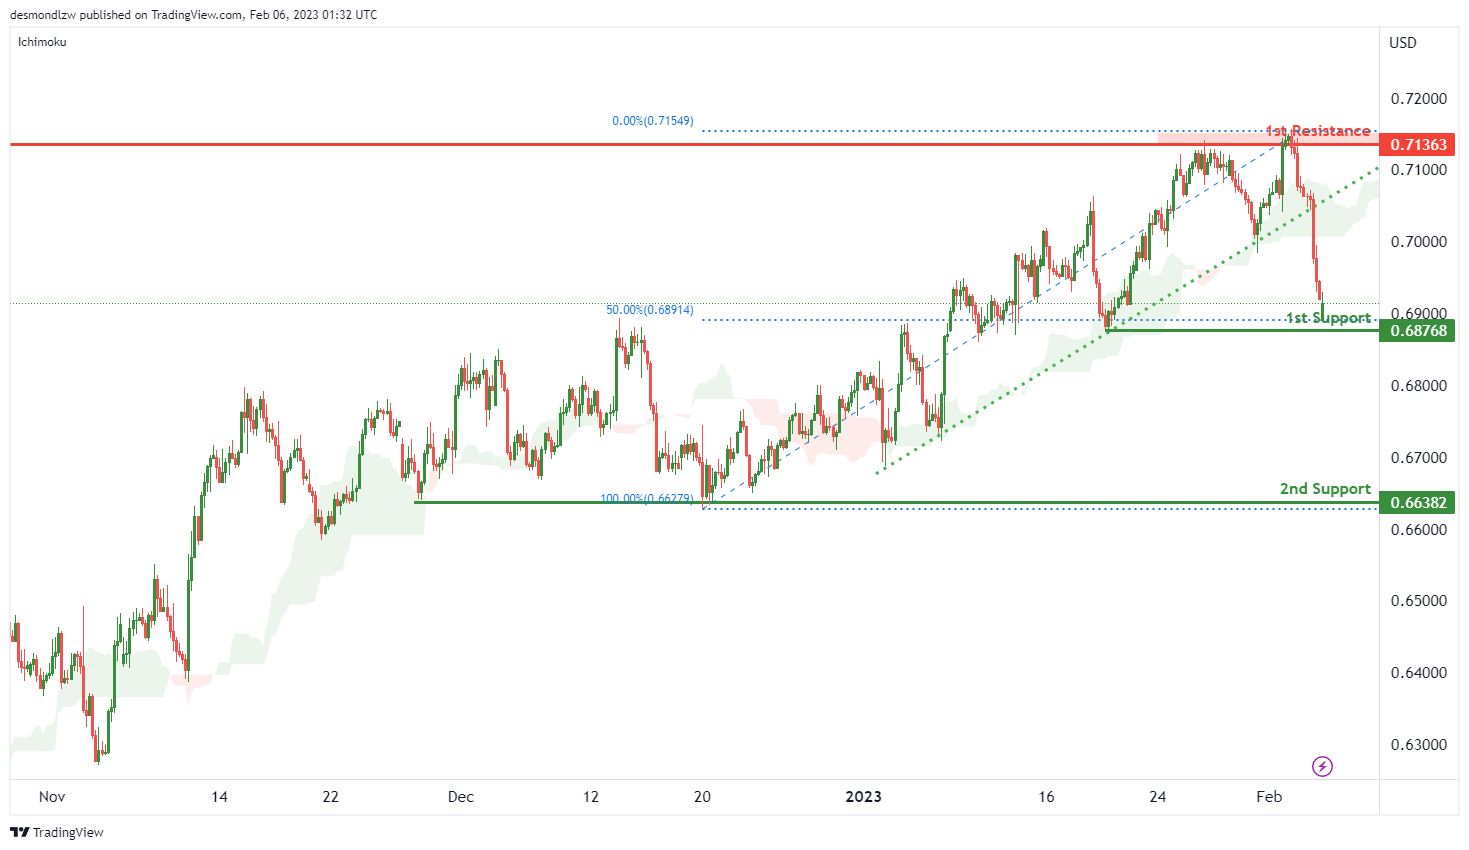
Looking at the H4 chart, my overall bias for AUDUSD is bearish due to the current price is below the Ichimoku cloud, and the ascending trend line has been broken, indicating a change of market structure.
The 1st support is at 0.68768 which in line with the 50% Fibonacci retracement. The 2nd support is at 0.66382 which is the overlap and recent swing low.
In an alternate scenario, the price could possibly go back up towards the 1st resistance level at 0.71363 which is the recent swing high.
Areas of consideration
- H4. 1st resistance at 0.71363
- H4, 1st support at 0.68768
- H4, 2nd support at 0.66382
NZD/USD:
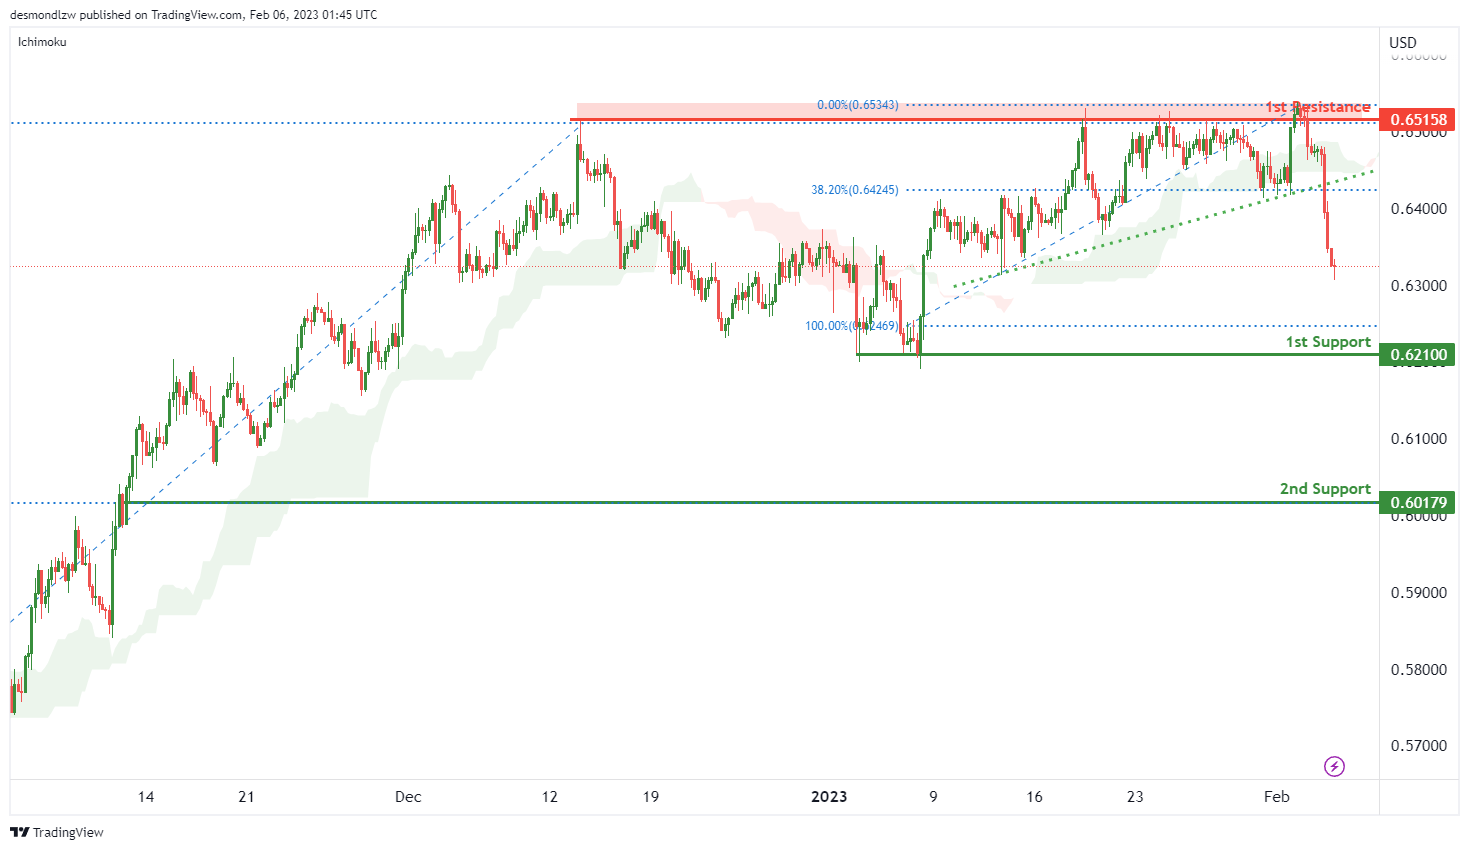
Looking at the H4 chart, my overall bias for NZDUSD is bearish, as the current price is below the Ichimoku Cloud, and the ascending trend line has been broken, indicating a change of market structure. Expecting the price go down towards the 1st support at 0.62100 which is the recent overlap swing low. The 2nd support is at 0.60179 which is in line with 50% Fibonacci retracement.
In an alternate scenario, price could possibly up towards the 1st resistance level at 0.65158 which is the recent overlap swing high.
Areas of consideration:
- H4 time frame, 2nd resistance at 0.65576
- H4 time frame, 1st resistance at 0.65158
- H4 time frame, 1st support at 0.64147
- H4 time frame, 2nd support at 0.62106
USD/CAD:
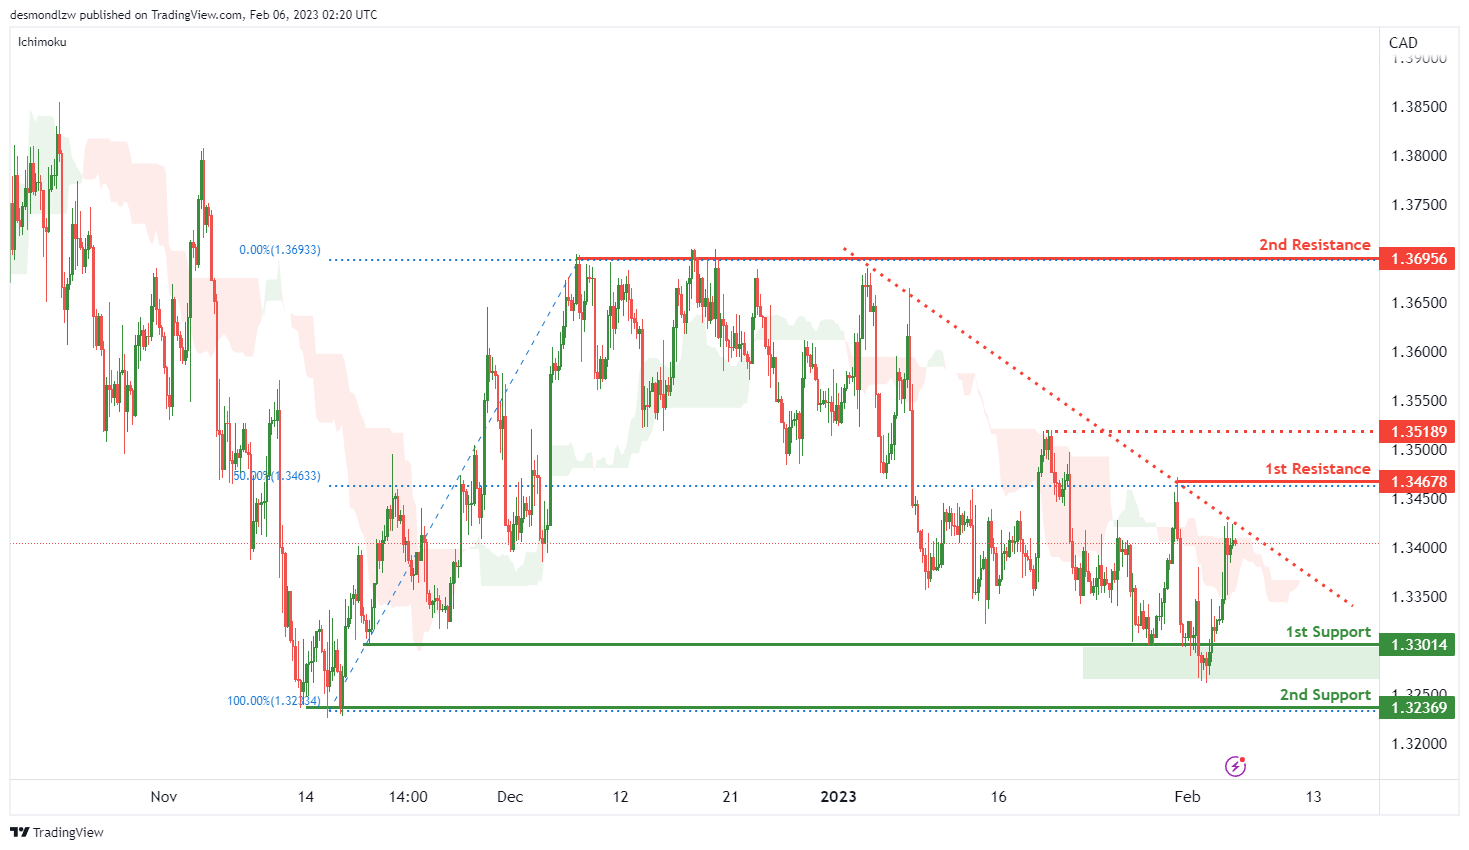
Looking at the H4 chart, my overall bias for USDCAD is slightly bearish, as there is a descending trend line. Expecting the current price is head down towards the 1st support at 1.33014. The 2nd support is at 1.32369 which is the previous swing low.
In an alternative scenario, the price could possibly head up to the 1st resistance at 1.34678 which is the recent swing high and also in line with the 50% Fibonacci retracement. The 2nd resistance is at 1.36933 which the previous swing high.
Areas of consideration:
- H4 time frame, 2nd resistance at 1.36933
- H4 time frame, 1st resistance at 1.34678
- H4 time frame, 1st support at 1.33014
- H4 time frame, 2nd support at 1.32369
OIL:
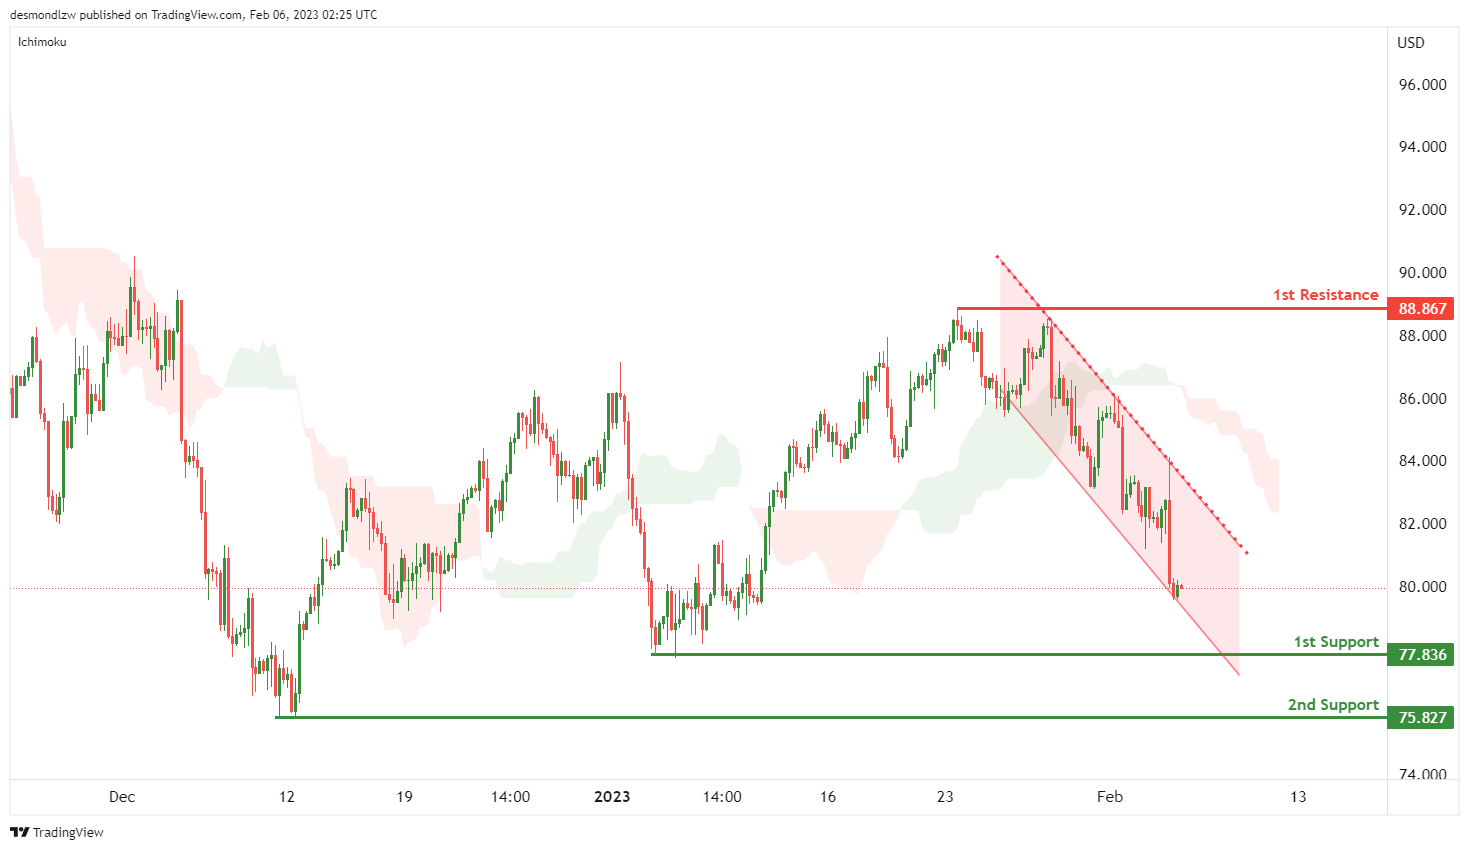
Looking at the H4 chart, my overall bias for BOC is bearish.as the current price is below the Ichimoku cloud, and a descending channel add confluence to my bias. Expecting the pricehead down towards the 1st support level at 77.836, before it heads down to the 2nd support at 75.827 which is the recent swing low.
In an alternate scenario, the price could possibly head up towards the 1st resistance level at 88.867 which is the recent swing high.
Areas of consideration:
- H4 time frame, 1st resistance at 88.867
- H4 time frame,1st support at 77.836
- H4 time frame, 2nd support at 75.827
Dow Jones Industrial Average:
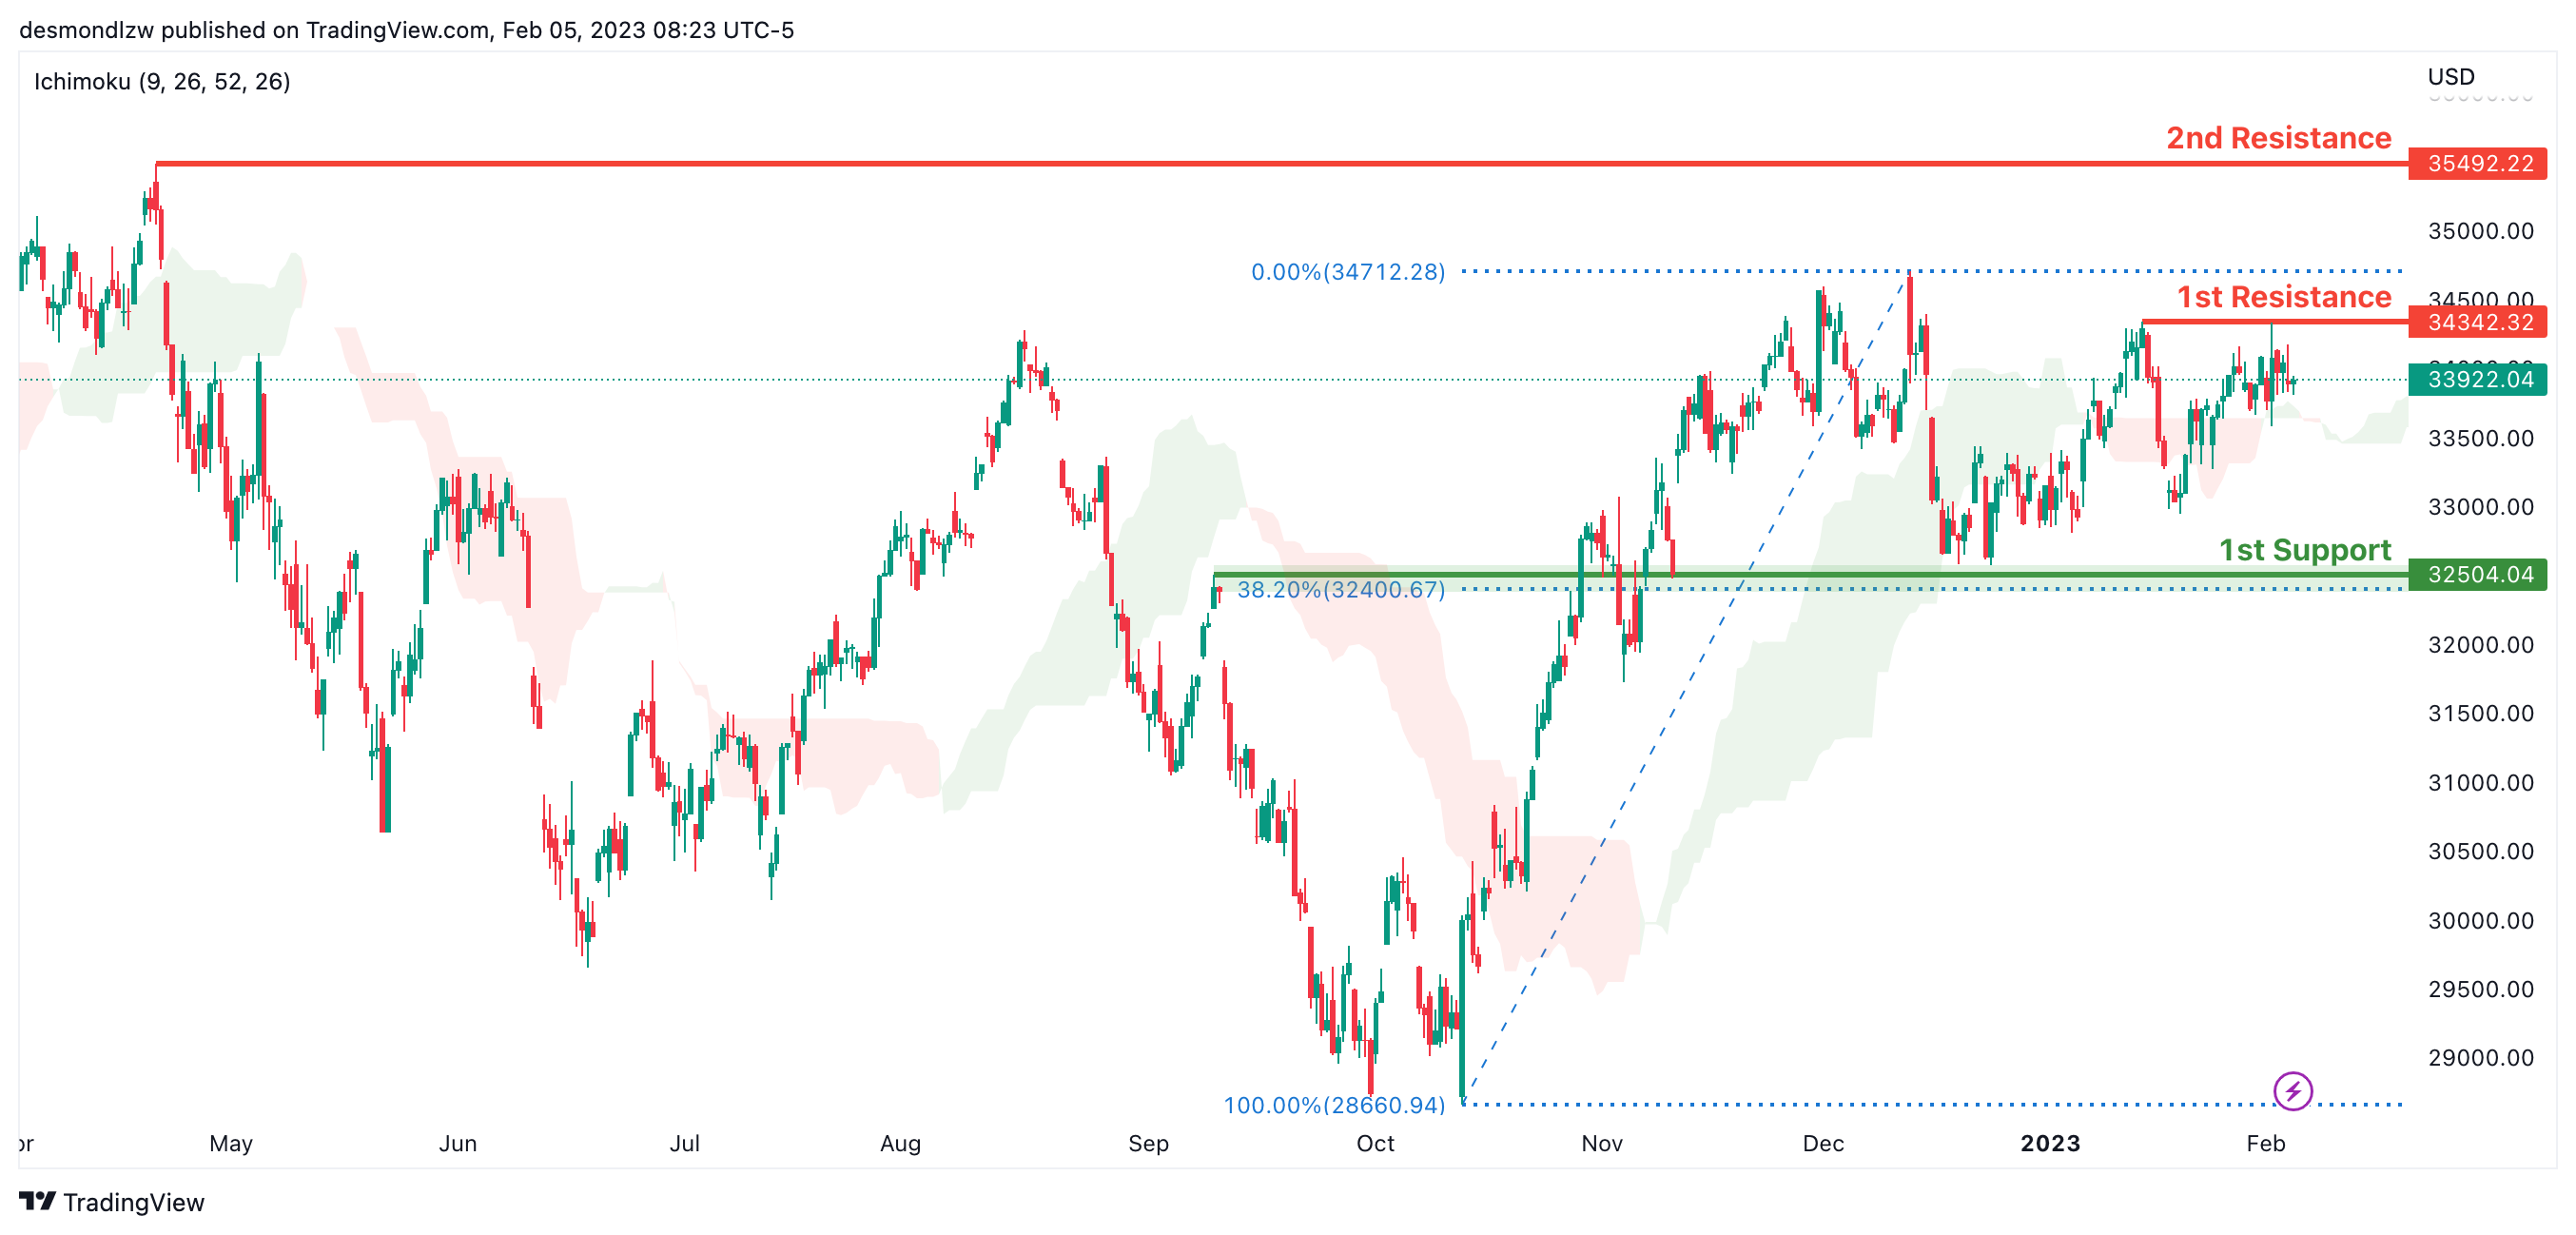
On the H4 chart, the overall bias for DJI is bullish. To add confluence to this, the price is crossing above the Ichimoku cloud which indicates a bullish market. If this bullish momentum continues, expect the price to possibly continue heading towards the 1st resistance line at 34342.32, where the recent swing high is. In an alternative scenario, price could possibly head back down towards the 1st support at 32581.97, slightly above where the 38.2% Fibonacci line is.
Areas of consideration:
- H4 time frame, 1st support at 32581.97
- H4 time frame, 1st Resistance at 34342.32
DAX:
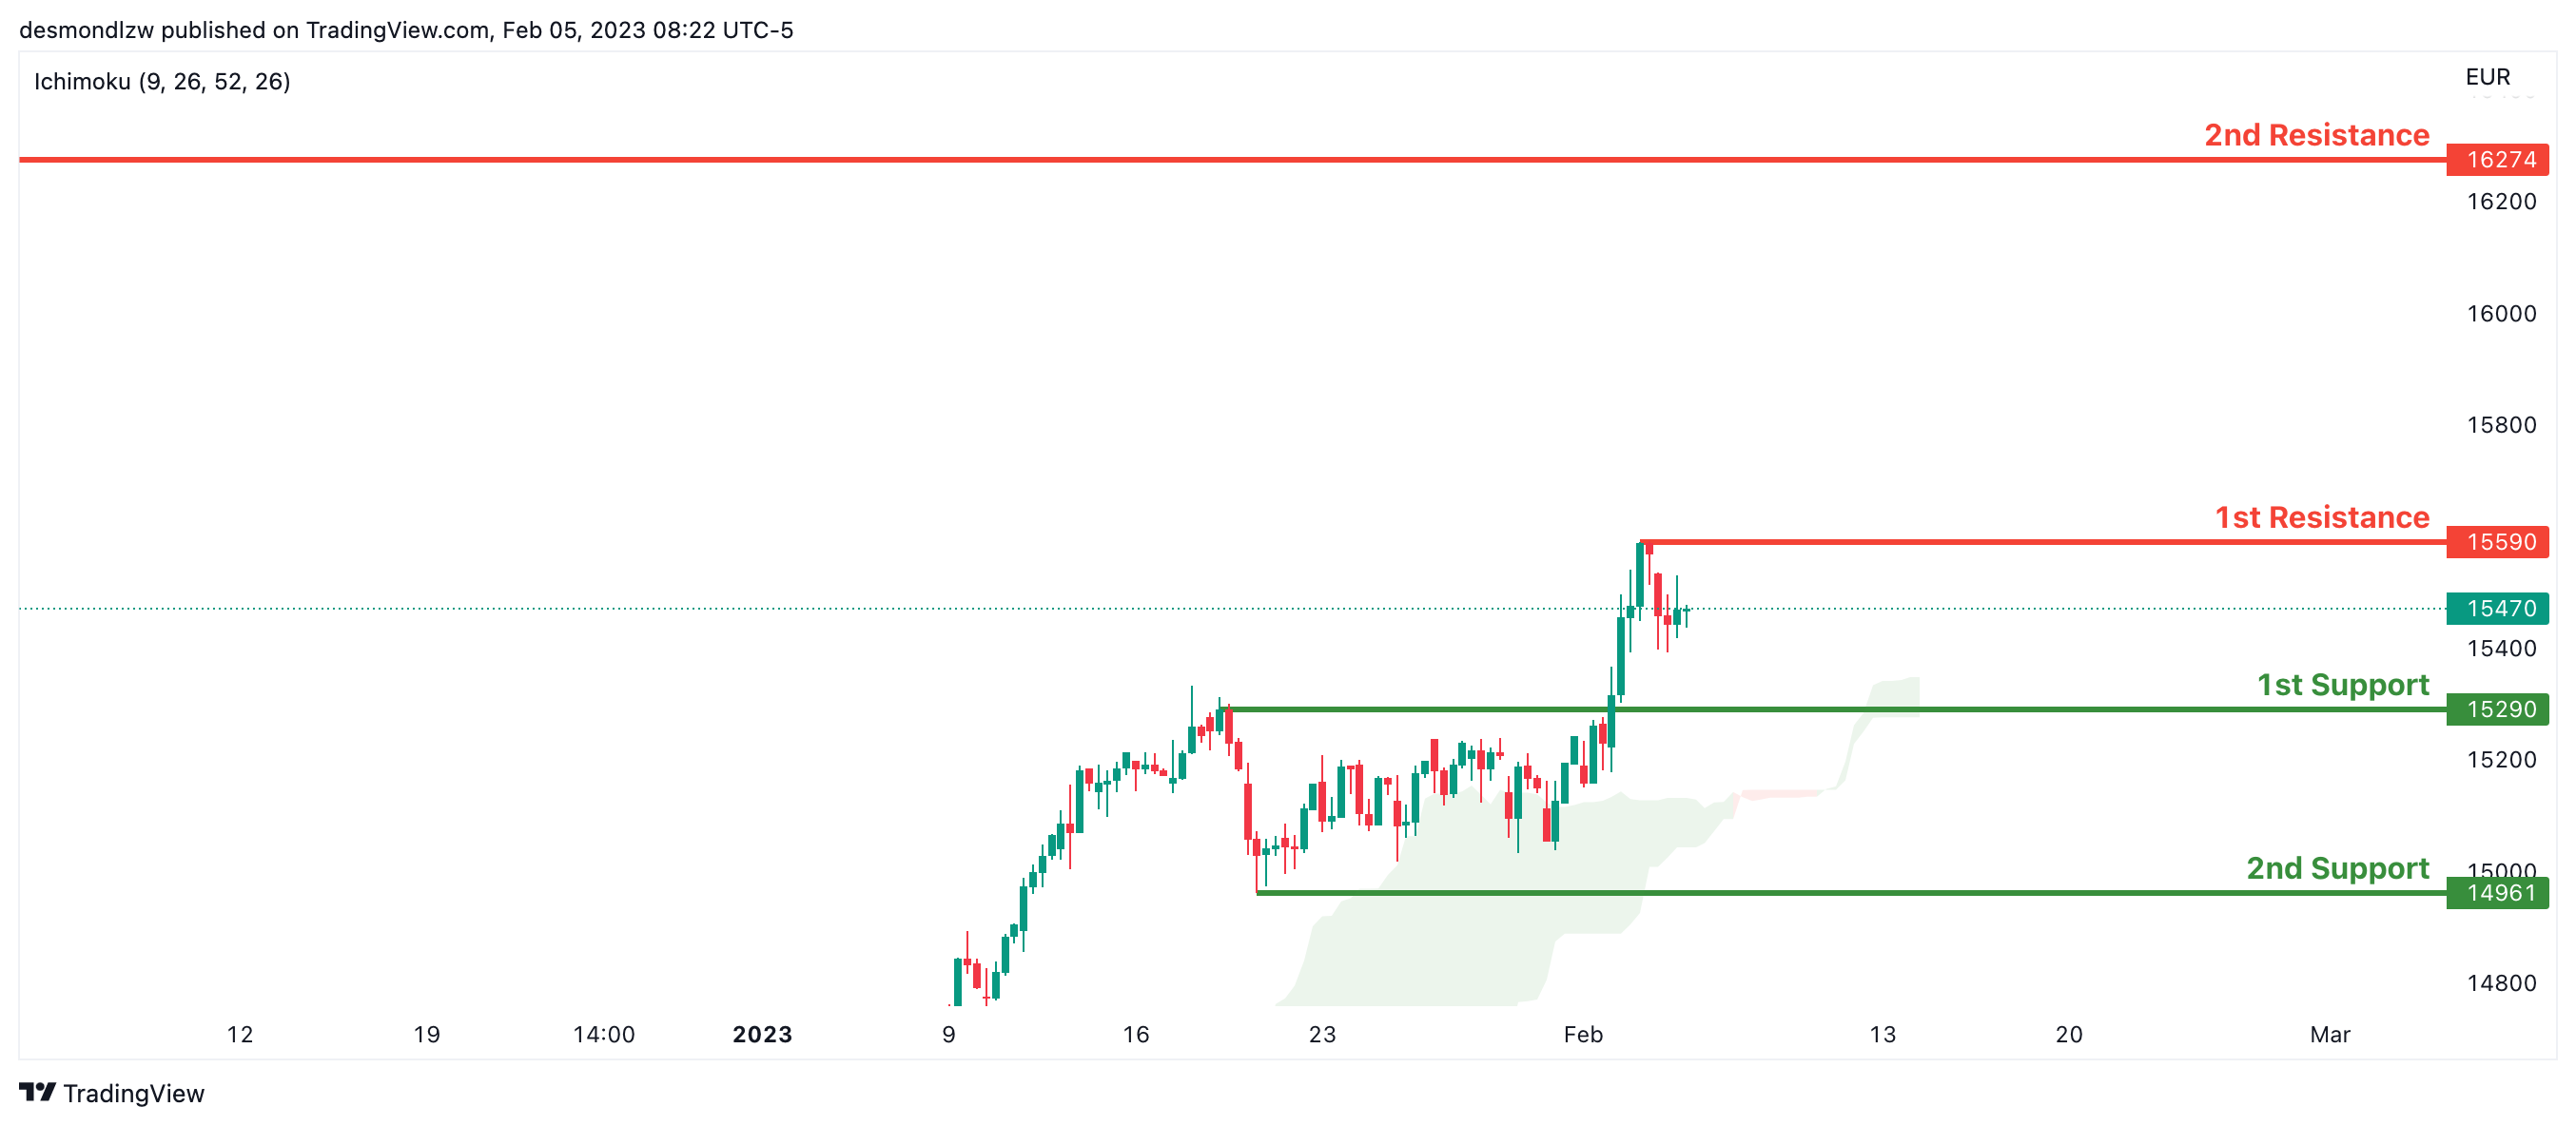
Looking at the H4 chart, my overall bias for DAX is bullish due to the current price crossing above the Ichimoku cloud, indicating a bullish market. If this bullish momentum continues, expect the price to possibly head towards the 1st resistance line at 15590, where the recent high is. In an alternative scenario, price could possibly head down to retest the 1st support at 15290, where the overlap support is.
Areas of consideration:
- H4 time frame, 1st resistance is at 15590
- H4 time frame, 1st support is at 15290
ETHUSD:
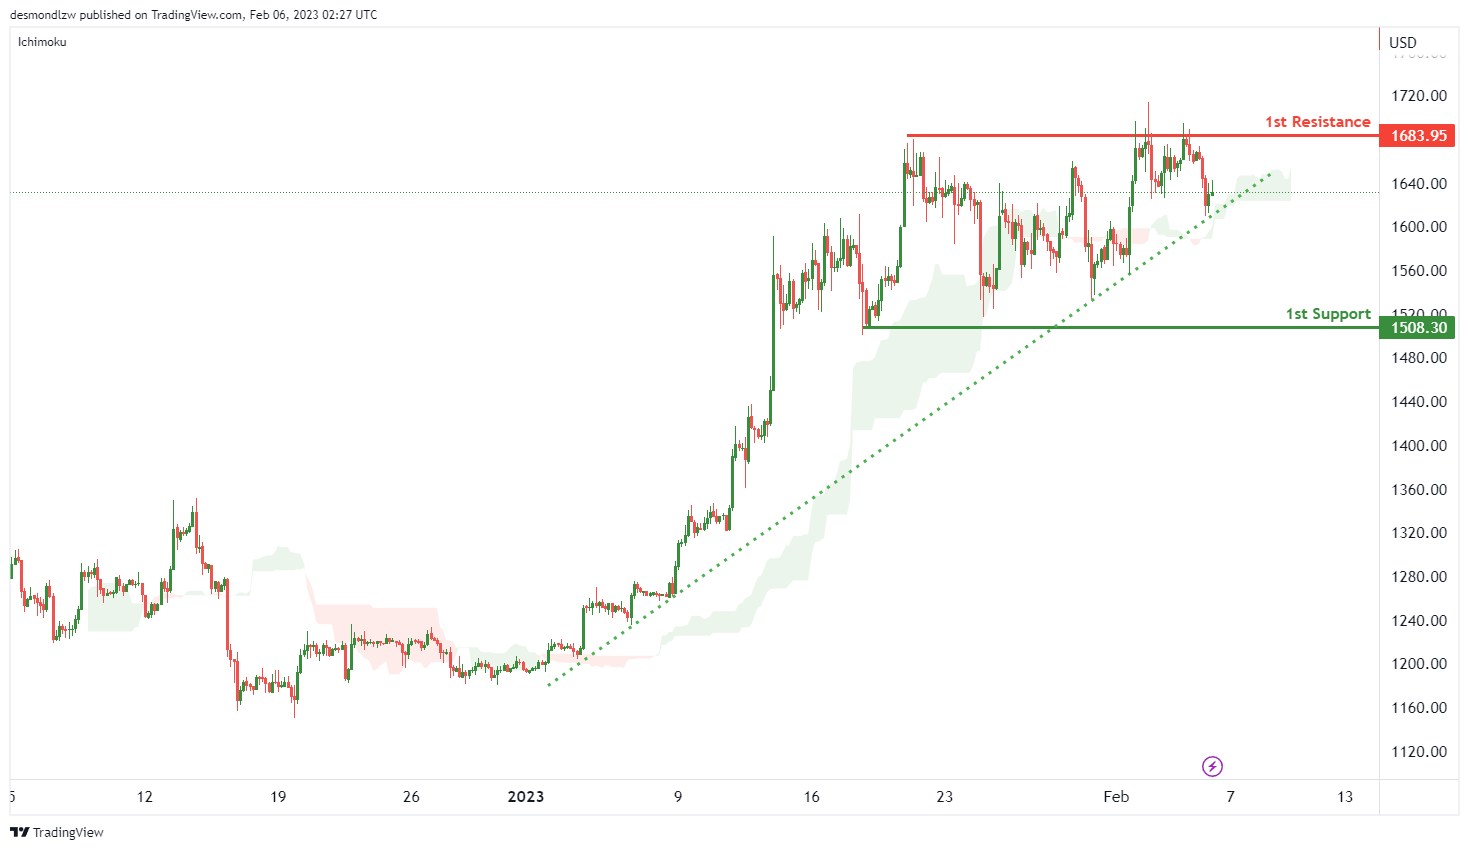
Looking at the H4 chart, my overall bias for ETHUSD is slightly bullish, the strong ascending trend line has been created. Expecting the price to break the 1st resistance line at 1683.95 which is the recent swing high, before it heads towards the 2nd resistance 1784.57.
In an alternate scenario, the price may go down to the 1st support at 1508.30 which is the recent swing low.
Areas of consideration:
- H4 time frame, 2nd resistance of 1784.57
- H4 time frame, 1st resistance of 1683.95
- H4 time frame, 1st support at 1508.30
BTCUSD:
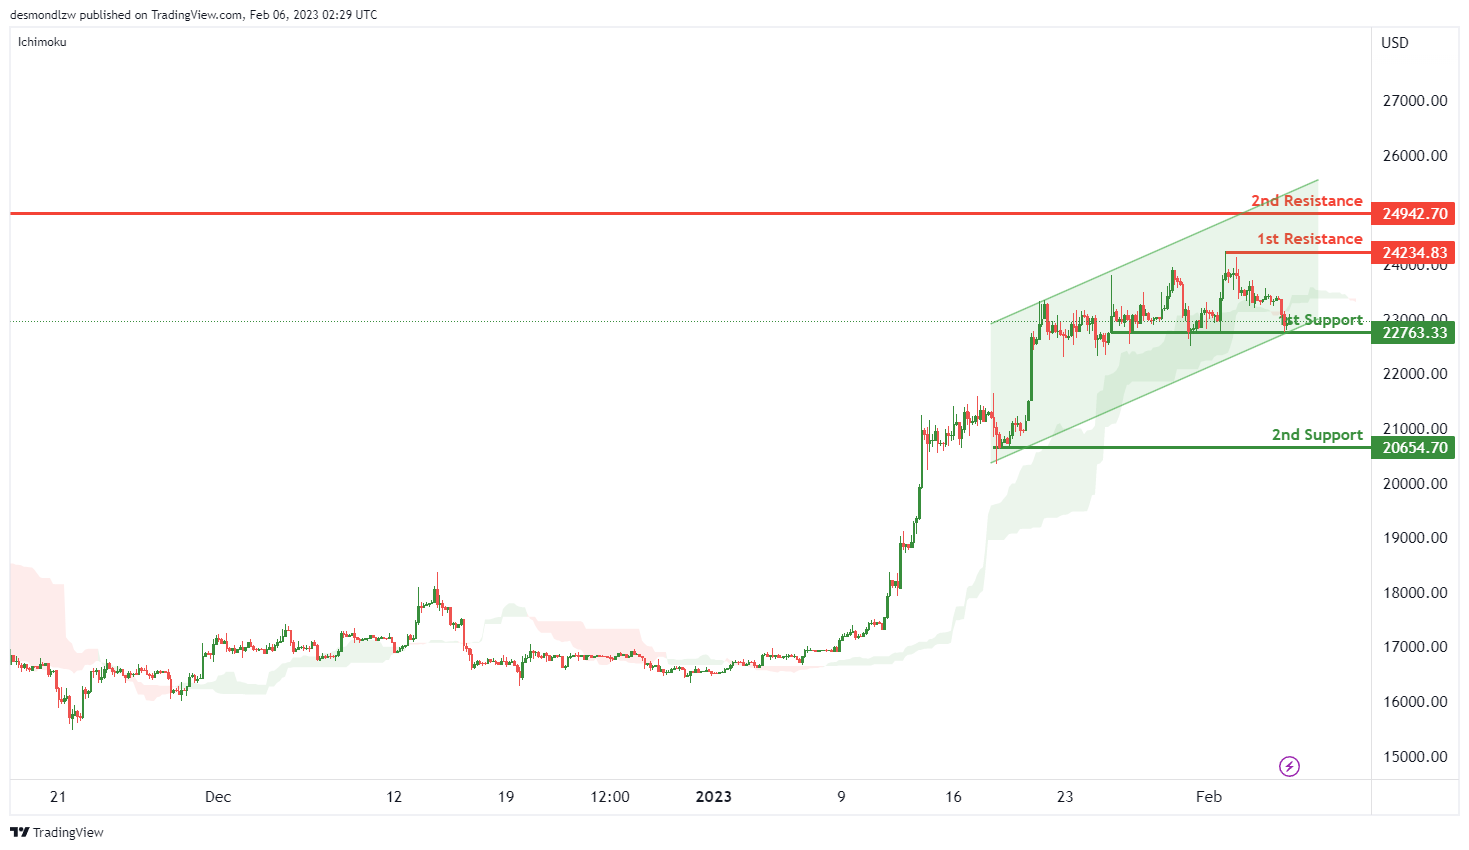
Looking at the H4 chart, my overall bias for BTCUSD is bullish. An ascending channel was created, expecting the price to break the 1st resistance line at 24234.83 which is the recent overlap resistance, before heading towards the 2nd resistance at 24942.70 which is the previous swing high.
In an alternative scenario, the price could possibly head down to the 1st support at 22763.33 which is the overlap support.
Areas of consideration:
- H4 time frame, 2nd resistance 24942.70
- H4 time frame, 1st resistance 24234.83
- H4 time frame, 1st support at 22763.33
S&P 500:
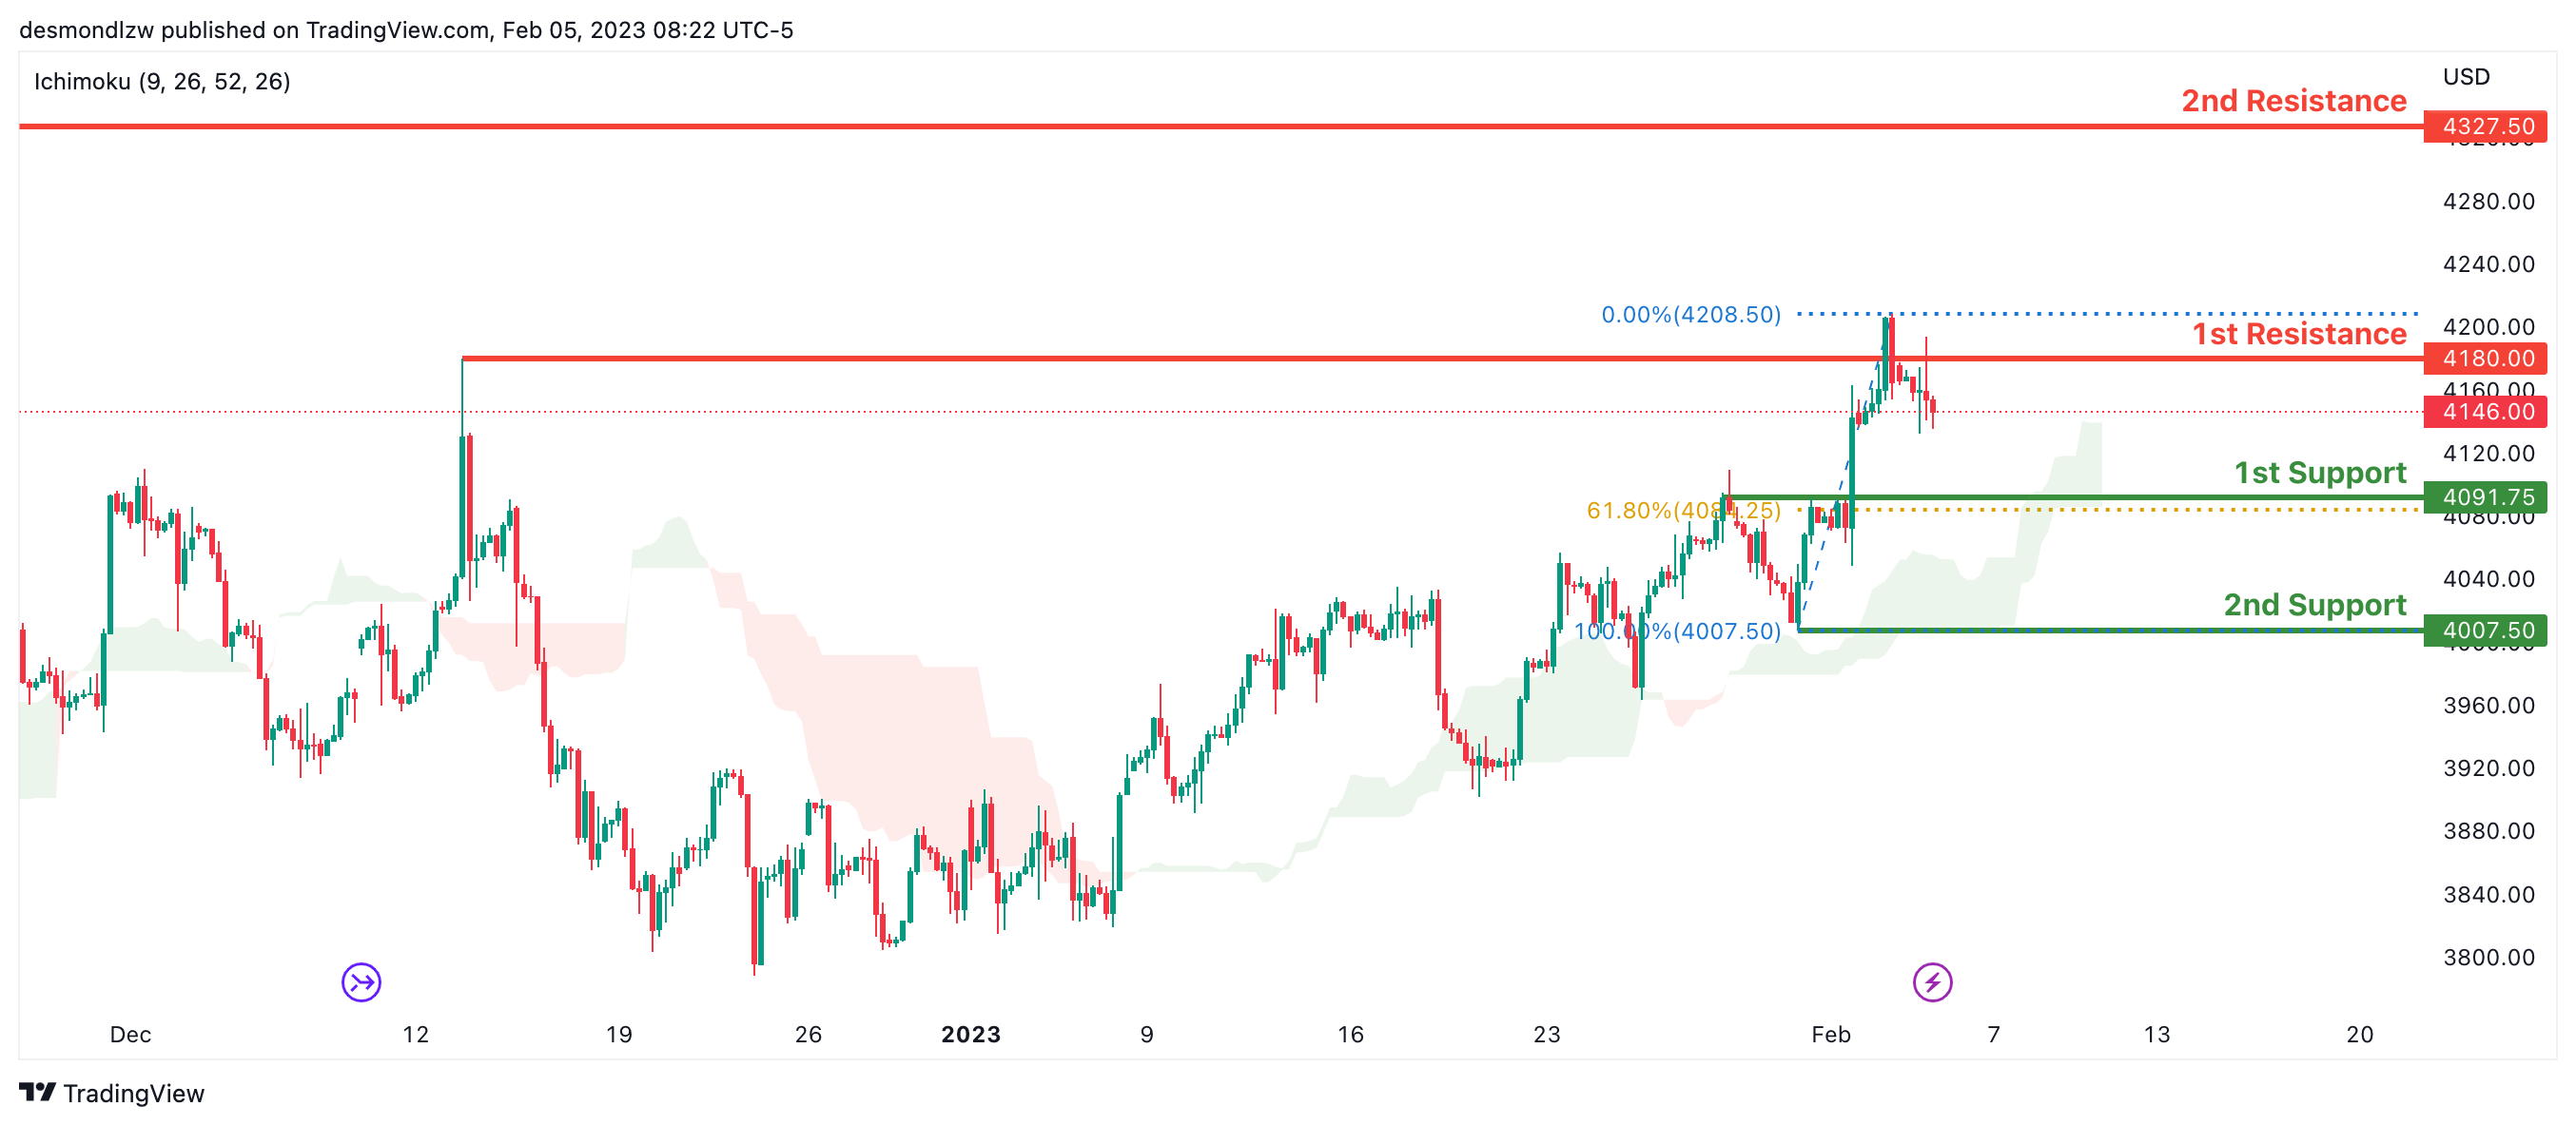
Looking at the H4 chart, my overall bias for S&P500 is bullish due to the current price being above the Ichimoku cloud, indicating a bullish market. If this bullish momentum continues, expect the price to possibly break the 1st resistance at 4180.00, where the previous swing high is., before heading towards the 2nd resistance at 4327.50 where the previous swing high is, In an alternative scenario, price could possibly head back down to retest the 1st support at 4091.75, where the 50% Fibonacci line is.
Areas of consideration:
- H4 time frame, 1st support at 4091.75
- H4 time frame, 1st resistance at 44180.00
- H4 time frame, 2nd resistance at 4327.50
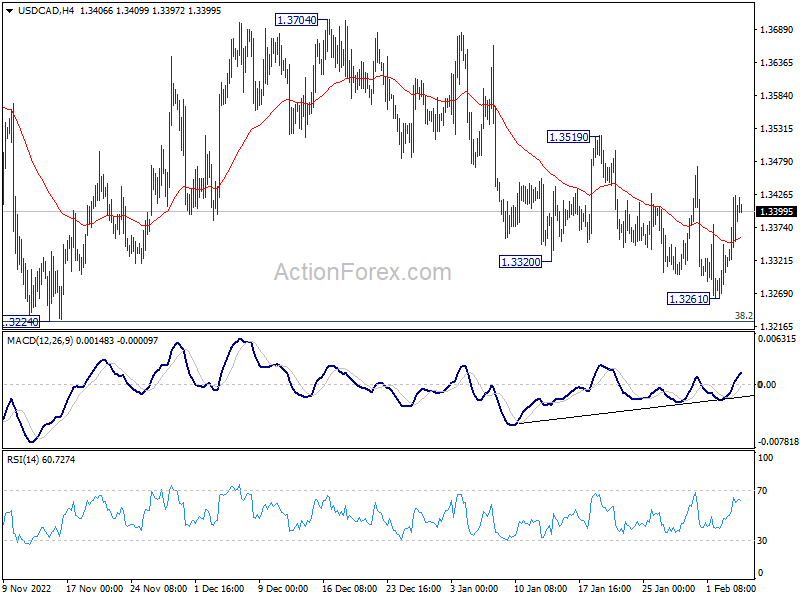
USD/CAD Daily Outlook
Daily Pivots: (S1) 1.3335; (P) 1.3381; (R1) 1.3448; More....
Intraday bias in USD/CAD stays neutral for the moment. While the choppy fall from 1.3704 might still extend lower, strong support is expected to 1.3224 key support to bring rebound. On the upside, above 1.3519 minor resistance will confirm short term bottoming turn intraday bias back to the upside 1.3704 resistance. However, decisive break of 1.3224 would carry larger bearish implication.
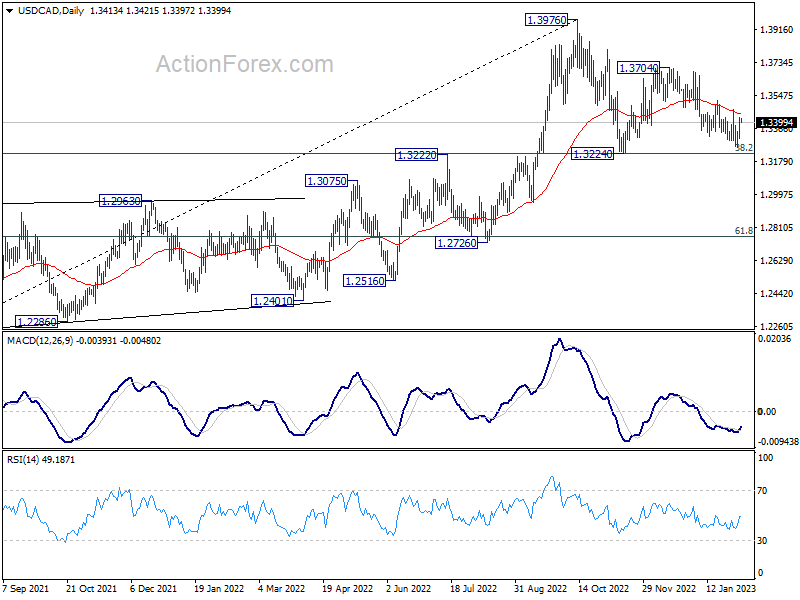
In the bigger picture, as long as 1.3222 cluster support (38.2% retracement of 1.2005 to 1.3976 at 1.3223) holds, larger up trend from 1.2005 (2021 low) is still expected to resume through 1.3976 high at a later stage. However, firm break of 1.3222/3 will indicate that the trend might have reversed. Deeper fall would be seen to next cluster support at 1.2726 (61.8% retracement at 1.2758).
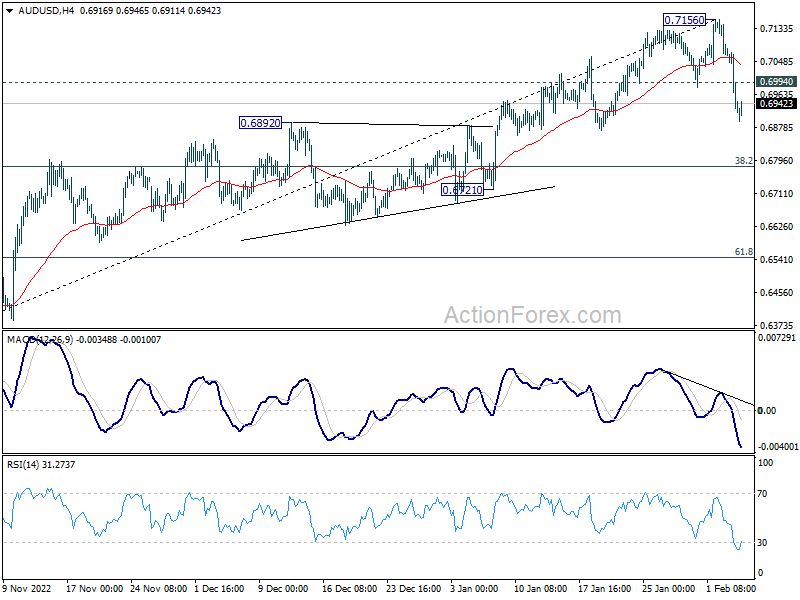
AUD/USD Daily Report
Daily Pivots: (S1) 0.6866; (P) 0.6975; (R1) 0.7030; More...
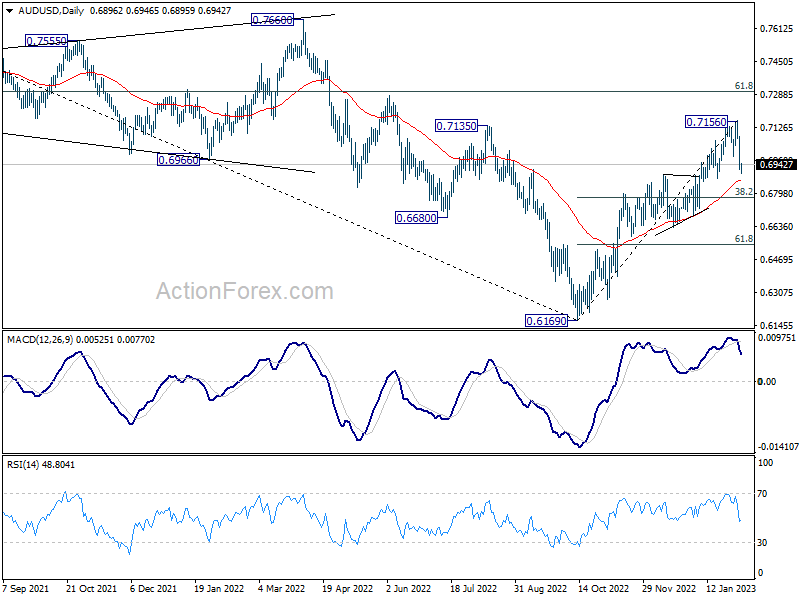
Intraday bias in AUD/USD stays on the downside at this point. Pull back from 0.7156 short term top would target 55 day EMA (now at 0.6863) and possibly below. But downside should be contained by 38.2% retracement of 0.6169 to 0.7156 at 0.6779 to bring rebound. On the upside, above 0.6994 minor resistance will turn bias neutral first. But overall, corrective pattern from 0.7156 should extend for a while.
In the bigger picture, corrective decline from 0.8006 (2021 high) should have completed with three waves down to 0.6169 (2022 low). Further rally should be seen to 61.8% retracement of 0.8006 to 0.6169 at 0.7304. Sustained break there will pave the way to retest 0.8006. This will now remain the favored case as long as 0.6721 support holds.
USD/JPY Daily Outlook
Daily Pivots: (S1) 129.28; (P) 130.24; (R1) 132.15; More...
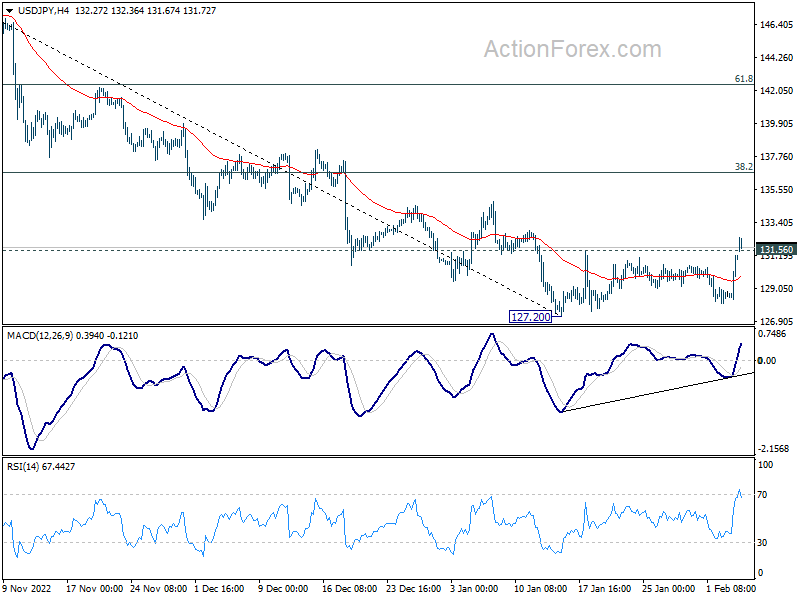
USD/JPY's break of 131.56 resistance confirms short term bottoming at 127.20, on bullish convergence condition in 4 hour MACD. Intraday bias is back on the upside for 55 day EMA (now at 133.28) first. Firm break there will target 38.2% retracement of 151.93 to 127.20 at 136.64, even just as a correction to the decline from 151.93. For now, risk will stay mildly on the upside as long as 127.20 support holds, in case of retreat.
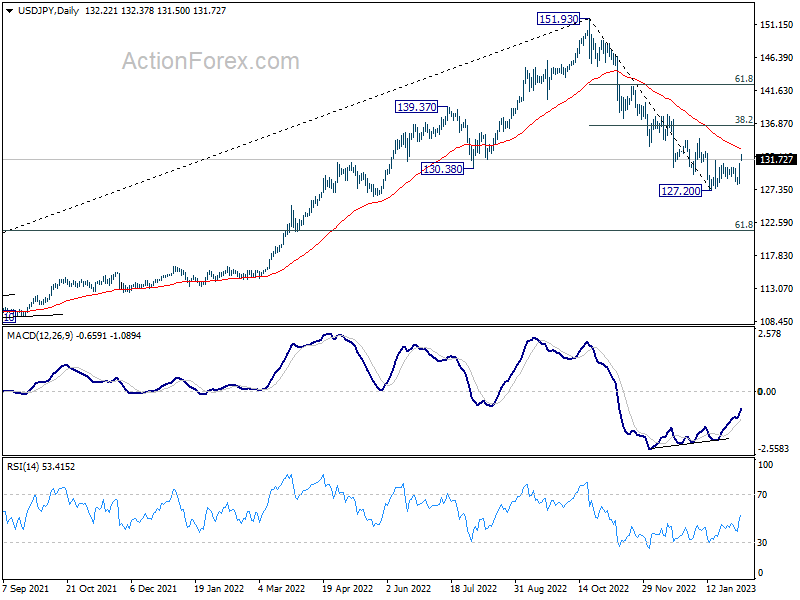
In the bigger picture, prior of 55 week EMA (now at 131.39) raises the chance of medium term bearish reversal, but that's not confirmed yet. Strong rebound from current level, followed by sustained break of 38.2% retracement of 151.93 to 127.20 at 136.64 will argue that price actions from 151.93 is merely a corrective pattern. However, rejection by 136.64 will solidify medium term bearishness for 61.8% retracement of 102.58 to 151.93 at 121.43 and 38.2% retracement of 75.56 to 151.93 at 122.75.
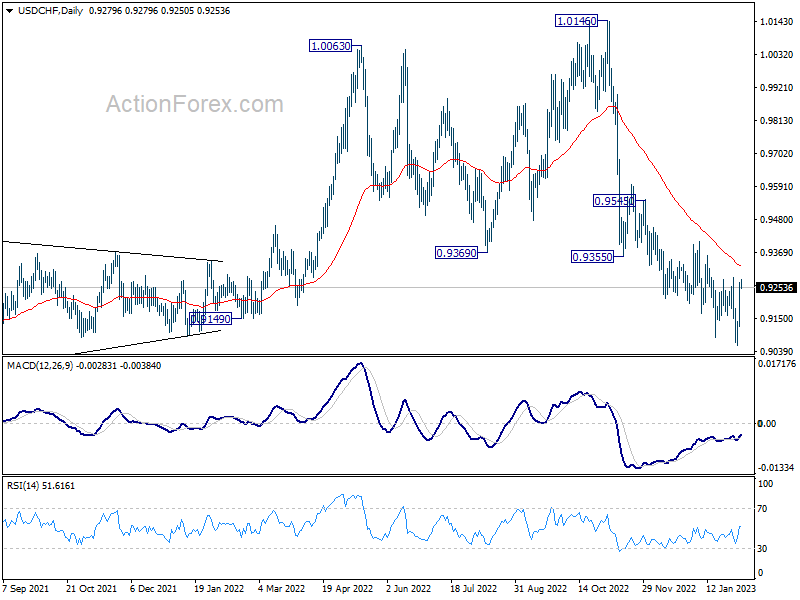
USD/CHF Daily Outlook
Daily Pivots: (S1) 0.9154; (P) 0.9211; (R1) 0.9317; More...
Intraday bias in USD/CHF stays neutral with focus on 0.9285 resistance. Firm break there will confirm short term bottoming at 0.9058, and bring stronger rise to 0.9407 resistance. On the downside, however, sustained break of 0.9058 will resume larger decline from 1.0146 instead.
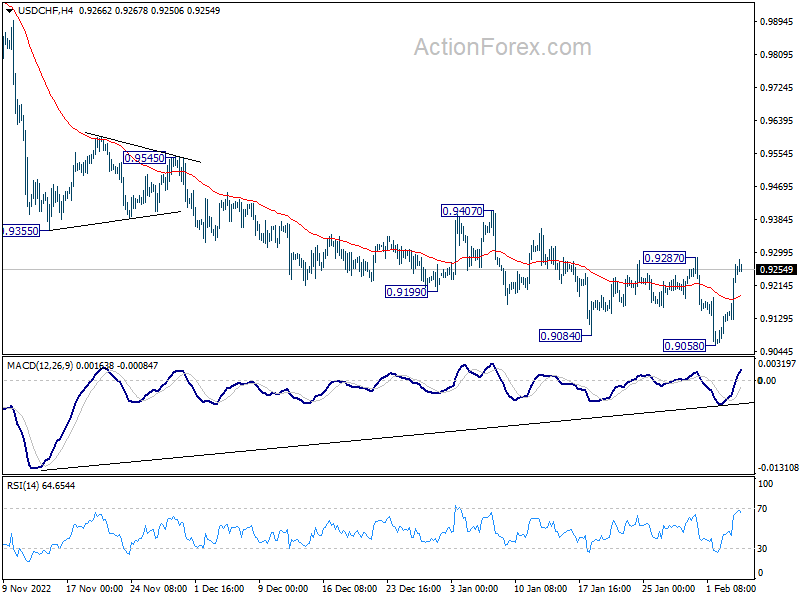
In the bigger picture, rise from 0.8756 (2021 low) has completed at 1.0146, well ahead of 1.0342 long term resistance (2016 high). Based on current downside momentum, fall from 1.0146 should be a medium term down trend itself. Next target is a test on 0.8756 low. Strong support should be seen there to bring rebound. Still, further decline will now be expected as long as 0.9407 resistance holds, in any case.
GBP/USD Daily Outlook
Daily Pivots: (S1) 1.1979; (P) 1.2122; (R1) 1.2197; More...
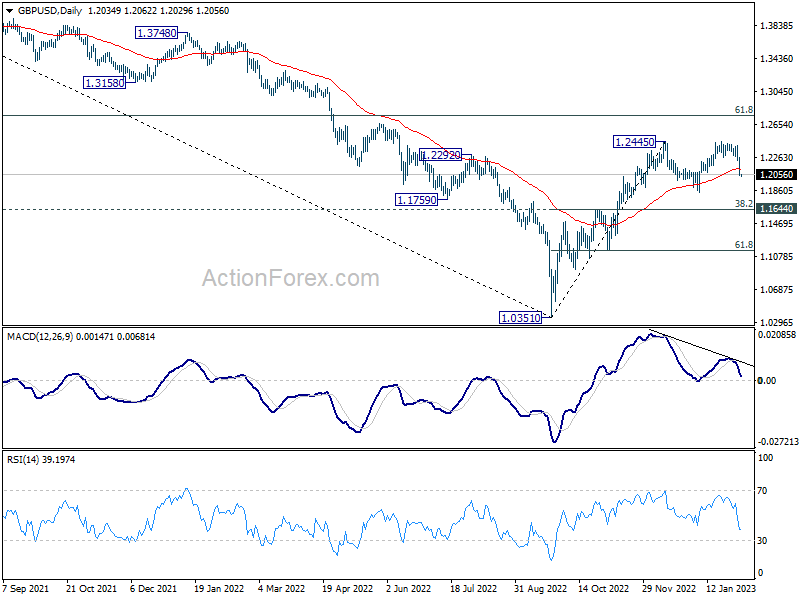
Intraday bias in GBP/USD stays on the downside for the moment. Fall from 1.2446 is seen as the third leg of the corrective pattern from 1.2445. Deeper decline would be seen to 1.1840 support and possibly below. But downside downside should be contained by 38.2% retracement of 1.0351 to 1.2445 at 1.1645 to bring rebound. On the upside, above 1.2181 minor resistance will turn intraday bias neutral first. But risk will stay mildly on the downside as long as 1.2445/6 holds, in case of recovery.
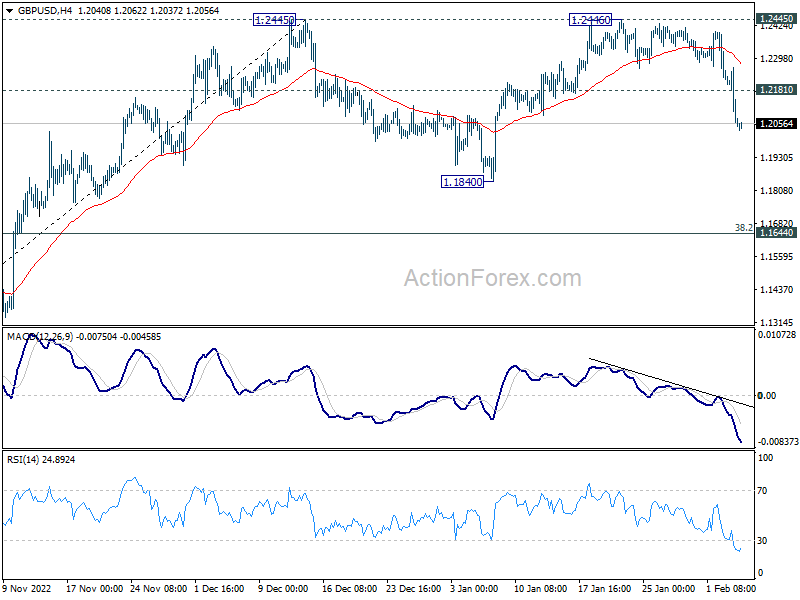
In the bigger picture, rise from 1.0351 medium term bottom is at least correcting whole down trend from 1.4248 (2021 high). Further rise is expected as long as 1.1644 resistance turned support holds. Next target is 61.8% retracement of 1.4248 to 1.0351 at 1.2759. Sustained break there will pave the way back to 1.4248.