Sample Category Title
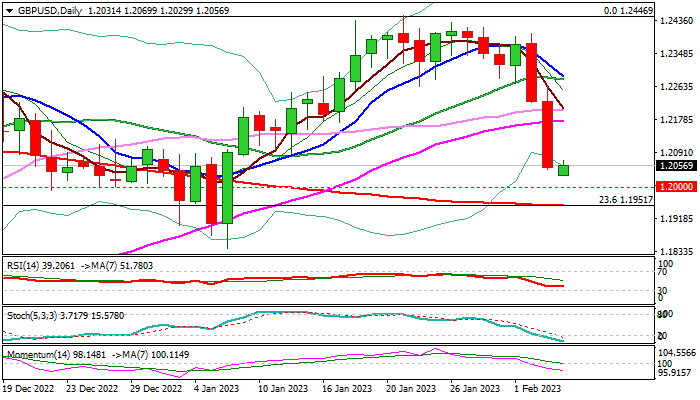
GBP/USD: Near Term Action Weighed by Rejection Under Weekly Cloud
Bears are taking a breather in European trading on Monday after strong acceleration on Thu/Fri which resulted in a weekly loss of 1.7% (the biggest weekly fall since the third week of September).
Formation of Doji reversal pattern on a weekly chart, following a multiple rejection under the base of falling weekly cloud weighs on near-term action, adding to pressure from stronger dollar on upbeat US jobs data.
Weakening daily studies on rising negative momentum and MA’s (10/20/55) turning to bearish setup, contribute to signals of possible further weakness, but oversold conditions suggest that bears may pause for consolidation, before attacking supports at 1.20 (psychological) and 1.1951 (200DMA), with extension below 1.1841 (Jan 6 trough) to confirm a double-top (1.2447) and signal reversal.
The action should be ideally capped by the top of daily cloud (1.2140) reinforced by daily Kijun-sen, to keep fresh bears intact, with potential extended upticks to stall under daily Tenkan-sen (1.2230) to maintain bearish bias.
Res: 1.2070; 1.2100; 1.2140; 1.2189.
Sup: 1.2030; 1.2000; 1.1951; 1.1900.
USD/JPY: Bulls Hold Grip for Stronger Recovery But More Evidence Needed to Confirm the Stance
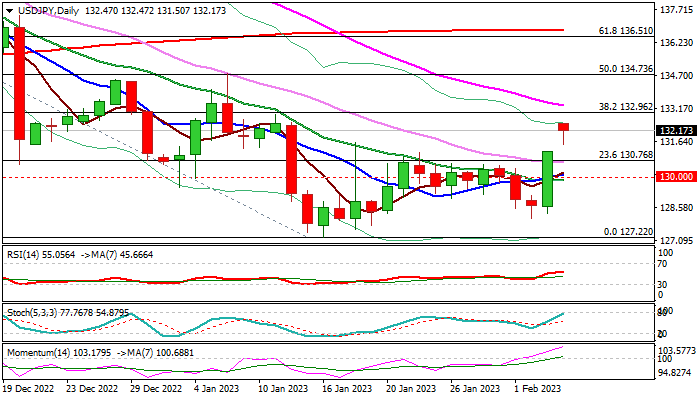
The USDJPY is standing at the front foot, following last Friday’s nearly 2% daily advance and Monday’s opening with a gap-higher.
The dollar was boosted by strong US labor figures which signal that the central bank would extend its policy tightening cycle.
Rising bullish momentum on daily chart underpins the action, as bulls face targets at 132.96/133.28 (Fibo 38.2% of 142.25/127.22 / falling 55 DMA) which guard more significant base of falling thick daily cloud (133.89).
Near-term action needs to hold above daily Kijun-sen (131.00) to keep bullish bias for further recovery.
Res: 132.96; 133.28; 133.89; 134.50.
Sup: 131.50; 131.00; 130.76; 130.00.
AUD/USD Outlook: Aussie Remains Under Increased Pressure
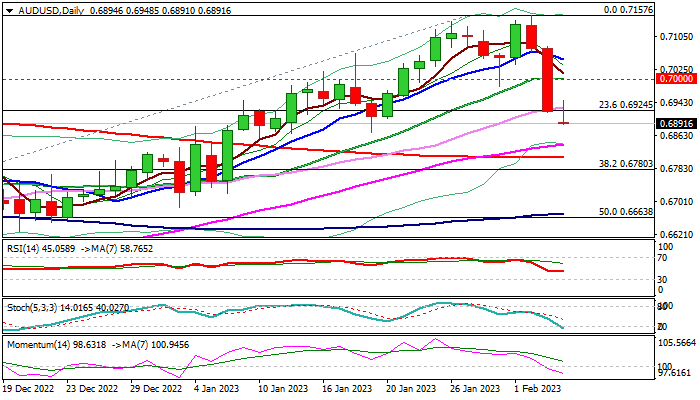
The AUDUSD is consolidating above new three-week low in European session on Monday, but remains at the back foot, weighed by Friday’s large bearish daily candle (down 2.1%).
Much stronger US Jan NFP numbers on Friday lifted dollar, weighing on risk-oriented Aussie, with minor positive impact seen from news about warming China-Australia trade relations.
Fresh bears look for repeated daily close below 0.6924 (daily Kijun-sen) to confirm bearish stance and open way for test of targets at 0.6808/0.6780 (200DMA / Fibo 38.2% of 0.6170/0.7157) and pivotal support at 0.6748 (top of rising daily cloud).
Daily studies show strengthening bearish momentum, with near-term action to keep bearish bias while holding below broken psychological 0.70 support, reverted to significant resistance.
Traders eye RBA’s policy meeting on Tuesday, with wide expectations for 25 basis points and focus on central bank’s signals about the near-future actions.
Res: 0.6924; 0.6983; 0.7000; 0.7050.
Sup: 0.6871; 0.6808; 0.6780; 0.6748.
AUD/USD: Elliott Waves are Pointing Lower, But RBA Can Cause a New Bounce
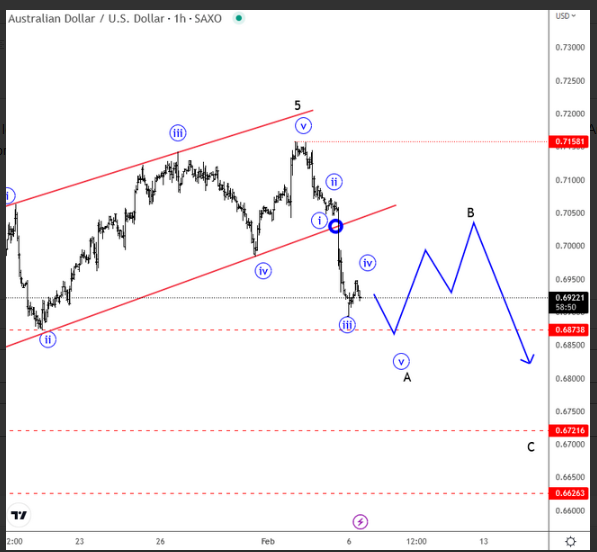
Aussie is coming down very sharply and impulsively, ahead of RBA this week, so looks like technically are pointing down, but RBA hawks can be back after latest jump in CPI figures. Any hawkish view and further hike in the months ahead would certainly be supportive for the aussie, but maybe only temporary up for a B wave. Some support is at 0.673, ideally for the end if first wave A. TRhis A belongs to a higher degree corrective drop.
BoE hawk Mann: Next step more likely another hike than a cut or hold
BoE MPC member Catherine Mann, a known hawk, said in a speech that "we need to stay the course, and in my view the next step in Bank Rate is still more likely to be another hike than a cut or hold."
She noted that "some (global) central bankers are seeing a turning point in data to which they are responding with an inflection in their respective policy paths".
Also, "recent market chatter has focused on when central banks will stop hiking and if they will reverse, with fears torn between the risks of overtightening and stopping too soon.
But for assessment on the turning point, she is looking for "significant and sustained deceleration in higher frequency price increases and in the underlying inflation measures and expectations towards inflation rates that are consistent with achieving the 2% target".
She emphasized, "uncertainty around turning points should not motivate a wait-and-see approach, as the consequences of under tightening far outweigh, in my opinion, the alternative."
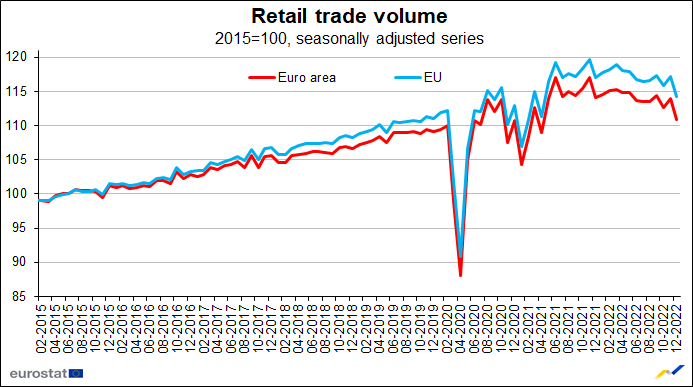
Eurozone retail sales dropped -2.7% mom in Dec, EU down -2.6% mom
Eurozone retail sales volume dropped -2.7% mom in December, worse than expectation of -2.5% mom. The volume of retail trade decreased by -2.9% for food, drinks and tobacco and by -2.6% for non-food products, while it grew by 2.3% for automotive fuels.
EU retail sales contracted -2.6% mom. Among Member States for which data are available, the largest monthly decreases in the total retail trade volume were registered in the Netherlands (-6.3%), Germany (-5.3%) and Luxembourg (-3.8%). The highest increases were observed in Slovakia (+2.3%), Austria (+1.6%) and Romania (+1.3%).
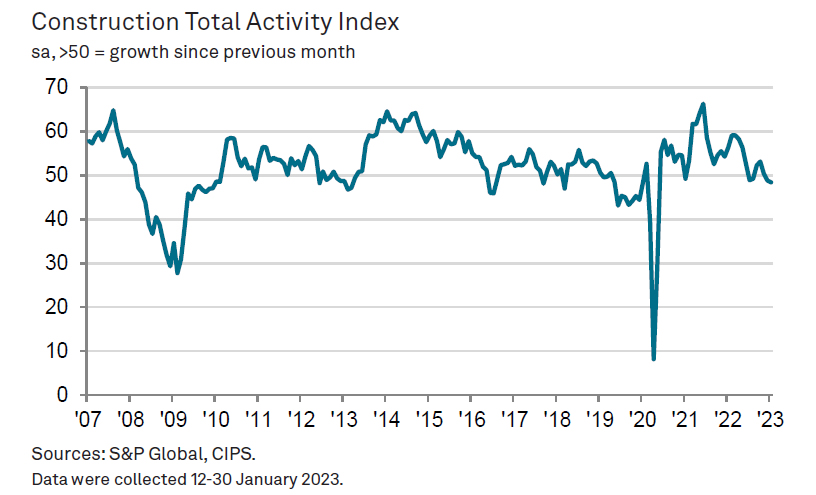
UK PMI construction dropped to 48.4, weakest in 2 1/2 years
UK PMI Construction dropped slightly from 48.8 to 48.4 in January, below expectation of 49.5. S&P Global noted that residential work had the steepest drop for 32 months. New orders and employment continued to decrease. But business activity expectations rebounded.
Tim Moore, Economics Director at S&P Global Market Intelligence, said: "A sharp and accelerated decline in house building activity led to the weakest UK construction sector performance for just over two-and-a-half years in January.... However, there were positive signals for longer-term prospects across the construction sector, with business activity expectations staging a swift rebound from the low point seen last December."
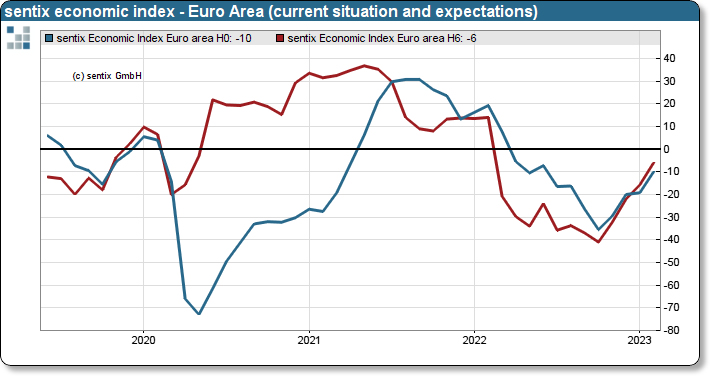
Eurozone Sentix rose to -8 in Feb, stagnation with mini-growth the consequence
Eurozone Sentix Investor Confidence rose from -17.5 to -8.0 in February, above expectation of -11.8. That;s also the highest since March 2022. Current Situation Index rose from -19.3 to -10.0, highest since June 2022. Expectations Index rose from -15.8 to -6.0, highest since February 2022. All three indexes had the fourth increase in a row.
Sentix said: "Up to now, investors have been assuming a recession, the course of which was initially expected to be severe but has now eased considerably. With the recent improvement, the scenario of stagnation is gaining in contour. The absence of an energy crisis and the rosy corporate news are contributing to the turnaround from the original recessionary path."
"However, the following must be critically observed: So far, the improvement in all subcomponents is running at a negative level. In addition, it is noticeable that the expectations component is hardly running ahead of the current situation. Normally, at economic turning points, the expectations values turn positive much faster, while the current situation is still deep in the red. In these cases, a new, positive perspective emerges. However, this has not been the case so far! Investors expect the status quo of the economy to be maintained to some extent. Stagnation with mini-growth would be the consequence."
EURUSD Maintains Bullish Trend Despite Post-NFP Crash
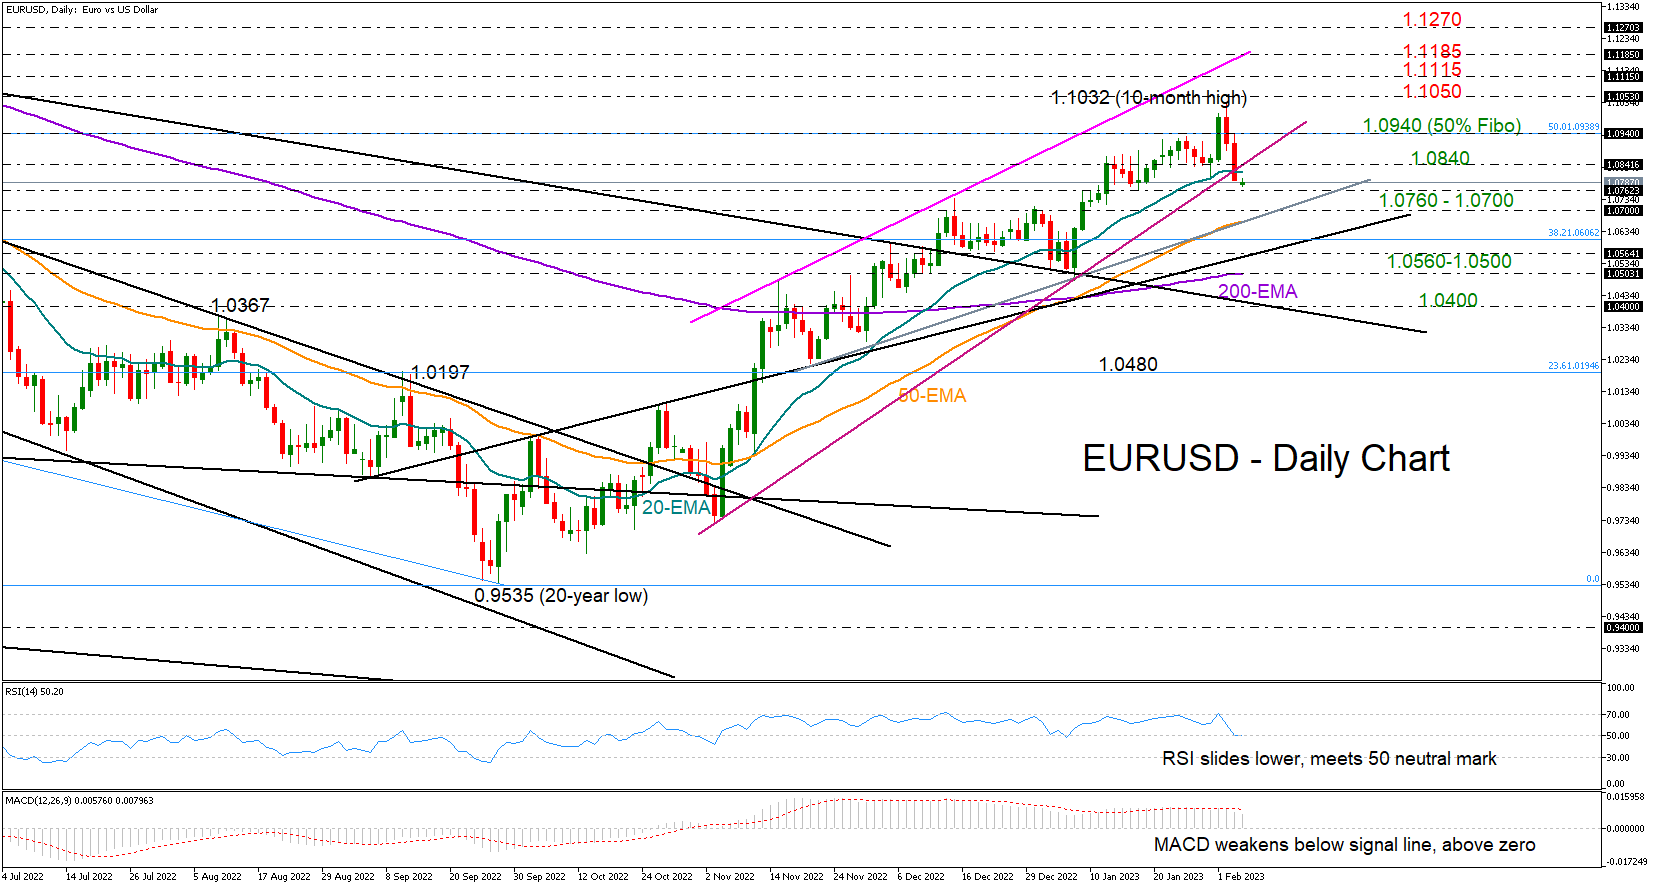
EURUSD opened with a slight negative gap on Monday around 1.0780 following Friday’s post-NFP crash, which erased February’s gains and squeezed the price below its 20-day exponential moving average (EMA).
Encouragingly, the positive trend from September’s 20-year low remains unchanged above the nearby 1.0760-1.0700 support region. The 50-day SMA and the ascending trendline, which connects all the lows from mid-November, are approaching that area as well. If the sell-off snaps that floor, there are a couple of key levels at which the pair could still gain buying interest. The constraining line from September may come first into view at 1.0560 ahead of January’s low of 1.0480. Note that the 200-day EMA is flattening around the same location. Hence, a decisive close lower would mark a new lower low in the short-term picture, confirming a bearish trend reversal. If that proves to be the case, the price may seek shelter around the long-term resistance-turned-support trendline currently at 1.0400.
Alternatively, the bulls may push back above the 20-day EMA and the 1.0840 barrier. If they succeed, the recovery could strengthen towards Friday’s high of 1.0940, where the 50% Fibonacci retracement of the 1.2348-0.9535 downtrend is positioned. Running higher, the price may attempt to crawl above its previous high of 1.1032 with scope to reach the 1.1115 barricade and then stretch towards the March high of 1.1185 currently near the upper ascending line.
Summing up, although EURUSD has switched back to losses, its bullish trend may preserve buying interest as long as it keeps trading above 1.0480.
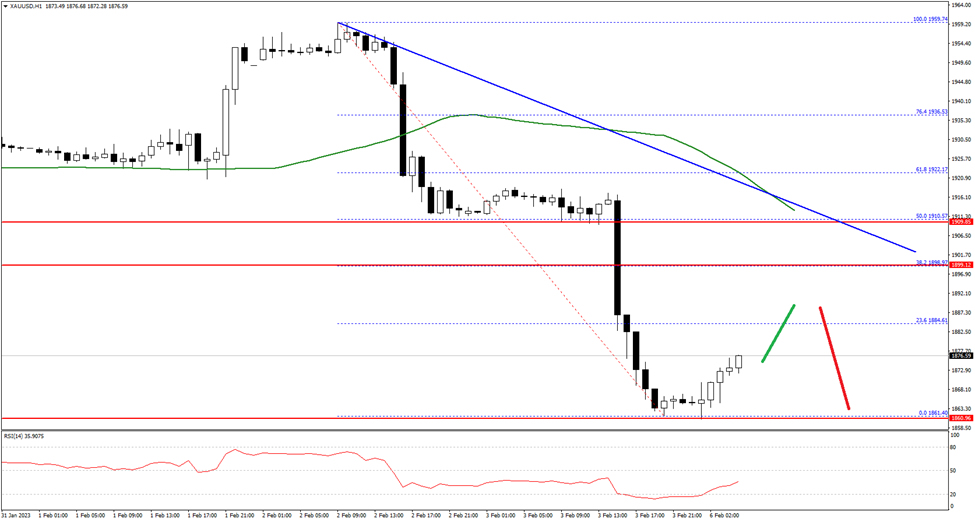
Gold Price is Currently Consolidating Losses from $1,861
Gold price started a fresh decline from the $1,960 zone against the US Dollar. The price declined heavily below $1,925 and moved into a bearish zone.
The bears even pushed the price below the $1,900 level and the 50 hourly simple moving average. The price traded as low as $1,861 and is currently consolidating losses. An immediate resistance on the upside is near the $1,885 level.
The first major resistance is near the $1,900 level and a bearish trend line on the hourly chart. The next main resistance could be near the $1,915 level, above which the price could start a steady increase towards $1,935 on FXOpen.
On the downside, an immediate support is near the $1,865 level. The next major support is near the $1,850 level, below which the price might decline towards the $1,832 support level in the near term.