

Sample Category Title
Bitcoin: Bulls to Stay Intact While Today’s Gap Remains Unfilled
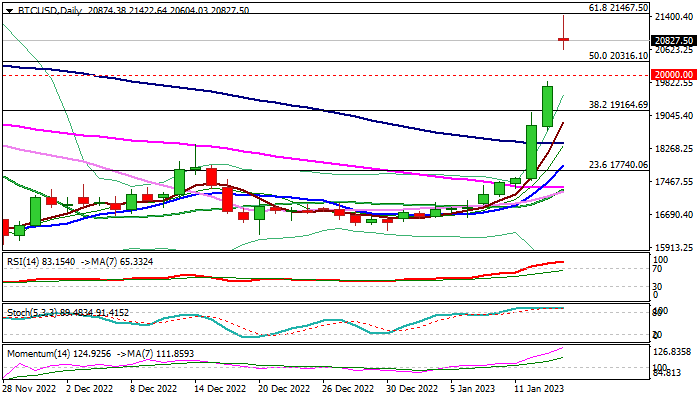
Bitcoin opened with a gap-higher on Monday and hit the highest since mid-September, in extension of sharp bullish acceleration last Thu/Fri.
Surge through psychological 20 and 21K after gapping higher by over 1100 pips adds to strong bullish stance as the latest acceleration fully retraced post-FTX crisis sharp fall.
Last week’s 16.5% advance marks the biggest weekly rally since the last week of July 2021 and some profit-taking could be a likely scenario as bulls cracked previous high at 21287 (Nov 4) and approach key Fibo barrier at 21467 (Fibo 61.8% of 25194/15437 bear-leg) and daily studies are strongly overbought.
Significantly improved sentiment on signs that the US inflation entered downward trajectory that would prompt Fed to further ease the pace of rate hikes in the next policy meeting on Feb 1, is expected to continue inflating Bitcoin’s price in the near future.
Bulls are likely to take a breather for consolidation, with dips to find solid supports at 20316 (broken 50% retracement of 25194/15437) and 20000 (psychological), where pullback should ideally stall to keep today’s gap unfilled and bullish structure intact.
Sustained break of 21287/21467 pivots would open way for extension towards 22761 (falling 200DMA) and 22892 (Fibo 76.4%).
Res: 21287; 21467; 22000; 22761
Sup: 20604; 20316; 20000; 18691
Euro Hits 9-Month High
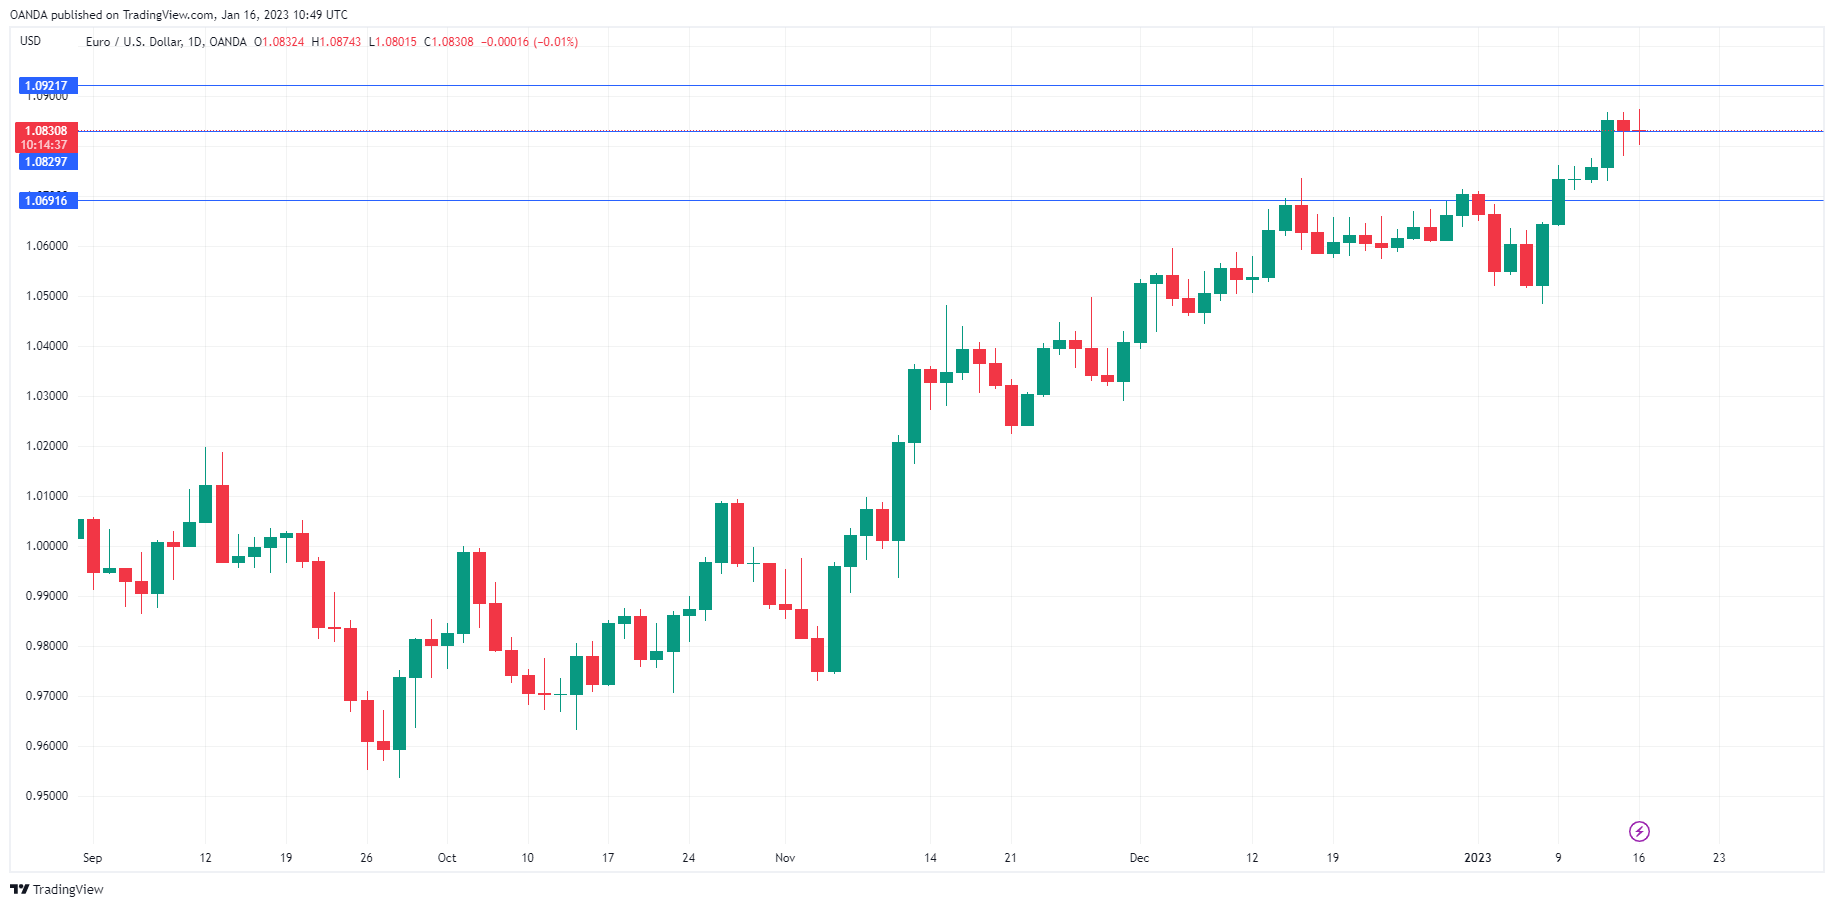
The euro is almost unchanged on Monday, trading at 1.0831. The euro is coming off a strong week, as EUR/USD rose 1.8%. Earlier in the day, the euro hit 1.0874, its highest level since April 2022.
Will Eurozone inflation sink?
Eurozone inflation has been dropping and slipped into single digits in December. This is a remarkable turnaround after a year in which inflation soared and constantly beat expectations after Russia invaded Ukraine. In December, the ECB projected that inflation wouldn’t fall to the 2% target until 2025, but it now appears that the target could be reached much earlier, perhaps in Q4 of 2023.
One of the key drivers of higher inflation was soaring energy prices, triggered by the Ukraine war. Oil and gas prices have since fallen substantially, and a relatively warm winter in Europe and extensive efforts to diversify supplies have eased concerns of an energy crisis in Europe. The downtrend in energy prices could of course change before the winter ends, but in the meantime, inflation is dropping and the economic outlook for the eurozone appears brighter. Last week, Goldman Sachs revised upwards its 2023 GDP forecast for the eurozone from -0.1% to a small gain of 0.6%.
The positive news on the inflation front is unlikely to result in any change in policy from ECB policy makers. Headline inflation fell from 10.1% to 9.2% in December, but the core rate, which is a key factor for the ECB, has been rising. The ECB has said more rate hikes are coming in 2023, a stance that was echoed by ECB member Rehn earlier today.
In the US, UoM Consumer Sentiment jumped to 64.6 in December, beating the forecast of 60.5 and above the November reading of 59.7. Inflation expectations for 2023 decreased to 4.0%, down from 4.4%, although long-term expectations inched higher.
EUR/USD Technical
- 1.0829 is a weak support line, followed by 1.0691
- There is resistance at 1.0921 and 1.1010
Japan yield curve distortion worsens, Nikkei down
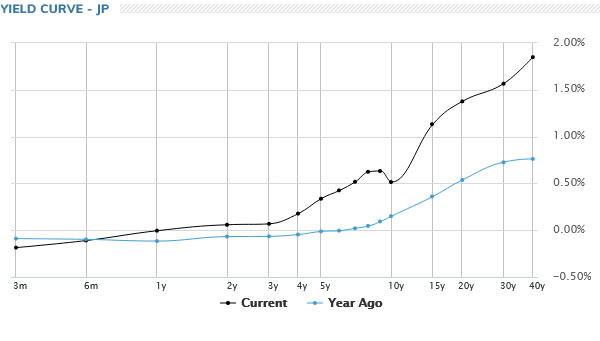
Japanese stocks, bonds and currency market remain rather nervous today, as traders are eyeing BoJ policy decision on Wednesday. The yield curve "distortion", as described by the central bank, was getting more serious after 8- and 9-year yield surged past 0.6% handle last week. At the same time, 10-year JGB yield, closed at 0.514, is still firmly tied to the 0.5% cap. Both 8- and 9-year yield closed down but stayed above 10-year's level at 0.624 and 0.632.
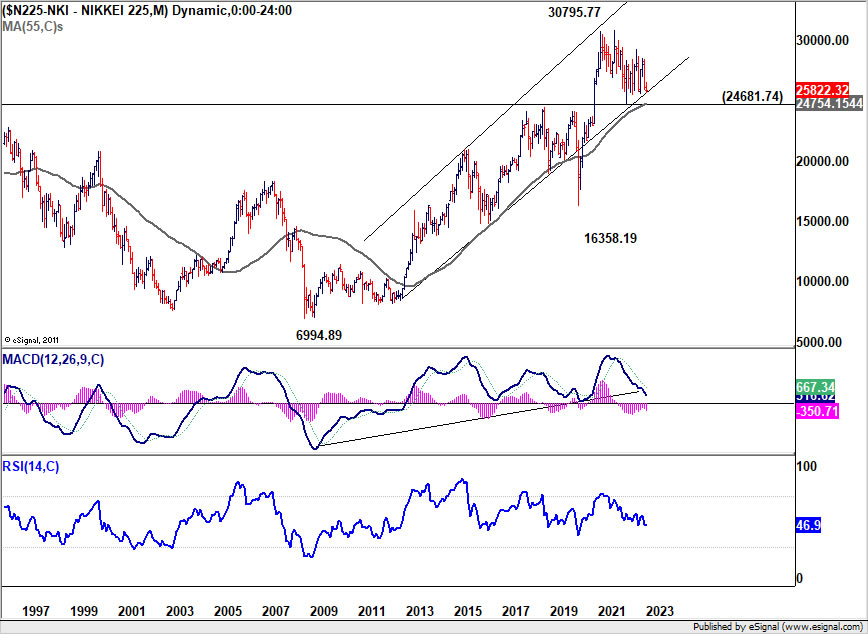
As speculation on a YCC tweak to rectify the distortion intensified , Nikkei declined -1.14% to close at 25822.32. Technically speaking, while deeper decline is possibly for the near term, strong support should be seen around 24681.74 to contain downside. The level is close to 55 month EMA, which stands at 24754.15. Nikkei has been continuously supported by the EMA, as well as the long term channel, for a decade, barring the initial two months of the pandemic. But a firm break of 24681.74 will indicate something rather substantial is happening.
Key UK Data This Week; Could the Rally in Equities be Supported?
With the Bank of England meeting scheduled in less than three weeks, pound followers will be enlightened on the underlying currents of the UK economy. Labour market statistics, inflation figures and retail sales data create a colourful mosaic in this third trading week of the new year. Every data point matters as the market tries to make up its mind regarding the monetary policy outlook.
Weakness in economic data recently
The data releases in the UK since the dawn of the new year have been mixed. For example, the housing sector continues to create concerns as house prices seem to be on an aggressive downward trend. Equally important, the production data for November were disappointing. A 5.1% year-on-year drop in industrial output, led by a sizeable drop in the manufacturing sector output, is a strong indication that the recession expectations from professional forecasters cannot be easily dismissed as pessimistic thinking.
Busy data calendar, CPI stands out
On Tuesday morning the November labour market statistics will be published. The unemployment rate is expected, according to the Reuters poll, to remain at the record low level of 3.7% while employment is set to record another monthly increase. Total employment is still 300k below the January 2020 peak meaning that the Covid impact has not been negated yet. Additionally, headline average weekly earnings are expected to remain stable at 6.1% YoY change while excluding bonuses, the indicator is seen rising to 6.3% YoY. These indicators exhibit a different pattern to their US counterparty. While direct comparisons are not possible due the different nature of the two data sets, there is an evident divergence in their recent trend. On face value, this could potentially force the BoE to further tighten its monetary policy stance during a period that other key central banks could be pausing for reevaluation.
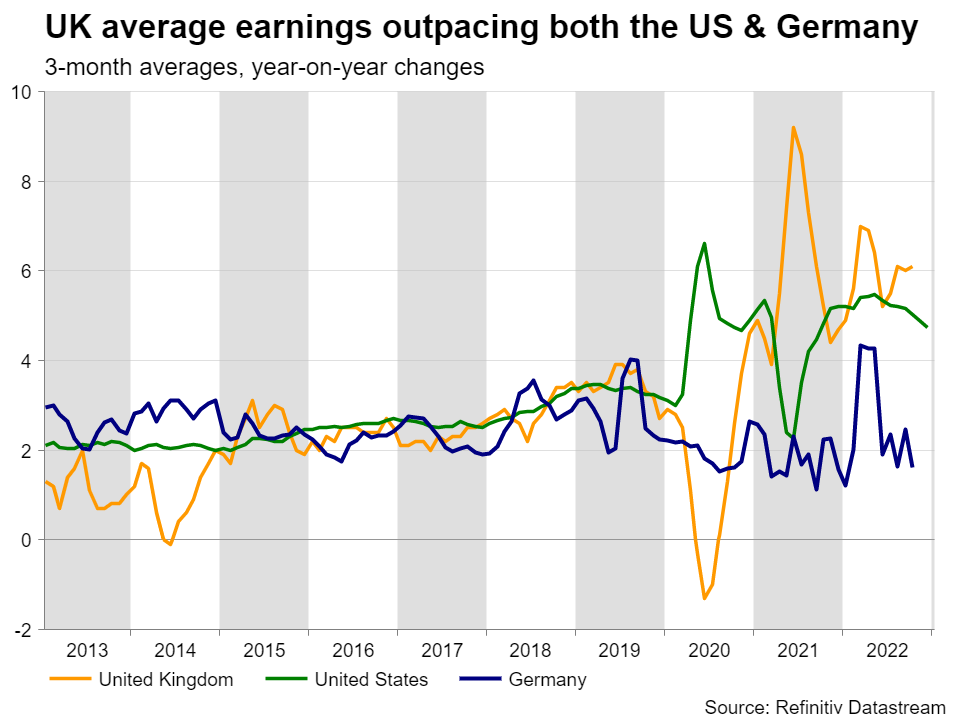
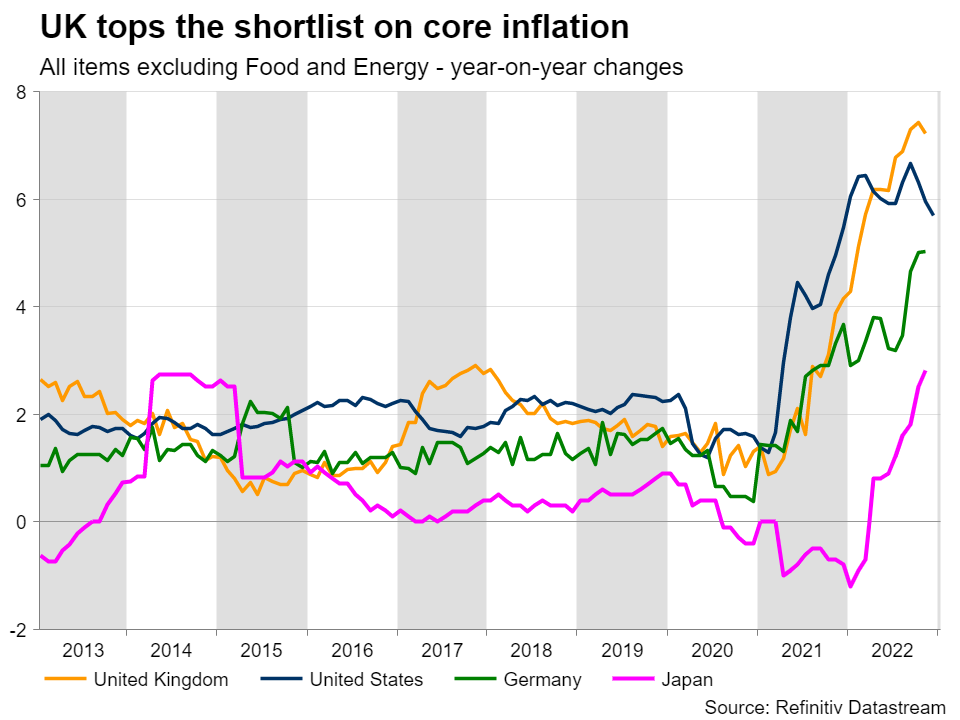
Moving to Wednesday, and amidst the market evaluating the likely BoJ announcements, the December inflation details will be released. Contrary to the US numbers last week confirming a relaxation of the inflation pressures, the UK figures are not expected to change dramatically. Both the headline and core CPI are seen stable at stubbornly higher levels of 10.6% YoY and 6.3% YoY respectively. It would be interesting if these projections are indeed confirmed. This could mean that contrary to its main trading partners, the UK might not have seen the peak in inflation.
Finally, on Friday we get a look at the December retail sales. The BRC/KPMG retail sales monitor for December showed a 6.5% YoY increase as the monthly retail sales figures are expected to record a positive month-on-month change. There are methodological differences in the compilation of these series, but there seems to be a growing gap among these two indicators that has not been present in the recent past. This could imply a potential upside surprise at Friday’s release especially if we factor in the strong November Consumer Credit data.
What does this all mean for the Bank of England?
The BoE faces a tough challenge. It is the only central bank facing double-digit headline inflation and the strongest core inflation among the key developed economies. And this occurs amidst the UK government’s effort to stabilize public finances after three years of increased spending due to the Covid pandemic and the political shenanigans. A strong set of economic data this week could potentially force Bailey et al to move even more aggressively than the current market pricing of almost 100 bps of rate hikes until the August meeting. On the other hand, if CPI makes a much-sought dip, the BoE doves could try to push for the more causal 25 bps steps going forward.
UK 100 index making new highs
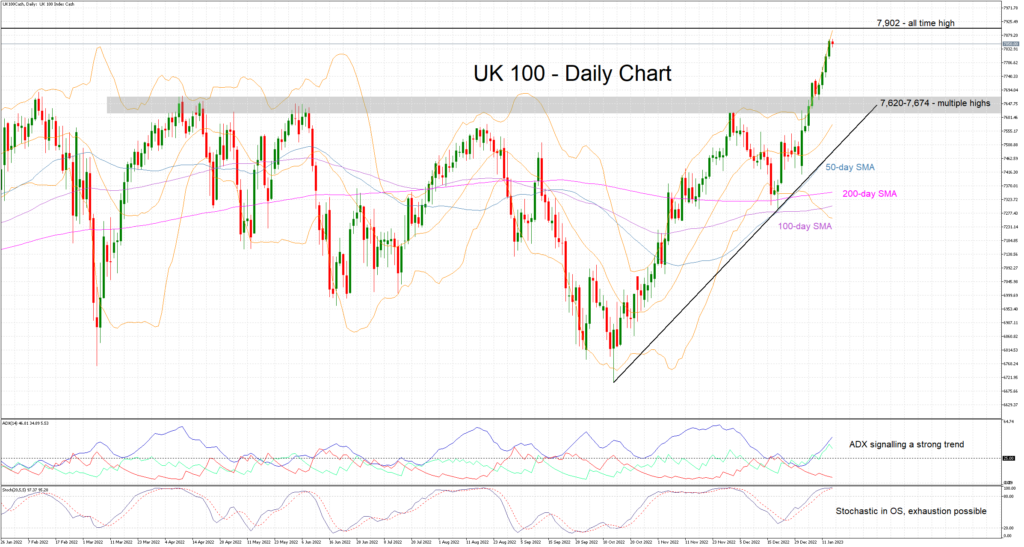
The UK 100 cash index has moved in sync with other European stock markets in enjoying a bright start of 2023. It currently hovers around the higher level since May 23, 2018 completely wiping out the Covid correction, and it is just a tad below the May 22, 2018 all-time high of 7,902. The angle of the move since October 13, 2022 low of 6,705 has been on the aggressive side hence potentially increasing the chances of a possible correction ahead. At the moment the momentum indicators appear supportive of the move higher, but caution is warranted.
XAU/USD: Intermediate Triple Zigzag Likely to Complete Near 1992.12
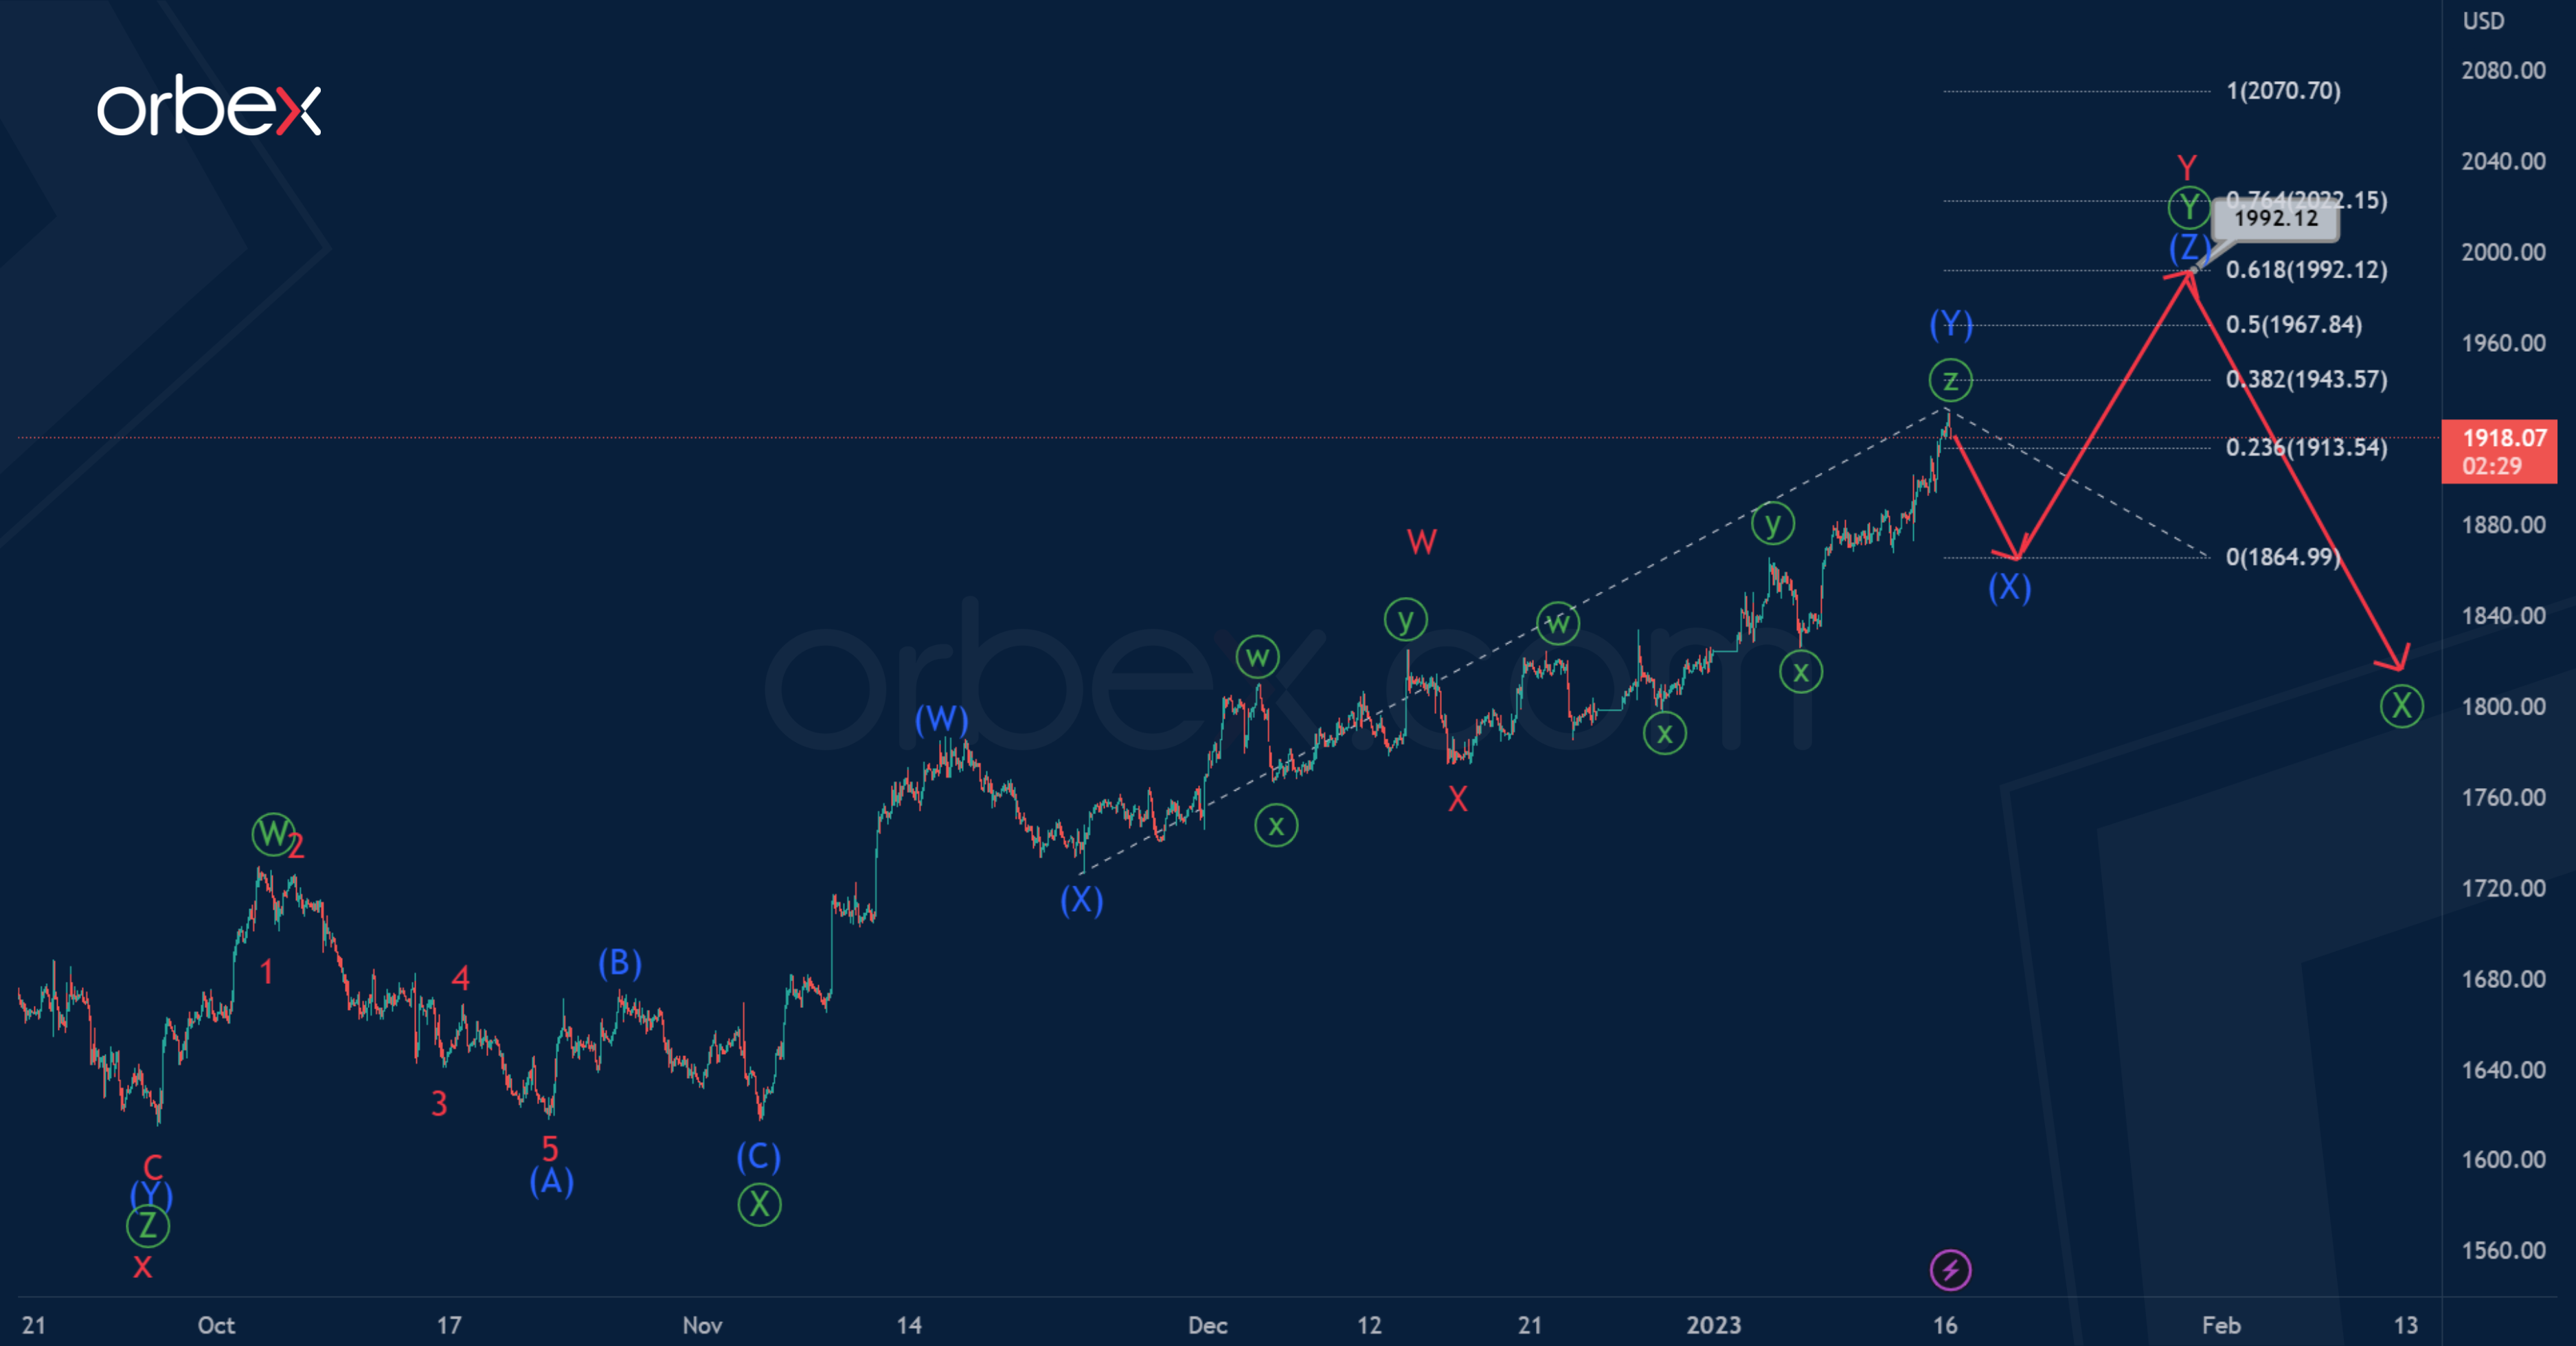
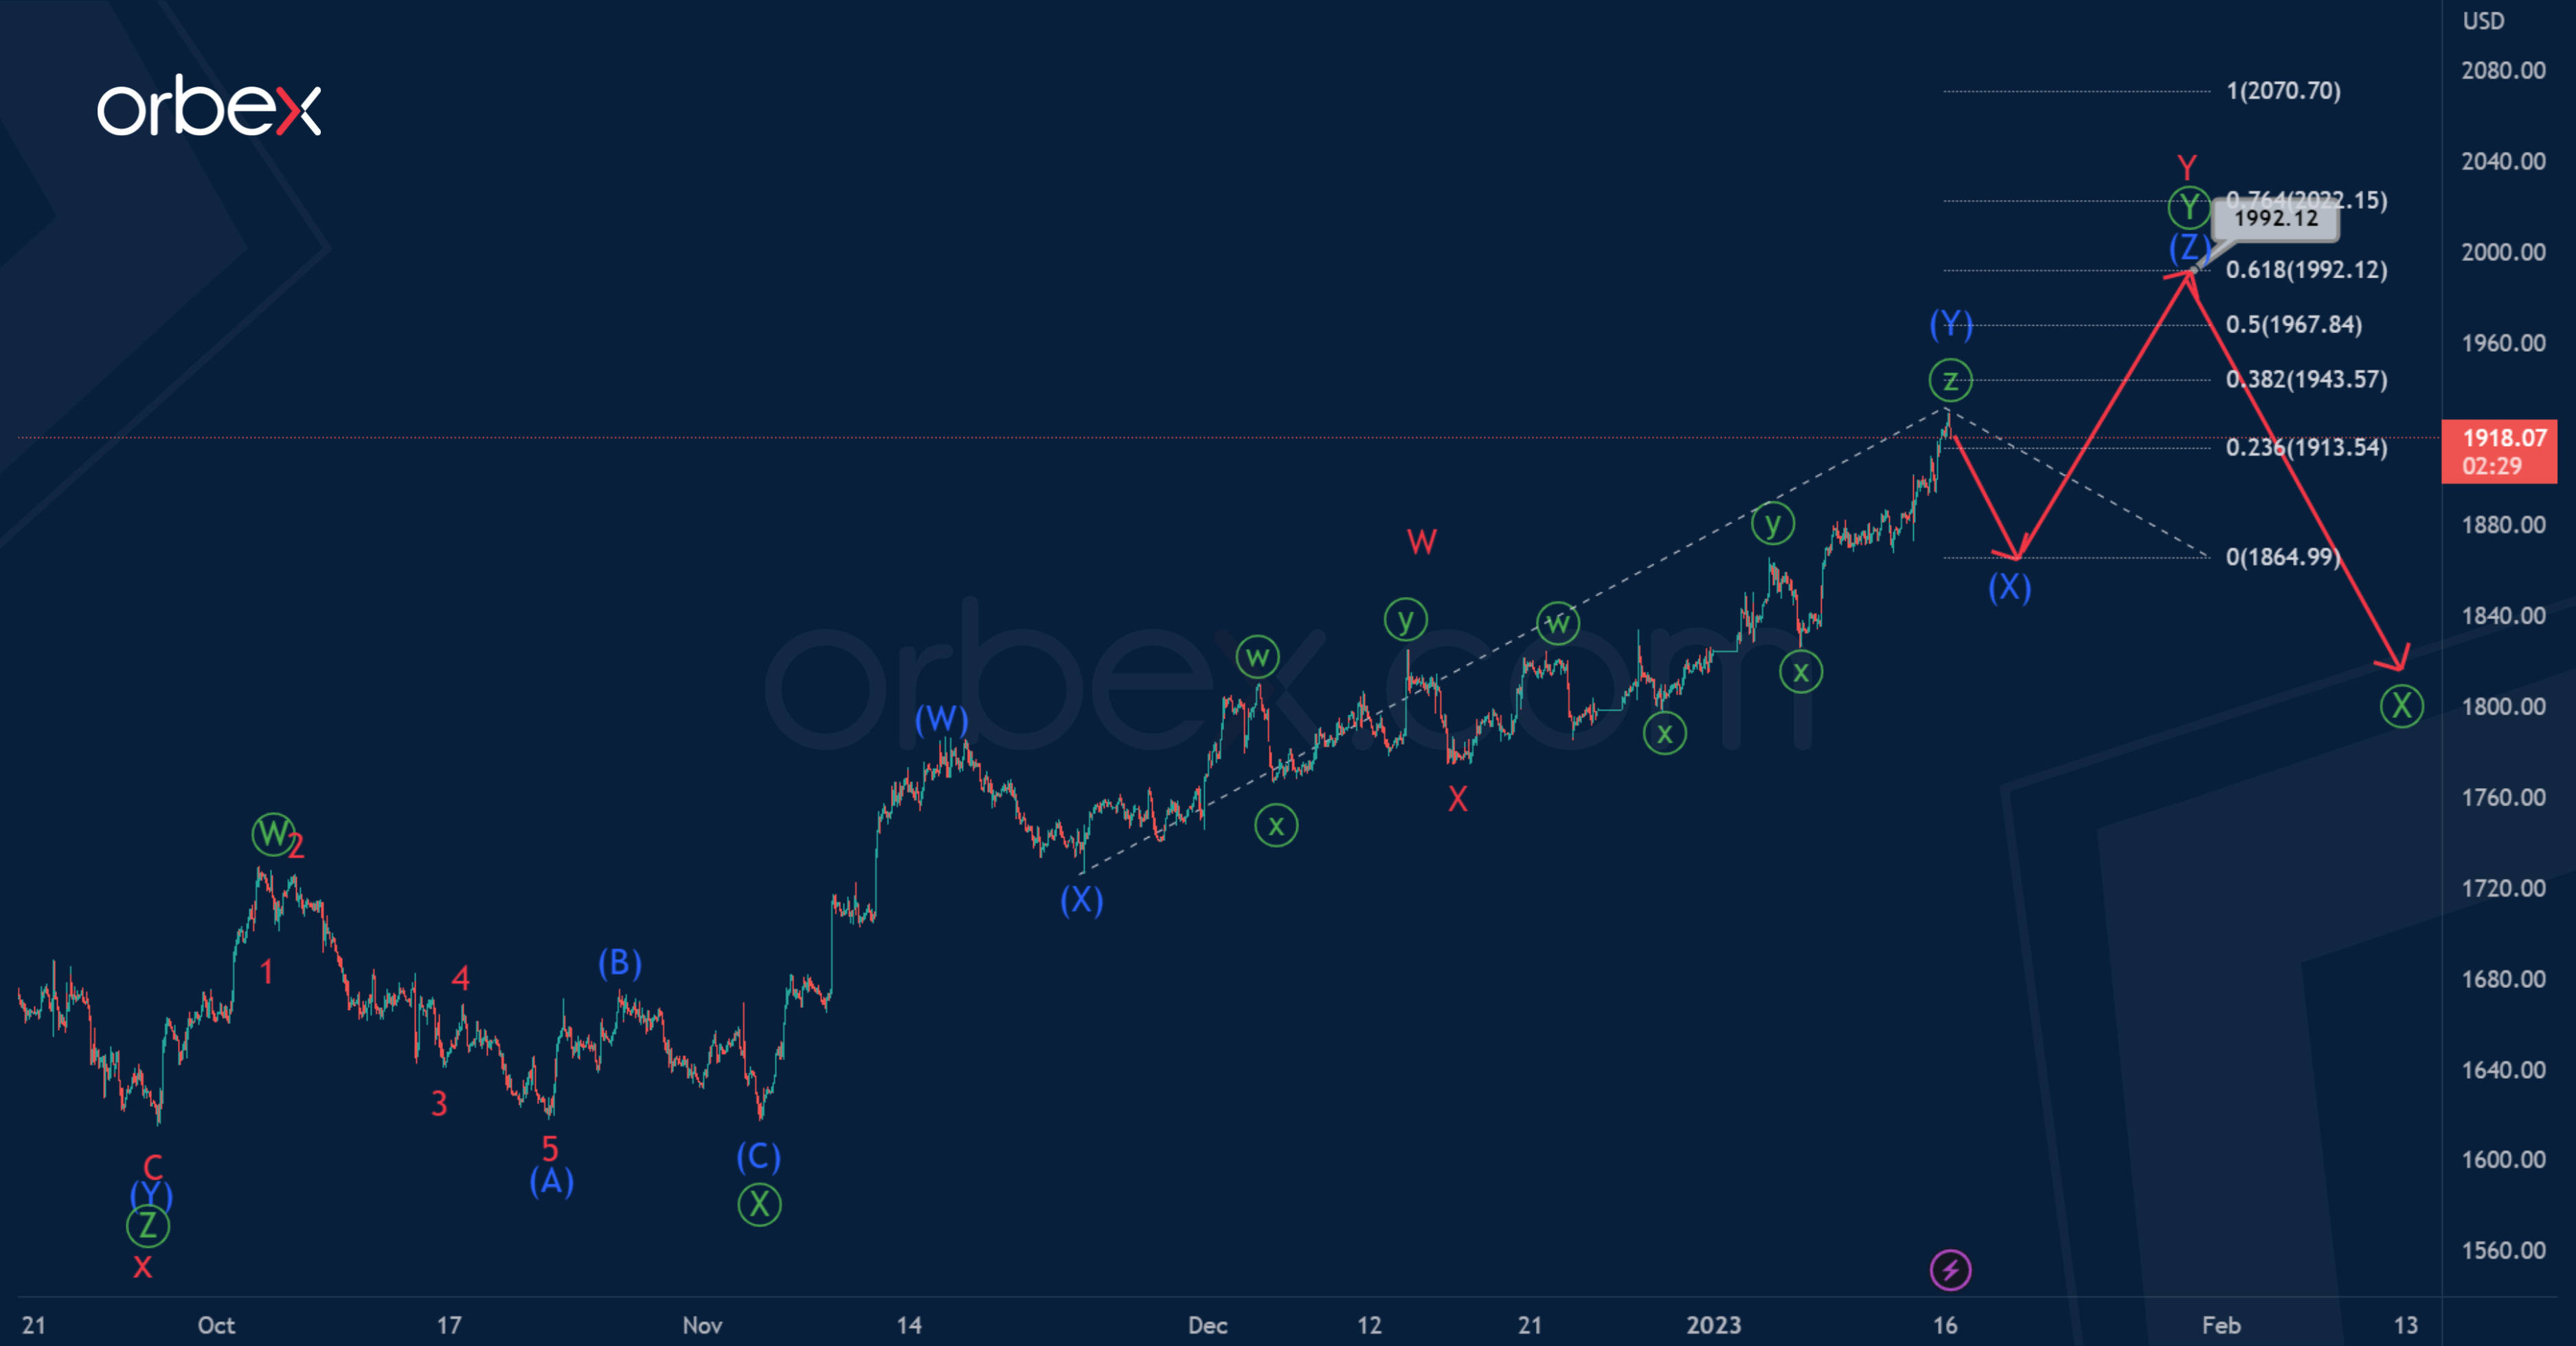
XAUUSD continues the development of a large correction pattern taking the form of a cycle triple zigzag.
There is a possibility that the cycle wave z, which is currently under development, also takes the form of a primary triple zigzag Ⓦ-Ⓧ-Ⓨ-Ⓧ-Ⓩ, and now the price is in the second actionary wave Ⓨ.
It is possible that the primary wave Ⓨ will end in the form of an intermediate triple combination (W)-(X)-(Y)-(X)-(Z) near 1992.12. At that level, wave (Z) will be at 61.8% of wave (Y).
An approximate scheme of possible future movement is shown on the chart.
Alternatively, the primary actionary wave Ⓨ could be fully completed. It is a double zigzag (W)-(X)-(Y).
Thus, in the near future, the price may move down, forming a primary intervening wave Ⓧ. It is still difficult to say which correction model it will take, but we can assume where it will end with the help of Fibonacci lines.
Perhaps we will observe the end of the wave Ⓧ near 1810.05. At that level, it will be at 38.2% of wave Ⓨ.
AUD/USD: Bulls Likely to Take a Breather Before Firm Break of Psychological 0.70 Barrier
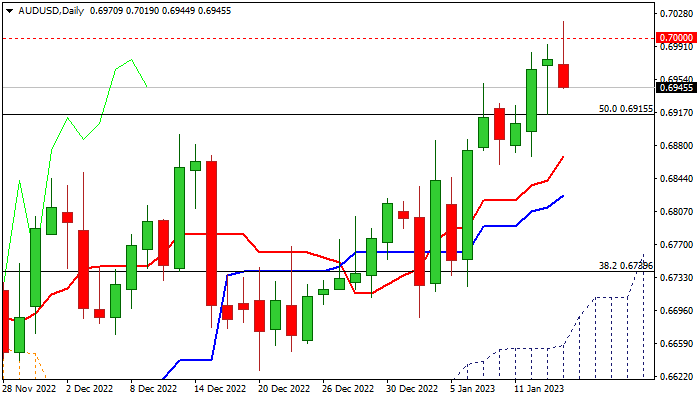
The AUDUSD hit new multi-month high in early Monday’s trading, following a probe above psychological 0.70 barrier for the first time since mid-August.
Aussie is underpinned by renewed risk sentiment on expectations of Fed slowing the pace of rate hikes, higher commodity prices on China’s reopening and growing optimism that global inflation has hit its peak and started to ease.
Bulls look for clear break of 0.70 pivot to open way for test of next key barriers at 0.7076/91 (weekly cloud base / Fibo 61.8% of 0.7661/0.6170) and 0.7136/71 (Aug high/weekly cloud top) in extension.
Although the key factors continue to support the action, headwinds from 0.70 resistance zone are very likely to slow bulls for consolidation/limited correction, as daily studies are overbought and bullish momentum is fading.
Dips should find support above rising daily Tenkan-sen (0.6868) to keep bulls intact for fresh push higher, while extension and close below rising daily Kijun-sen (0.6824) would put bulls on hold for deeper pullback and expose the top of rising daily cloud (0.6710).
Res: 0.7000; 0.7076; 0.7091; 0.7136.
Sup: 0.6915; 0.6868; 0.6824; 0.6739.
Gold Price Started a Fresh Increase from $1,865
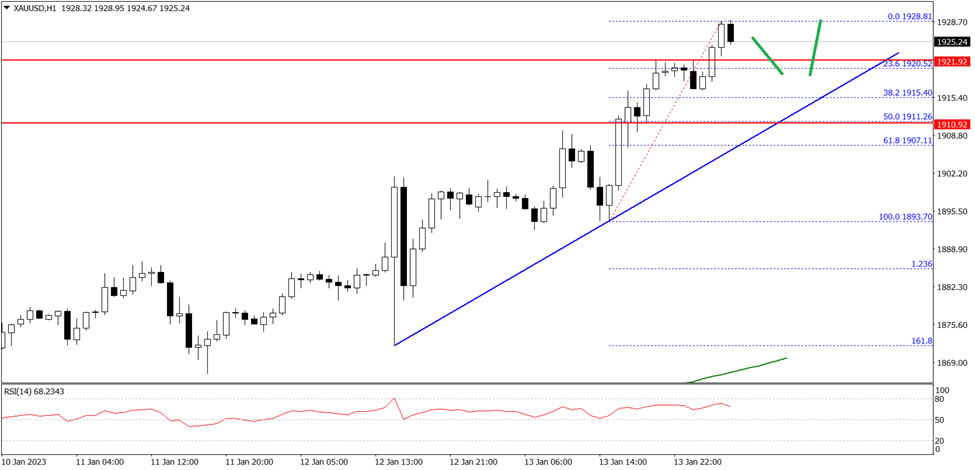
Gold price started a fresh increase from the $1,865 zone against the US Dollar. The price was able to settle above the $1,880 level to move into a positive zone.
The pair even climbed above the $1,900 level and the 50 hourly simple moving average. The price is now trading above the $1,910 level and is showing positive signs. An immediate resistance on the upside is near the $1,930 level.
The first major resistance is near $1,942 on FXOpen. The next main resistance could be near the $1,950 level, above which the price could start a steady increase towards the $1,965 level.
On the downside, an immediate support is near the $1,920 level. The next major support is near the $1,910 level, below which the price might decline towards the $1,888 support level in the near term. Any more losses might call for a test of $1,880.
EURUSD Storms to a Fresh 8-Month High
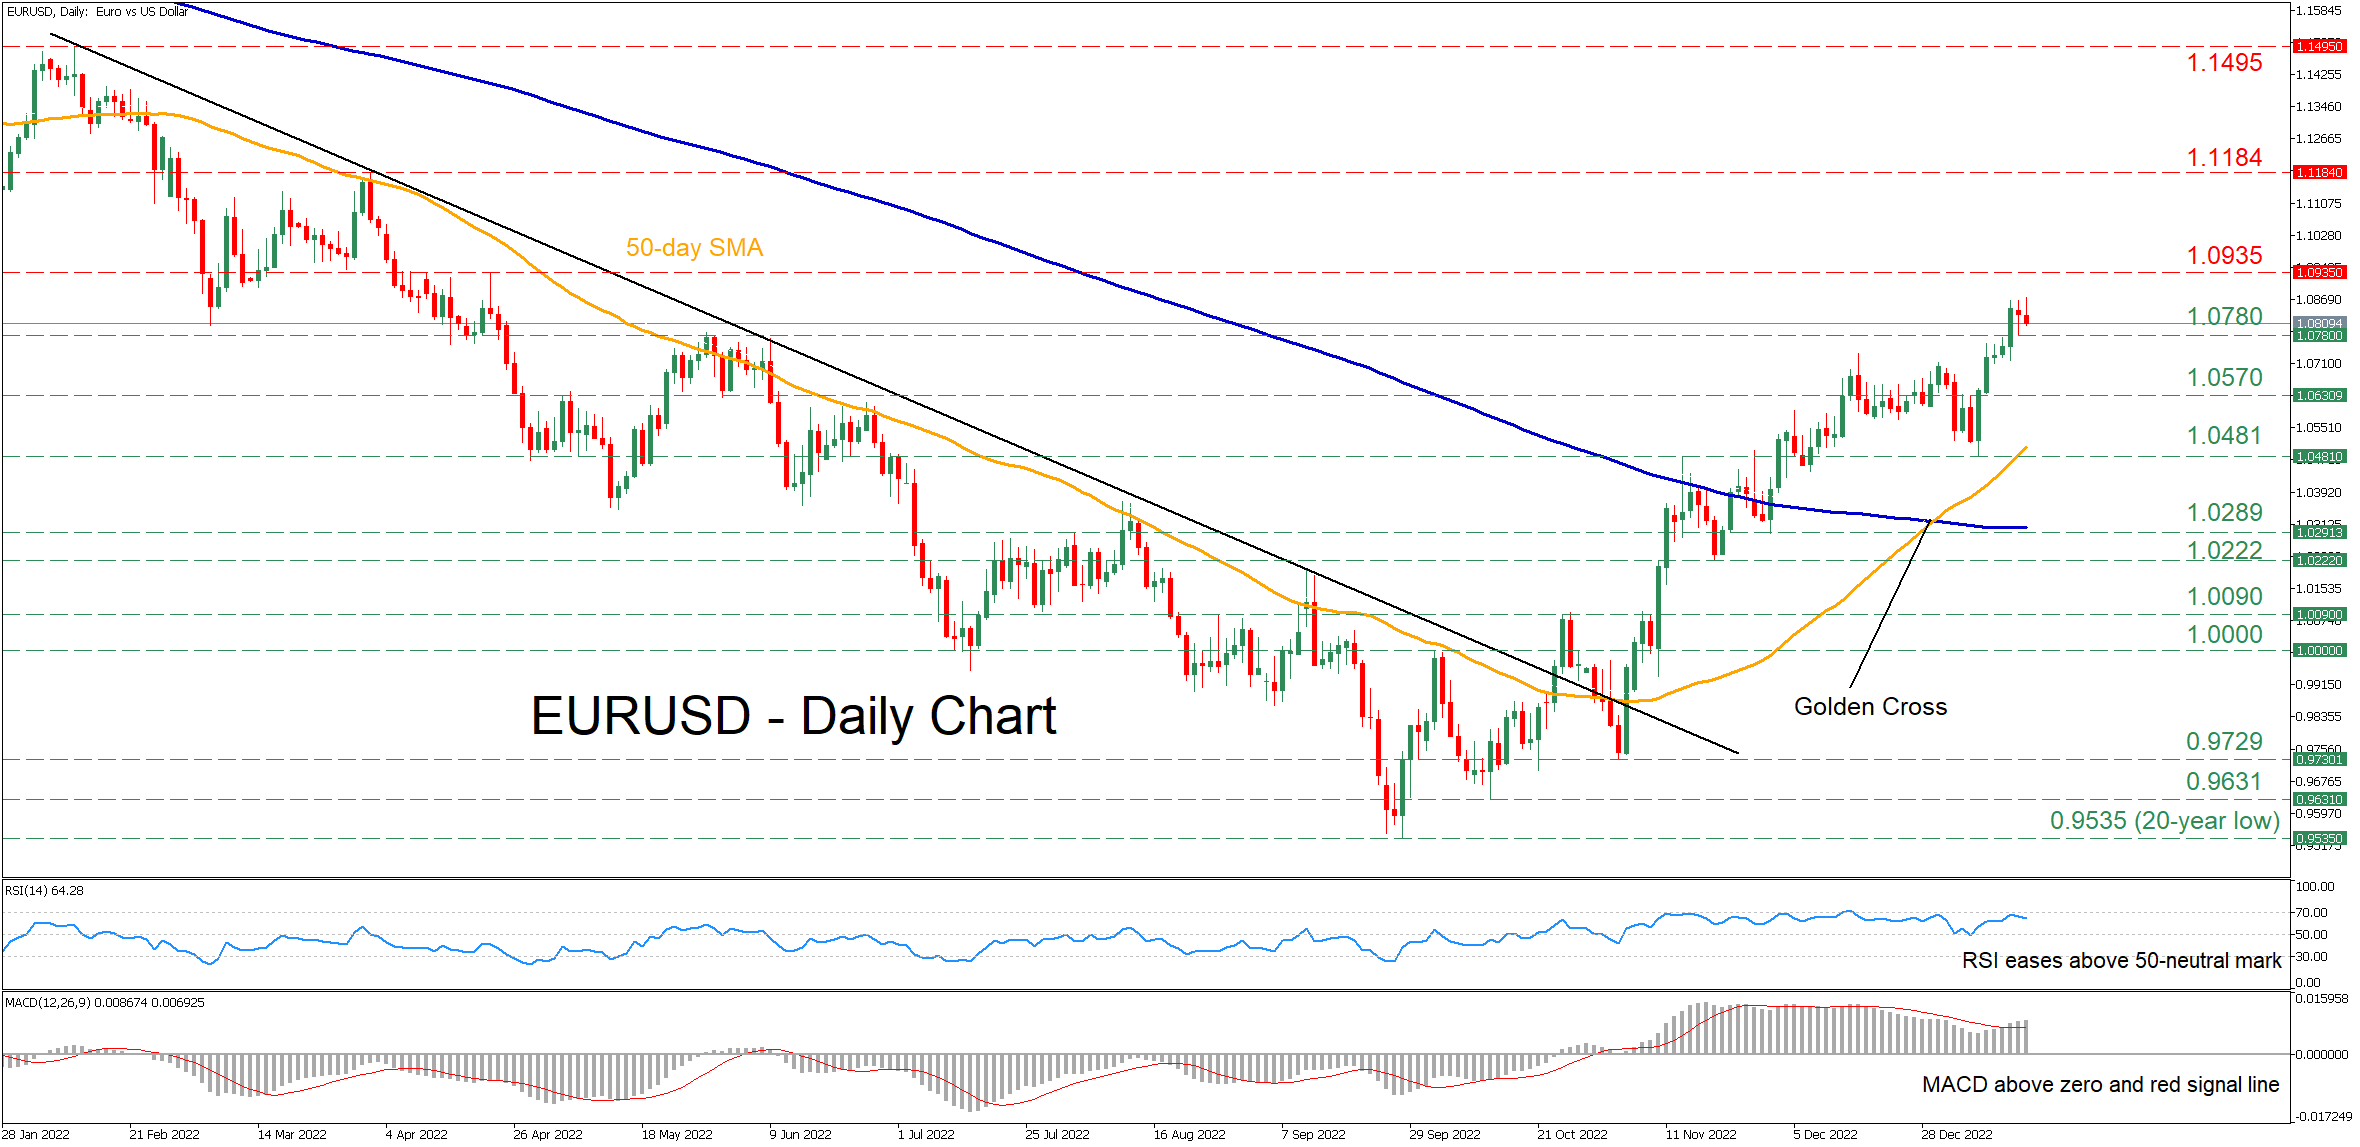
EURUSD has been attempting a strong rebound since early October when its steep downtrend came to a halt at the 20-year low of 0.9535. In the last couple of daily sessions, the pair recorded a fresh 8-month peak, extending its medium-term pattern of higher highs and higher lows.
The momentum indicators currently suggest that bullish forces are in control. Specifically, the RSI has flatlined in the positive region, while the MACD histogram is strengthening above both zero and its red signal line.
Should buying pressures persist, the pair could ascend towards the April resistance zone of 1.0935. Conquering this barricade, the bulls could then aim for the March high of 1.1184. A break above the latter may trigger an advance towards the February peak of 1.1495.
On the flipside, if the pair experiences a downside correction, immediate support could be encountered at 1.078, which also acted as strong resistance in May. Diving beneath that region, the price could test 1.057 before the recent low of 1.0481 comes under examination. Failing to halt there, the November support of 1.0289 might provide downside protection.
In brief, EURUSD appears ready to extend its recovery as near-term risks remain tilted to the upside. However, the pair could experience a consolidation phase before its advance resumes.
Gold Slips from Almost 9-Month High
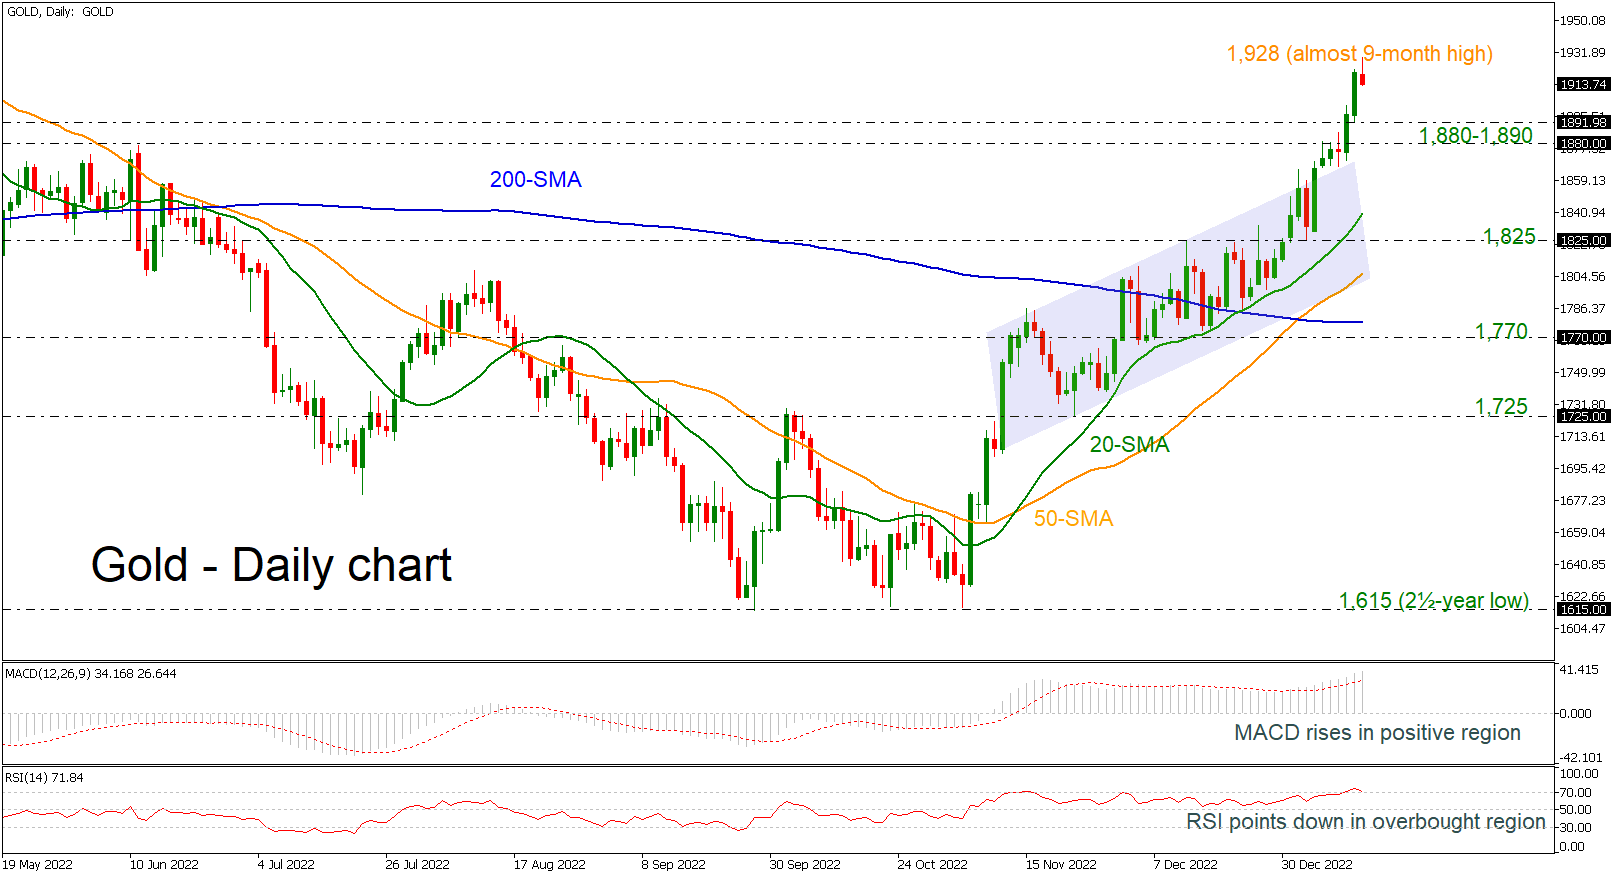
Gold prices are retreating after the rally towards a fresh almost-nine-month high of 1,928, holding well above the short-term upward sloping channel, suggesting more aggressive buying interest. The MACD oscillator is extending the positive momentum above its trigger and zero lines; however, the RSI is ticking down in the overbought region, indicating a bearish correction.
Immediate support is being provided by the 1,880-1,890 region before resting near the 20-day simple moving average (SMA) currently at 1,840. However, should prices dip lower, the next support would likely come from the 1,825 barrier ahead of the 50-day SMA at 1,806 and the crucial 200-day SMA at 1,778.
In case of an upward attempt, the 2,000 psychological mark, registered in April 2022 would likely be a strong obstacle for the bulls before moving towards the 20-month high of 2,070.40.
In the medium term, the bullish outlook remains strongly intact, with the moving averages all pointing upwards. However, should prices decline below the 200-day MA, this would risk shifting the medium-term picture to a more neutral one.
Bitcoin Has Confirmed a Reversal to Growth But Needs Tactical Respite
Market picture
The bitcoin price has surpassed $21K, adding around 23% over the week. Ethereum jumped 20% to $1570. Other leading altcoins in the top 10 gained between 9% (BNB) and 50% (Solana). Solana has re-entered the top 10, pushing Polygon aside.
The total crypto market capitalisation rose 18.4% over the week, approaching $1 trillion again, according to CoinMarketCap.
Bitcoin was outperforming altcoins this time, which can easily be attributed to the positivity of the stock market last week.
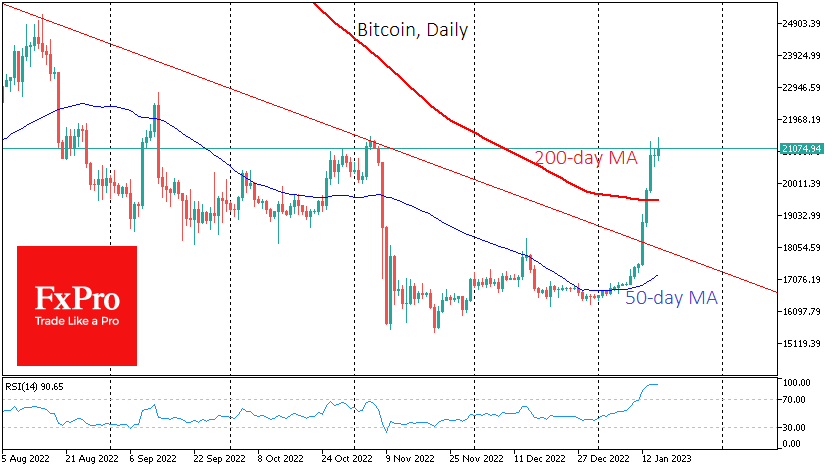
The first cryptocurrency also responded very well to technical signals. Since securing above the 50-day average on January 4, bitcoin has been closing all days with gains. A consolidation above the previous local high and a break of the downtrend resistance caused an acceleration in growth. BTCUSD closed above the 200-day average on Friday, contributing to the weekend’s positive momentum.
Trading near the $21K level brought quotes back to the area before the FTX crash, and this is a new test of the local highs. Traders might want to be prepared that the market will need a short-term correction towards $19.5K before we see another momentum, as locally, Bitcoin looks overheated.
News background
The US Securities and Exchange Commission (SEC) has charged cryptocurrency exchange Gemini and crypto lending service Genesis with selling unregistered securities.
Crypto lending platform Nexo recorded a significant outflow of customer funds amid reports of searches at its Bulgarian office as part of an investigation into potential AML policy violations. Authorities have accused the crypto bank of money laundering, tax irregularities, fraud and providing banking services without a licence.
The Republican Party, which won a majority in the lower house of the US Congress late last year, has begun forming a subcommittee to regulate cryptocurrencies.
The new CEO of cryptocurrency hardware vendor Trezor, Matej Zak, said the financial independence that bitcoin brings is far more important than its market value. He said there would be a consolidation of the crypto market in 2023 and then a bullish trend, which Trezor plans to prepare for.