Sample Category Title
Yen Firms Up after Strong PPI, Dollar Staying Pressured
Yen firms up against Dollar in Asian session today, after PPI report adds more bullets for BoJ to start tweaking monetary policy. Investors in Japan are also feeling the risk of stimulus exit, and push Nikkei down more than -1%. Nevertheless, Yen is overall mixed for now. Aussie and Kiwi are so far the firmer ones. Dollar is the weakest, extending last week's decline while European majors are slightly on the soft side too.
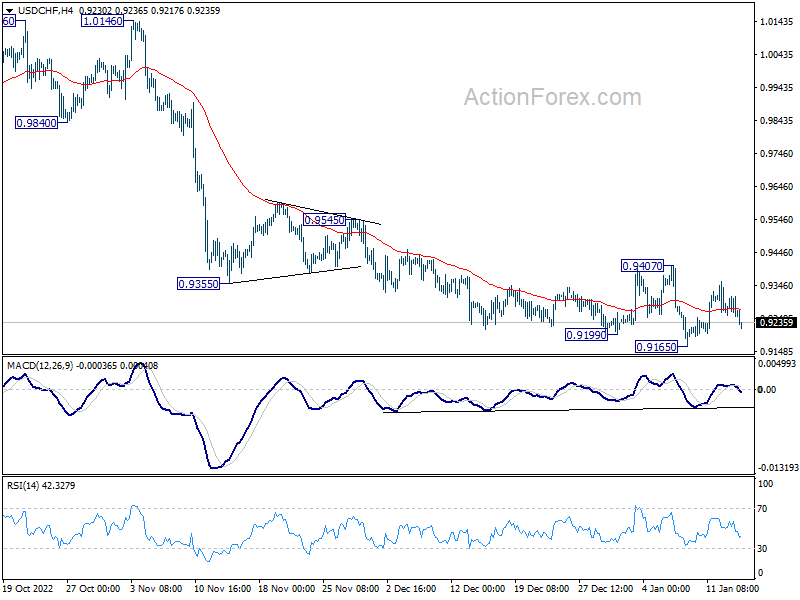
Technically, Swiss Franc is clearly lagging behind others in the rally again the greenback. USD/CHF has indeed failed to break out from range last week. A focus for this week would indeed be on whether USD/CHF would break through 0.9407 resistance to signal short term bottoming. If Dollar is going to rebound, Swissy is currently an easier target.
In Asia, at the time of writing, Nikkei is down -1.16%. Hong Kong HSI is up 0.73%. China Shanghai SSE is up 1.44%. Singapore Strait Times is down -0.19%. Japan 10-year JGB yield is up 0.0005 at 0.512.
Bitcoin pressing resistance after regaining 20k
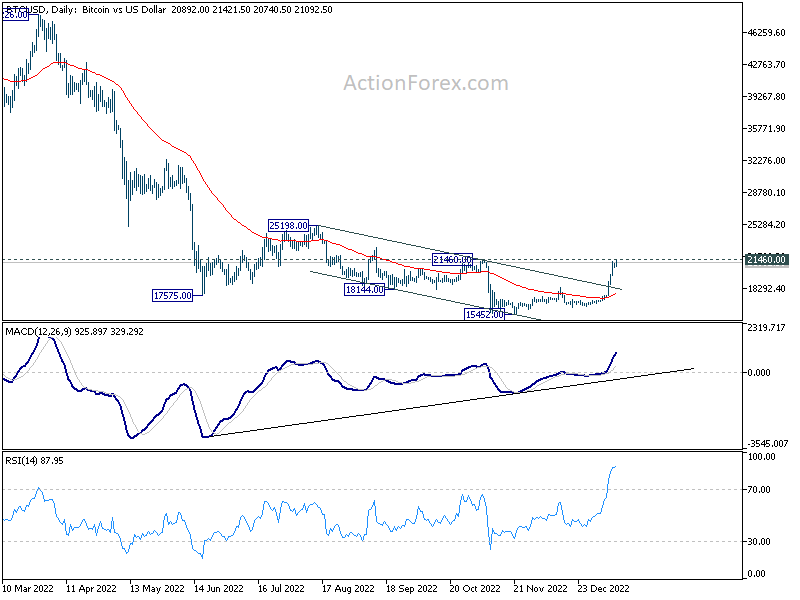
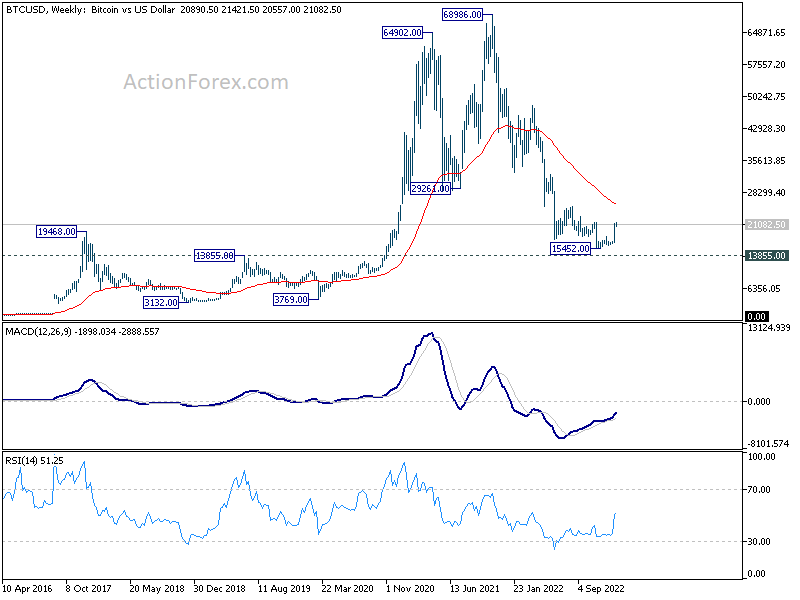
Bitcoin started the year strongly and regained 20k handle last week. Total market cap also surged past USD 400B level. The move followed overall risk-on sentiment, on expectations that Fed is ready to further slow down the tightening pace. While it's still early to call for a sustainable trend reversal, the worst looks increasingly likely behind.
Technically, considering bullish convergence condition in daily and week MACD, 15452 should be a medium term bottom at least. Immediate focus is now on 21460 resistance. Firm break there will confirm this case and bring further rise back to 25198 resistance.
Nevertheless, to secure a trend reversal, Bitcoin will need to break through 55 week EMA (now at 25677) in rather decisive manner. Otherwise, it's probably just setting up the range for some medium term sideway trading instead. So, 25k would be the next level to pay attention to.
AUD/CAD extending near term rally, to target 0.96 next
While risk on-sentiment is supporting commodity currencies in general, Aussie has been outperforming others recently. Reacceleration in Australian consumer inflation as shown in last week's November monthly CPI data suggests little room for RBA to pause for now. Additionally, there is optimism over China's reopening, as well as resumption of coal purchases.
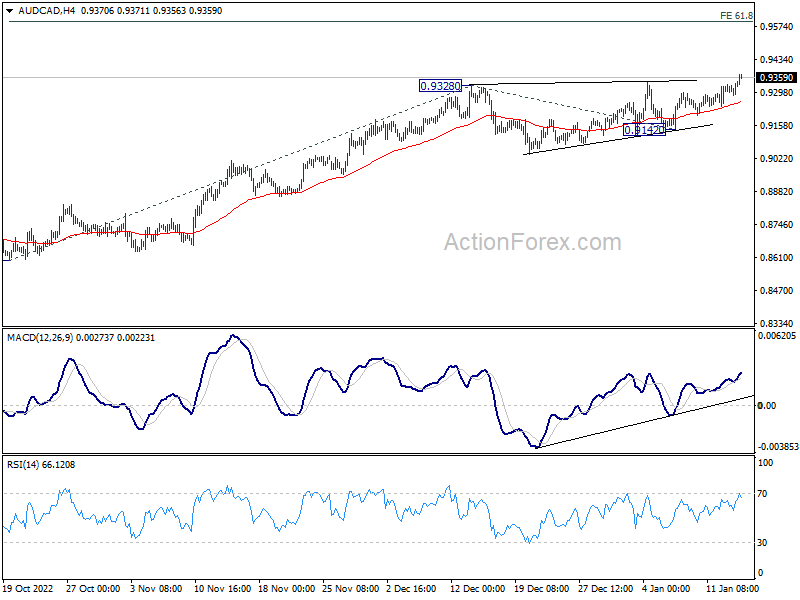
AUD/CAD opened the week with solid buying. the development should confirm resumption of whole rise from 0.8596 low. Near term outlook will stay bullish as long as 0.9142 support holds, even in case of retreat. Next target is 61.8% projection of 0.8596 to 0.9328 from 0.9142 at 0.9594.
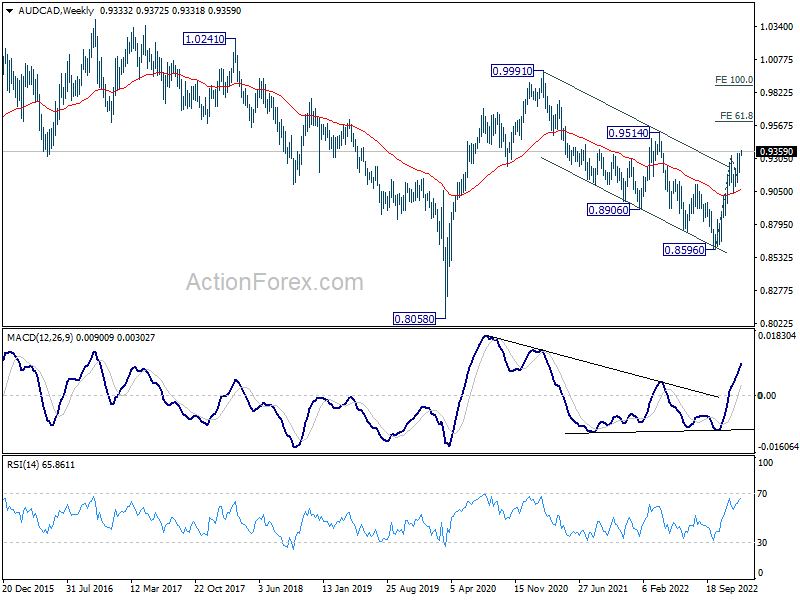
During the move, AUD/CAD should also take out 0.9514 resistance to confirm completion of the three-wave corrective decline from 0.9991 (2021 high). That would set the stage for further rally through 0.9991 to resume the rise from 0.8058 (2020 low) in the medium term.
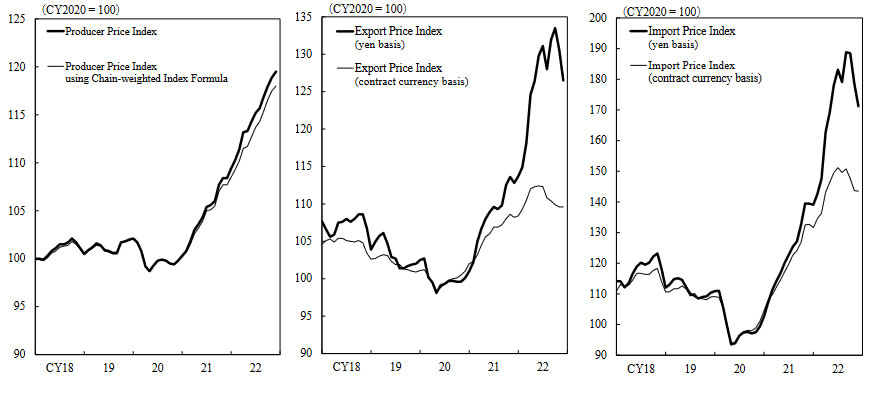
Japan PPI up 10.2% yoy in Dec, second highest on record
Japan PPI rose 10.2% yoy in December, accelerated from 9.7% yoy, above expectation of 9.5% yoy. The reading topped 10% handle for the second time in 2022, marking the second-largest gains on record, following the 10.3% yoy jump in September.
For 2022, wholesale prices rose 9.7% on average, hitting a new record high since comparable data became available in 1981. It's also twice as fast as in 2021 when a 4.6% increase was reported.
BoJ to highlight the week of more inflation and retail sales data
BoJ meeting will be the main focus of the week. The majority of economists are still expecting no change in monetary policy. Yet, there are some speculations of further tweak in yield curve control, such as lifting the 10-year JGB yield cap to 0.75%. Eventually, BoJ is getting more and more likely to abandon YCC soon and set the stage for rate hike later in the year. So, even if the central bank does nothing, eyes will be on any message regarding the path forward.
Accounts of ECB's December meeting will also be watched to confirm the message that more 50bps rate hikes lie ahead in at least February and March meeting. Regarding central bank activities, Fed will also publish Beige Book economic report.
On the data front, US retail sales and PPI; Germany ZEW;Japan CPI; UK employment, CPI and retail sales; Canada CPI and retail sales, Australia employment will be closely watched. China will also release Q4 GDP and December data.
Here are some highlights for the week:
- Monday: Australia MI inflation gauge; Japan PPI, machine tools orders;Canada manufacturing sales.
- Tuesday: Australia Westpac consumer sentiment; China GDP, industrial production, retail sales, fixed asset investment; Japan tertiary industry index; Germany CPI final, ZEW economic sentiment; UK employment; Canada CPI, housing starts; US empire state manufacturing.
- Wednesday: BoJ rate decision, Japan machine orders; UK CPI; Eurozone CPI final; Canada IPPI and RMPI; US retail sales, PPI, industrial production, business inventories, NAHB housing index, Fed Beige Book.
- Thursday: Japan trade balance; Australia employment; Swiss PPI; ECB meeting accounts; Canada wholesale sales; US Philly Fed survey, jobless claims, building permits and housing starts.
- Friday: New Zealand BusinessNZ manufacturing; Japan CPI; UK Gfk consumer sentiment, retail sales; Germany PPI; Canada retail sales; US existing home sales.
USD/JPY Daily Outlook
Daily Pivots: (S1) 127.07; (P) 128.25; (R1) 129.04; More...
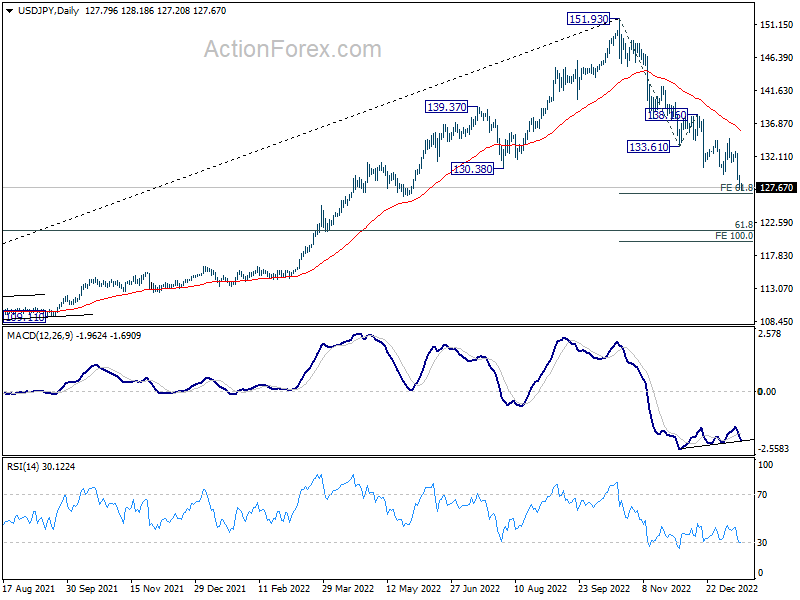
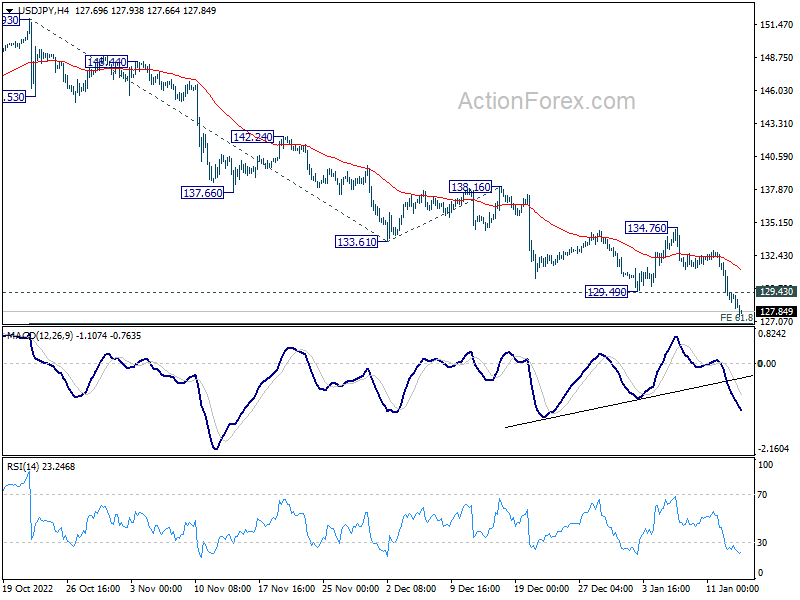
Intraday bias in USD/JPY remains on the downside at this point. Current fall from 1.151.93 in progress for 61.8% projection of 151.93 to 133.61 from 138.16 at 126.83. Break there will target 121.43 fibonacci level next. On the upside, above 129.3 minor resistance will turn intraday bias neutral first. But outlook will remain bearish as long as 134.76 resistance holds.
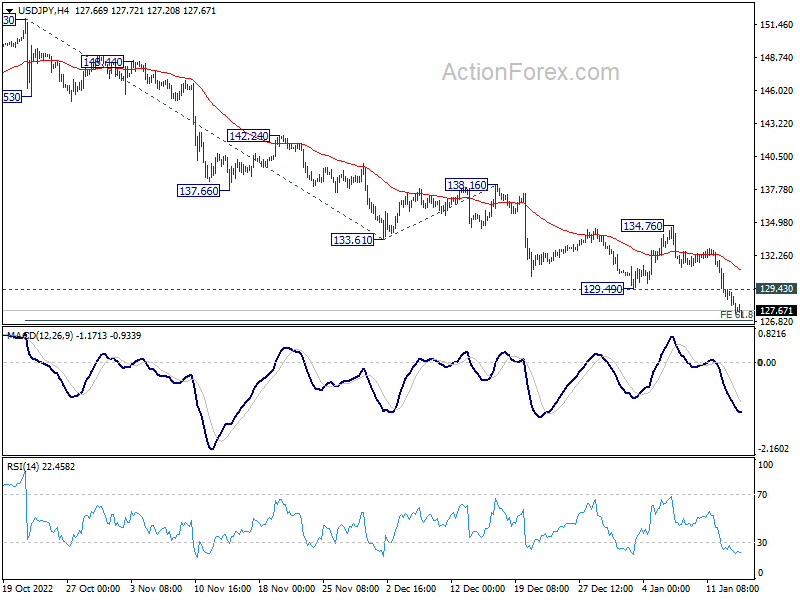
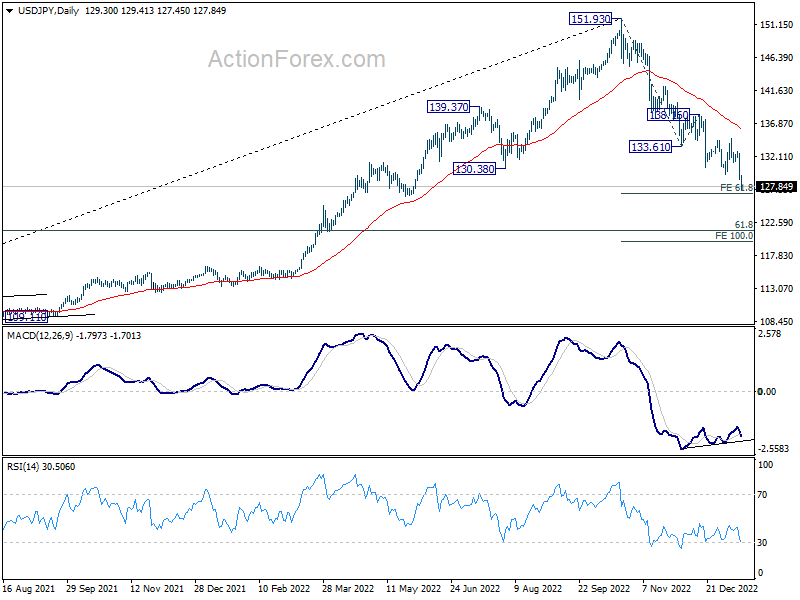
In the bigger picture, the firm break of 55 week EMA (now at 131.59) raises the chance of medium term bearish reversal, but that's not confirmed yet. Strong support could be seen around 61.8% retracement of 102.58 to 151.93 at 121.43 and 38.2% retracement of 38.2% retracement of 75.56 to 151.93 at 122.75 to bring rebound. But break of 134.76 resistance is needed to indicate bottoming first. Otherwise further fall will remain in favor.
Economic Indicators Update
| GMT | Ccy | Events | Actual | Forecast | Previous | Revised |
|---|---|---|---|---|---|---|
| 23:50 | JPY | PPI Y/Y Dec | 10.20% | 9.50% | 9.30% | 9.70% |
| 00:00 | AUD | TD Securities Inflation M/M Dec | 0.20% | 1.00% | ||
| 06:00 | JPY | Machine Tool Orders Y/Y Dec P | -7.70% | |||
| 13:30 | CAD | Manufacturing Sales M/M Nov | 2.30% | 2.80% | ||
| 15:30 | CAD | BoC Business Outlook Survey |
Japan PPI up 10.2% yoy in Dec, second highest on record
Japan PPI rose 10.2% yoy in December, accelerated from 9.7% yoy, above expectation of 9.5% yoy. The reading topped 10% handle for the second time in 2022, marking the second-largest gains on record, following the 10.3% yoy jump in September.
For 2022, wholesale prices rose 9.7% on average, hitting a new record high since comparable data became available in 1981. It's also twice as fast as in 2021 when a 4.6% increase was reported.
AUD/CAD extending near term rally, to target 0.96 next
While risk on-sentiment is supporting commodity currencies in general, Aussie has been outperforming others recently. Reacceleration in Australian consumer inflation as shown in last week's November monthly CPI data suggests little room for RBA to pause for now. Additionally, there is optimism over China's reopening, as well as resumption of coal purchases.
AUD/CAD opened the week with solid buying. the development should confirm resumption of whole rise from 0.8596 low. Near term outlook will stay bullish as long as 0.9142 support holds, even in case of retreat. Next target is 61.8% projection of 0.8596 to 0.9328 from 0.9142 at 0.9594.
During the move, AUD/CAD should also take out 0.9514 resistance to confirm completion of the three-wave corrective decline from 0.9991 (2021 high). That would set the stage for further rally through 0.9991 to resume the rise from 0.8058 (2020 low) in the medium term.
Bitcoin pressing resistance after regaining 20k
Bitcoin started the year strongly and regained 20k handle last week. Total market cap also surged past USD 400B level. The move followed overall risk-on sentiment, on expectations that Fed is ready to further slow down the tightening pace. While it's still early to call for a sustainable trend reversal, the worst looks increasingly likely behind.
Technically, considering bullish convergence condition in daily and week MACD, 15452 should be a medium term bottom at least. Immediate focus is now on 21460 resistance. Firm break there will confirm this case and bring further rise back to 25198 resistance.
Nevertheless, to secure a trend reversal, Bitcoin will need to break through 55 week EMA (now at 25677) in rather decisive manner. Otherwise, it's probably just setting up the range for some medium term sideway trading instead. So, 25k would be the next level to pay attention to.
EUR/USD Breaks Higher, Why It Could Revisit 1.1000
Key Highlights
- EUR/USD started a fresh increase above the 1.0800 resistance.
- A connecting bullish trend line is forming with support near 1.0820 on the 4-hours chart.
- GBP/USD started a fresh increase above the 1.2250 resistance zone.
- USD/JPY extended its decline below the 129.50 support zone.
EUR/USD Technical Analysis
The Euro started a fresh increase above the 1.0750 resistance zone against the US Dollar. EUR/USD broke the 1.0800 resistance to move into a positive zone.
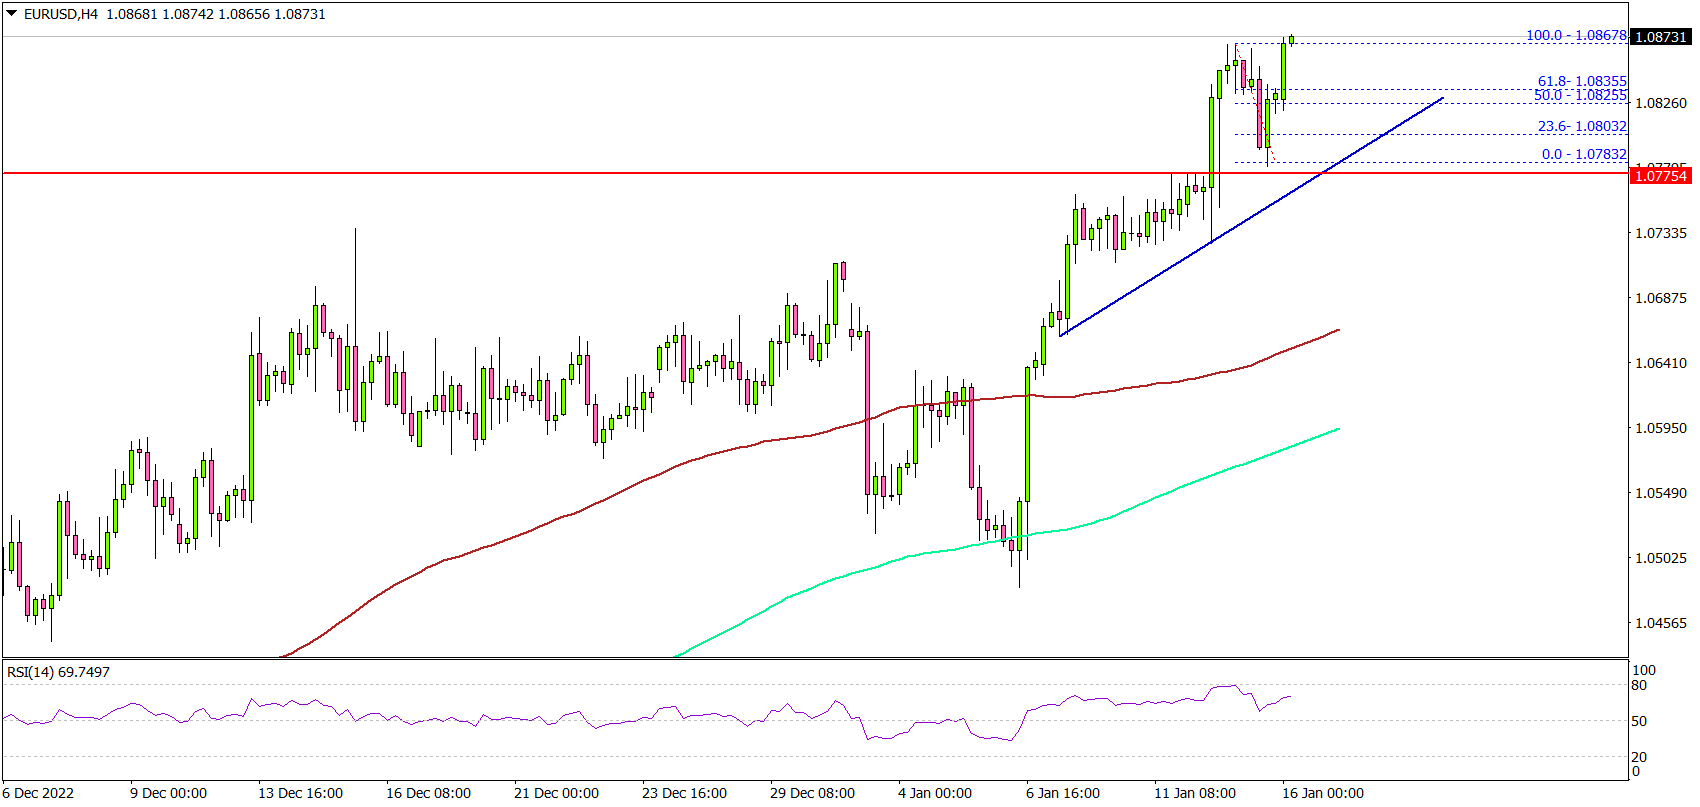
Looking at the 4-hours chart, the pair settled above the 1.0800 zone, the 100 simple moving average (red, 4-hours) and the 200 simple moving average (green, 4-hours).
The pair gained pace above the 1.0820 resistance zone. The pair is now showing a lot of positive signs and trading above 1.0850. On the upside, an initial resistance is near the 1.0880 level. The next major resistance may perhaps be near 1.0920.
A clear move above the 1.0920 resistance might start a steady increase. In the stated case, EUR/USD could even surpass the 1.0980 zone. The next key hurdle is near 1.1000, above which the pair could climb towards the 1.1120 resistance zone.
On the downside, there is a major support at 1.0820. The next major support is near the 1.0780 level. A downside break below the 1.0780 zone might push the pair lower.
The next major support sits near the 1.0720 level. Any more losses might open the doors for a move towards the 1.0650 support zone.
Looking at GBP/USD, the pair is gaining pace above the 1.2250 resistance and might continue to rise in the near term.
Economic Releases
- German Wholesale Price Index for Dec 2022 (MoM) – Forecast -1.4%, versus -0.9% previous.
Forex and Cryptocurrencies Forecast
EUR/USD: Low Inflation Has Dropped the Dollar
The main event of the past week, which dealt another blow to the dollar, was the publication on Thursday, January 12, of data on consumer inflation in the US. The actual figures were fully in line with market expectations. The consumer price index (CPI) in annual terms fell to its lowest level since October 2021 in December: from 7.1% to 6.5%, and excluding food products and energy, from 6.0% to 5.7%. Thus, the US inflation rate has been slowing down for 6 months in a row, and core inflation has been slowing down for 3 consecutive months, which is a strong catalyst for easing the Fed's current monetary policy.
Market participants are firmly convinced that the interest rate will be increased by no more than 25 basis points (bp) at the February meeting of the FOMC (Federal Open Market Committee). In particular, Michelle Bowman, a member of the Board of Governors, and Mary Deli, Chairman of the Federal Reserve Bank (FRB) of San Francisco, spoke about this. The head of the Philadelphia Fed, Patrick Harker, left the camp of the hawks as well, also saying that the rate should be raised only by 25 bp.
Fed chief Jerome Powell noted a month ago that the regulator would keep rates at their peak until they were sure that the decline in inflation has become a sustainable trend. According to him, the base rate may be increased to 5.1% in 2023 and stay that high until 2024. However, the latest macro statistics, including data on inflation, business activity and the labor market, suggests that the peak value of the rate will be 4.75%. Moreover, it can even be lowered to 4.50% by the end of 2023.
As a result of these forecasts, the US currency depreciated against all G10 currencies. The DXY dollar index updated the June 2022 low, falling to 102.08 (it climbed above 114.00 at the end of September). The 10-year Treasury yield dropped to a monthly low of 3.42%, while EUR/USD jumped to 1.0867, the highest since last April.
The yield spread between 10-year US and German bonds is at its lowest level since April 2020, with smaller European countries narrowing their spreads. This dynamic indicates a decrease in the likelihood of the EU economy falling into a deep recession. Moreover, the winter in Europe turned out to be quite warm and energy prices went down, despite problems with their supply from Russia. And this put pressure on the US currency as well.
China could help the dollar. According to various estimates, China's GDP growth may reach 4.8-5.0%, or even higher in 2023. Such economic activity will add 1.0-1.2% to global inflation, which will give Fed hawks certain advantages in maintaining tight monetary policy. But all this is in the future. The market is currently waiting for the next meeting of the FOMC on February 01 and for the statements that will be made by the US Federal Reserve officials on its results.
EUR/USD closed last week at 1.0833. 20% of analysts expect further strengthening of the euro and the growth of the pair in the coming days, 50% expect that the US currency will be able to win back part of the losses. The remaining 30% of experts do not expect either the first or the second from the pair. The picture among the indicators on D1 is different: all 100% are colored green, but 25% of the oscillators are in the overbought zone. The nearest support for the pair is at 1.0800, then there are levels and zones 1.0740-1.0775, 1.0700, 1.0620-1.0680, 1.0560 and 1.0480-1.0500. The bulls will meet resistance at the levels of 1.0865, 1.0935, 1.0985-1.1010, 1.1130, after which they will try to gain a foothold in the 1.1260-1.1360 echelon.
Next week, traders should take into account that Monday is a holiday in the US, Martin Luther King Day. The calendar can highlight Tuesday, January 17, when the values of the Consumer Price Indices (CPI) and Economic Sentiment (ZEW) in Germany will become known. Data on Eurozone consumer prices and US retail sales will be released on Wednesday, January 18. The December value of the American Producer Price Index (PPI) will also become known the same day.
GBP/USD: Surprise from UK GDP
GBP/USD took advantage of broad pressure on the dollar on Thursday, January 12 to rise to its highest level since December 15, reaching 1.2246. The UK GDP gave the pound bulls a pleasant surprise the next day, on Friday, December 13: it suddenly turned out that the country's economy expanded by 0.1% over the month against expectations of its fall by 0.3%. However, in annual terms, GDP was significantly lower than the previous value: 0.2% against 1.5% a month earlier. As a result, the pair ended the five-day period a little lower than the local high, at the level of 1.2234.
An important day for the pound may be February 02, when the next meeting of the Bank of England (BoE) will take place. And while investors expect the Fed to slow down the rate of interest rate hikes, the Bank of England, on the contrary, will further tighten monetary policy. It is predicted that the rate may rise from the current 3.50% to the level of 4.50% by the summer, which will serve as a certain support for the British currency.
As for the short term, here the median forecast for GBP/USD looks as uncertain as possible: 10% of experts side with the bulls, 25% side with the bears, and the vast majority (65%) have taken a neutral position. Among the oscillators on D1, 90% are colored green, of which a third gives signals that the pair is overbought, the color of the remaining 10% is neutral gray. Trend indicators are 100% on the green side. Support levels and zones for the pair are 1.2200-1.2210, 1.2145, 1.2085-1.2115, 1.2025, 1.1960, 1.1900, 1.1800-1.1840. When the pair moves north, it will face resistance at levels 1.2250-1.2270, 1.2330-1.2345, 1.2425-1.2450 and 1.2575-1.2610, 1.2700 and 1.2750.
As for the developments regarding the UK economy in the coming week, we can highlight Tuesday January 17, when we find out what is happening in the country's labor market. The value of such an important inflation indicator as the Consumer Price Index (CPI) will be published the same day, which will certainly have an impact on the BoE's decision on the interest rate. Data on December retail sales in the UK will also be published at the very end of the working week, on Friday, January 20. It is expected that they will rise by 0.4% compared to the fall of 0.4% in November thanks to the pre-Christmas hype.
USD/JPY: Should We Expect Surprises from the Bank of Japan
The yen turned out to be the favorite of the week, and even on Friday, January 13, it continued to put pressure on the dollar, fixing a local low at 127.45. It put the last chord of the week a little higher, at the level of 127.85.
Why did this happen? First, the yen strengthened against the background of a falling dollar and a decrease in US bond yields (the US/Japan spread fell to its lowest level since August 2022). Being the most sensitive to the dynamics of treasuries, it managed to win back 2.5% from the dollar. And second, the press seriously helped it. Japanese newspaper Yomiuri Shimbun, citing confidential sources, reported that Bank of Japan (BoJ) officials plan to discuss the implications of their ultra-dove approach to monetary policy and consider adjusting their bond-buying program to "reduce its negative effects" on January 17-18. Other adjustments in the actions of the regulator are not ruled out.
The Bank of Japan is the latest major central bank to keep interest rates at a negative level of -0.1%. We wrote Earlier that a radical change in monetary policy can be expected only after April 8. It is on this day that Haruhiko Kuroda, the head of the Bank of Japan, will end hs term, and he may be replaced by a new candidate with a tougher position. And now, almost all experts interviewed by Bloomberg believe that the Japanese Central Bank will not change the main parameters of its policy next week but will limit itself to discussing them. At the same time, 38% of respondents expect real changes either in April or June.
Of course, it will be possible to give more accurate forecasts after the January meeting of the Bank of Japan. So far, the opinion of analysts regarding the near future is distributed as follows: 50% of analysts vote for the correction of the pair to the north, and 50% simply decline to comment. The number of votes cast for the continuation of the downtrend turns out to be 0 this time. For indicators on D1, the picture mirrors the readings for GBP/USD. Among the oscillators, 90% are colored red, of which a third gives signals that the pair is oversold, the color of the remaining 10% is neutral gray. Trend indicators have 100% on the red side. The nearest support level is located in the zone 127.00-127.45, followed by the levels and zones 126.35-126.55, 125.00, 121.65-121.85. Levels and resistance zones are 128.00-128.25, 129.60-130.00, 131.25-131.70, 132.85, 133.60, 134.40 and then 137.50.
From the events of the coming week, in addition to the mentioned meeting of the Bank of Japan and its interest rate decision, the market's attention will be drawn to the subsequent press conferences and comments from the regulator's officials regarding its monetary policy.
CRYPTOCURRENCIES: Thaw or Crypto Spring?
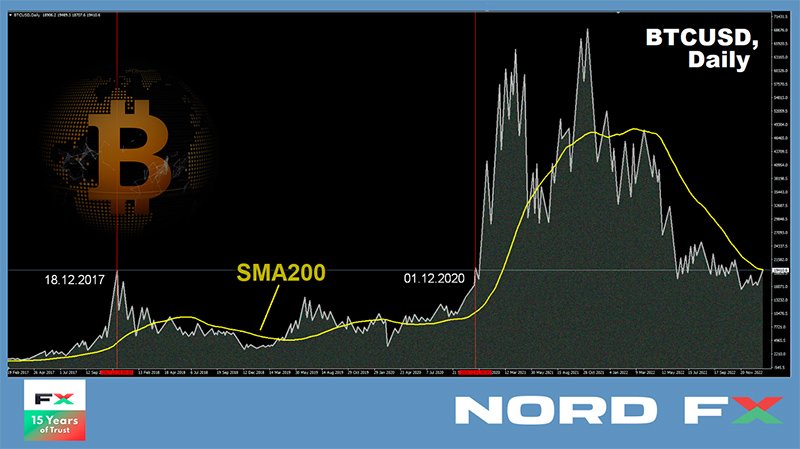
BTC/USD has once again returned to the $18,500-20,000 area. This zone acted as support since last June, and it turned into resistance in November. The pair traded there in December 2017 as well, after which a protracted crypto winter followed. Bitcoin was able to return to these values only three years later, at the end of November-December 2020. This rise marked the beginning of a powerful bullish rally then: the coin rose in price by 3.5 times in less than six months, reaching $64,750 in April 2021. This was followed by another collapse.
How will bitcoin behave this time: will it collapse like in 2017, or will it take off like in 2020? Is this the onset of crypto spring or just a small thaw? There is no consensus on this matter. It is possible that the pair's current rise is due not to the growing strength of digital gold, but to the dollar, which has been weakening for 16 consecutive weeks. Bitcoin received a powerful boost after the publication of the US CPI. Against this background, the voices of bitcoin optimists sound more confident and louder. Moreover, the liquidators of the FTX exchange found liquid assets worth $5 billion, which will be used to pay off part of the debts to creditors. According to some analysts, along with the decline in CPI, this makes it possible for crypto markets not to worry too much about the macroeconomic picture, which is still bearish.
Dante Disparte, Head of Strategic Development at Circle, believes that despite the 2022 Ice Age, digital assets and blockchain will continue to be integral tools of the economy. Major banks and financial institutions will continue to introduce cryptocurrencies into their product lines. As for the bankruptcy of several crypto-lenders and the collapse of the FTX exchange, these events, according to Dispart, can be a boon for the industry, as they lay the foundation for more responsible and affordable investments.
Increasing regulatory pressure can help restore investor interest and confidence in the industry. The long-awaited MiCA (Markets in Crypto Assets Regulation) is expected to come into force this year. The SEC is highly likely to take a number of important steps in this direction as well.
Another expert with a positive outlook is University of Sussex finance professor Carol Alexander. She had been prone to BTC falling to $10,000 in 2022 in her previous forecast. This did not happen, although the forecast almost came true. However, the financier predicts now that the first cryptocurrency can reach $50,000 in 2023. The professor believes that the catalyst will be the influx of more "dominoes" that fell apart after the collapse of the FTX exchange. "2023 will be a managed bull market, not a bubble," she writes. - We will not see a jump in the rate, as before. But we will see a month or two of stable trending prices interspersed with periods of limited range, and perhaps a couple of short-term crashes."
Bill Miller, an American investor, and fund manager, also defended bitcoin. He believes it is wrong to link BTC to the bankruptcy of crypto companies such as FTX and Celsius, since these are centralized entities that should not be confused with the decentralized bitcoin network. Miller has once again confirmed his belief in the main cryptocurrency and said that its price will definitely increase by the end of the year.
According to Alistair Milne, Chief Information Officer of the Altana Digital Currency Fund, "we should see bitcoin at least at $45,000 by the end of 2023." However, the specialist warns that "if central banks decide to allow a higher inflation target […] to avoid a recession, hard assets could become fashionable again." As for the longer-term outlook, Milne believes that BTC should reach $150,000-300,000 by the end of 2024, "and this is probably the peak of opportunities for the bulls."
Tim Draper, a third-generation venture capitalist and co-founder of Draper Fisher Jurvetson, is also hoping for 2024. He believes that the halving planned for this year will have a big impact on the price of the main cryptocurrency, which will eventually reach $250,000.
Another expert who joined the bull train was analyst Dave the Wave, known for predicting the 2021 bitcoin crash. He believes that the coin is now on its way to breaking through its "long-term resistance diagonal." In his opinion, "a technical movement over the next month or two may be enough to break this resistance." Dave the Wave has previously said that its Logarithmic Growth Curve (LGC) model indicates that bitcoin could rise to $160,000 by January 2025.
Eric Wall, Chief Investment Officer at crypto-currency hedge fund Arcane Assets, gives a much more modest forecast: the expert believes that the price of bitcoin may exceed $30,000 in the coming year. Eric Wall often bases his comments on the BTC Rainbow Price Chart, an analytical tool created by BlockchainCenter. And this time he said that the $15,400 exchange rate was the bottom for bitcoin.
Jiang Zhuoer, founder and CEO of a number of crypto projects, agrees with Eric Wall. By his calculations, all three previous bear markets took the same amount of time to go from the previous high to the bottom. Based on this, Jiang Zhuoer concludes that we are now in the last sideways period of the bear market bottom. His optimistic estimate suggests that if the 2018 scenario repeats, BTC price could be flat for another two months before the next bull run begins. At the same time, events such as bankruptcies of crypto companies will no longer have a significant impact on the prices of major digital assets.
The strategists of the British international financial conglomerate Standard Chartered strongly disagree with this statement. According to them, "more and more crypto companies and exchanges are facing insufficient liquidity, leading to further bankruptcies and the collapse of investor confidence," which could lead to BTC falling to $5,000 this year.
It is said that the truth lies in the middle. This is exactly the "optimistic-pessimistic" position taken by Galaxy Digital CEO Mike Novogratz. He said in a recent interview with CNBC that the prospects for cryptocurrencies are not so good, but everything is not so bad either. Leveraged traders closed out their positions in December 2022, creating what the entrepreneur called a "clean market." In addition, market participants have significantly reduced their spending and will continue to do so in order to get through the transition period. Novogratz also stressed that 2023 will be a defining year for the future development of the industry. At the same time, he pointed to the problems that exist between Gemini and Genesis, which could create an unpleasant situation for the entire digital asset market.
Another source of nervousness is the Binance situation. According to a recent Forbes report, the exchange lost $12 billion in assets due to users continuing to withdraw money from the exchange. And despite statements from Binance CEO Changpeng Zhao that the situation has calmed down, the outflow of funds is now only increasing.
The new year 2023 has just come. There are still eleven and a half months ahead, which will show which of the forecasts will turn out to be closer to reality. In the meantime, at the time of writing the review (Saturday January 13), BTC/USD has broken through the $20,000 horizon and is trading in the $20,500 zone. The total crypto market capitalization is $0.968 trillion ($0.790 trillion at the low of December 30). The Crypto Fear & Greed Index rose from 25 to 46 points in a week, but still remains in the Fear zone, although it is already close to the Neutral state.
EUR/USD Weekly Outlook
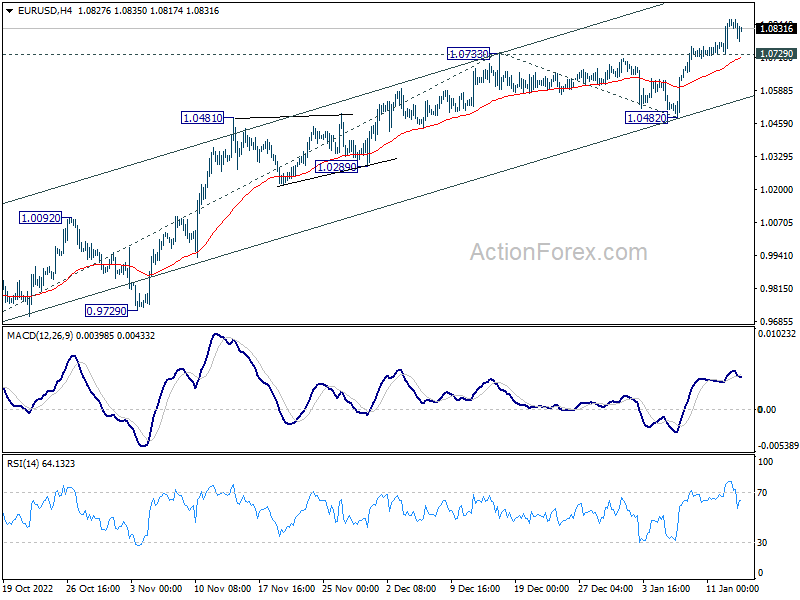
EUR/USD's up trend from 0.9534 resumed by breaking through 1.0733 last week and hit as high as 1.0867. Initial bias stays on the upside this week for 61.8% projection of 0.9630 to 1.0733 from 1.0482 at 1.1164 next. On the downside, below 1.0729 minor support will turn intraday bias neutral again first. But near term outlook will stay bullish as long as 1.0482 support holds, in case of retreat.
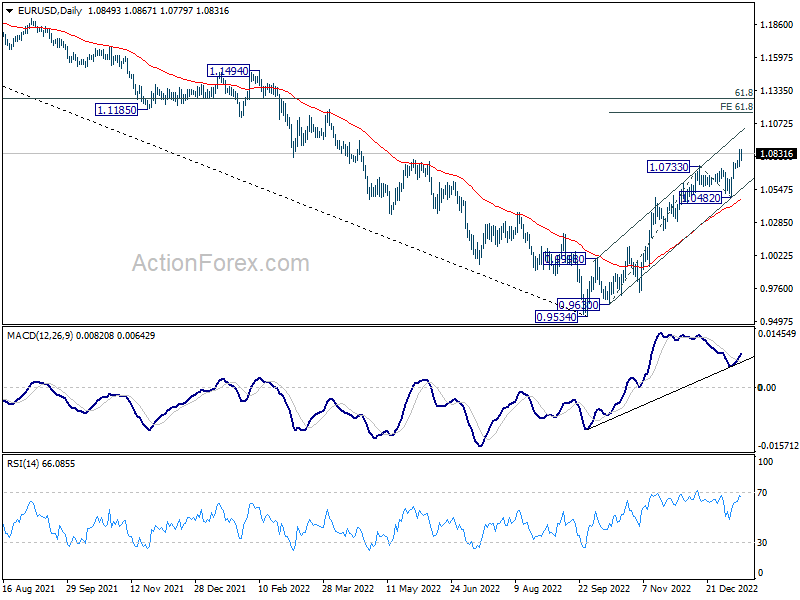
In the bigger picture, current development suggests that the rally from 0.9534 low (2022 low) is a medium term up trend rather than a correction. Further rally is in favor to 61.8% retracement of 1.2348 (2021 high) to 0.9534 at 1.1273 next. This will remain the favored case as long as 1.0482 support holds.
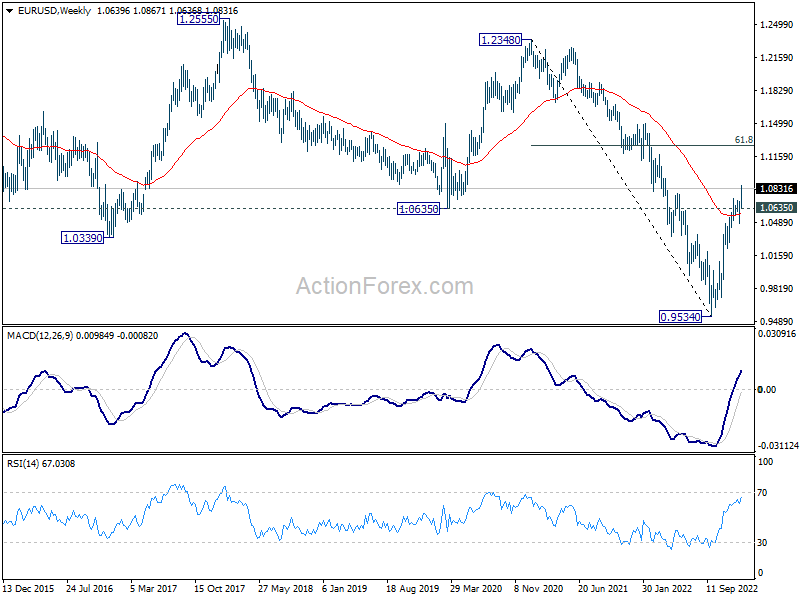
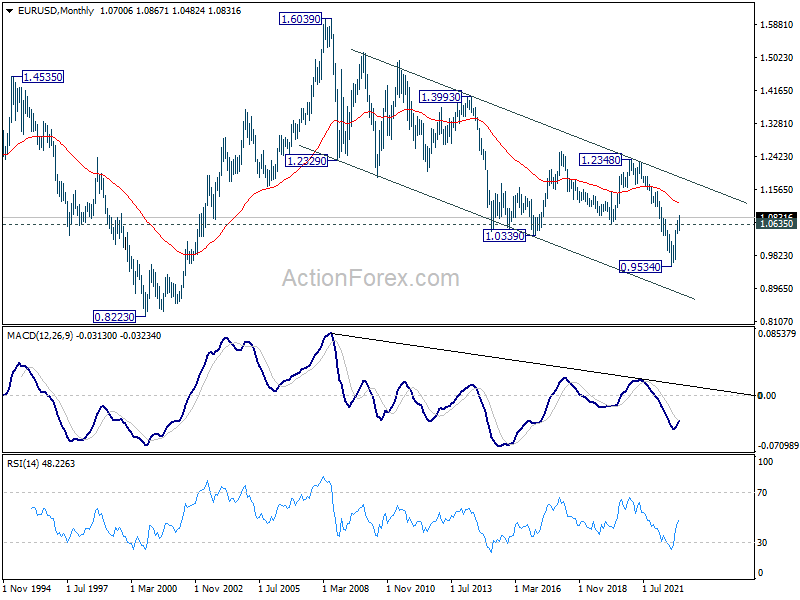
In the long term picture, while it's too early to call for long term trend reversal at this point, the strong break of 1.0635 support turned resistance (2020 low) should at least turn outlook neutral. Focus will turn to 55 month EMA (now at 1.1207). Rejection by this EMA will revive long term bearishness.
USD/JPY Weekly Outlook
USD/JPY's decline from 151.93 resumed last week and fell to as low as 127.45. Initial bias stays on the downside this week for 61.8% projection of 151.93 to 133.61 from 138.16 at 126.83. Break there will target 121.43 fibonacci level next. On the upside, above 129.3 minor resistance will turn intraday bias neutral first. But outlook will remain bearish as long as 134.76 resistance holds.
In the bigger picture, the firm break of 55 week EMA (now at 131.59) raises the chance of medium term bearish reversal, but that's not confirmed yet. Strong support could be seen around 61.8% retracement of 102.58 to 151.93 at 121.43 and 38.2% retracement of 38.2% retracement of 75.56 to 151.93 at 122.75 to bring rebound. But break of 134.76 resistance is needed to indicate bottoming first. Otherwise further fall will remain in favor.
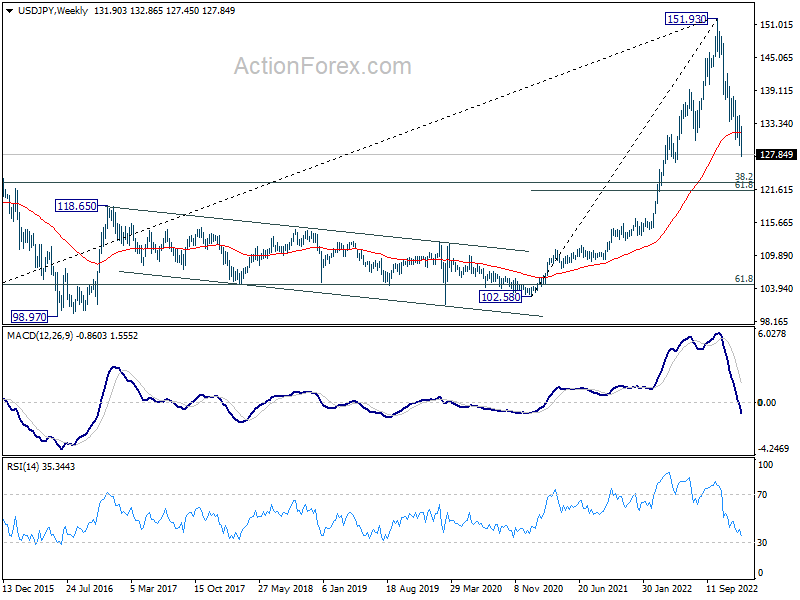
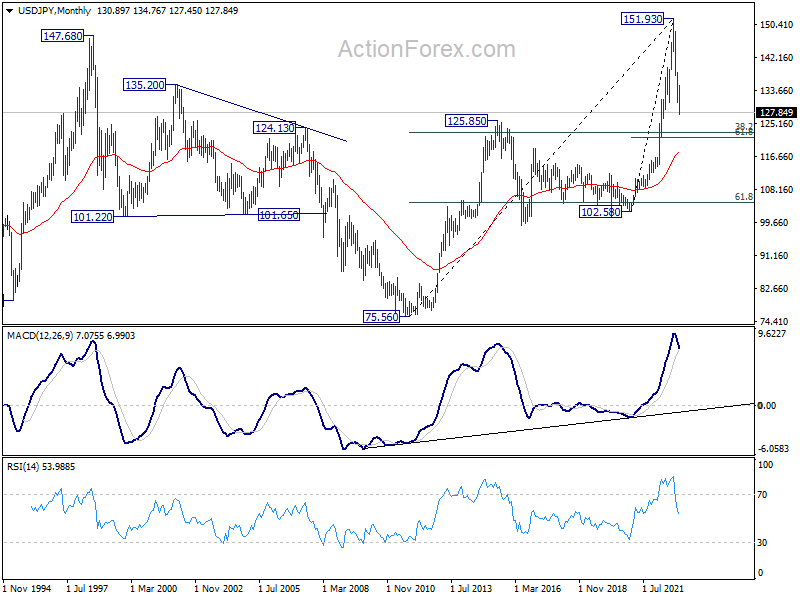
In the long term picture, 151.93 looks increasingly likely to be a long term major top. But it's too early to call for long term bearish reversal at this point. Rebound from around 38.2% retracement of 75.56 to 151.93 at 122.75 will keep the case open for price action from 151.93 to be just a corrective pattern.
GBP/USD Weekly Outlook
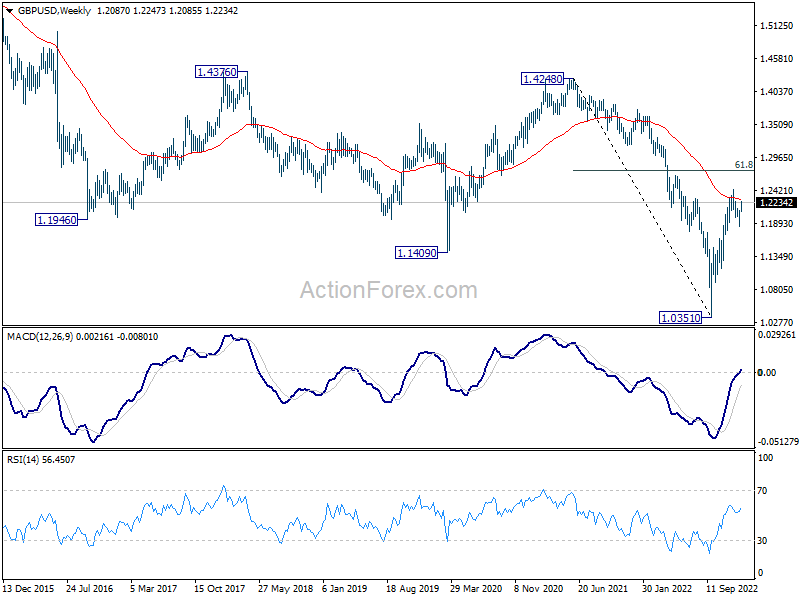
GBP/USD's strong rebound last week suggests that correction from 1.2445 has completed at 1.1840, after hitting 55 day EMA. Initial bias stays on the upside this week for retesting 1.2445 high. Decisive break there will resume whole rally from 1.0351 to 1.2759 fibonacci level. On the downside, break of 1.2086 minor support will turn intraday bias neutral first.
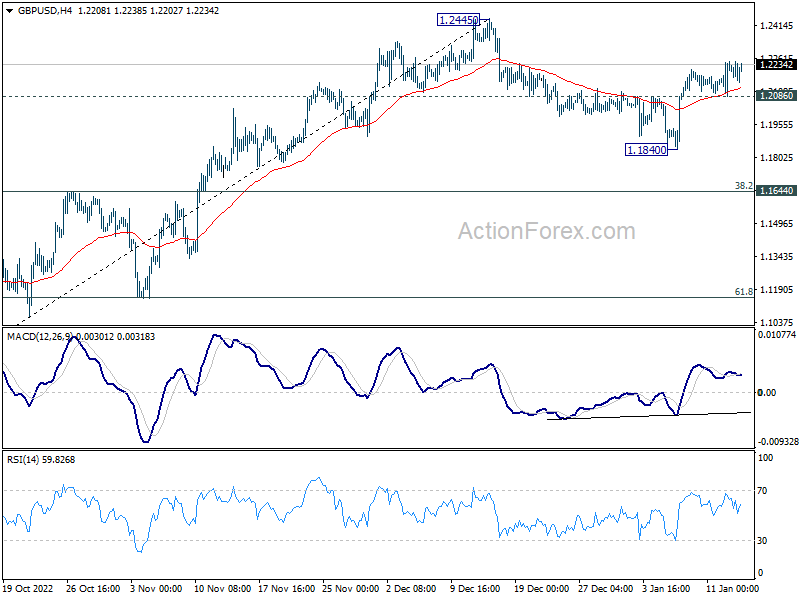
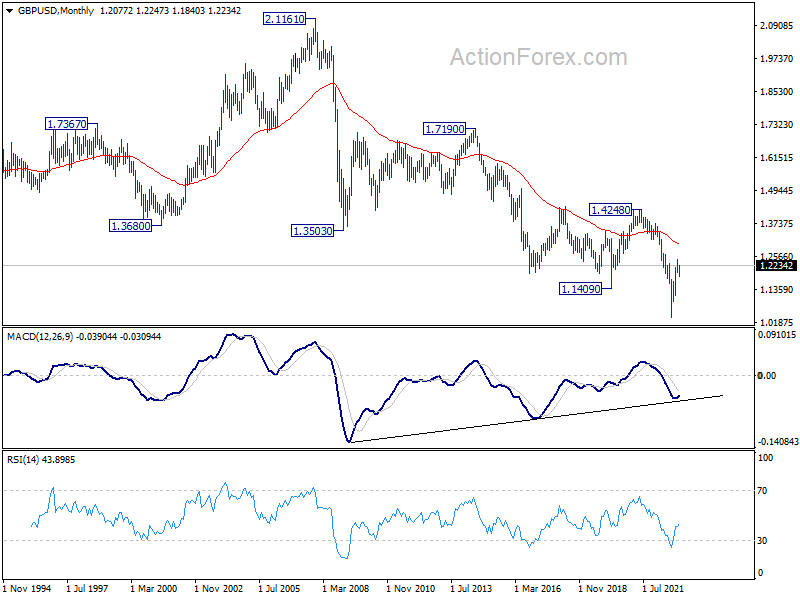
In the bigger picture, rise from 1.0351 medium term bottom is at least correcting whole down trend from 1.4248 (2021 high). Further rise is expected as long as 1.1644 resistance turned support holds. Next target is 61.8% retracement of 1.4248 to 1.0351 at 1.2759. Sustained break there will pave the way back to 1.4248.
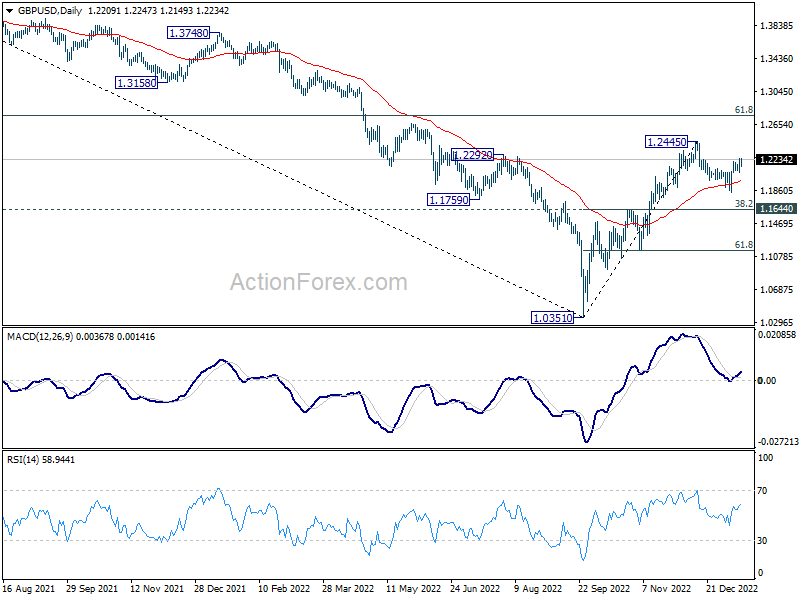
In the longer term picture, as long as 1.4248 resistance holds (2021 high), long term outlook will remain neutral at best. Down trend from 2.1161 (2007) could still resume for another low through 1.0351 at a later stage.