

Sample Category Title
GBP/USD Weekly Outlook
GBP/USD's strong rebound last week suggests that correction from 1.2445 has completed at 1.1840, after hitting 55 day EMA. Initial bias stays on the upside this week for retesting 1.2445 high. Decisive break there will resume whole rally from 1.0351 to 1.2759 fibonacci level. On the downside, break of 1.2086 minor support will turn intraday bias neutral first.
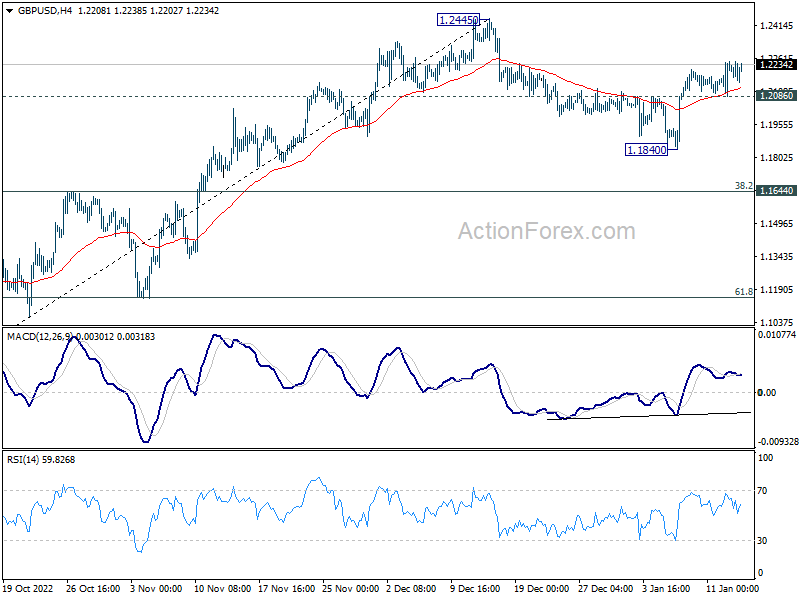
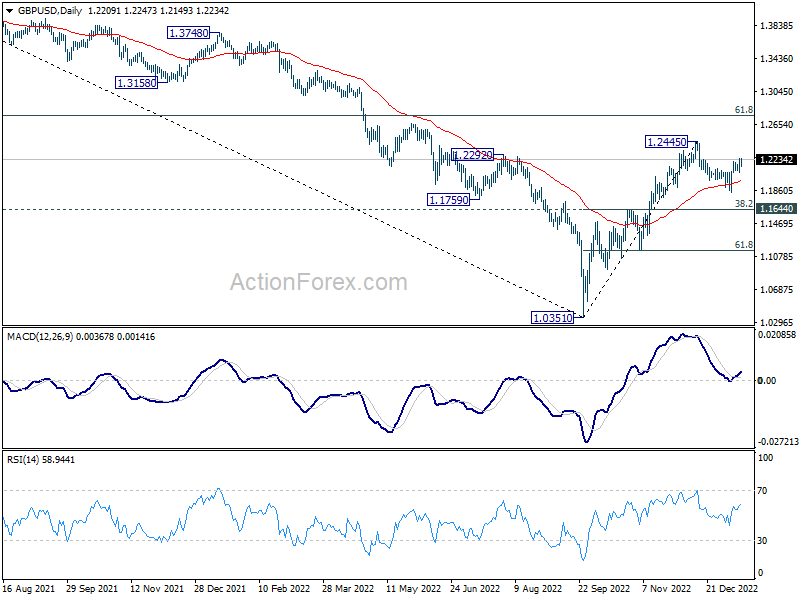
In the bigger picture, rise from 1.0351 medium term bottom is at least correcting whole down trend from 1.4248 (2021 high). Further rise is expected as long as 1.1644 resistance turned support holds. Next target is 61.8% retracement of 1.4248 to 1.0351 at 1.2759. Sustained break there will pave the way back to 1.4248.
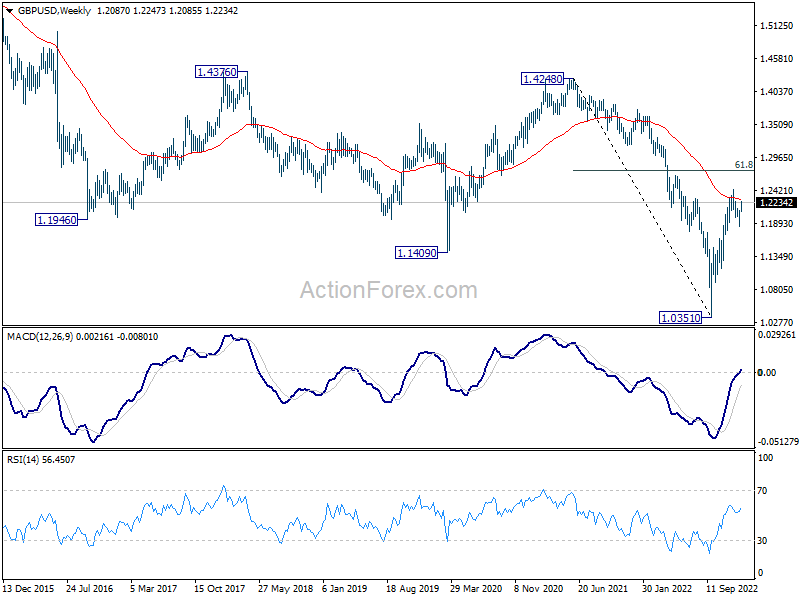
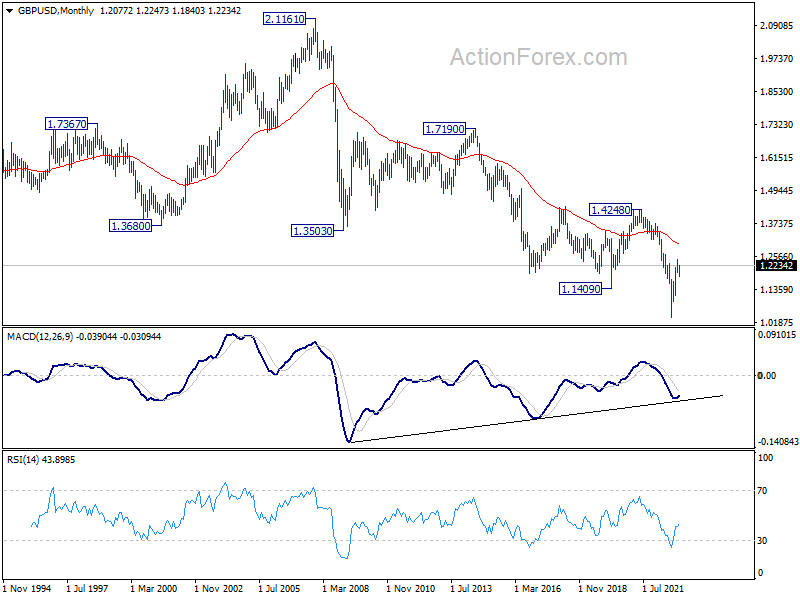
In the longer term picture, as long as 1.4248 resistance holds (2021 high), long term outlook will remain neutral at best. Down trend from 2.1161 (2007) could still resume for another low through 1.0351 at a later stage.
USD/CHF Weekly Outlook
USD/CHF edged lower to 0.9165 last week but quickly recovered. Initial bias stays neutral this week first, but outlook remain bearish with 0.9407 resistance intact. Break of 0.9165 will resume whole fall from 1.0146. However, firm break of 0.9407 will turn bias back to the upside for stronger rebound.
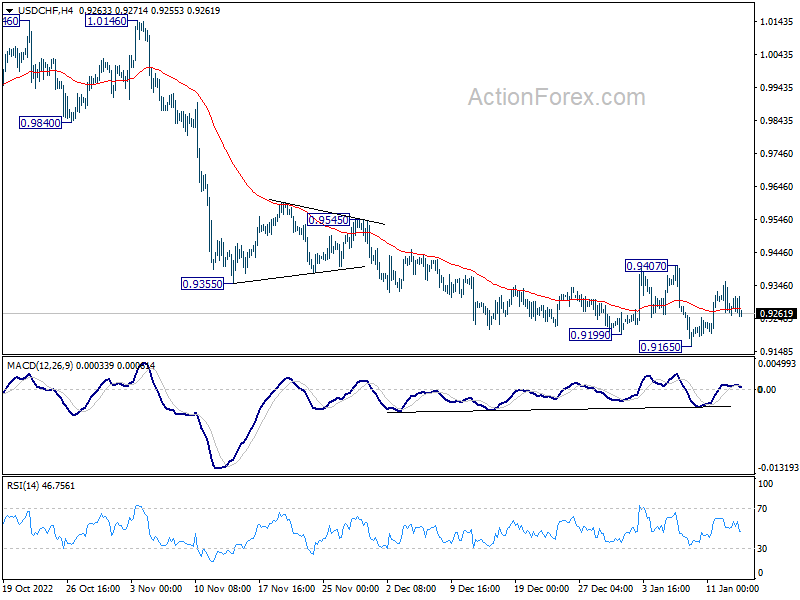
In the bigger picture, rise from 0.8756 (2021 low) has completed at 1.0146, well ahead of 1.0342 long term resistance (2016 high). Based on current downside momentum, fall from 1.0146 should be a medium term down trend itself. Next target is a test on 0.8756 low. Strong support should be seen there to bring rebound. Still, further decline will now be expected as long as 0.9407 resistance holds, in any case.
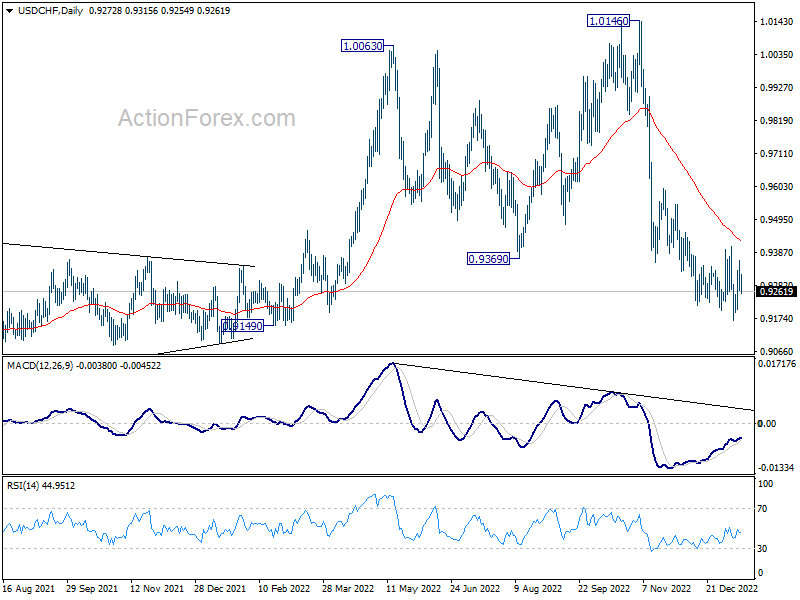
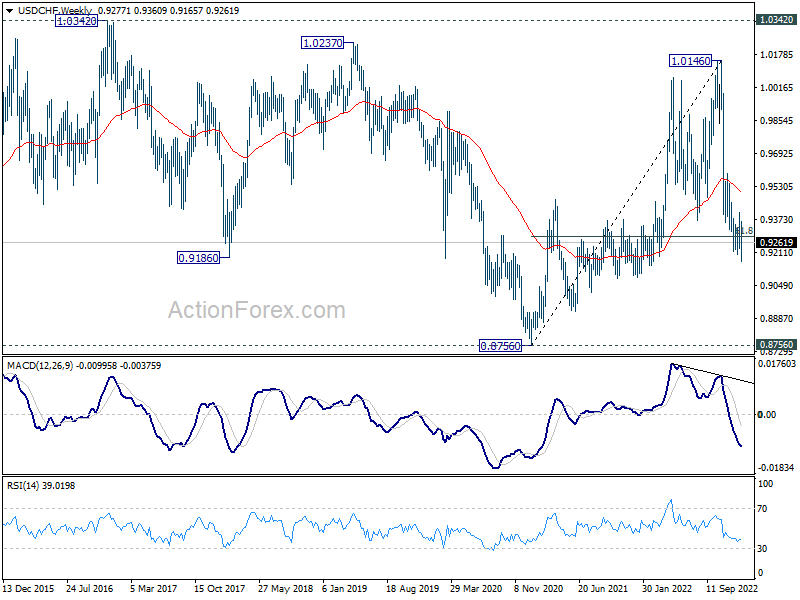
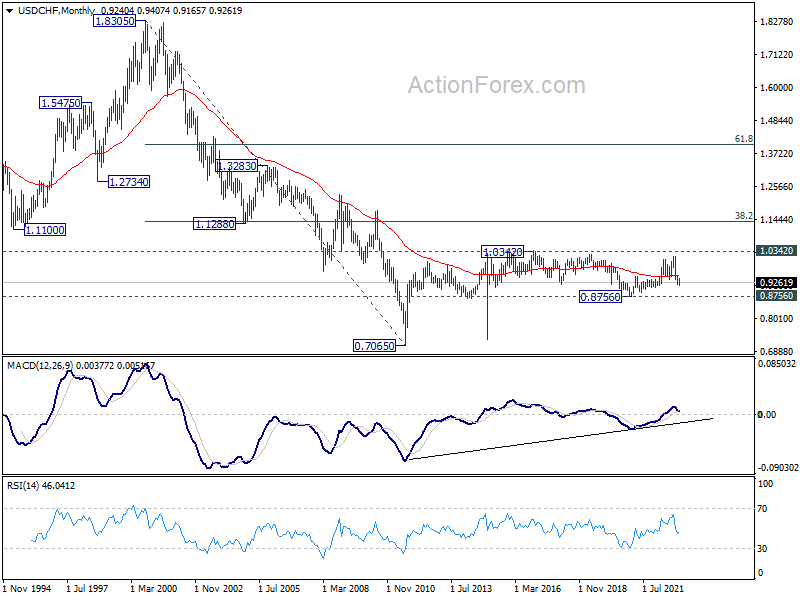
In the long term picture, long term sideway pattern from 1.0342 (2016 high) is extending and it's probably in another medium term down leg. Downside will likely be contained by 0.8756 support in case of deeper fall. Overall, range trading should continue until further development.
AUD/USD Weekly Outlook
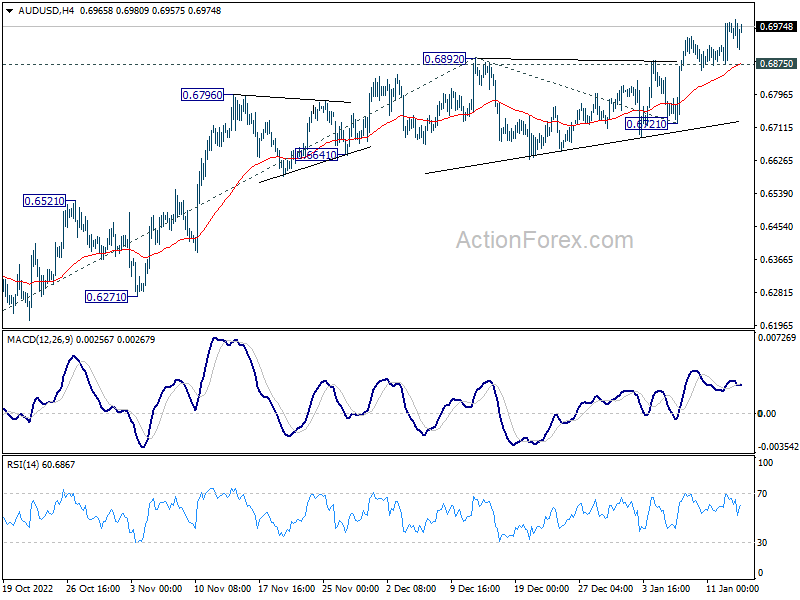
AUD/USD's rise from 0.6169 resumed by breaking through 0.6892 last week. Initial bias stays on the upside this week. Further rally should be seen to 61.8% projection of 0.6169 to 0.6892 from 0.6721 at 0.7444. On the downside, break of 0.6875 minor support will turn intraday bias neutral and bring consolidations again. But overall outlook will stay bullish as long as 0.6721 support holds, in case of retreat.
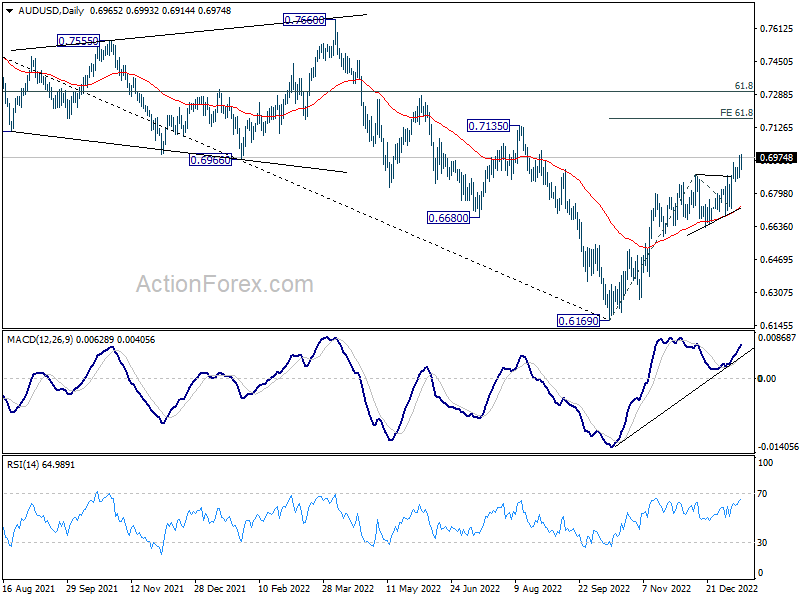
In the bigger picture, corrective decline from 0.8006 (2021 high) should have completed with three waves down to 0.6169 (2022 low). Further rally should be seen to 61.8% retracement of 0.8006 to 0.6169 at 0.7304. Sustained break there will pave the way to retest 0.8006. This will now remain the favored case as long as 0.6721 support holds.
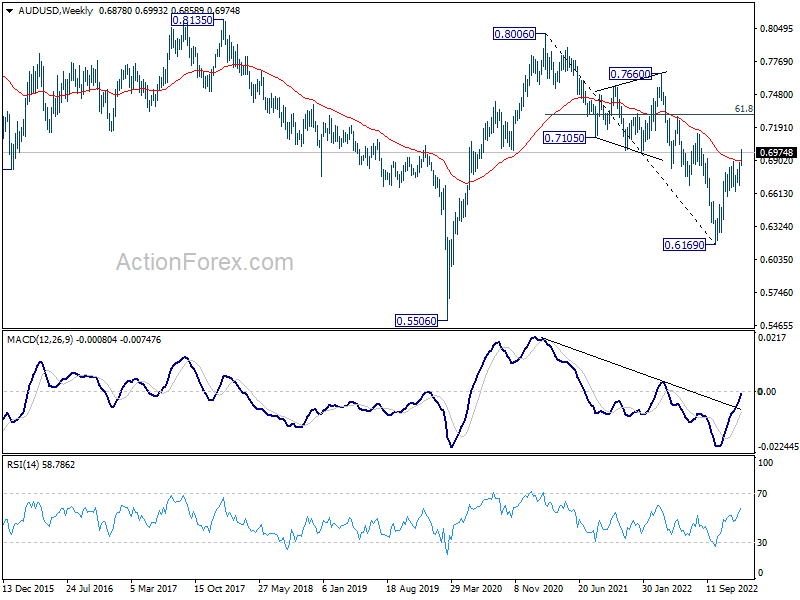
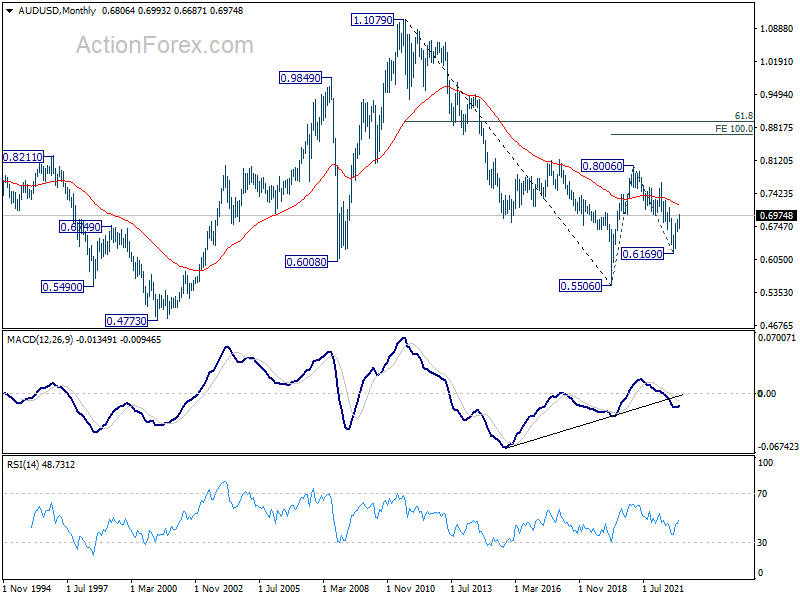
In the long term picture, current development suggests that fall from 0.8006 was merely a correction to the rise from 0.5506 (2020 low). Sustained trading above 55 month EMA (now at 0.7193) will raise the chance of up trend resumption through 0.8006 at a later stage.
USD/CAD Weekly Outlook
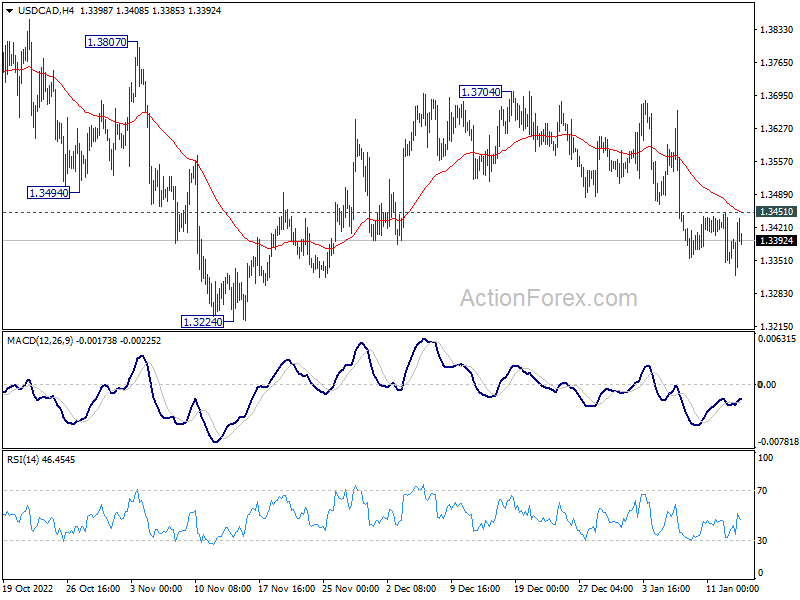
USD/CAD's decline from 1.3704 continued last week but lost some momentum as seen in 4 hour MACD. While further decline cannot be ruled out this week, downside should be contained above 1.3224 key support level. Above 1.3451 minor resistance will turn bias back to the upside for 1.3704 resistance. However, sustained break of 1.3222/4 cluster support will resume the whole fall from 1.3976 and carry larger bearish implications.
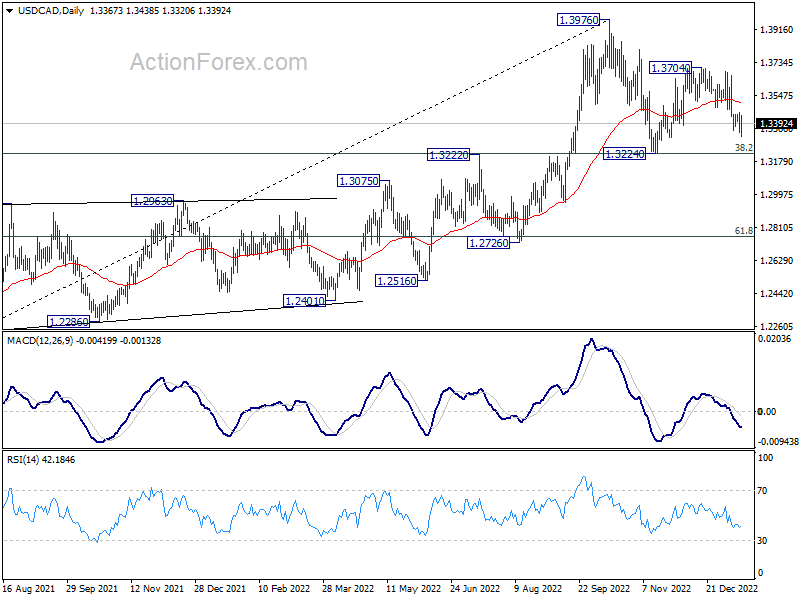
In the bigger picture, as long as 1.3222 cluster support (38.2% retracement of 1.2005 to 1.3976 at 1.3223) holds, larger up trend from 1.2005 (2021 low) is still expected to resume through 1.3976 high at a later stage. However, firm break of 1.3222/3 will indicate that the trend might have reversed. Deeper fall would be seen to next cluster support at 1.2726 (61.8% retracement at 1.2758).
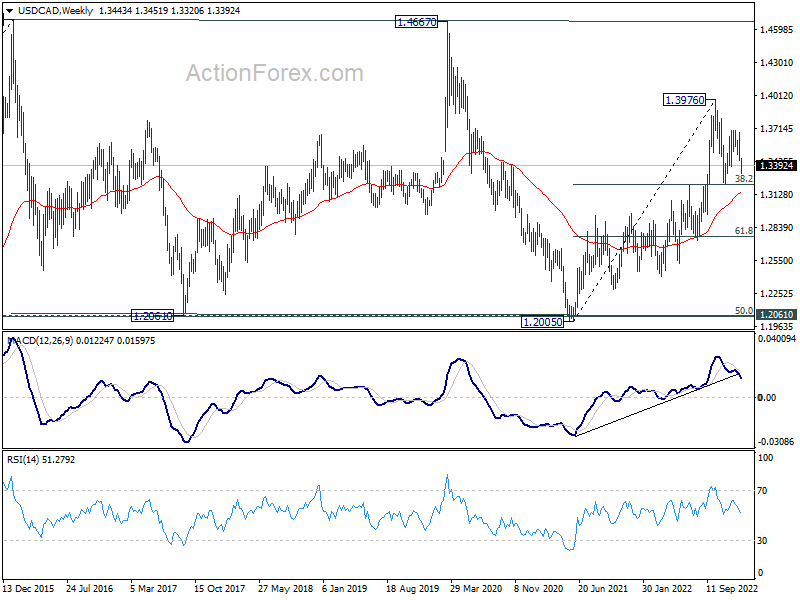
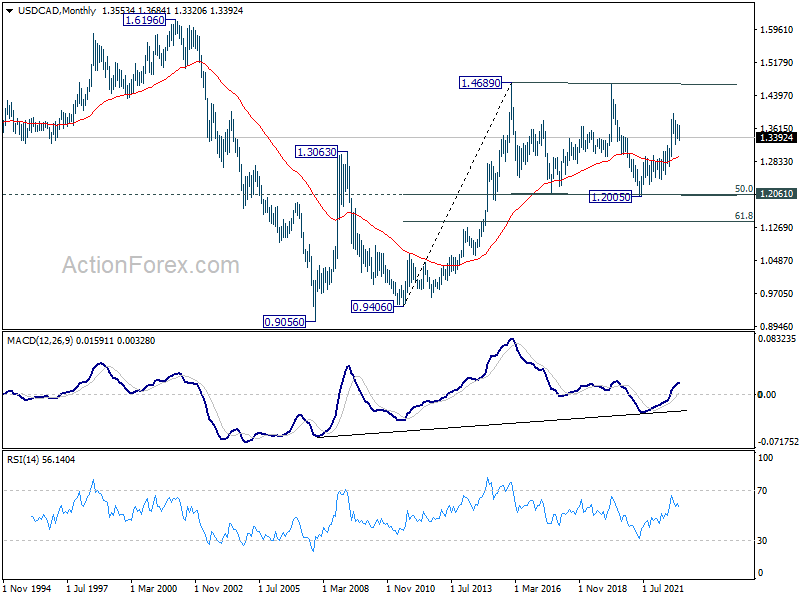
In the longer term picture, price actions from 1.4689 (2016 high) are seen as a consolidation pattern only, which might have completed at 1.2005. That is, up trend from 0.9506 (2007 low) is expected to resume at a later stage. This will remain the favored case as 55 month EMA (now at 1.2953) holds.
GBP/JPY Weekly Outlook
GBP/JPY edged higher to 161.22 last week but failed to break through 162.32 resistance and reversed. Initial bias is now on the downside this week for 155.33 support first. Firm break there will resume whole decline from 172.11 to 153.70 fibonacci level. On the upside, above 158.09 minor resistance will turn intraday bias neutral first. But outlook will remain bearish as long as 161.22 resistance holds.
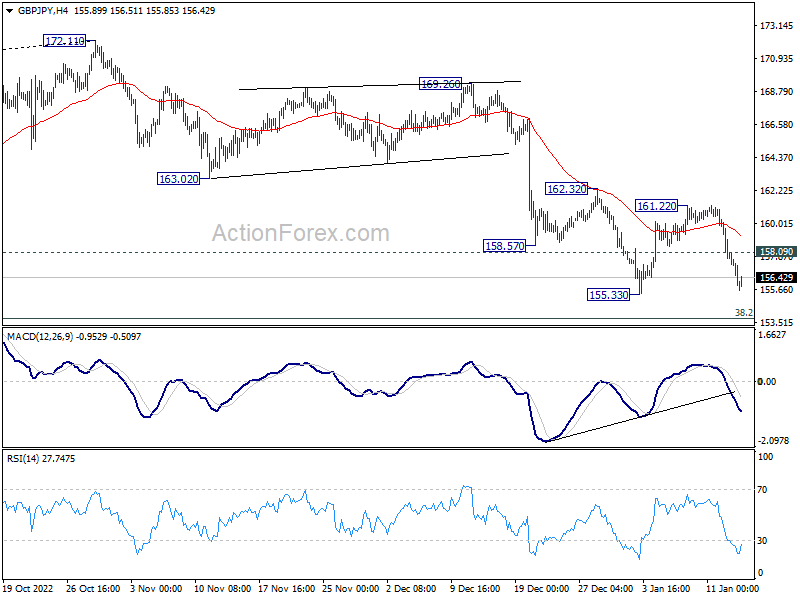
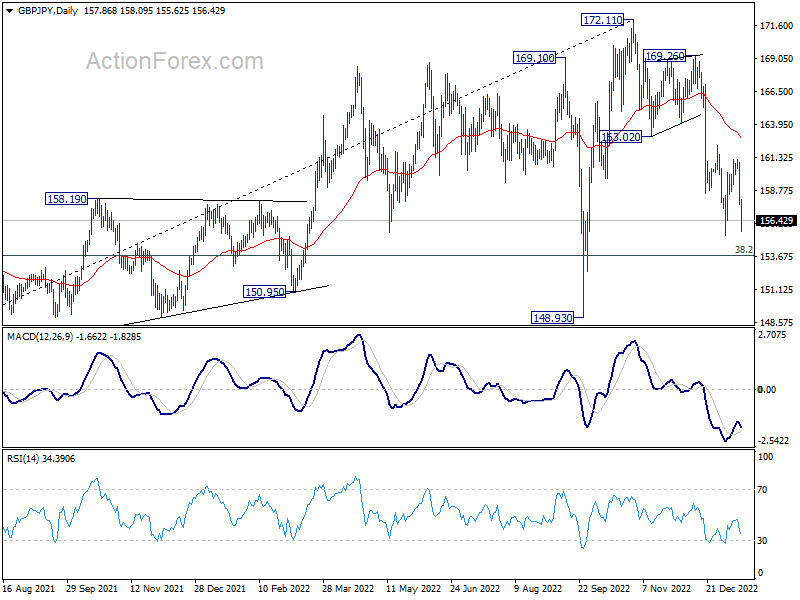
In the bigger picture, as long as 163.02 support turned resistance holds, decline from 172.11 medium term top is expected to continue to 38.2% retracement of 123.94 to 172.11 at 153.70. Sustained break there will raise the change of trend reversal and target 61.8% retracement at 142.34. Nevertheless, break of 163.02 support turned resistance will argue that the decline has completed, and retain medium term bullishness.
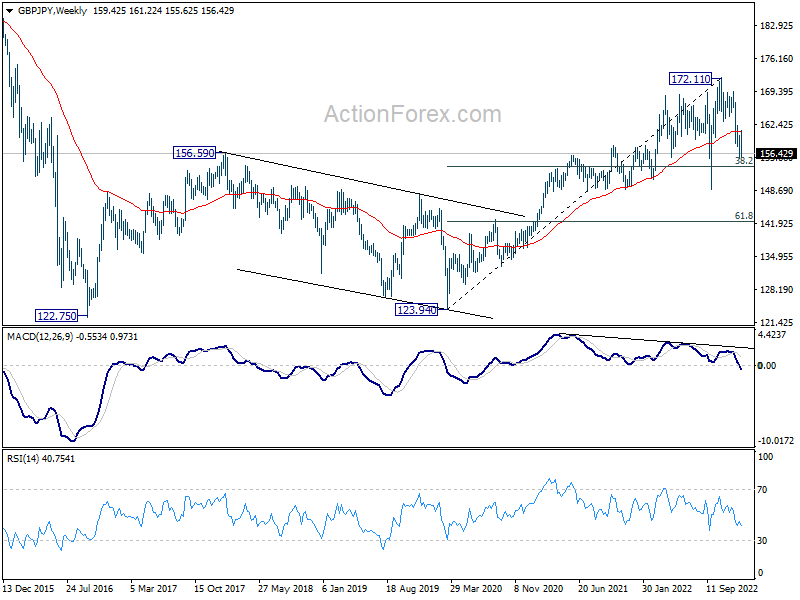
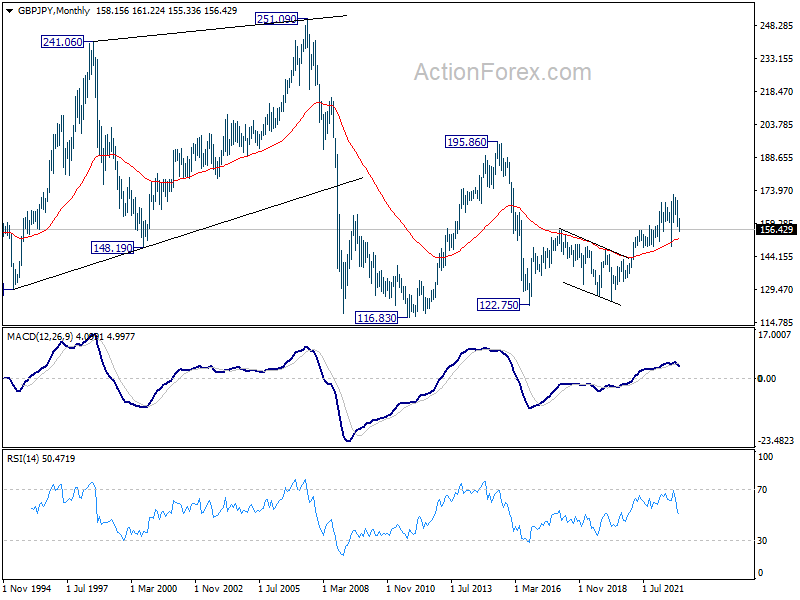
In the longer term picture, as long as 55 month EMA (now at 152.38) holds, rise from 122.75 could still extend higher at a later stage.
EUR/JPY Weekly Outlook
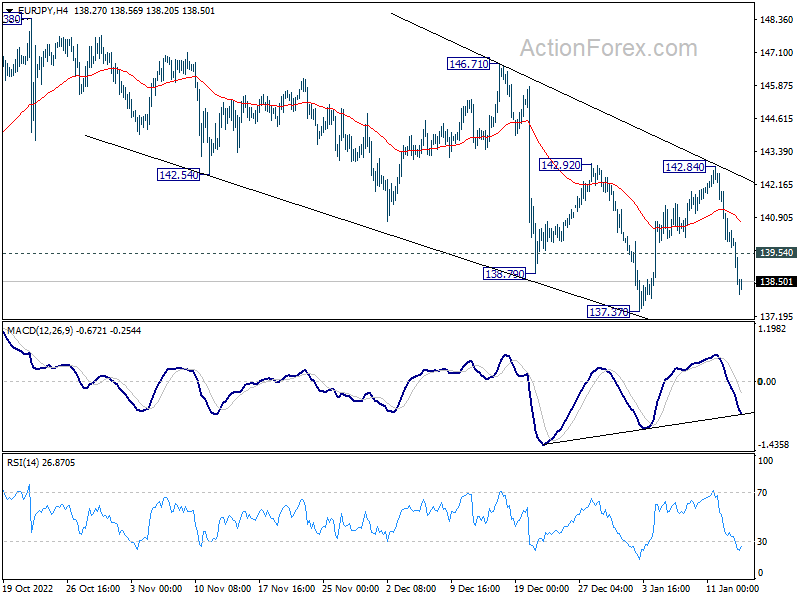
EUR/JPY rose to 142.84 last week but was rejected by 142.92 resistance and 55 day EMA and dropped sharply since then. Initial bias stays on the downside this week for 137.37 support first. Break there will resume whole decline from 148.38 to 135.40 fibonacci level next. On the upside, above 139.54 minor resistance will turn intraday bias neutral first. But outlook will stay bearish as long as 142.84 resistance holds.
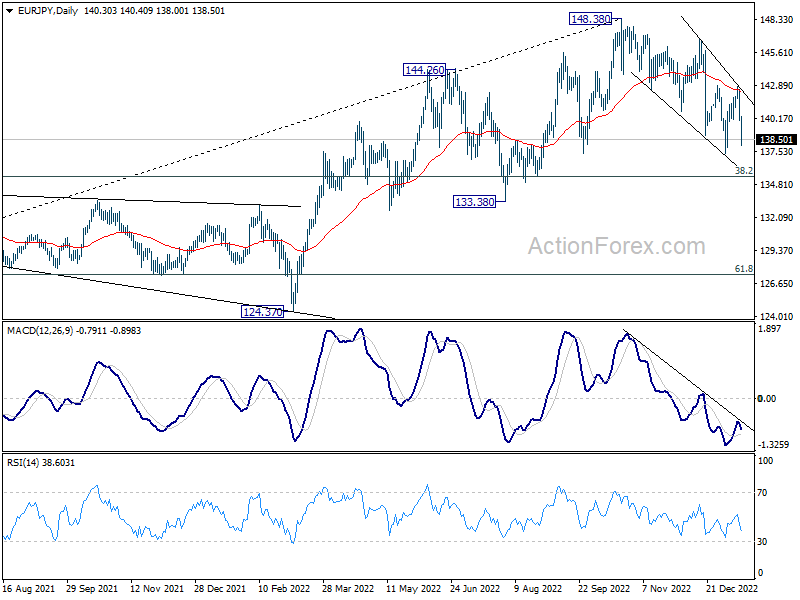
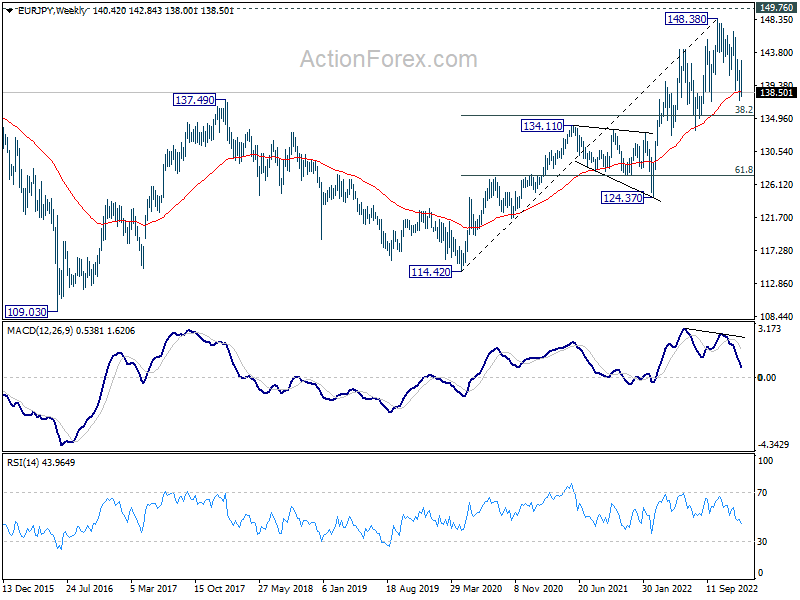
In the bigger picture, as long as 55 week EMA (now at 138.64) holds, larger up trend from 114.42 (2020 low) is still in progress for 149.76 long term resistance. However, firm break of 55 week EMA will bring deeper fall to 38.2% retracement of 114.42 to 148.38 at 135.40. Sustained break there will raise the chance of trend reversal, and target 61.8% retracement at 127.39.
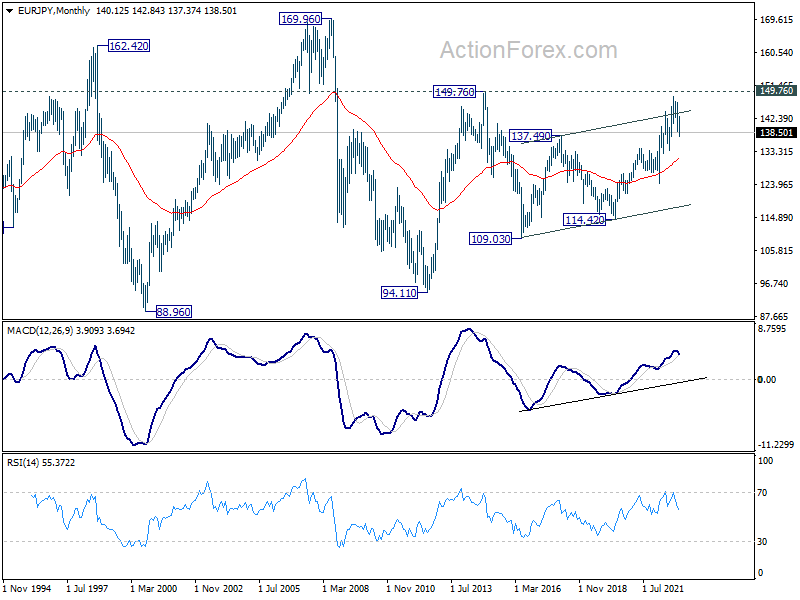
In the long term picture, outlook will stay bullish as long as 134.11 resistance turned support holds (2021 high). Sustained break of 149.76 (2014 high) will open up further rally, as resumption of the rise from 94.11 (2012 low), towards 169.96 (2008 high).
EUR/GBP Weekly Outlook
EUR/GBP's rise from 0.8545 resumed last week but quickly retreated after hitting 0.8896. Initial bias is turned neutral this week first. But further rally is expected as long as 0.8768 support holds. Above 0.8896 will target 61.8% projection of 0.8545 to 0.8876 from 0.8768 at 0.8973.
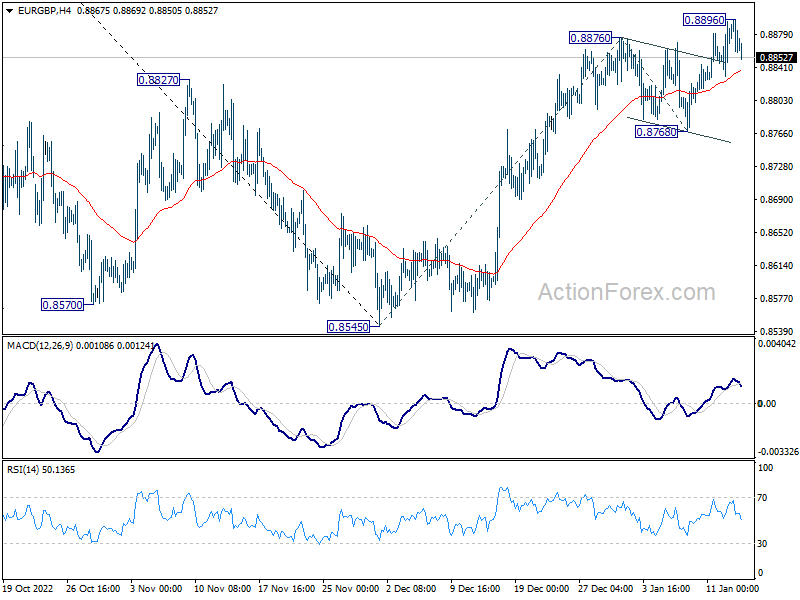
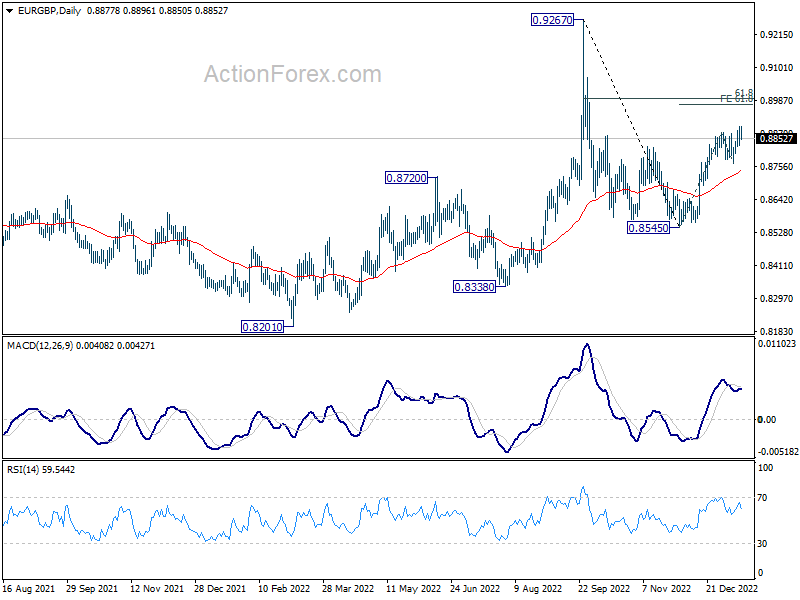
In the bigger picture, with 55 week EMA (now at 0.8616) intact, the favored case is that rise from 0.8545 is part of the whole up trend from 0.8201 (2022 low). Sustained trading above 61.8% retracement of 0.9276 to 0.8545 at 0.8997 will pave the way to retest 0.9267 high next. However, break of 0.8768 support will dampen this view and bring retest of 0.8545 low instead.
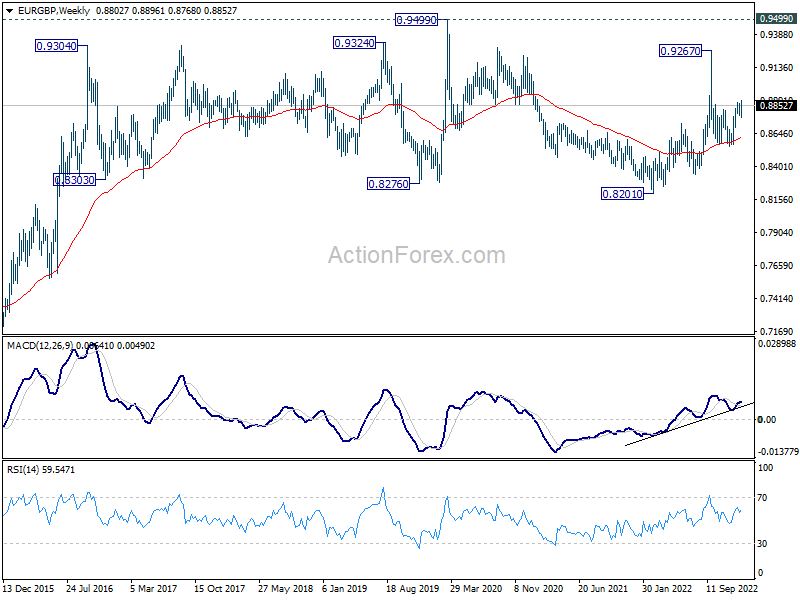
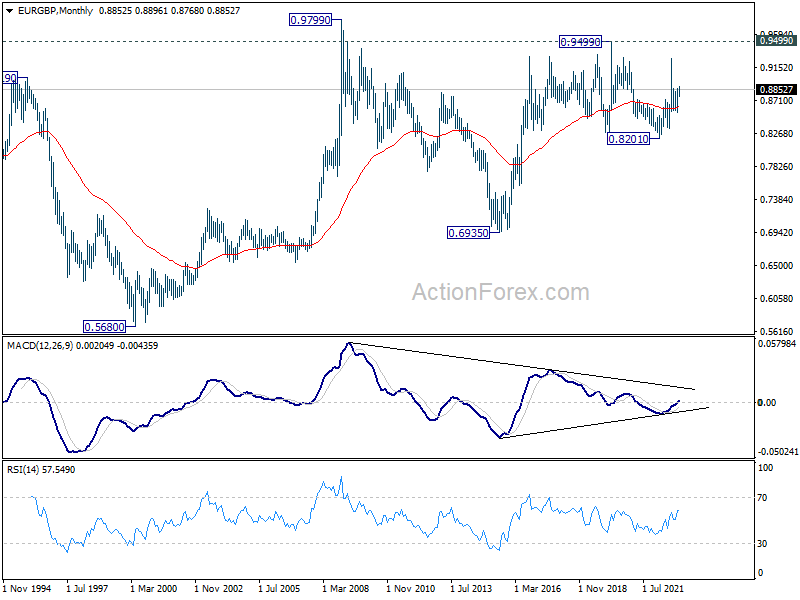
In the long term picture, long term range pattern is extending. But rise from 0.6935 (2015 low) is expected to extend at a later stage, to 0.9799 (2009 high).
EUR/AUD Weekly Outlook
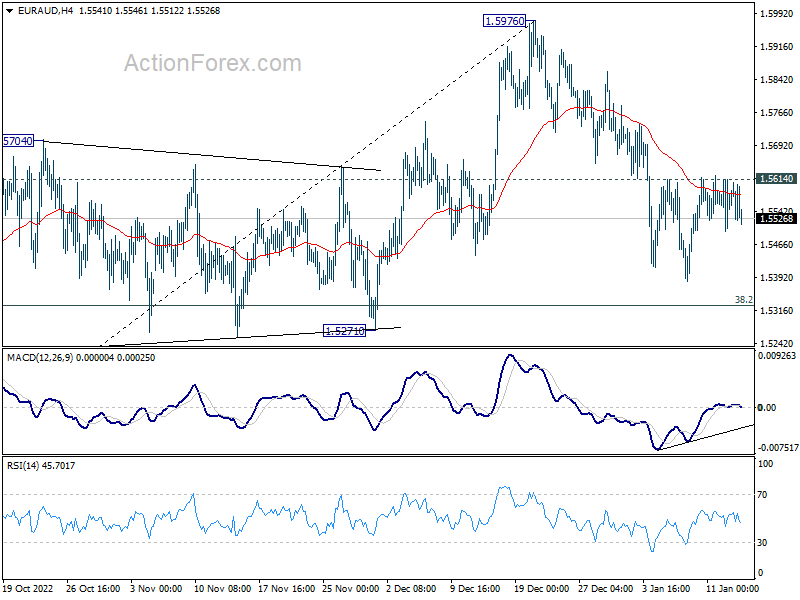
EUR/AUD edged lower last week but quickly recovered. Yet, upside is limited by 1.5614 resistance. Initial bias remains neutral this week first. Another fall cannot be ruled out, but strong support could be seen from 38.2% retracement of 1.4281 to 1.5976 at 1.5329 to complete the correction from 1.5976. Firm break of 1.5614 minor resistance will turn bias back to the upside for retesting 1.5976. However, sustained trading below 1.5329 will carry larger bearish implication and target 61.8% retracement at 1.4928.
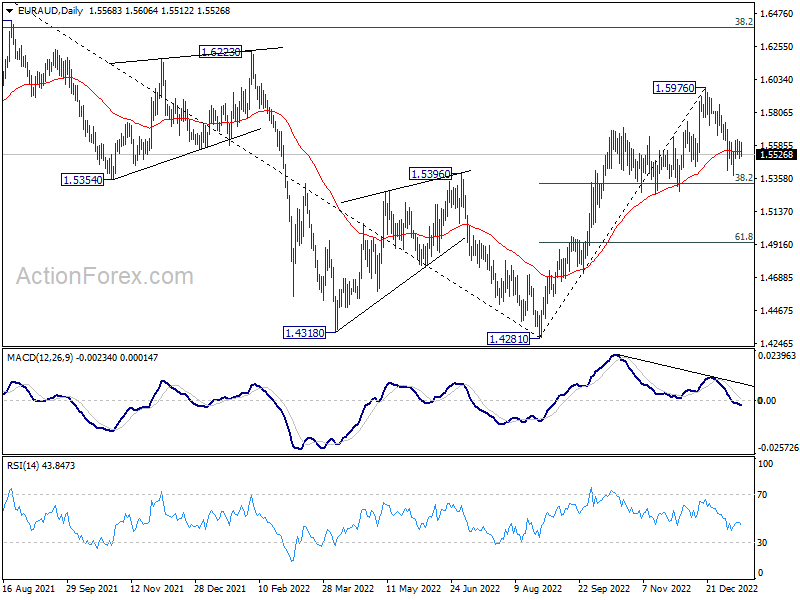
In the bigger picture, it's still early to confirm if rise from 1.4281 represents bullish trend reversal. But as long as 1.5271 support holds, such rally is in favor to continue. Break of 1.5976 will target 1.6434 key resistance next. On the other hand, firm break of 1.5271 will retain medium term bearishness instead.
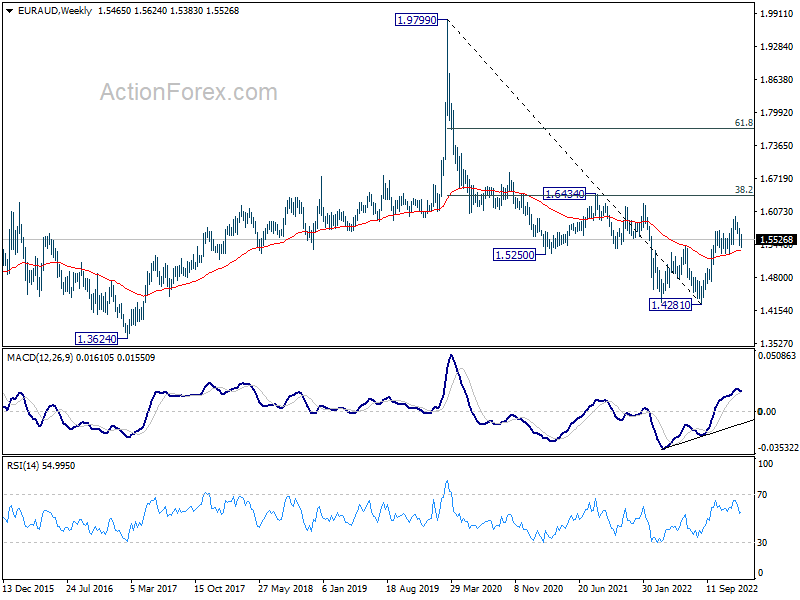
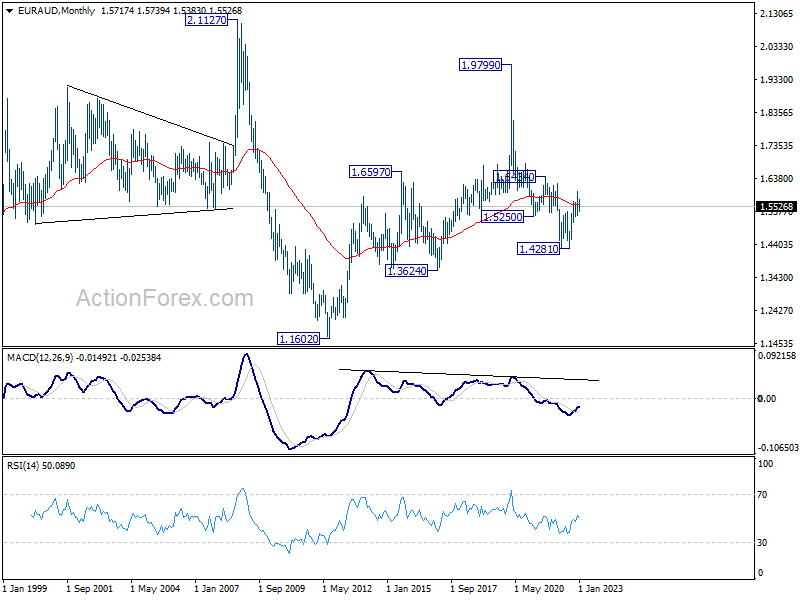
In the longer term picture, focus stays on 55 month EMA (now at 1.5595). Sustained trading above there will raise the chance of bullish trend reversal, and at least bring further rally to 1.6434 cluster resistance, 38.2% retracement of 1.9799 (2020 high) to 1.4281 at 1.6389. However, rejection by 55 month EMA will suggest that down trend from 1.9799 is still in progress for another low below 1.4281.
EUR/CHF Weekly Outlook
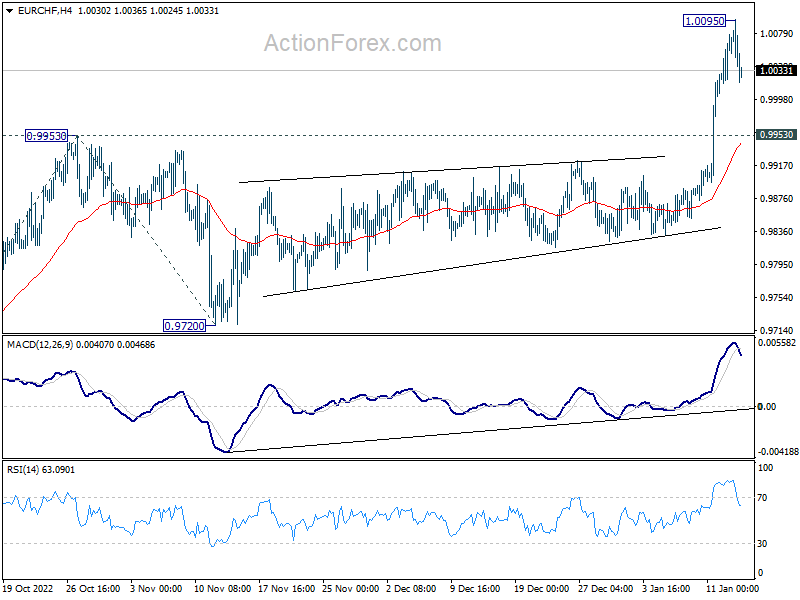
EUR/CHF's rise from 0.9407 finally resumed by breaking through 0.9953 last week, and hit as high as 1.0095. But as a temporary top was formed with subsequent retreat, initial bias is turned neutral this week first. Downside should be contained by 0.9953 resistance turned support to bring another rally. Break of 1.0095 will resume the rise to 100% projection of 0.9407 to 0.9953 from 0.9720 at 1.0266 next.
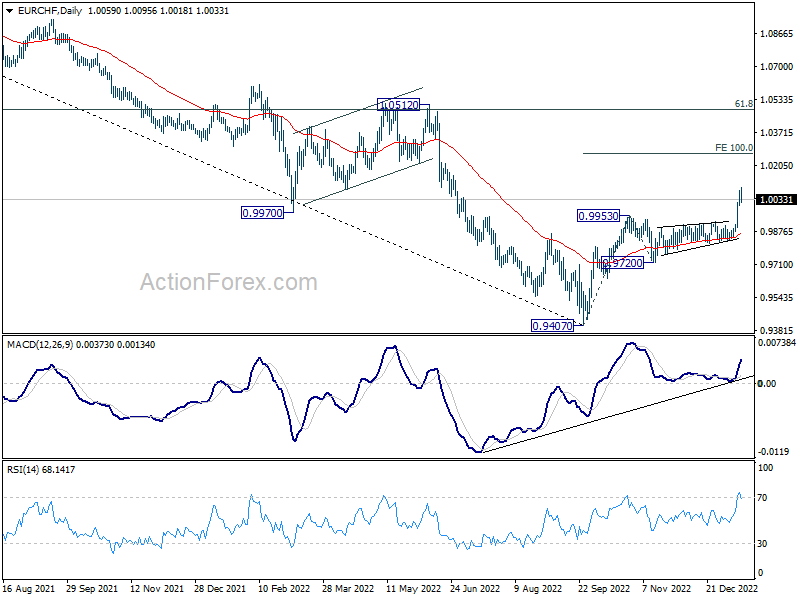
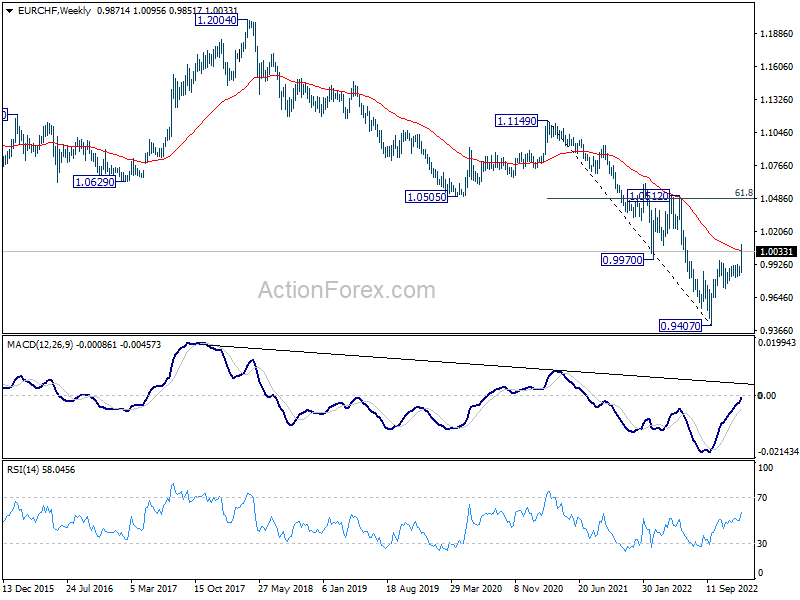
In the bigger picture, break of 38.2% retracement of 1.1149 to 0.9407 at 1.0072 and 55 week EMA (now at 1.0041) is taken as an initial sign of long term bullish reversal. Further rally is expected as long as 55 days EMA (now at 0.9866) holds. Next target is 1.0505 cluster resistance (2020 low at 1.0505, 61.8% retracement of 1.1149 to 0.9407 at 1.1484). Reactions from there should reveal long term momentum.
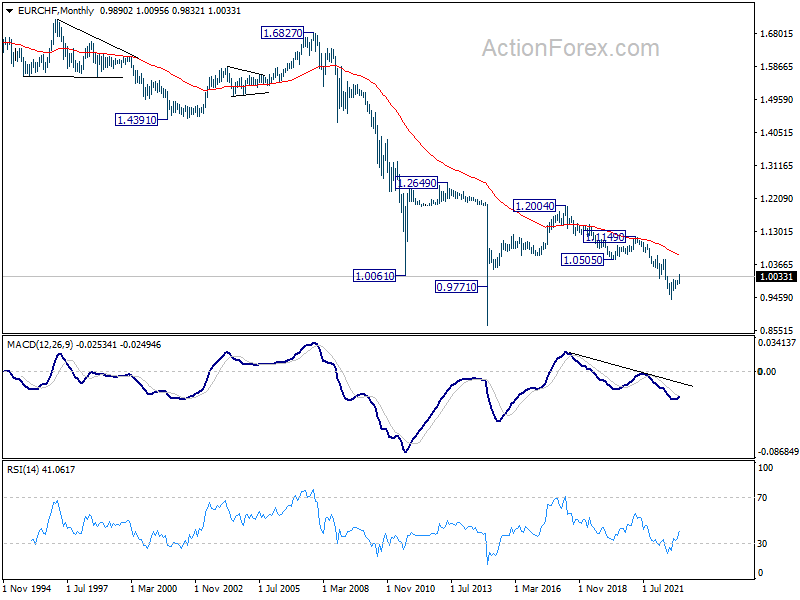
In the long term picture, it's still way to early too call for bullish trend reversal with upside capped well below 55 month EMA and 1.0505 support turned resistance (2020 low).
USD/JPY Dived on Fed and BoJ Expectations, More Downside But 120 Will Be a Bit Stretched
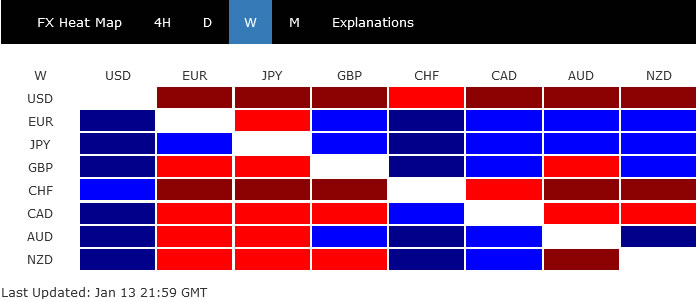
Dollar was sold off broadly last week as a 25bps rate hike by Fed in February is now pretty much a done deal, after CPI data. On the other hand, Yen staged a strong rally on speculations that BoJ is now much closer to exit of ultra-loose monetary policy. USD/JPY ended as the biggest mover and more downside is likely ahead. But as argued below, from a medium term long term point of view, a bottom would be formed ahead awhile 120 handle is looking a bit stretched.
In between Dollar and Yen, Swiss Franc was the second worst performer, with upside breakout in EUR/CHF. Canadian Dollar was the third worst. On the other hand, Euro and Sterling were the next strongest one, with help from buying against the Swiss Franc, while Aussie was also strong.
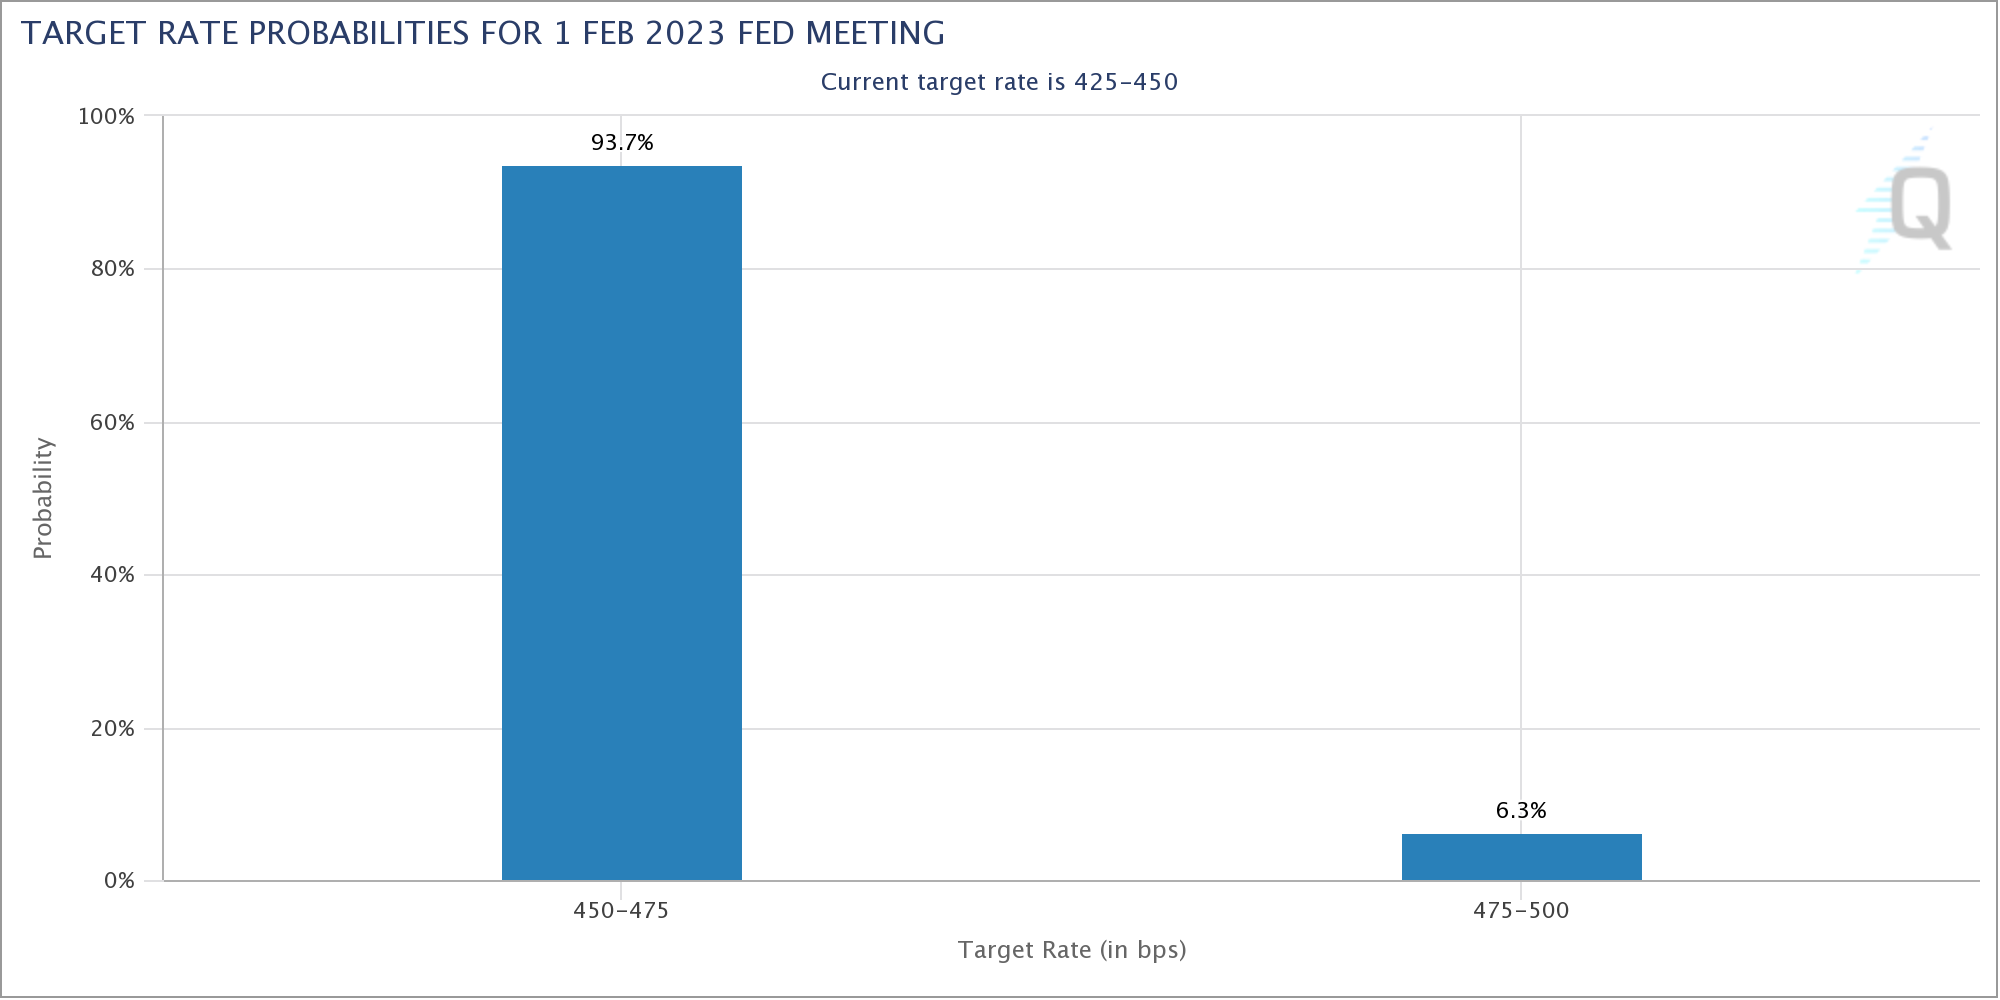
25 looks like a done deal for Fed, S&P looking bullish
Traders are now pretty confident that Fed is going to slow down the pace of tightening at the upcoming meeting on February 1. A number of Fed officials already indicated the openness to a 25bps hike. CPI report released last week, showing further cooling in consumer inflation, solidified such expectations. Fed fund futures are now pricing in 93.7% chance of a 25bps hike to 4.50-4.75%. But of course, what matters more now is the terminal rate and the time to stay there, which will be data-dependent.
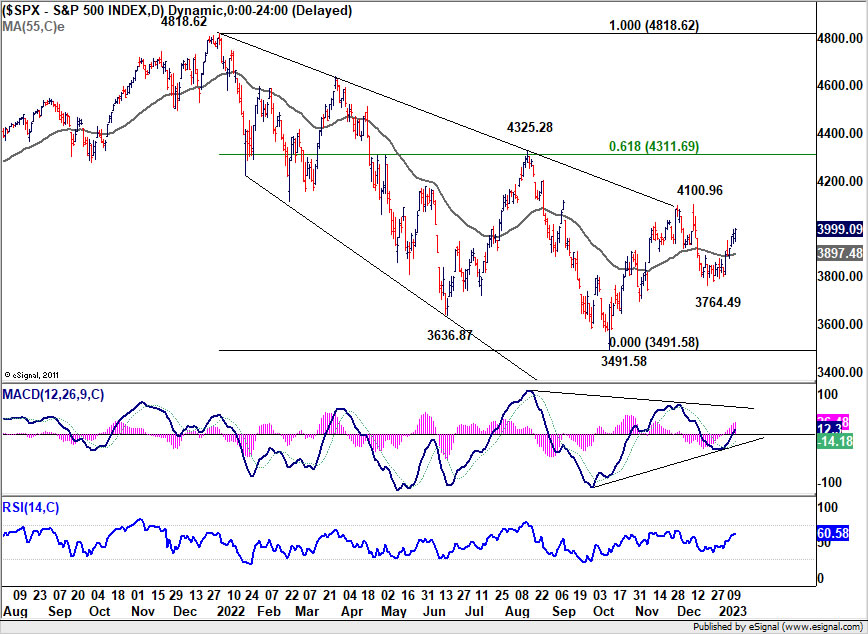
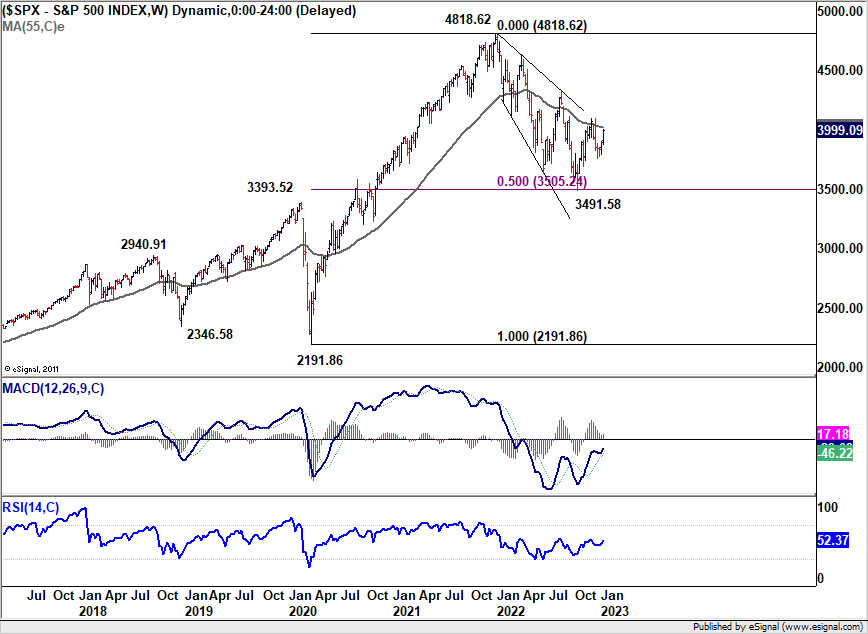
S&P 500 extended the rebound from 3764.49 and closed just shy of 4000 handle. The stay above 55 day EMA (now at 3897.48) is a near term bullish sign, which suggest that rise from 3491.58 is not over. Focus is back on 4100.96 resistance and break there will confirm this bullish case. More importantly, if that happens, 55 week EMA (now at 4022.44) would be taken out firmly too, which argues that whole correction from 4818.62 has completed. In this case, further rise would be seen back to 4325.28 (61.8% retracement of 4818.62 to 3491.58 at 4311.69) for confirmation.
FTSE marching to record high, DAX following
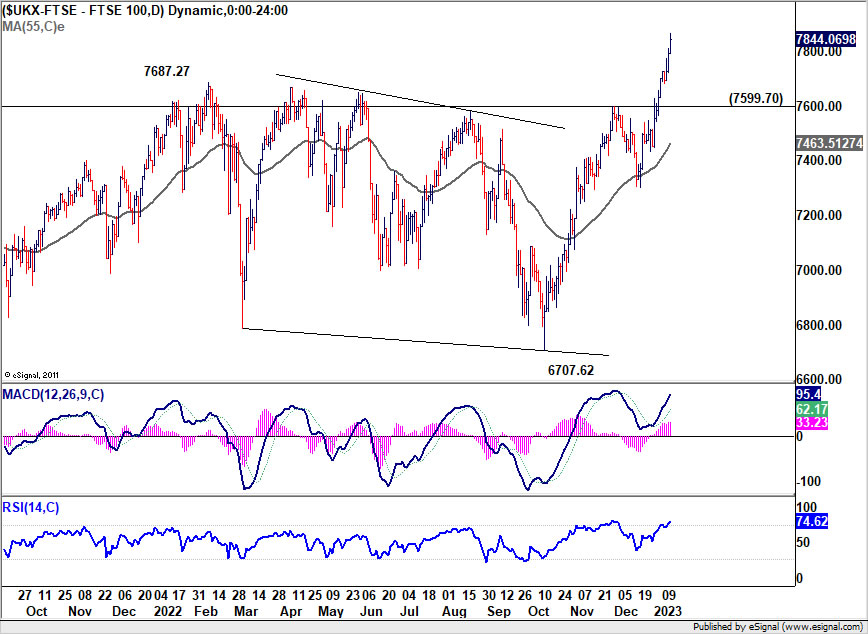
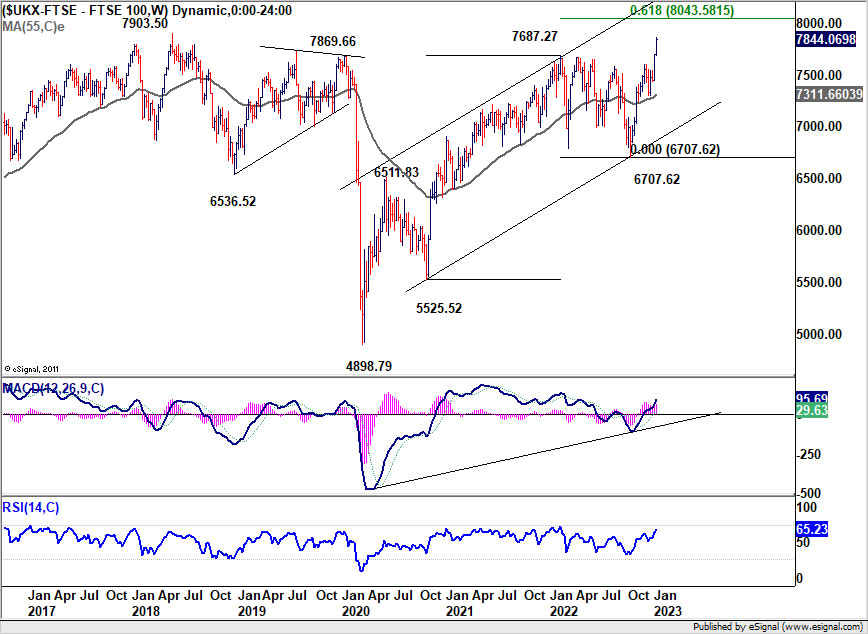
Risk-on sentiment was also firm in Europe. FTSE extended the bullish run and closed at another 3-yr high at 7844.06. Near term outlook will remain bullish as long as 7599.70 resistance turned support holds. Next target is 7903.50 record high, and possibly further to 61.8% projection of 5525.52 to 7687.27 from 6707.62 at 8043.58.
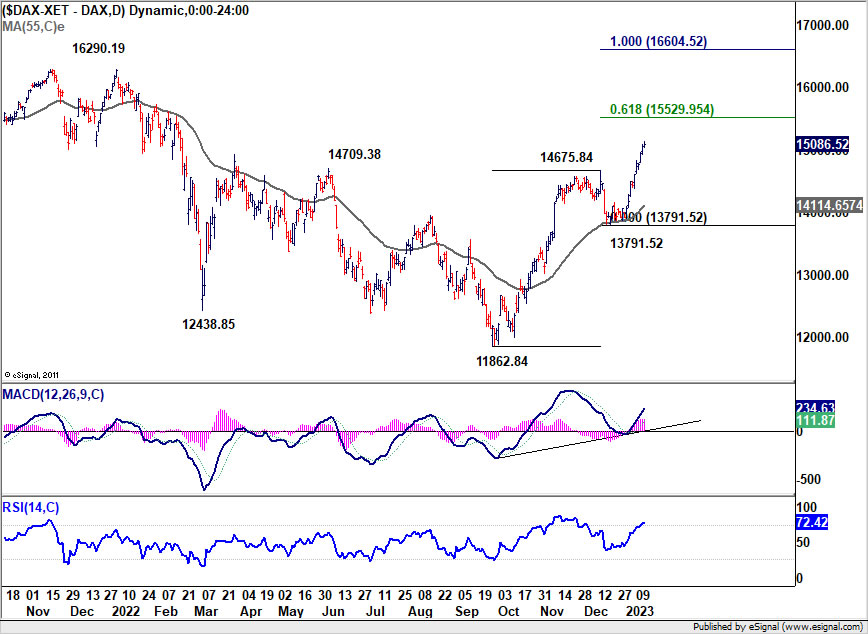
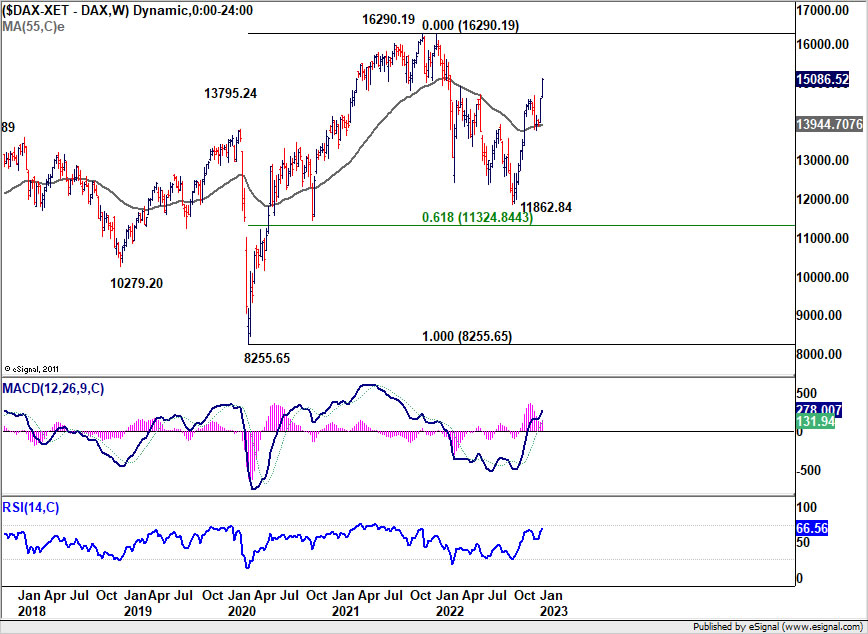
DAX finally resumed the rise from 11862.84. The strong support from both 55 day and 55 week EMAs affirm the case that correction from 16290.19 has already completed. Near term outlook will remain bullish as long as 14675.84 resistance turned support holds. Next target is 61.8% projection of 11862.84 to 14675.84 from 13791.52 at 15529.95. Sustained break there could prompt upside acceleration through 16290.19 record high, to 100% projection at 16604.52.
Dollar index extended decline, no sign of bottoming yet
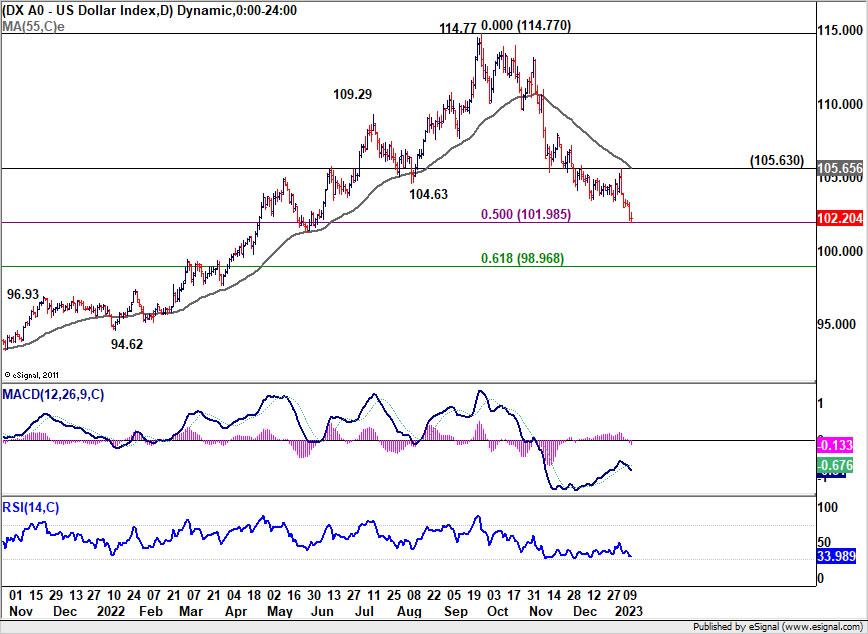
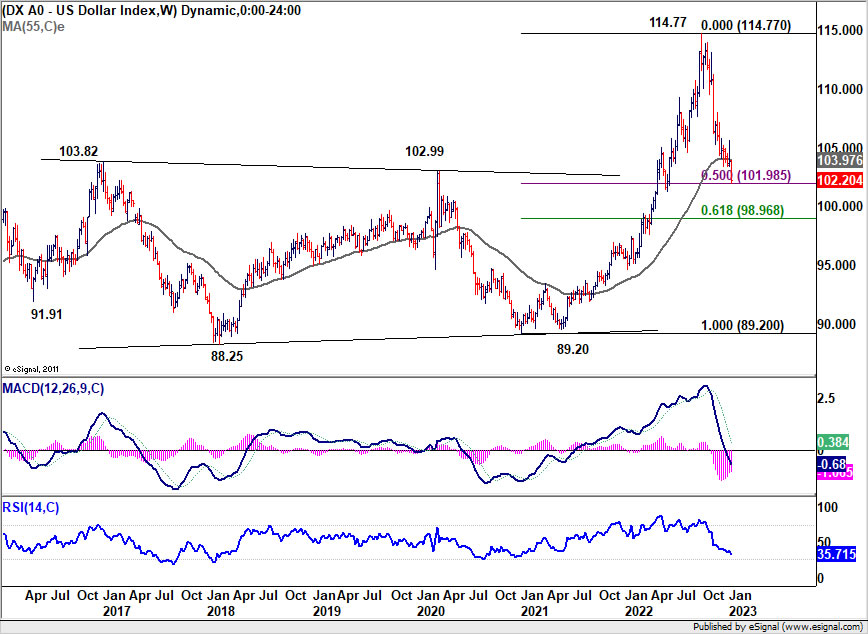
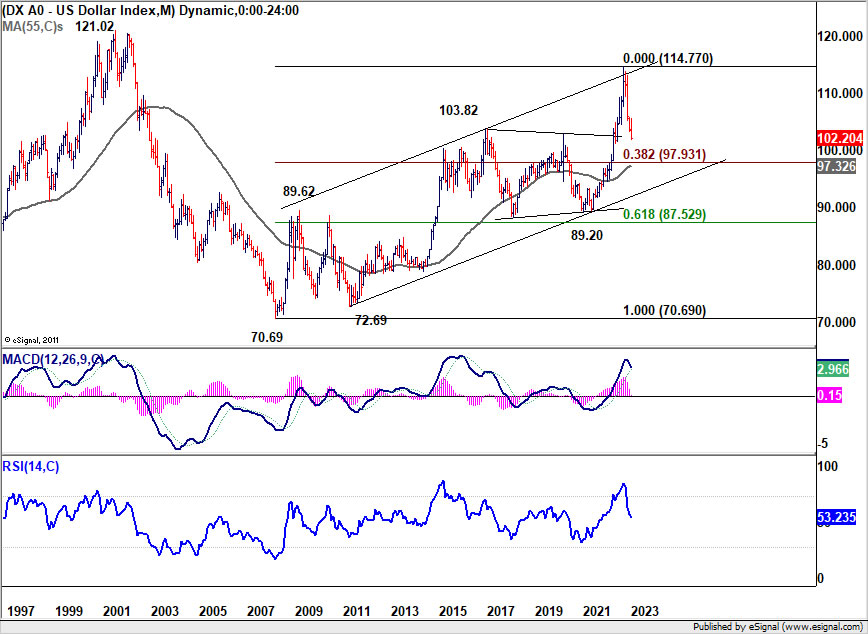
Dollar index resumed the decline from 144.77 last week and closed at 102.20. The strong break of 55 week EMA is clearly a bearish signal, and there is no clear sign of bottoming yet. Yet, it's now close to 50% retracement of 89.20 to 114.77 at 101.98. A rebound could happen any time. But of course, break of 105.65 resistance is needed to indicate short term bottoming first, or outlook will stay bearish. Sustained trading below 101.98 would open deeper fall to 61.8% retracement at 98.96 or even further to 55 month EMA (now at 97.32), before DXY could find enough support.
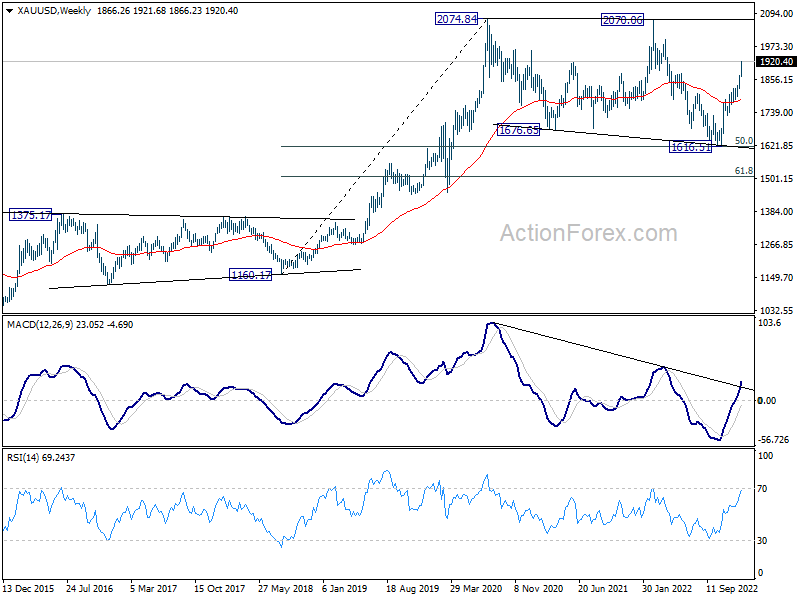
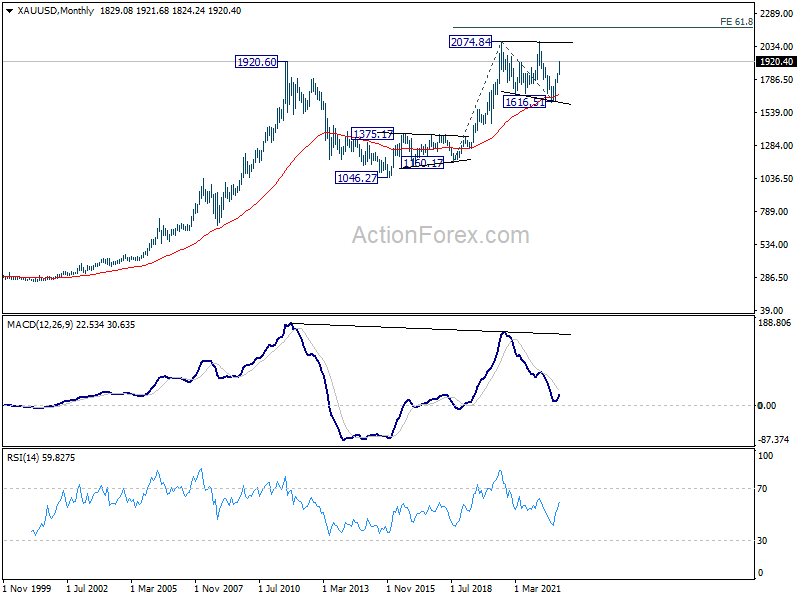
Gold cleared 1900, 2000 next
Gold continued to ride on Dollar's weakness and surged through 1900 handle. Near term outlook will now stay bullish as long as 1866.94 support holds. With 100% projection of 1616.51 to 1786.63 from 1728.48 at 1898.80 taken out. Next target is 161.8% projection at 2004.05.
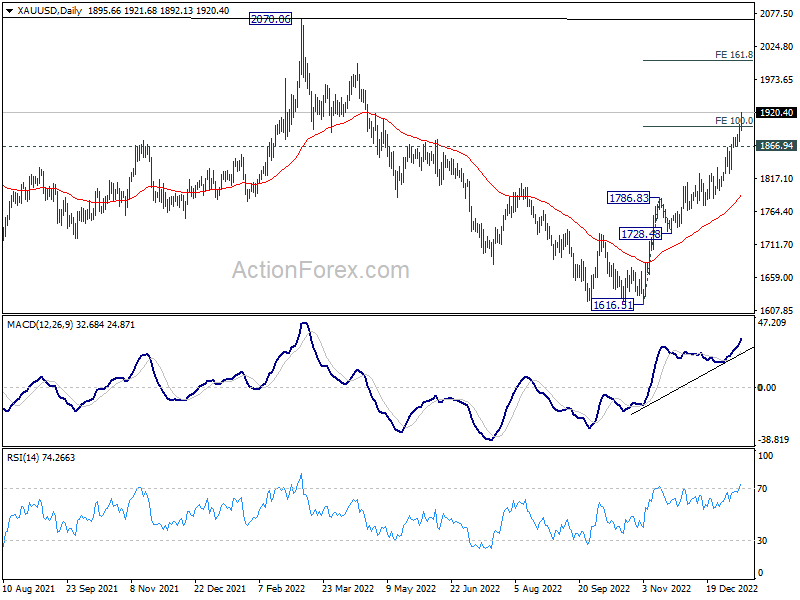
Additionally, it should be noted that long term consolidation pattern from 2074.84 (2020 high) could have completed with three waves down to 1616.51, after drawing support from 55 month EMA. It's still a bit too early. But we're penciling in the chance of long term up trend resumption to new record high, and target 61.8% projection of 1160.17 to 2074.84 from 1616.51 at 2181.77 later in the year.
USD/JPY dived on BOJ speculations, but decline should slow below 125.58
Yen was shot higher by speculations that BoJ is getting closer to abandoning yield curve control, eventually readying itself for rate hike later in the year. The expectations intensified after Yomiuri newspaper reported that policymakers would review the side effects of the YCC at the upcoming meeting on January 18 (coming Wednesday).
At the same time, bond trades continued to push 10-year JGB yield through BoJ's cap of 0.50%. That's not exactly a new thing, as it happened before when the cap was at 0.10% and 0.25%. But this time, BoJ spent a record JPY 4.6T on bond purchases to defend the cap on Thursday. Additionally, unscheduled purchases were carried out on Friday, spending JPY 1.4T on 1 to 25 year bonds in the first round, and then offered to by JPY 400B of 3 to 25 year bonds in the second round.
Opinions are divided on what BoJ would exactly do at the January meeting. Most economists still predict no policy change. Some expects a further increase in the yield cap to 0.75%, setting the stage for scrapping YCC at Governor Haruhiko Kuroda's last meeting, and rate hike when new governor comes in. But in any case, the path is there, just the timing is uncertain.
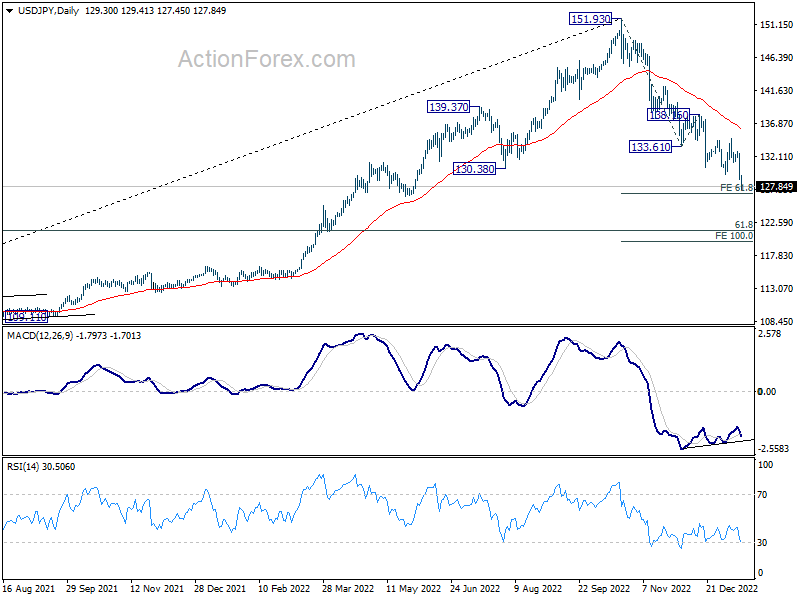
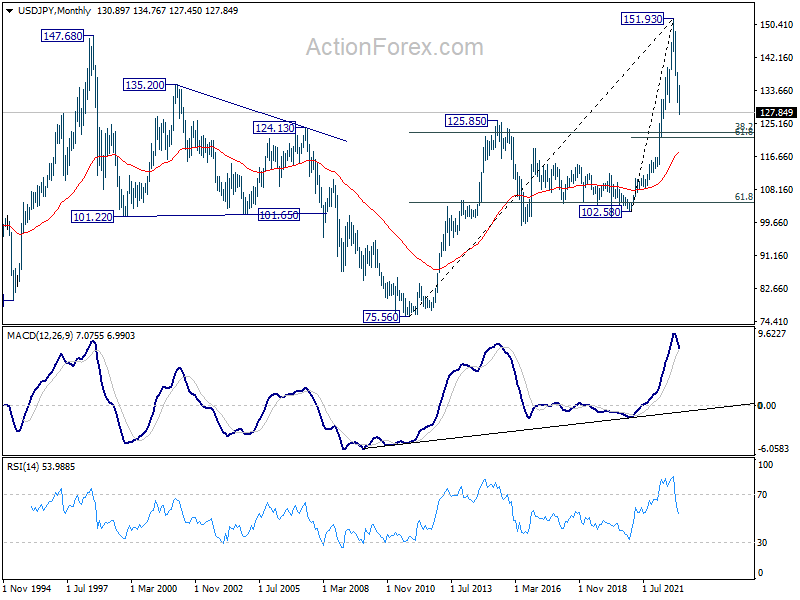
USD/JPY was the biggest mover last week, losing -3.32%. From a near term point of view, further decline is expected through 61.8% projection of 151.93 to 133.61 from 138.16 at 126.83 pretty soon. However, from a long term point of view, a cluster support zone lies just ahead, with 125.58 (2015 high), 61.8% retracement of 102.58 to 151.93 at 121.43, and 38.2% retracement of 75.56 to 151.93 at 122.75.
The decline should start to slow down again breaking 125.58. A bottom would possibly form at 121.43/122.75. 120 psychological level looks a bit stretched based on this week, not to mention 100% projection of 151.93 to 133.61 from 138.16 at 119.84
EUR/CHF Weekly Outlook
EUR/CHF's rise from 0.9407 finally resumed by breaking through 0.9953 last week, and hit as high as 1.0095. But as a temporary top was formed with subsequent retreat, initial bias is turned neutral this week first. Downside should be contained by 0.9953 resistance turned support to bring another rally. Break of 1.0095 will resume the rise to 100% projection of 0.9407 to 0.9953 from 0.9720 at 1.0266 next.
In the bigger picture, break of 38.2% retracement of 1.1149 to 0.9407 at 1.0072 and 55 week EMA (now at 1.0041) is taken as an initial sign of long term bullish reversal. Further rally is expected as long as 55 days EMA (now at 0.9866) holds. Next target is 1.0505 cluster resistance (2020 low at 1.0505, 61.8% retracement of 1.1149 to 0.9407 at 1.1484). Reactions from there should reveal long term momentum.
In the long term picture, it's still way to early too call for bullish trend reversal with upside capped well below 55 month EMA and 1.0505 support turned resistance (2020 low).