Sample Category Title
Weak Chinese Trade Data – Low Base for Subsequent Growth
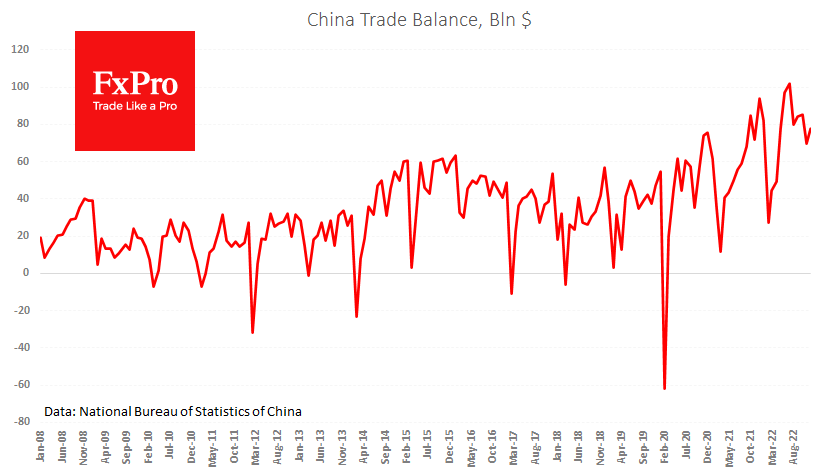
China’s foreign trade data for December was another demonstration of why the government went for a loosening of covid restrictions. Exports last month were 9.9% below levels a year earlier, accelerating the decline from November’s -8.7%. Imports lost 7.5% to the same month a year earlier. The foreign trade surplus was $78.0bn, compared to $70bn a month earlier and $93.7bn 12 months ago.
The data marginally exceeded expectations but overall shows stagnant foreign trade activity during 2022, reminiscent of 2014 and 2015, which were tough years for China.
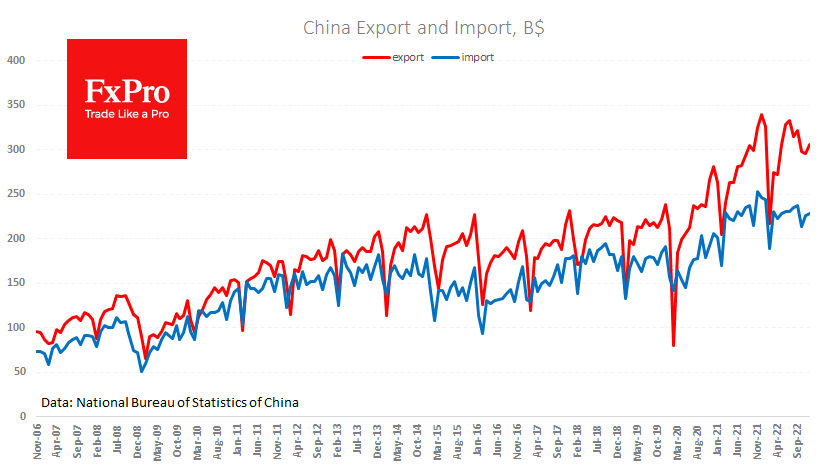
That said, the weak data from the last months of last year and the first months of 2023 promises to form a favourable basis for comparison, as the easing of restrictions during December and the almost complete removal of restrictions will revive economic activity.
In addition, there is a certain softening of the rhetoric of the US and Chinese trade representatives, which should also be favourable for foreign trade. It is also worth noting that commodity and energy prices are now noticeably lower than in the middle of last year, which will further revive activity.
AUD/USD: Aussie Keep Firm Tone But Bulls May Take a Breather Before Push Through 0.70 Barrier
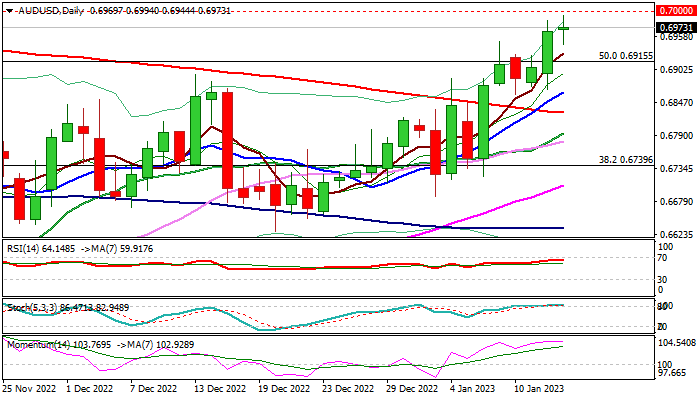
The Australian dollar remains firm on Friday and attempts towards psychological 0.70 barrier after rallying 1% on Thursday, underpinned by higher commodity prices and growing expectations that the Fed would further ease the pace of its policy tightening.
The pair is in strong uptrend for the third straight week, with break of 0.70 pivot to add to bullish signals as recent acceleration broke above 50% retracement of 0.7661/0.6170 fall.
However, break through 0.70 pivot is unlikely to be straight as daily stochastic is overbought and 14-d momentum indicator turned sideways, implying that price action would take a breather for consolidation.
Broken Fibo barrier at 0.6915 offers initial support, with extended dips expected to find ground above rising daily Tenkan-sen (0.6840) to keep bullish structure intact and offer better buying opportunities.
Sustained break of 0.70 pivot would expose targets at 0.7076/0.7091 (Fibo 61.8% / base of weekly cloud). Only break and close below daily Kijun-sen (0.6811) would weaken near-term tone and allow for deeper pullback.
Res: 0.7000; 0.7076; 0.7091; 0.7136.
Sup: 0.6944; 0.6915; 0.6863; 0.6811.
XAU/USD: Probe Through Key Barriers Signals Further Gains
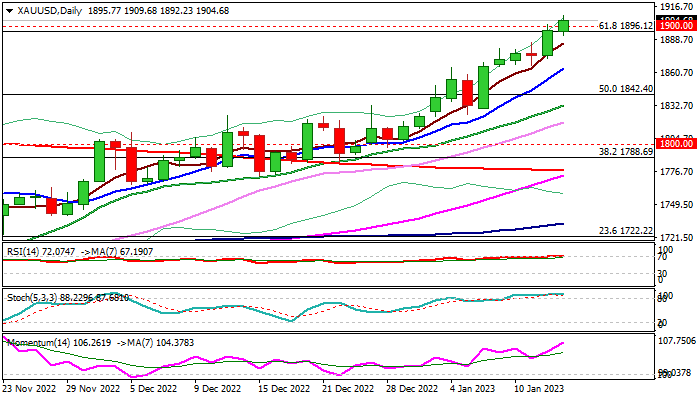
Gold keeps firm bullish stance and probing through key barriers ay $1896/$1900 (Fibo 61.8% of $2070/$1614 / psychological) on Friday.
The metal is on track for the third straight strong weekly advance, underpinned by weaker dollar on signals that easing US inflation would slow the pace of Fed’s rate hikes.
Firm bullish structure on daily chart signals further gains, though bulls may face difficulties to clearly break pivots at $1896/$1900, as studies are overbought on both, daily and weekly chart.
Potential dips are expected to offer better prices for re-entering bullish market, with broken weekly cloud top ($1875) and rising 10DMA ($1864) offering strong support, which should keep the downside protected.
Sustained break of $1896/$1900 zone would generate strong bullish signal and open way for acceleration towards next target at $1962 (Fibo 76.4%).
Res: 1909; 1935; 1962; 1981.
Sup: 1885; 1875; 1864; 1842.
EUR/USD: Bulls Hold Grip But Correction May Precede Fresh Advance
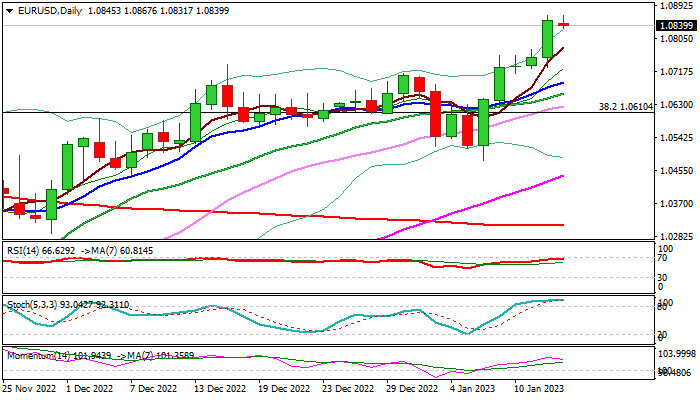
The Euro is consolidating under new multi-month high on Friday, after advancing 0.9% on Thursday.
Overall picture remains bullish as the pair is on track for the biggest weekly rally since the second week of November, although some profit taking should be anticipated.
Overbought daily studies contribute to the scenario, with limited dips expected to offer better buying opportunities for fresh acceleration higher, as the Euro received fresh support from weaker US inflation which signals that the Fed would further slow the pace of rate hikes.
Solid supports at 1.0636/10 (weekly low / broken Fibo 38.2% of 1.2349/0.9535) should ideally contain, with extended dips to find ground above the base of weekly cloud base (1.0545) to keep bulls intact.
Initial barriers lay at 1.0930/42 (weekly cloud top / 50% of 1.2349/0.9535), violation of which to expose psychological 1.10 resistance and open way for stronger bullish acceleration on break
Res: 1.0900; 1.0942; 1.1000; 1.1075.
Sup: 1.0736; 1.0689; 1.0636; 1.0610.
Canadian Dollar Showing Strength
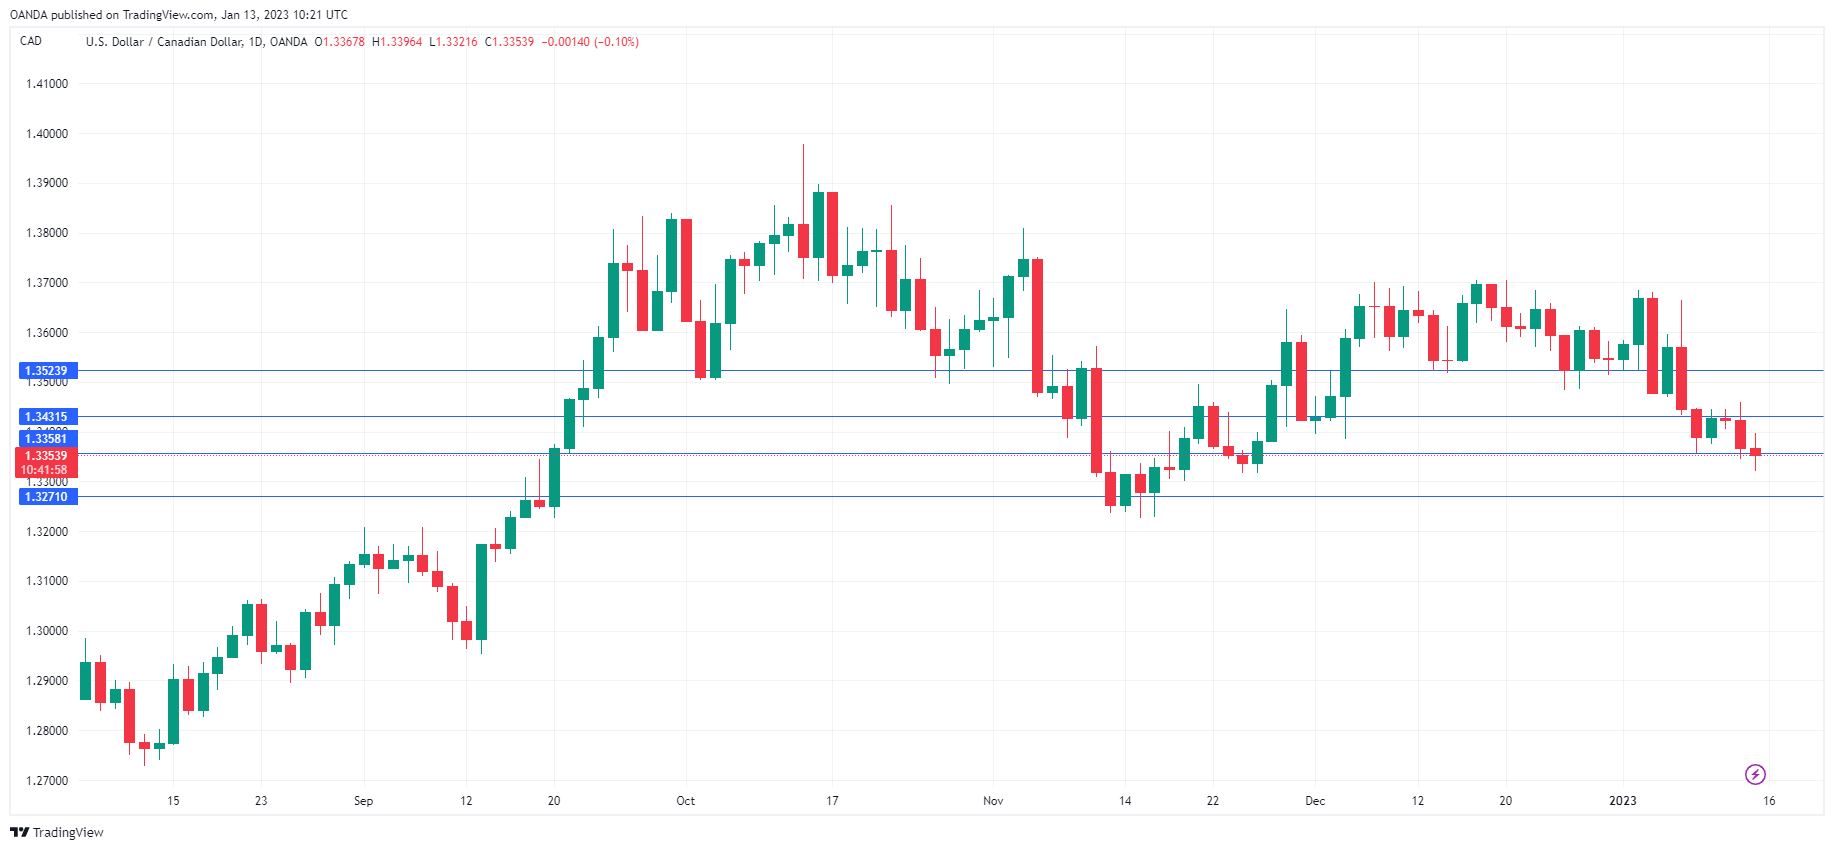
The Canadian dollar has edged higher on Friday. In the European session, USD/CAD is trading at 1.3341, down 0.20%. The Canadian dollar is showing some strength lately, having posted only one losing session since January 5th and gaining over 200 points during that time.
US dollar retreats after inflation slows
US inflation declined in December and has de-accelerated for a sixth successive month. Headline CPI fell to 6.5%, down from 7.1% and matching the estimate. Notably, the core rate also slowed, dropping from 6.0% to 5.7% and matching the forecast. From a peak of 9.1% in June, the downtrend is certainly encouraging, although it remains much higher than the Fed’s 2% target. Still, it’s clear that inflation is on the right path as the impact of the Fed’s aggressive tightening cycle is being felt in the economy.
The inflation data came in as expected, but the US dollar retreated against the majors on Thursday, as the markets are hoping that the Fed will pivot on its aggressive rate policy. The Fed, however, hasn’t given any such signals. After the inflation release, Fed member Harkins said that he supports a 25-basis point hike at the February meeting and expects rates to rise “a few more times this year”, with a 25-bp pace being appropriate. This is more hawkish than some of the voices we’re hearing in the markets that are saying the February hike could be a “one and done” that will wrap up the current rate-tightening cycle.
It was a very light data calendar for Canadian events this week, but next week will be busy. Canada releases the BOC Business Outlook Survey on Monday, followed by the December inflation report on Tuesday and retail sales on Friday. These three events will be closely watched by the Bank of Canada and could play a pivotal role in the BOC’s rate decision on January 25th. There is a 70% probability that the BoC will deliver a modest 25-bp increase to kick off 2o23, with a 30% chance of no change.
USD/CAD Technical
- USD/CAD is testing support at 1.3358. Next, there is support at 1.3271
- 1.3431 and 1.3522 are the next resistance lines
Eurozone exports rose 17.2% yoy, imports up 20.2% yoy in Nov
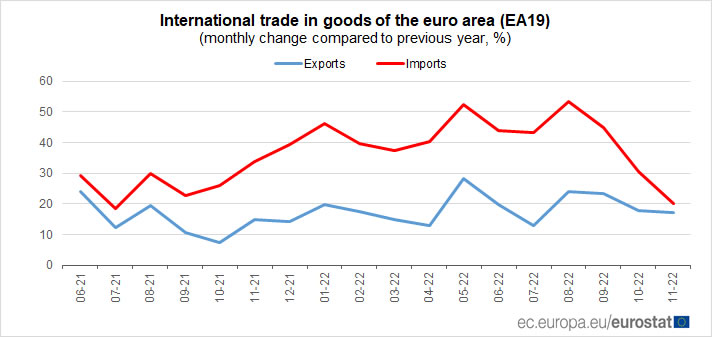
Eurozone export of goods to the world rose 17.2% yoy to EUR 264.7B in November. Imports rose 20.2% yoy to EUR 276.3B. Trade deficit came in at EUR -11.7B. Intra-Eurozone trade rose 16.8% yoy to EUR 241.5B.
In seasonally adjusted term, exports rose 1.0% mom to EUR 251.5B. Imports dropped -3.8% mom to EUR 266.7B. Trade deficit narrowed from October's EUR -28.1B to EUR -15.2B, versus expectation of EUR -20.0B. Intraday Eurozone trade dropped from October's EUR 233.4B to EUR 232.2B.
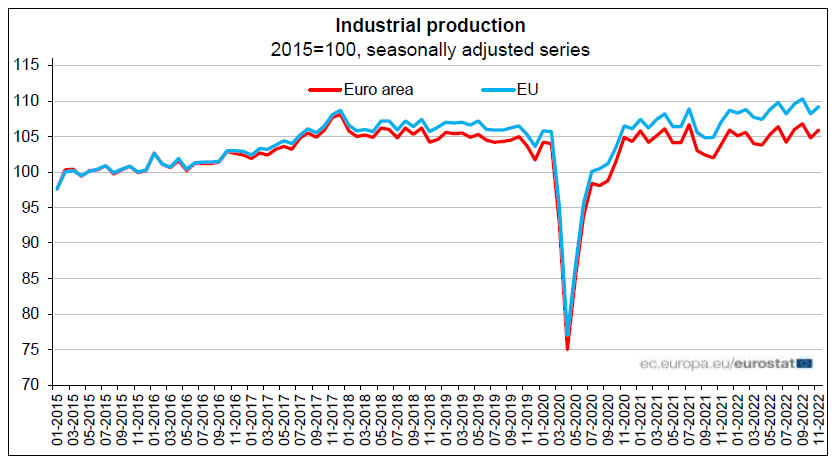
Eurozone industrial production rose 1.0% mom in Nov, EU up 0.9% mom
Eurozone industrial production rose 1.0% mom in November, above expectation of 0.6% mom. Production of capital goods grew by 1.0%, intermediate goods by 0.8% and durable consumer goods by 0.4%, while production of energy fell by -0.9% and non-durable consumer goods by -1.3%.
EU industrial production rose 0.9% mom. Among Member States for which data are available, the highest monthly increases were registered in Ireland (+6.4%), Luxembourg (+5.0%) and Malta (+4.6%). The largest decreases were observed in Estonia (-3.7%), Sweden (-3.3%) and Croatia (-1.9%).
GBP/USD Edges Higher as GDP Outperforms
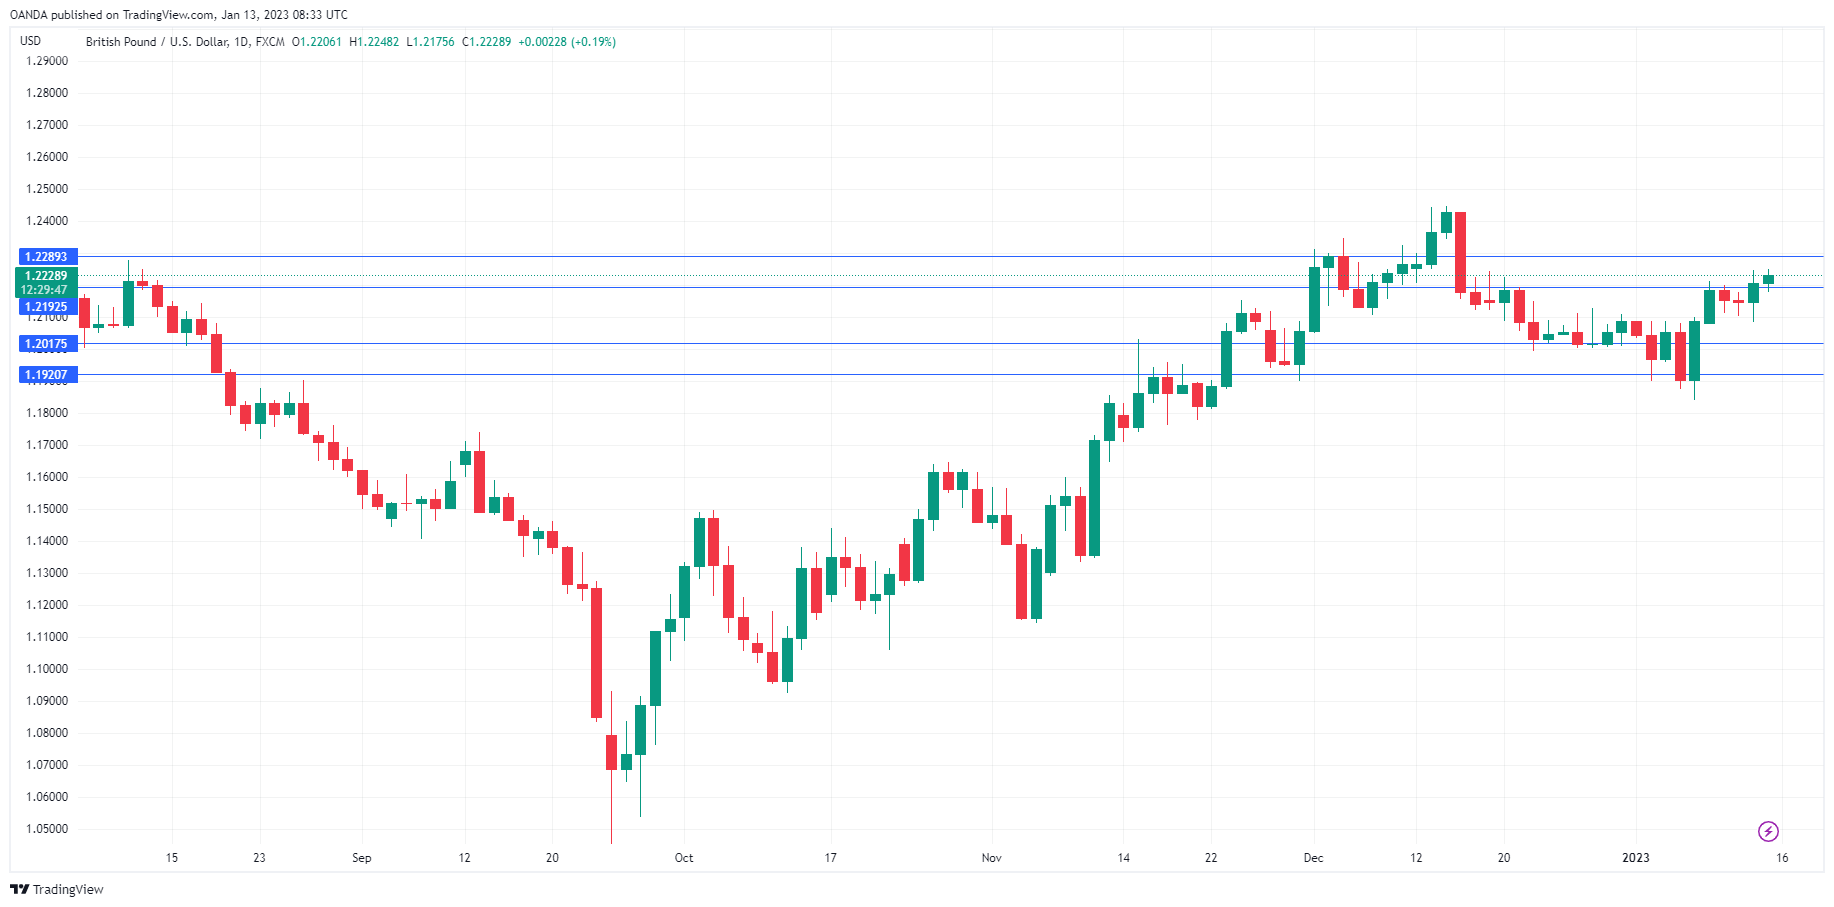
The British pound is slightly higher on Friday. GBP/USD is trading at 1.2234, up 0.24%. The pound has enjoyed a solid week, with gains of 1.2%.
US inflation drops again
US inflation continues to decline and slowed for a sixth straight month in December. Headline CPI fell to 6.5%, down from 7.1% and matching the estimate. The drop was driven by lower prices for gasoline as well as new and used vehicles. Core CPI showed a similar trend, dropping from 6.0% to 5.7%, which matched the forecast. Inflation is coming down slowly and remains much higher than the Fed’s 2% target, as any Fed member will be quick to point out. Still, it’s clear that inflation is on the right path as the impact of the Fed’s aggressive tightening cycle is being felt in the economy.
The inflation data came in as expected, but the markets were nonetheless delighted and the US dollar sustained losses across the board on Thursday. The Fed was also pleased that inflation continues to downtrend. After the inflation release, Fed member Harkins said he supports a 25-basis point hike at the February meeting and expects rates to rise “a few more times this year”, with a 25-bp pace being appropriate. This sounds like an acknowledgment that inflation has peaked, although we won’t be hearing the “P” word from any Fed official, for fear of the markets going overboard and loosening conditions, which would complicate the fight against inflation. Other Fed members have come out in support of a 25-bp hike in February and the CME’s FedWatch has pegged the odds of a 25-bp increase at 93%. Barring some unforeseen event, a 25-bp hike looks like a done deal.
In the UK, GDP for November outperformed, with a 0.1%, gain, above the forecast of -0.2% but weaker than the October read of 0.5%. The broader picture is not pretty, with GDP falling by -0.3% in the three months to November. The UK economy is sputtering and the Bank of England has its work cut out as it must continue raising rates, despite the weak economy, in order to curb high inflation. The BoE meets next on February 2nd.
GBP/USD Technical
- GBP/USD tested support at 1.2192 earlier in the day. The next support level is 1.2017
- There is resistance at 1.2290 and 1.2366
GBPJPY Tumbles to Weekly Lows; Bears Could Stay
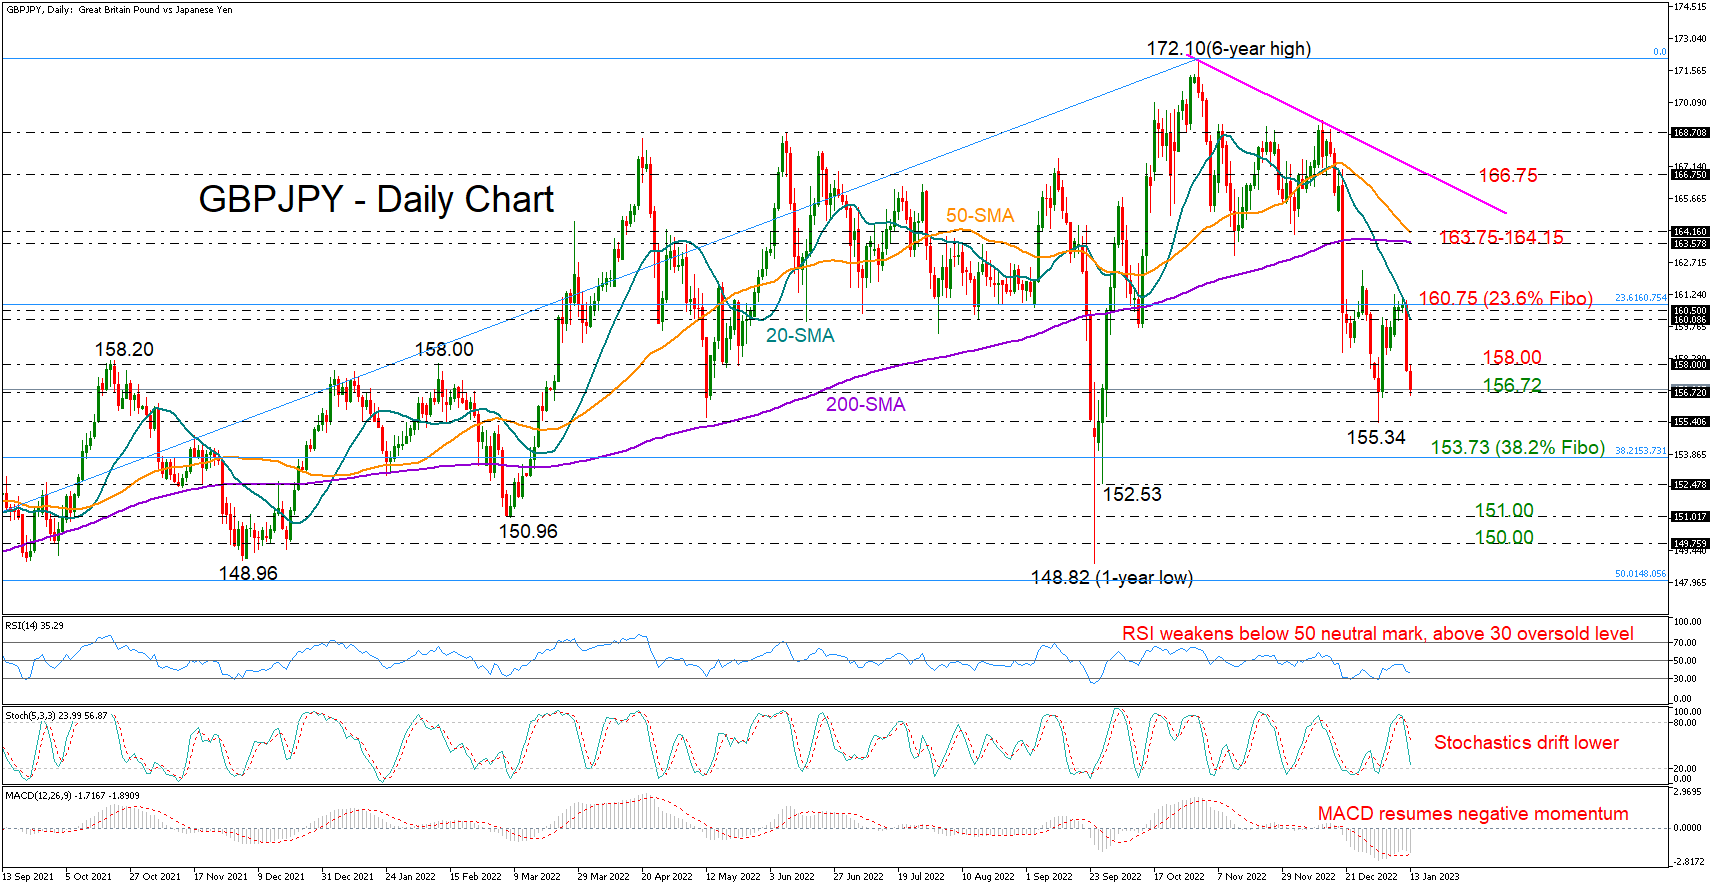
GBPJPY sank by almost 2.0% on Thursday following the rejection around the 20-day simple moving average (SMA) and the 23.6% Fibonacci retracement level of the 2020-2022 uptrend at 160.75.
The decline stretched to January’s support region of 156.72 early on Friday, with the momentum indicators dashing hopes for a meaningful recovery. Specifically, the MACD has resumed its negative momentum, while the RSI has changed trajectory back to the downside, currently standing comfortably above its 30 oversold level. Likewise, the stochastic oscillator is still some distance away from 20 despite drifting lower, warning more losses ahead.
In other discouraging signals, the 50- and 200-day SMAs are heading for a death cross for the first time since 2020, suggesting that the previous uptrend has probably peaked.
Additional declines could revisit January’s low of 155.34, a break of which could drive the price directly to the 38.2% Fibonacci level of 153.73. Sliding below the 152.53 trough too, the bears could next target the 151.00 and 150.00 psychological numbers.
In the positive scenario, where the pair returns above the nearby resistance of 158.00, the bulls may push for a close above the 20-day SMA at 160.00 and the 23.6% Fibonacci. If they succeed this time, the recovery could pick up steam towards the 200- and 50-day SMAs, currently seen within the 163.55-164.15 region. Running higher, the price may face a challenging battle around the tentative descending trendline around 166.75.
In summary, the sell-off in GBPJPY seems to have more room to run. A step below 156.72 is expected to renew downside pressures in the short term.
USDCAD Turns Bearish in Short-Term after Recent Slump
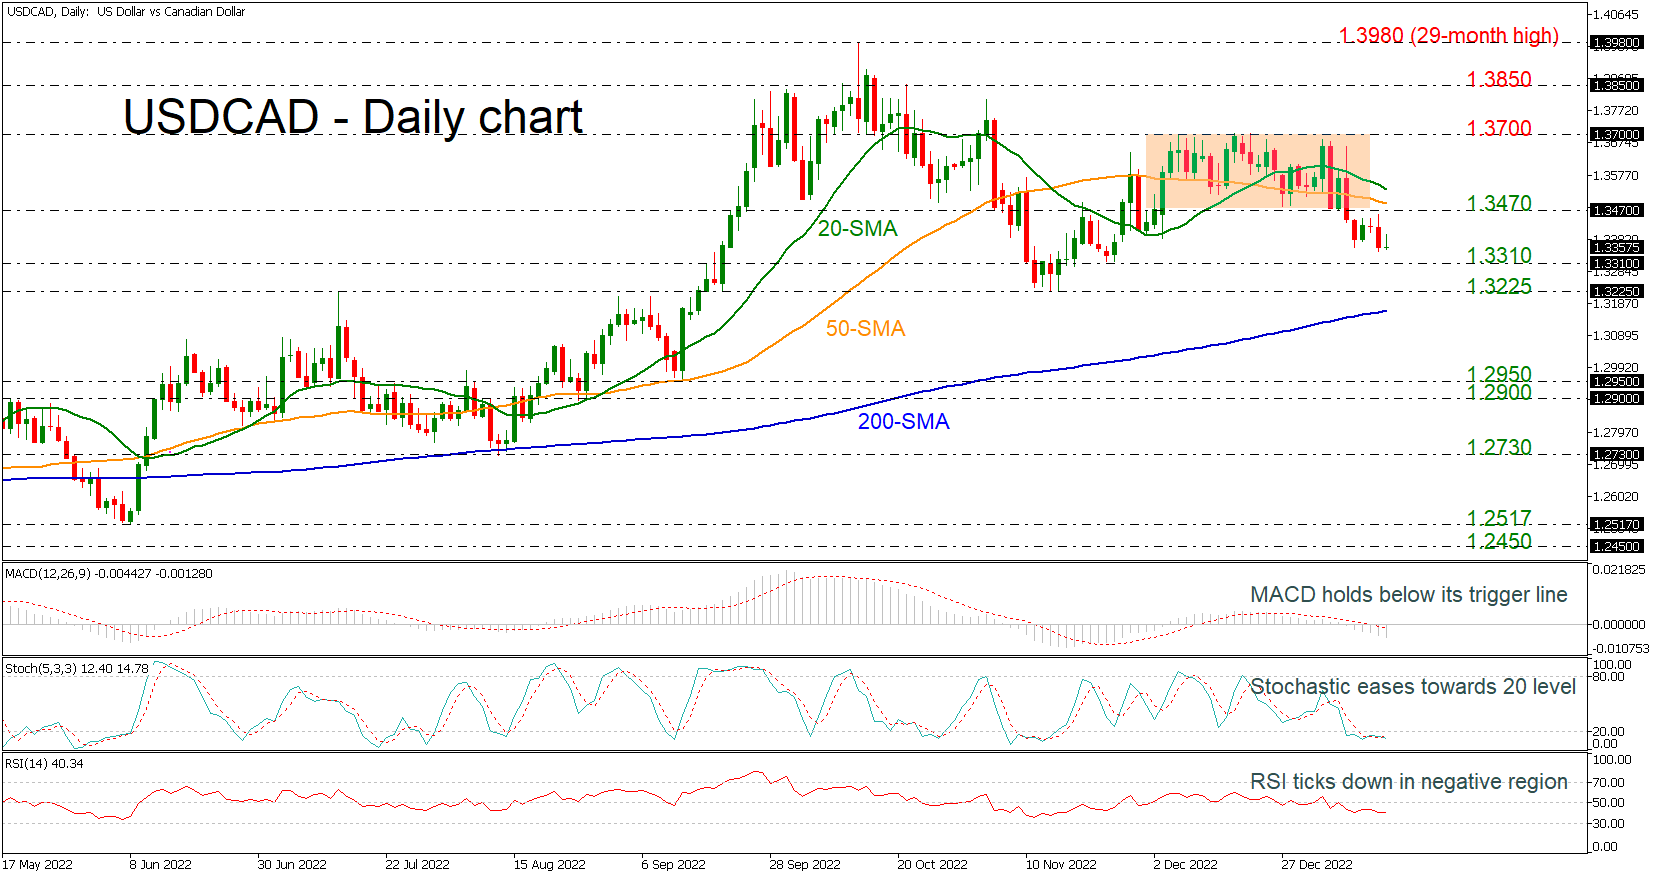
USDCAD broke the short-term sideways range to the downside in the preceding sessions, holding beneath the 1.3400 level.
According to the RSI, the market could maintain the latest downside momentum as the indicator is negatively sloped below its neutral threshold of 50, though the fast Stochastics suggest that the market is located in oversold territory, and therefore, some weakness is possible. The MACD is still extending the negative structure beneath its trigger and zero lines.
On the upside, the price could attempt to overcome the 1.3470 resistance and retest the 50- and then the 20-day simple moving averages (SMAs) at 1.3490 and 1.3530 respectively. If these lines successfully break the door could open for the 1.3700 psychological level. Should traders continue to buy the pair above the upper boundary of the channel, resistance could then run towards the 1.3850 area.
A downside move could find immediate support at the 1.3310 barrier, while slightly lower the 1.3225 level could also come into view. If the latter fails to halt bearish movements, the next target could be the 200-day SMA at 1.3165.
Turning to the medium-term trading, the outlook has been lacking direction over the last four months and only a dive below the 200-day SMA may switch the bias to bearish or a jump above the 29-month high of 1.3980 to bullish.