

Sample Category Title
Technical Outlook and Review
USD/JPY:
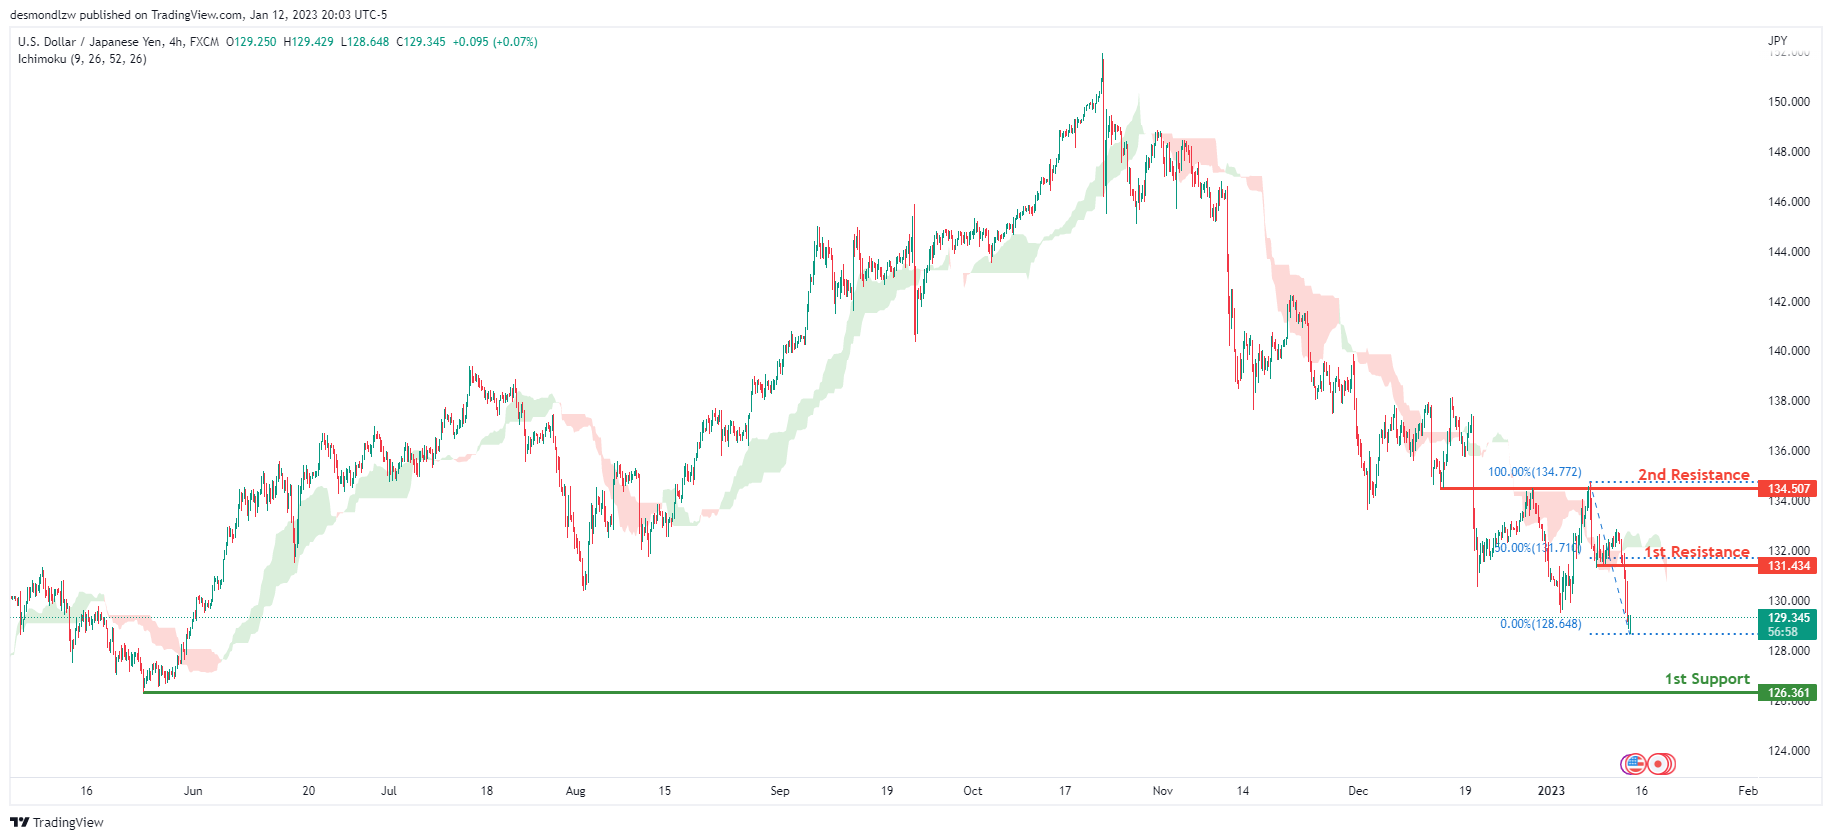
Looking at the H4 chart, my overall bias for USDJPY is bearish due to the current price being below the Ichimoku cloud, indicating a bearish market. If this bearish momentum continues, expect the price to possibly continue heading towards the 1st support level at 126.361, where the previous swing low is. In an alternate scenario, price could possibly head back up to retest the 1st resistance at 131.434, where the 50% Fibonacci line is.
Areas of consideration:
- H4 time frame, 1st resistance at 131.434
- H4 time frame, 1st support at 1126.361
DXY:
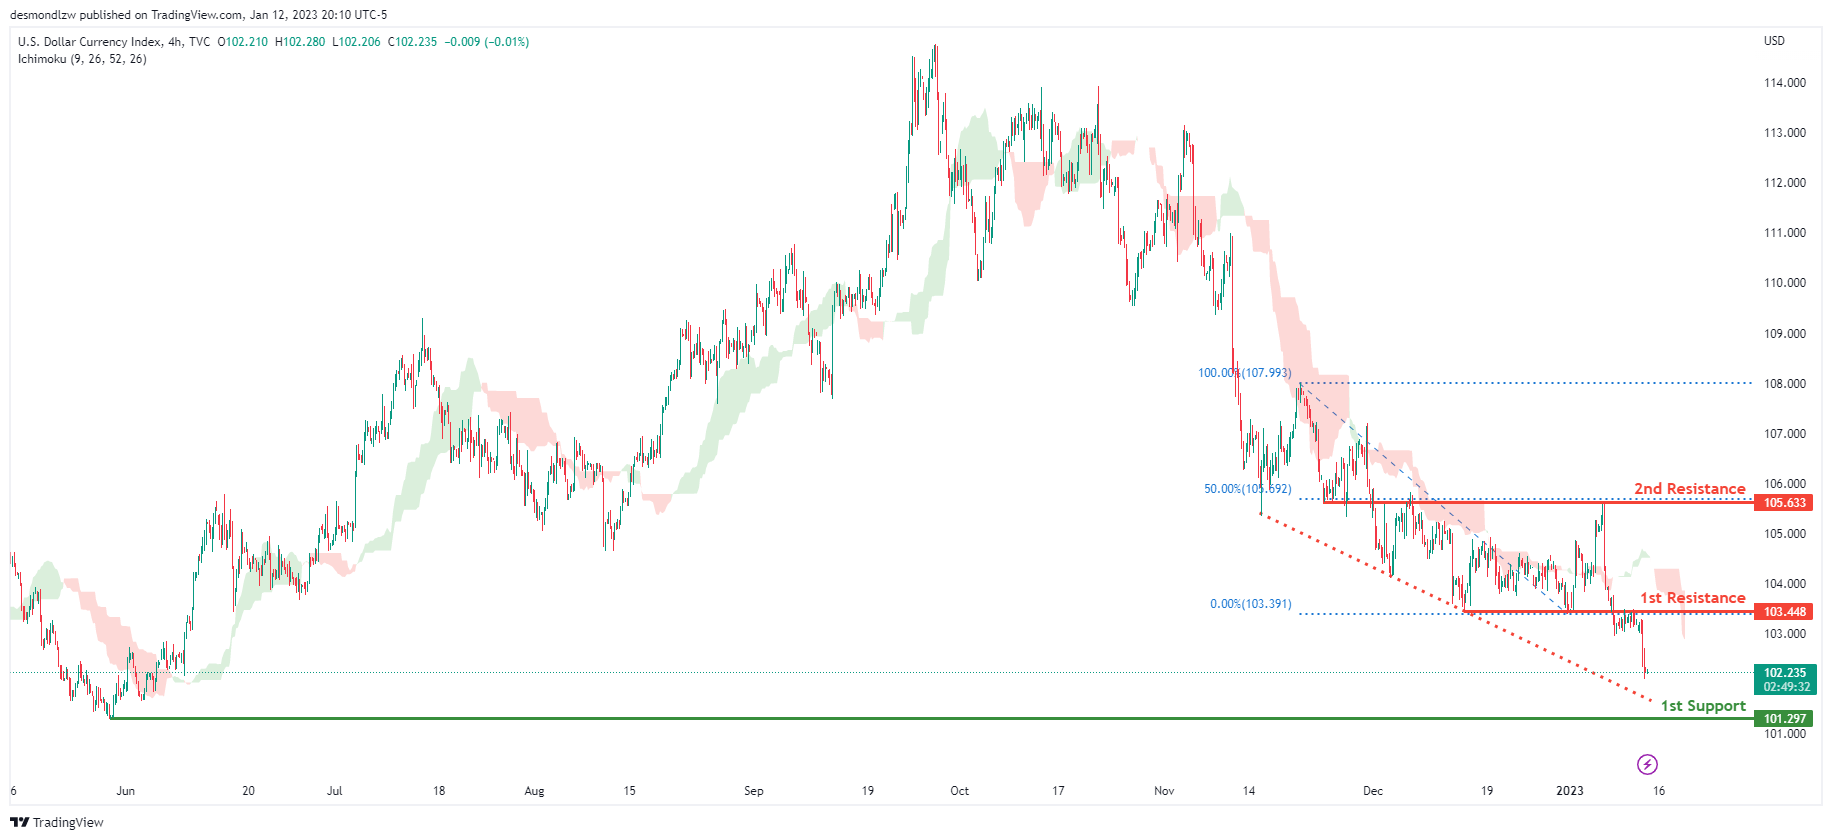
Looking at the H4 chart, my overall bias for DXY is bearish due to the current price being below the Ichimoku cloud, indicating a bearish market. To add confluence to this, price is along a descending trend line which indicates a bearish market. If this bearish momentum continues, expect the price to possibly continue heading towards the 1st support at 101.297, where the previous lows and liquidity hotspots are. In an alternative scenario, price could head back up to retest the 1st resistance at 103.448, where the previous low is.
Areas of consideration:
- H4 time frame, 1st resistance at 103.448
- H4 time frame, 1st support at 101.297
EUR/USD:
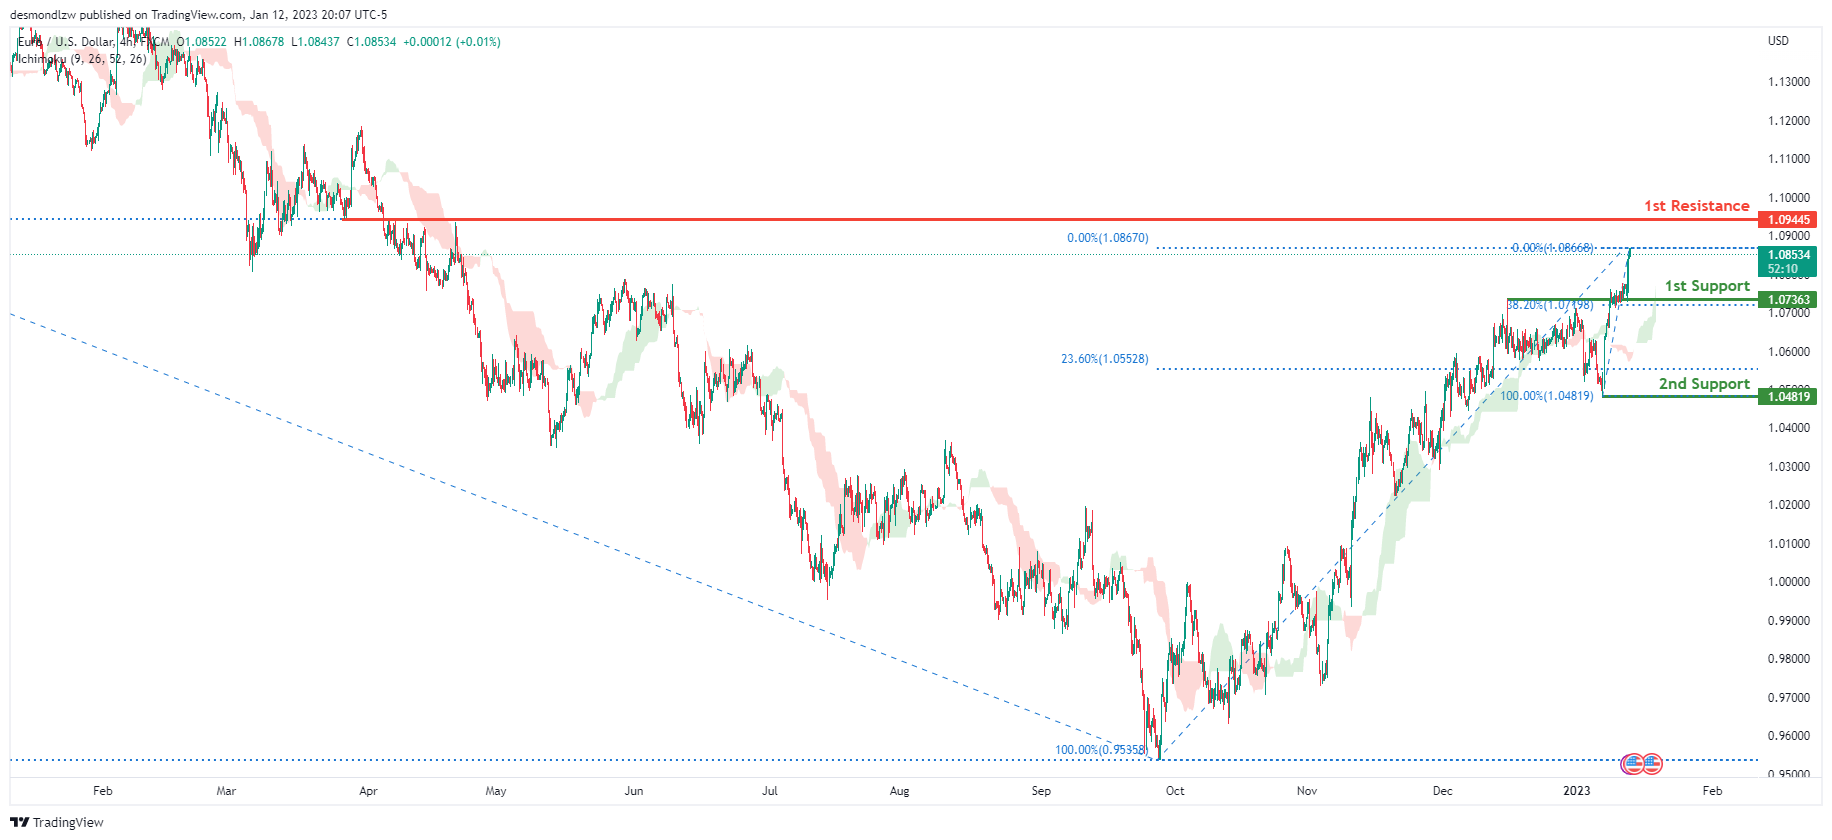
Looking at the H4 chart, my overall bias for EURUSD is bullish due to the current price being above the Ichimoku cloud, indicating a bullish market structure. If this bullish momentum continues, expect the price to possibly continue heading towards the 1st resistance at 1.09445, where the 50% Fibonacci line is. In an alternate scenario, price could possibly head back down to retest the 1st support level at 1.07363, where the 38.2% Fibonacci line is.
Areas of consideration :
- H4 1st resistance at 1.09445
- H4 1st support at 1.07363
GBP/USD:
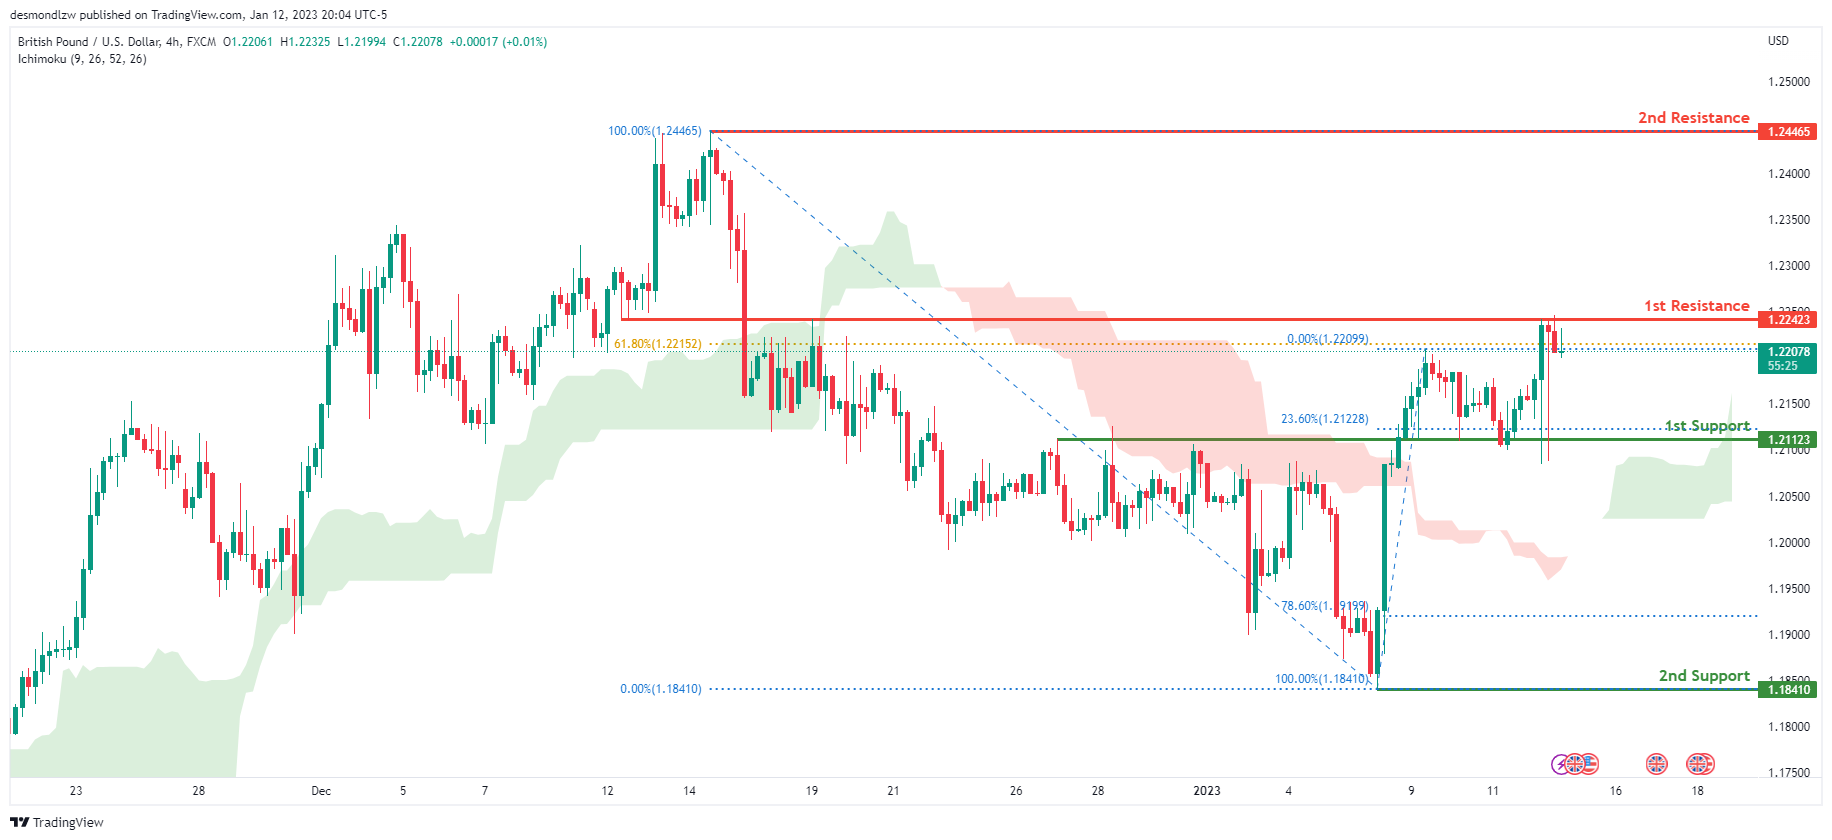
Looking at the H4 chart, my overall bias for GBPUSD is bullish due to the current price being above the Ichimoku cloud, indicating a bullish market. If this bullish momentum continues, expect price to possibly continue to break the 1st resistance line at 1.22423, slightly above where the 61.8% Fibonacci line is, before heading towards the 2nd resistance at 1.24465, where the previous swing high is. In an alternate scenario, price could possibly head back down towards the 1st support at 1.21123, where the 23.6% Fibonacci line is
Areas of consideration:
- H4 1st resistance at 1.22423
- H4 2nd resistance at 1.24465
- H4 1st support at 1.21068
USD/CHF:
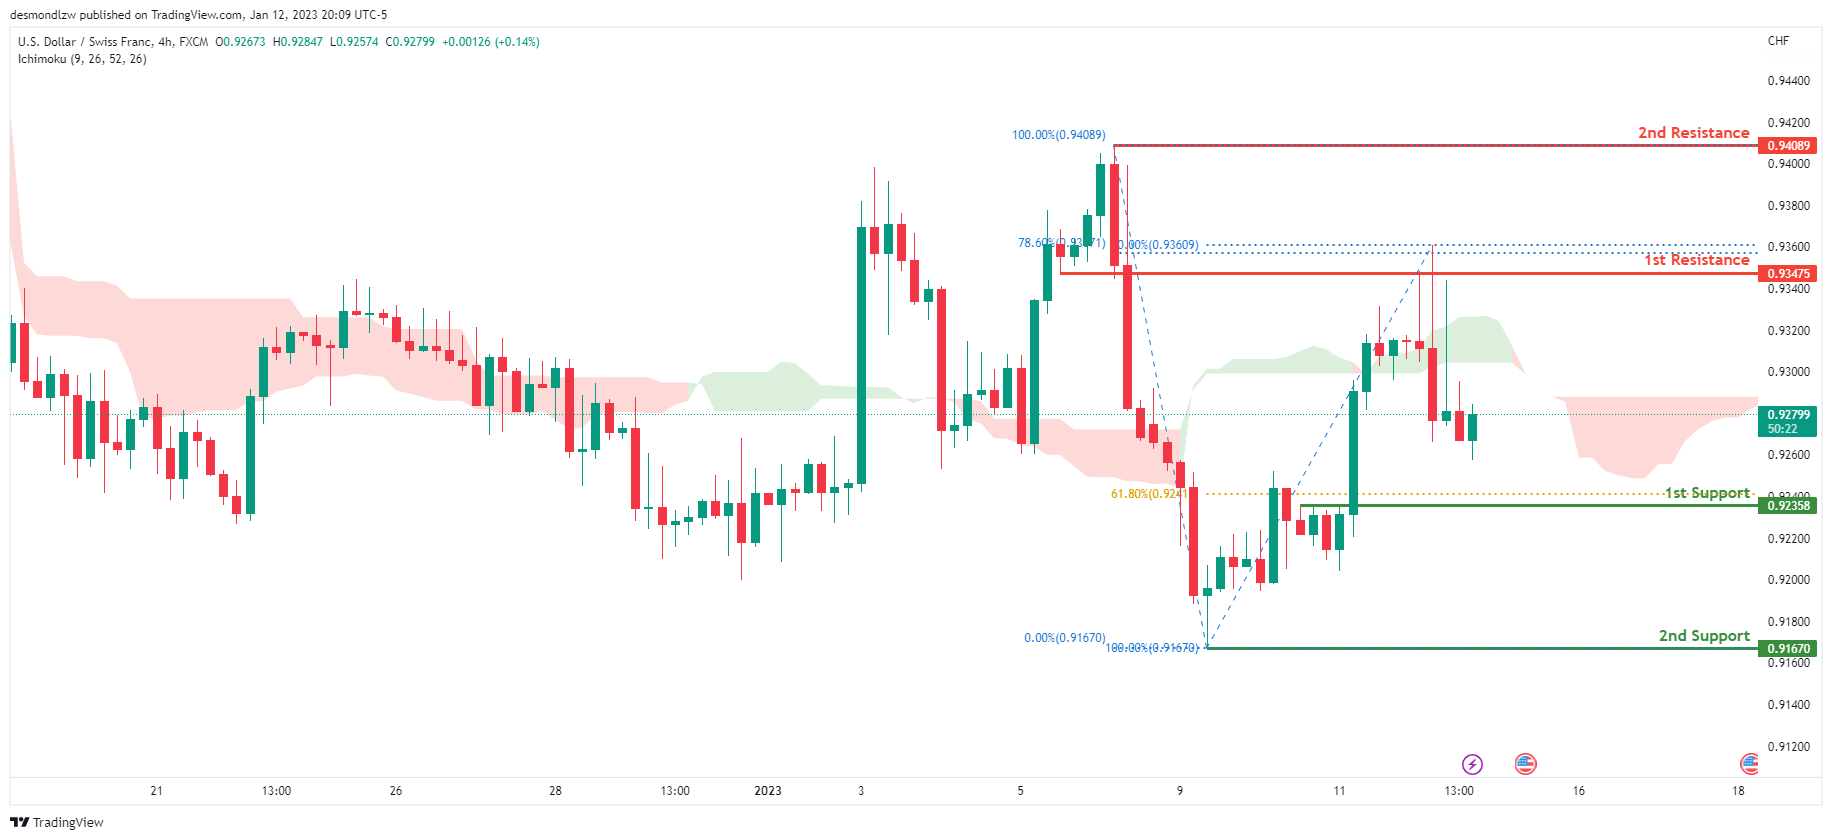
Looking at the H4 chart, my overall bias for USDCHF is bearish due to the current price being below the Ichimoku cloud, indicating a bearish market. If the current bearish trend continues, expect the price to possibly head back down to retest the 1st support at 0.92358, where the 61.8% Fibonacci line is. In an alternative scenario, price could possibly head towards the 1st resistance at 0.93475, where the 78.6% Fibonacci line is.
Areas of consideration
- H4 1st support at 0.92358
- H4 1st resistance at 0.93475
XAU/USD (GOLD):
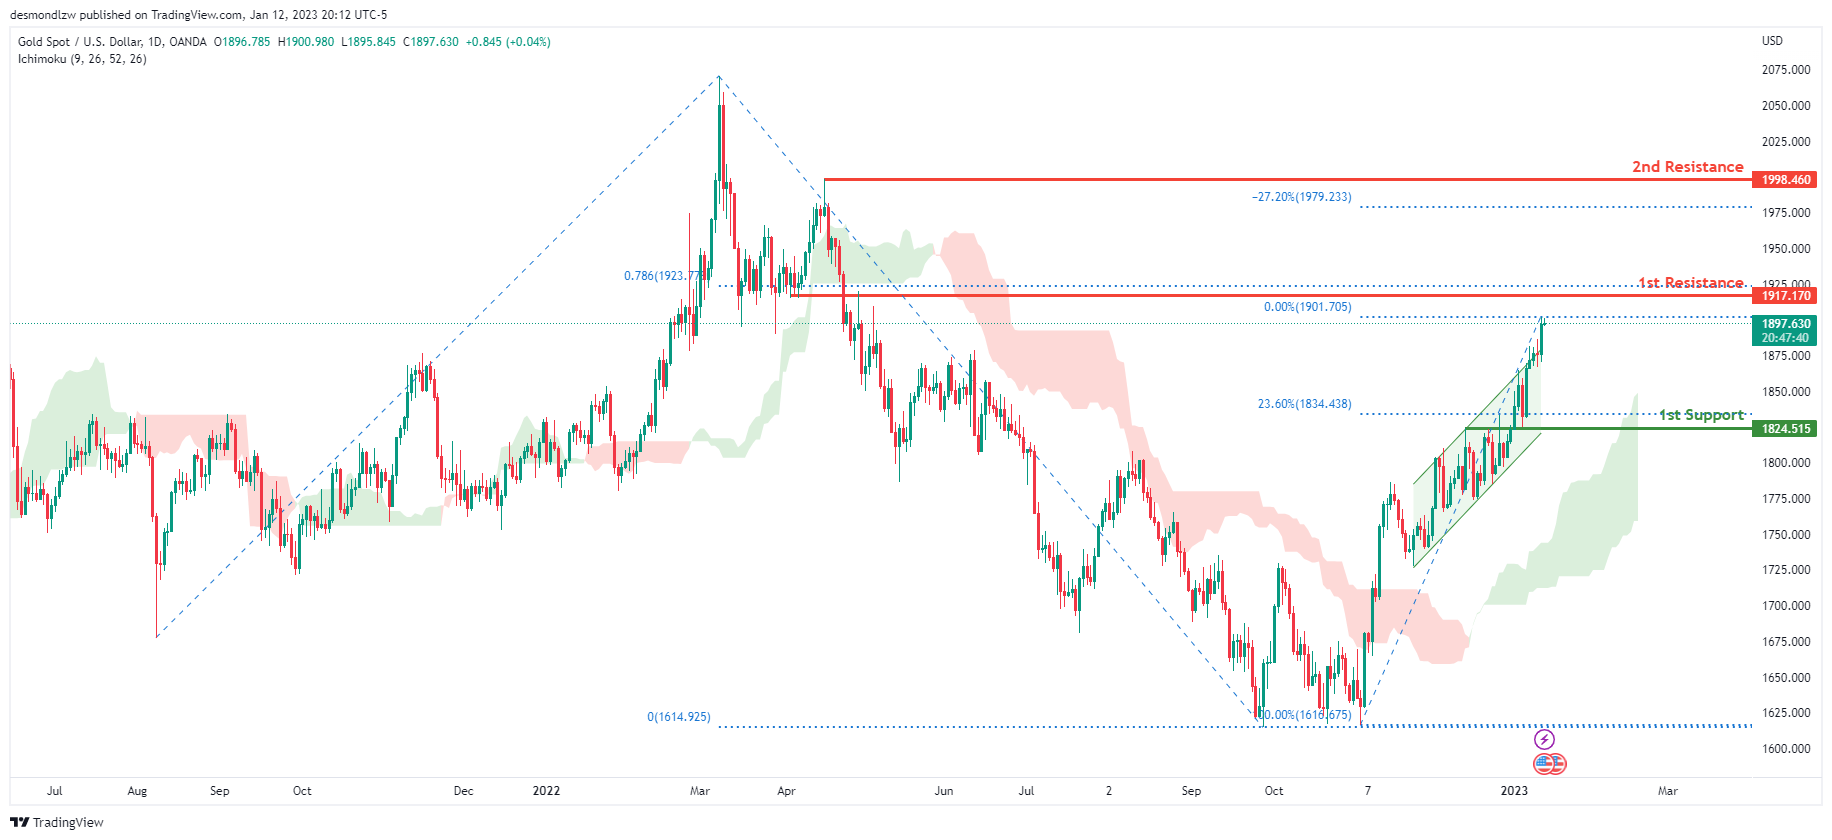
Looking at the Daily chart, my overall bias for XAUUSD is bullish due to the current price crossing above the Ichimoku cloud, indicating a bullish market. To add support to this bias, price has also broken above the bullish ascending channel. If this bullish momentum continues, expect the price to possibly continue heading towards the 1st resistance at 1917.170 where the 78.6% Fibonacci projection line is. In an alternative scenario, price could possibly head back down towards the 1st support at 1824.515, where the 23.6% Fibonacci line is.
Areas of consideration:
- H4 time frame, 1st resistance at 1917.170
- H4 time frame, 1st support at 1824.515
- H4 time frame, 2nd support at 1833.445
AUD/USD:
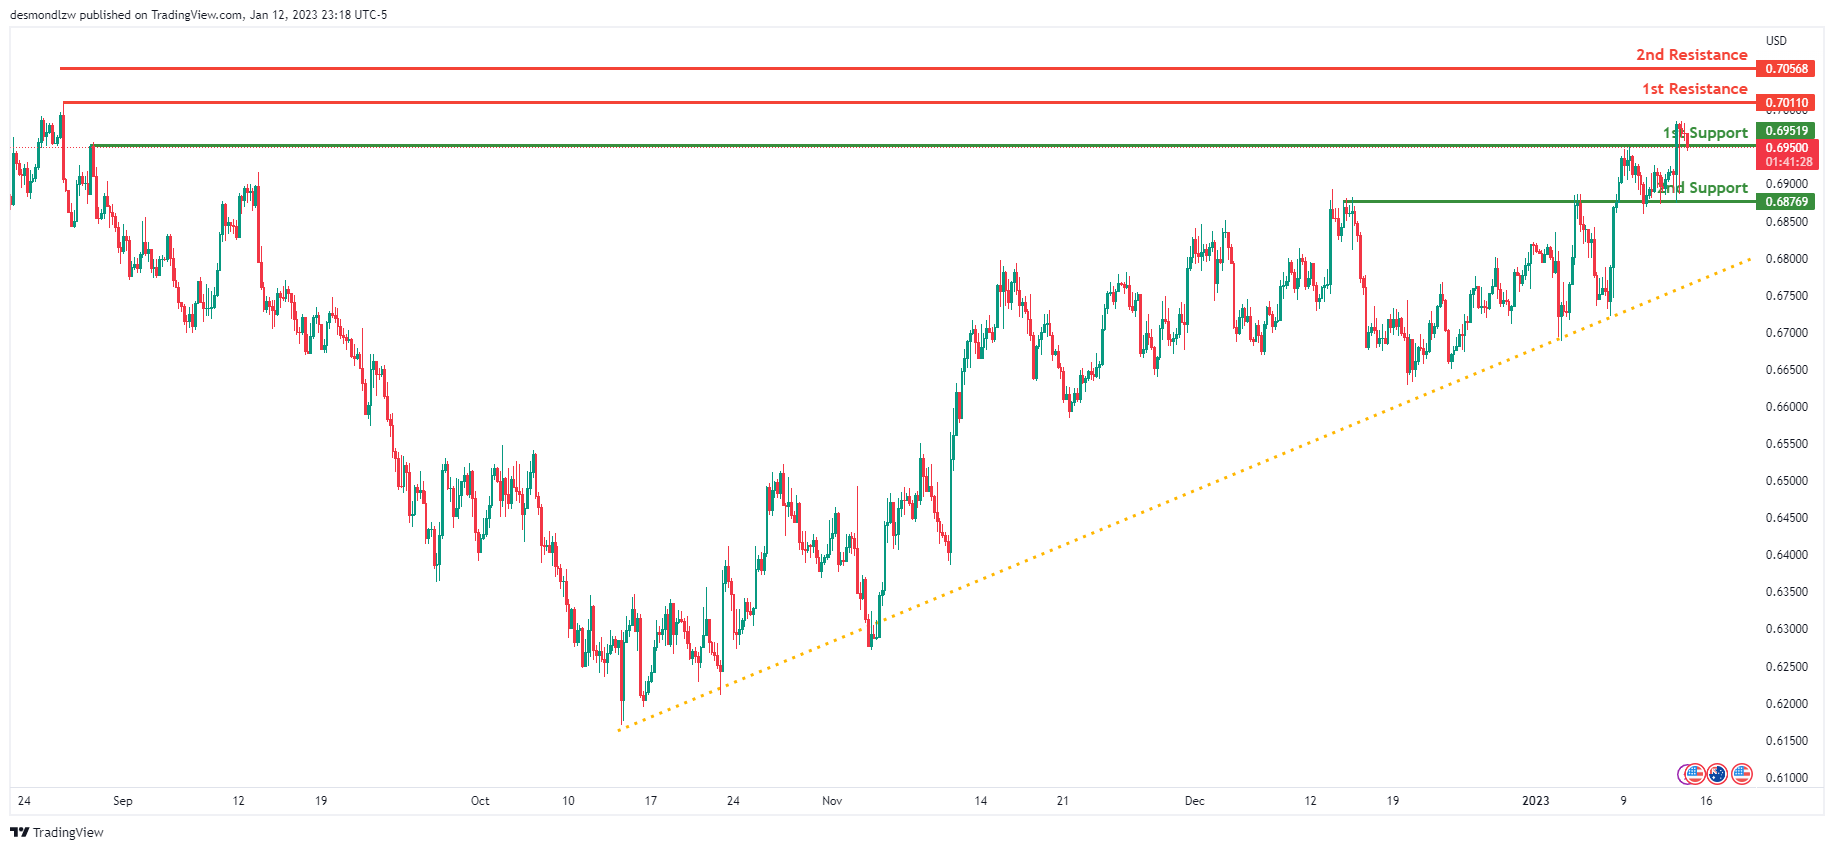
Looking at the H4 chart, we can see that the 1st support is at 0.6951 which is an overlap support. The 2nd support is down at 0.6876 which is also an overlap support. There is a long term ascending trend line that starts from 13th October 2022 which suggests that there is bullish momentum. Price is also above our Ichimoku cloud suggesting further bullish momentum.
1st resistance is at 0.7011 which is a swing high resistance from 26th August 2022. 2nd resistance is slightly higher at 0.7056.
Areas of consideration
- H4, 1st resistance at 0.7011
- H4, 2nd resistance at 0.7056
- H4, 1st support at 0.6951
- H4, 2nd support at 0.6876
NZD/USD:
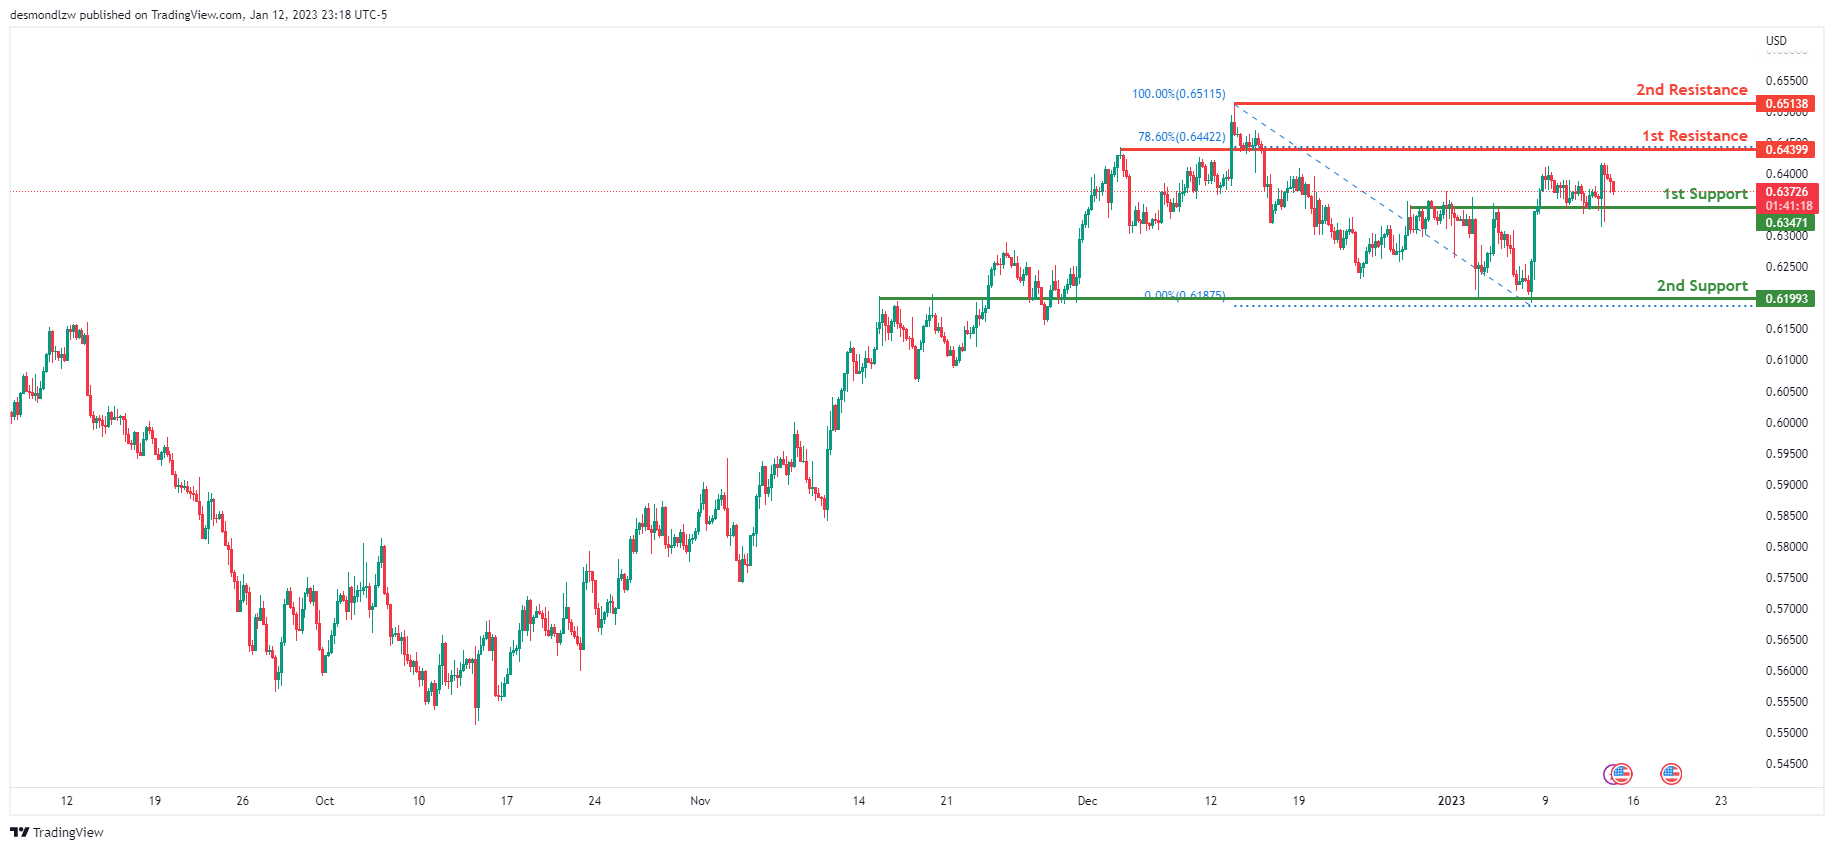
Looking at the H4 chart, we can see that the 1st support is at 0.64547 which is an overlap support. If price breaks this level, we could see it drop to 2nd support down at 0.6199.
For the resistance, our 1st resistance is at 0.6439 which is an overlap resistance that happens to line up with 78.6% Fibonacci retracement. If price breaks this level, it could go up to the 2nd resistance at 0.6513 which is a recent swing high resistance.
Areas of consideration:
- H4 time frame, 1st resistance at 0.64399.
- H4 time frame, 2nd resistance at 0.6513
- H4 time frame, 1st support at 0.6347
- H4 time frame, 2nd support at 0.6199.
USD/CAD:
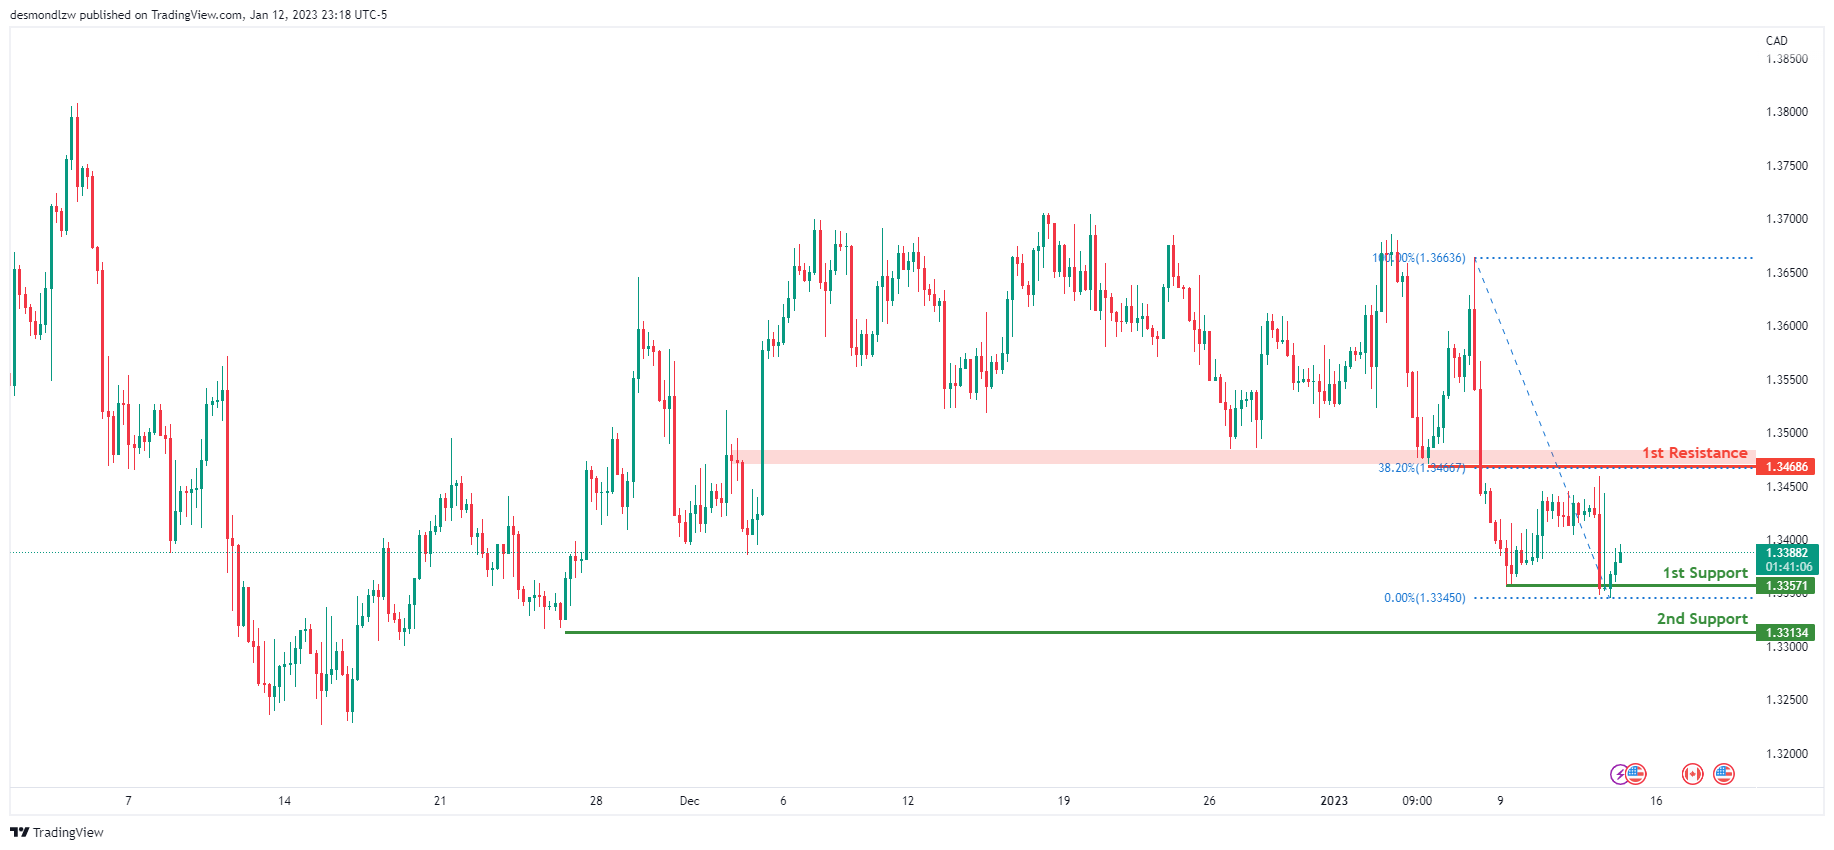
On the H4 chart, we can see price currently bouncing off 1st support at 1.3357 which is a swing low support. If price breaks this level, it could drop down to 2nd support at 1.3313 which is a swing low from the 25th November 2022.
In terms of resistance, the 1st resistance we can see is at 1.3468 which is an overlap resistance that happens to coincide with the 38.2% fibonacci retracement.
Areas of consideration:
- H4 time frame, 1st resistance at 1.3468
- H4 time frame, 1st support at 1.3357
- H4 time frame, 2nd support at 1.3313
OIL:
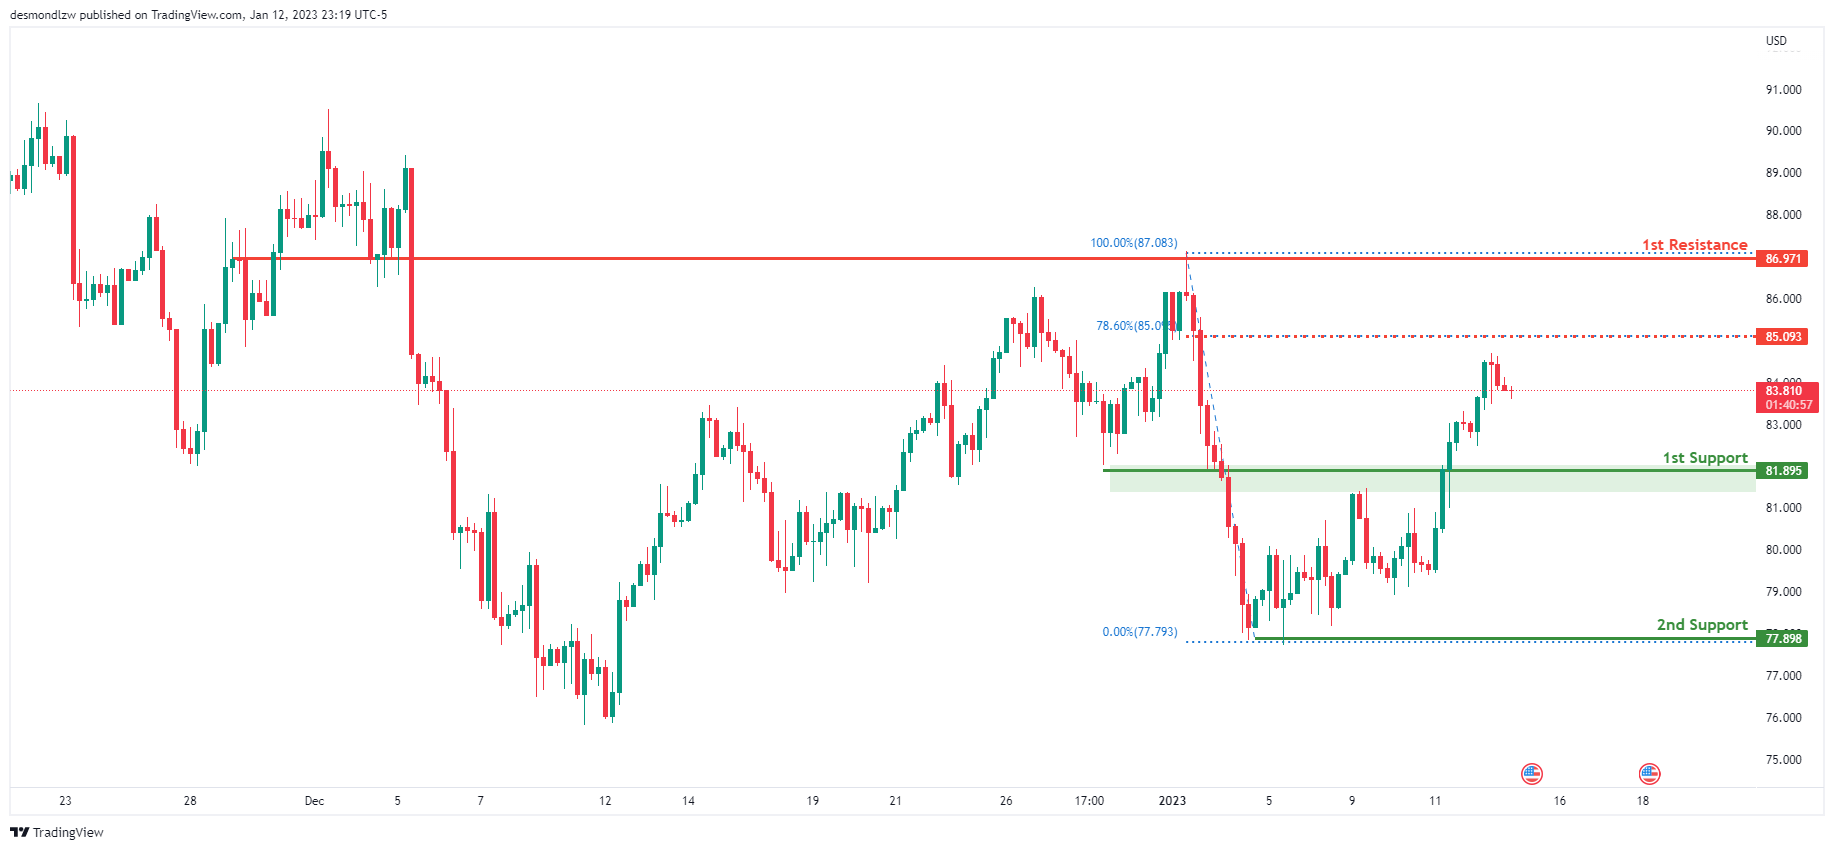
Looking at the H4 chart, we can see that there is an intermediate resistance at 85.09 which is a pullback resistance that happens to line up with the 78.6% fibonacci retracement. If price breaks this level, we could see price head up to our 1st resistance level at 86.97 which is an overlap resistance.
In terms of support, we can see our 1st support at 81.89 which is an overlap support. Breaking this level would trigger a further drop to our 2nd support at 77.89.
Areas of consideration:
- H4 time frame, intermediate resistance at 85.09
- H4 time frame, 1st resistance at 86.97
- H4 time frame,1st support at 81.89
- Hr time frame, 2nd support at 77.89
Dow Jones Industrial Average:
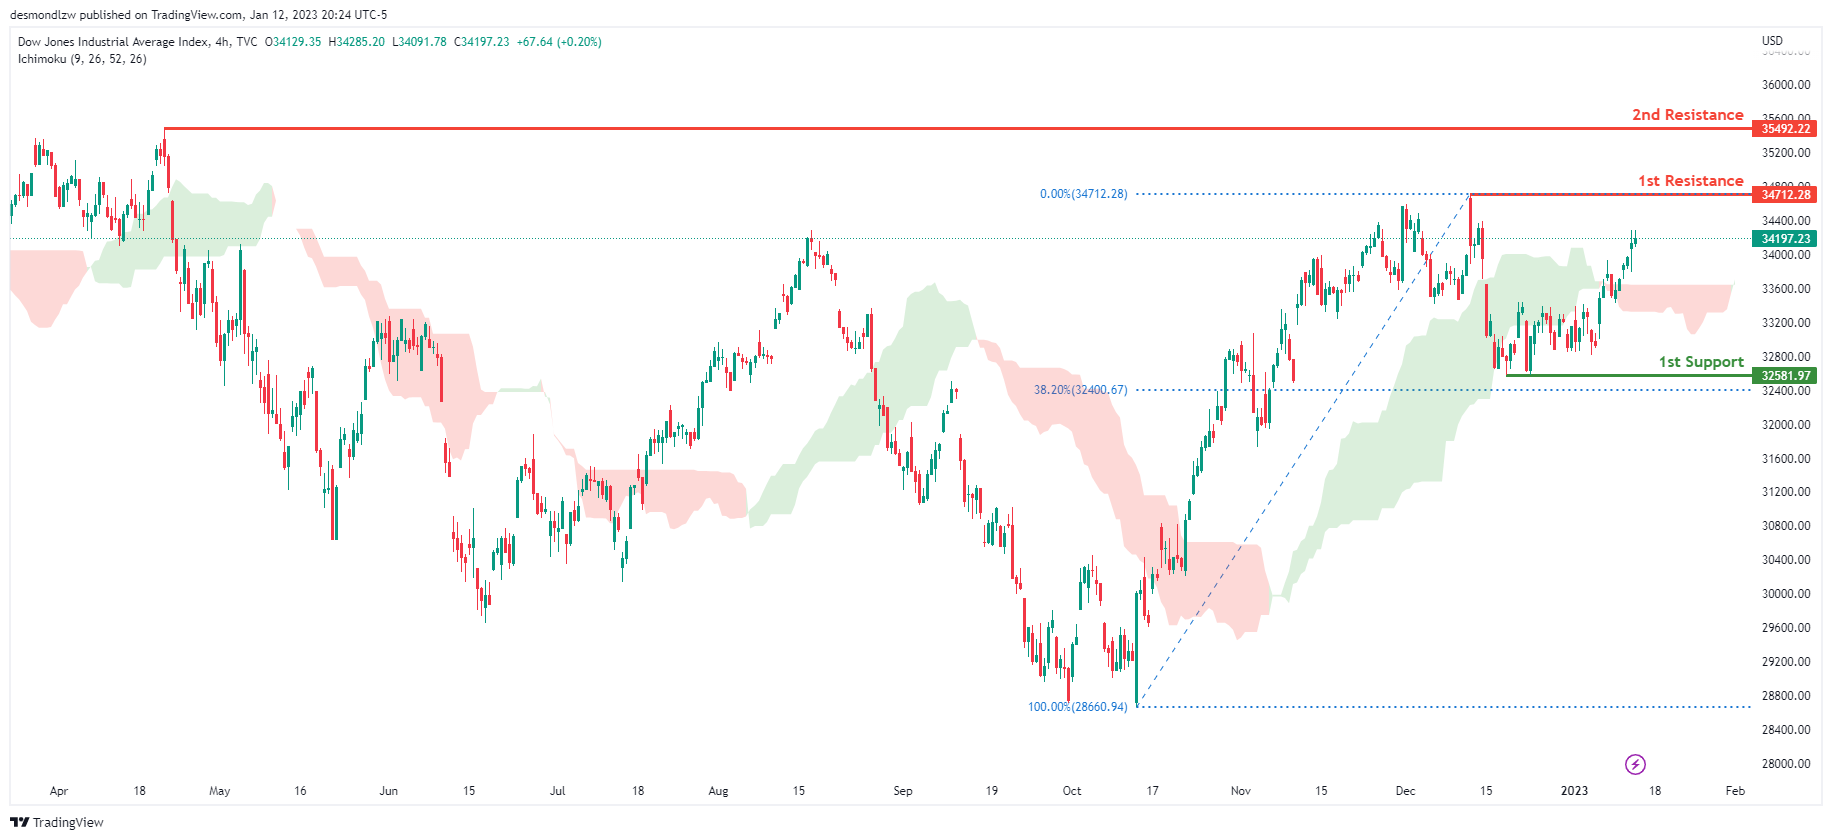
On the H4 chart, the overall bias for DJI is bullish. To add confluence to this, the price is crossing above the Ichimoku cloud which indicates a bullish market. If this bullish momentum continues, expect the price to possibly continue heading towards the 1st resistance line at 34712.28, where the recent swing high is. In an alternative scenario, price could possibly head back down towards the 1st support at 32581.97, slightly above where the 38.2% Fibonacci line is.
Areas of consideration:
- H4 time frame, 1st support at 32581.97
- H4 time frame, 1st Resistance at 34712.28
DAX:
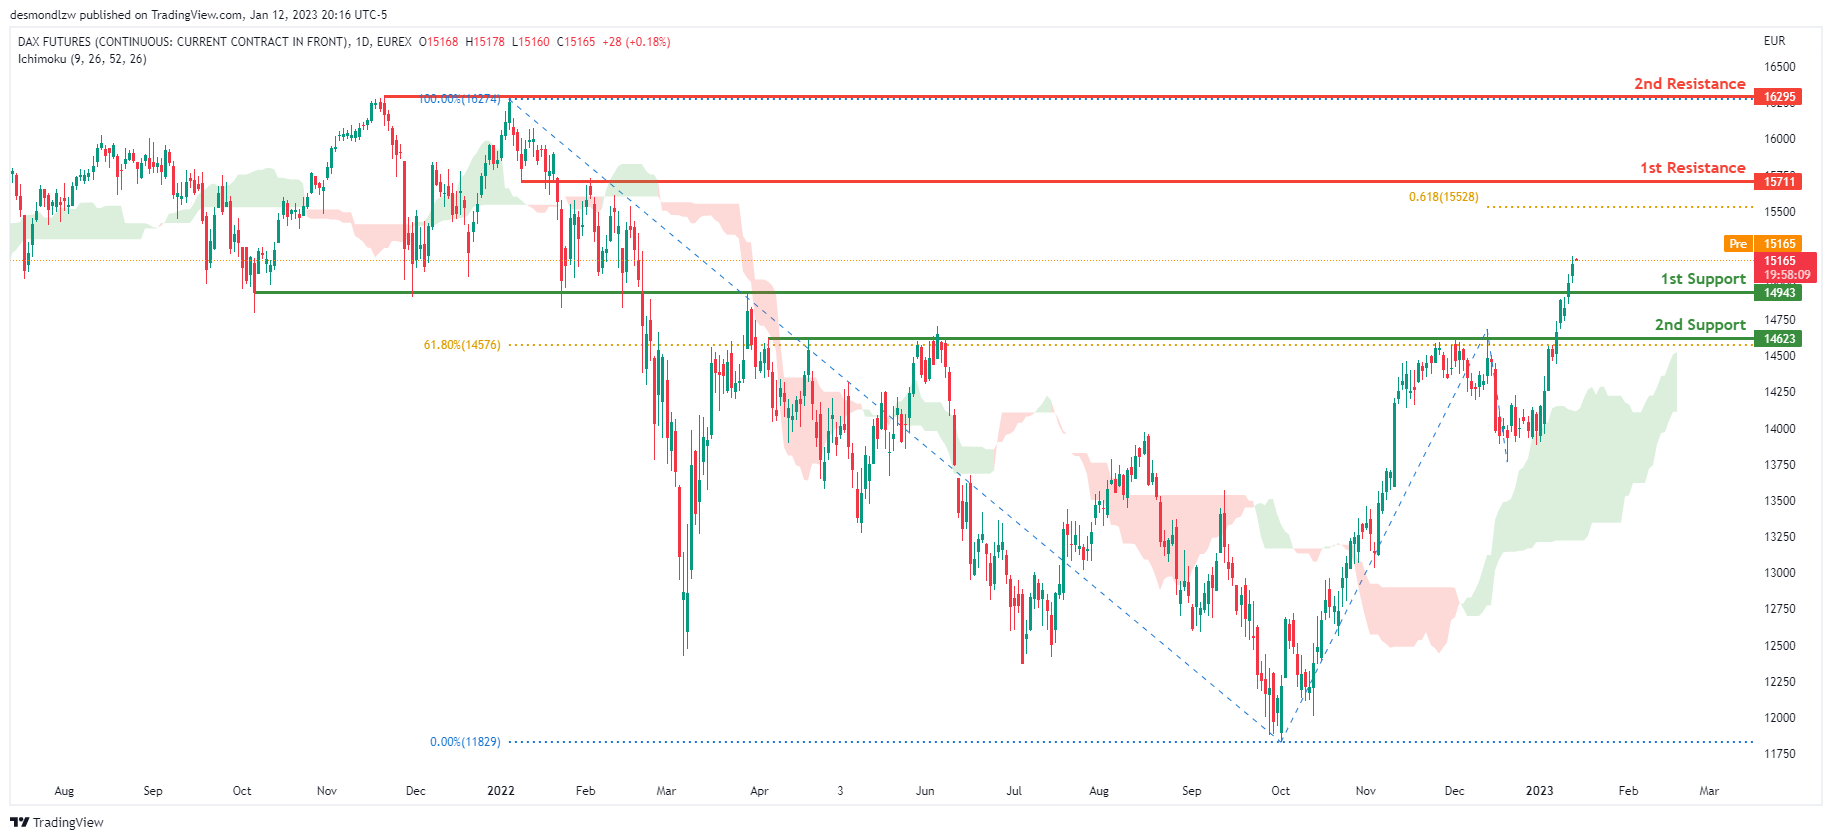
Looking at the Daily chart, my overall bias for DAX is bullish due to the current price crossing above the Ichimoku cloud, indicating a bullish market. If this bullish momentum continues, expect the price to possibly head towards the 1st resistance line at 15711, where the 61.8% Fibonacci projection line is. In an alternative scenario, price could possibly head down to retest the 1st support at 14943, where the 61.8% Fibonacci line is.
Areas of consideration:
- H4 time frame, 1st resistance is at 15711
- H4 time frame, 1st support is at 14943
ETHUSD:
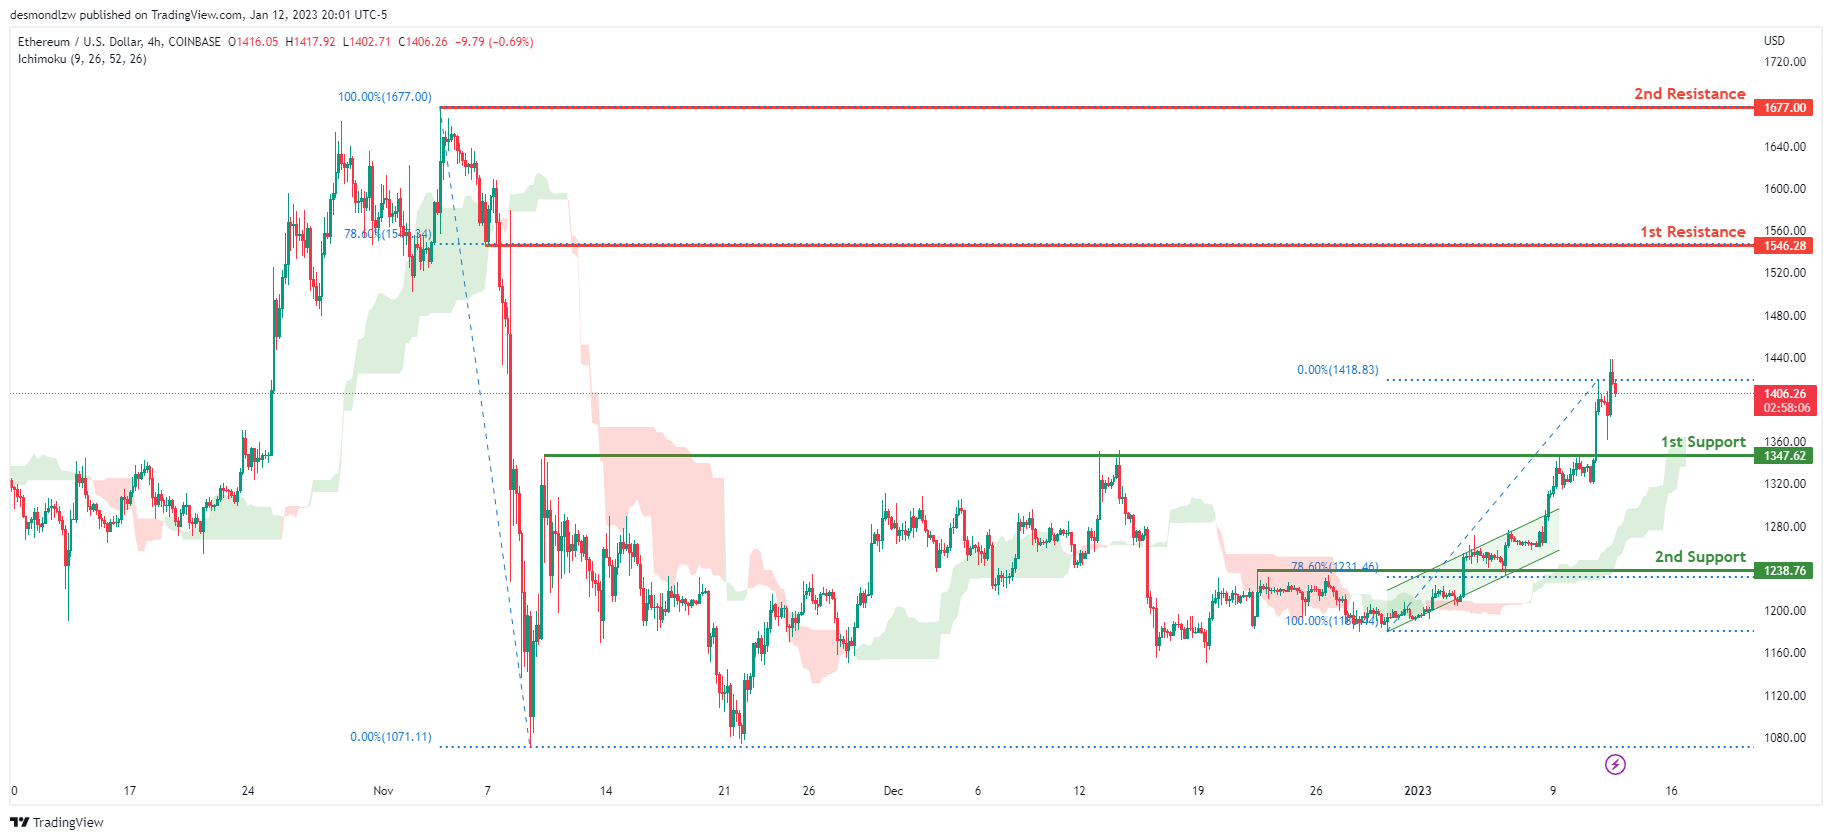
Looking at the H4 chart, my overall bias for ETHUSD is bullish due to the current price crossing above the Ichimoku cloud, indicating a bullish market. To add support to this bias, price is also broken upwards from an ascending channel. If this bullish momentum continues, expect the price to head towards the 1st resistance at 1546.28, where the 78.6% Fibonacci line is. In an alternative scenario, price could head back down to retest the 1st support at 1347.62, where the previous high is.
Areas of consideration:
- H4 time frame, 1st resistance of 1546.28
- H4 time frame, 1st support at 1347.62
BTCUSD:
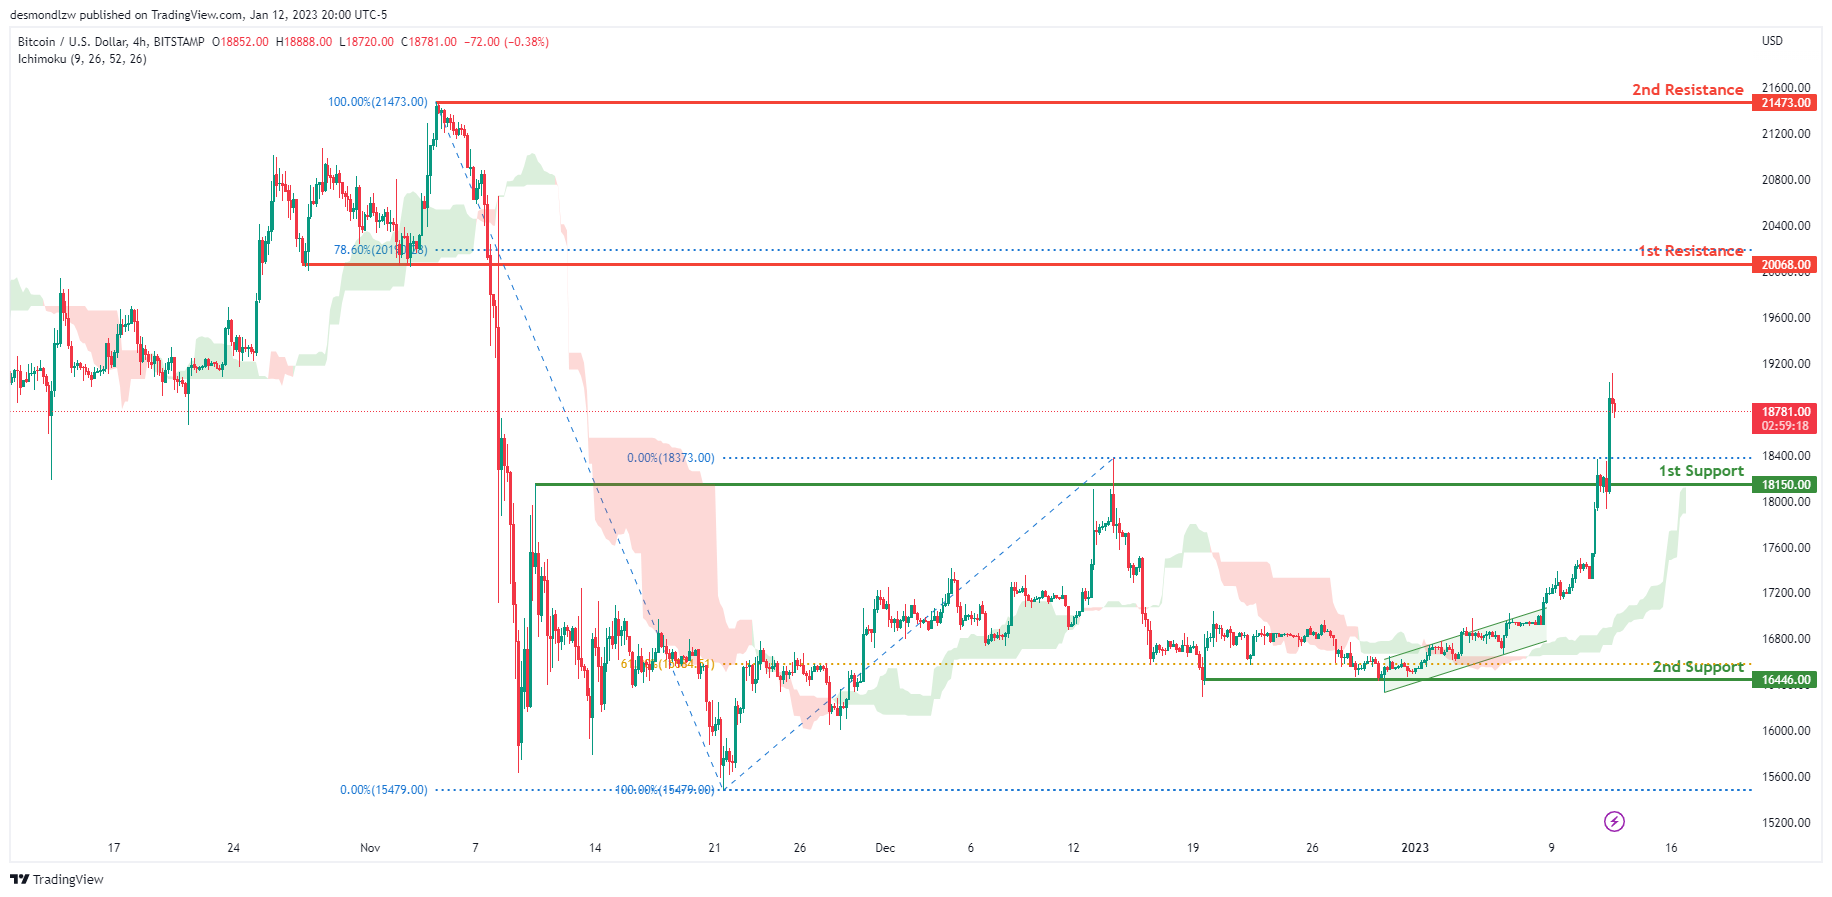
Looking at the H4 chart, my overall bias for BTCUSD is bullish due to the current price being above the Ichimoku cloud, indicating a bullish market. To add support to this bias, price has also broken above a bullish ascending channel. If this bullish momentum continues, expect the price to possibly continue heading towards the 1st resistance at 20068.00, where the 78.6% Fibonacci line is. In an alternative scenario, price could possibly head back down to retest the 1st support at 18150.00, where the previous high is..
Areas of consideration:
- H4 time frame, 1st resistance 20068.00
- H4 time frame, 1st support at 18150.00
S&P 500:
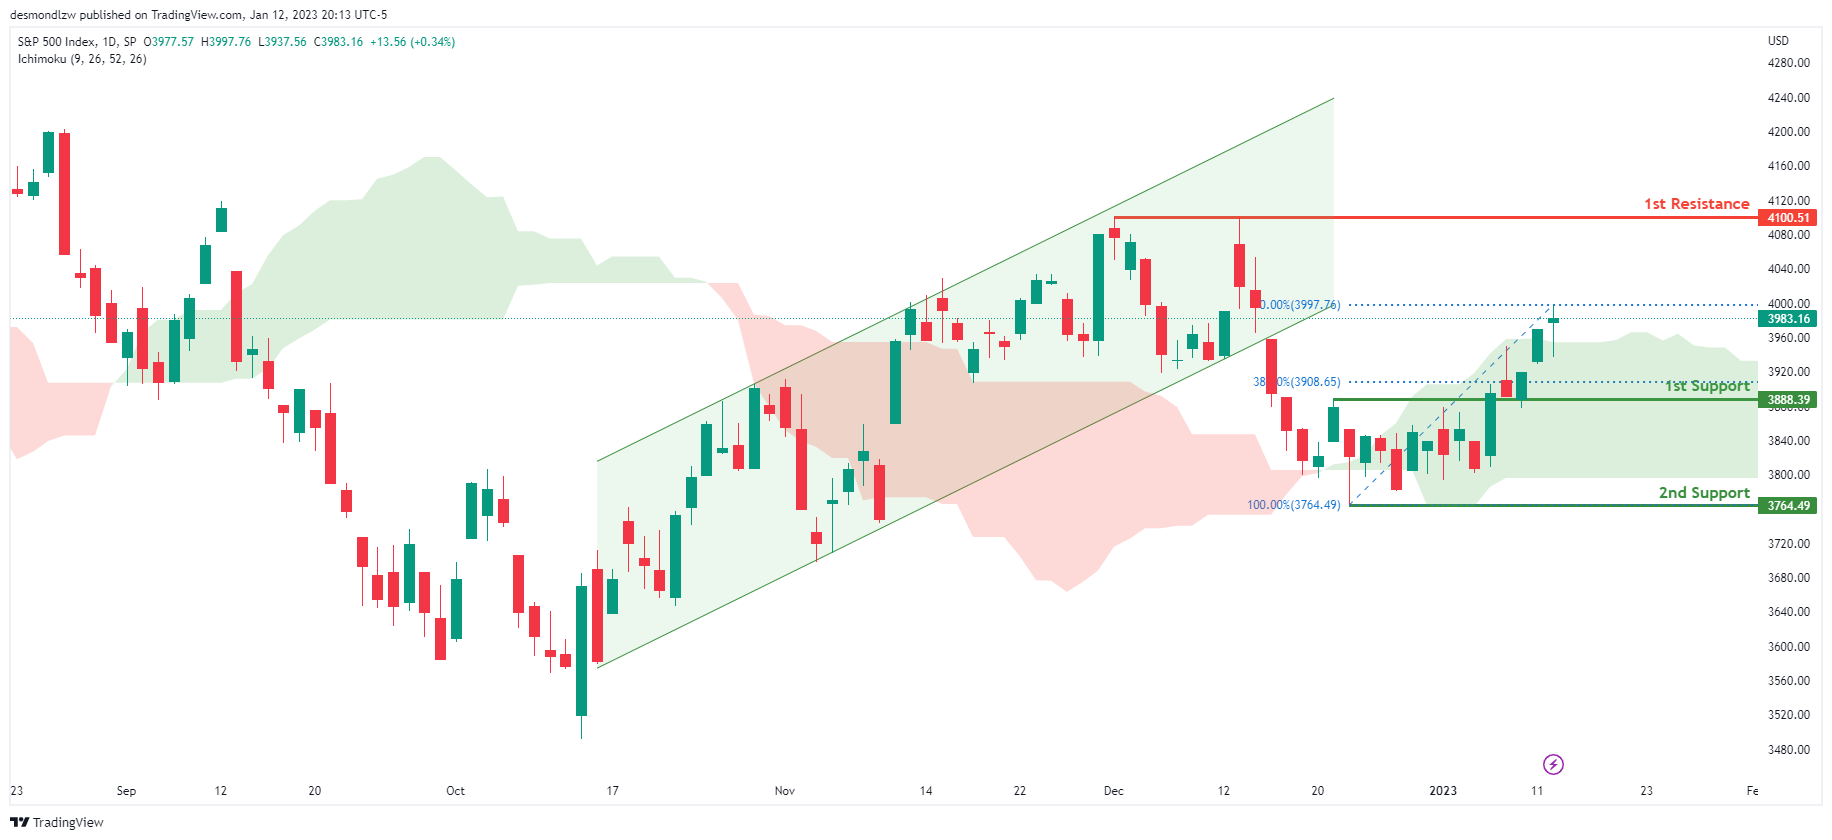
Looking at the H4 chart, my overall bias for S&P500 is bullish due to the current price being above the Ichimoku cloud, indicating a bullish market. If this bullish momentum continues, expect the price to continue heading towards the 1st resistance at 4100.51, where the previous high is. In an alternative scenario, price could possibly head back down to retest the 1st support at 3888.39, where the 38.2% Fibonacci line is.
Areas of consideration:
- H4 time frame, 1st support at 3888.39
- H4 time frame, 1st resistance at 4100.51
USD/CNH: Market Preparing for Bullish Growth in a New Wave
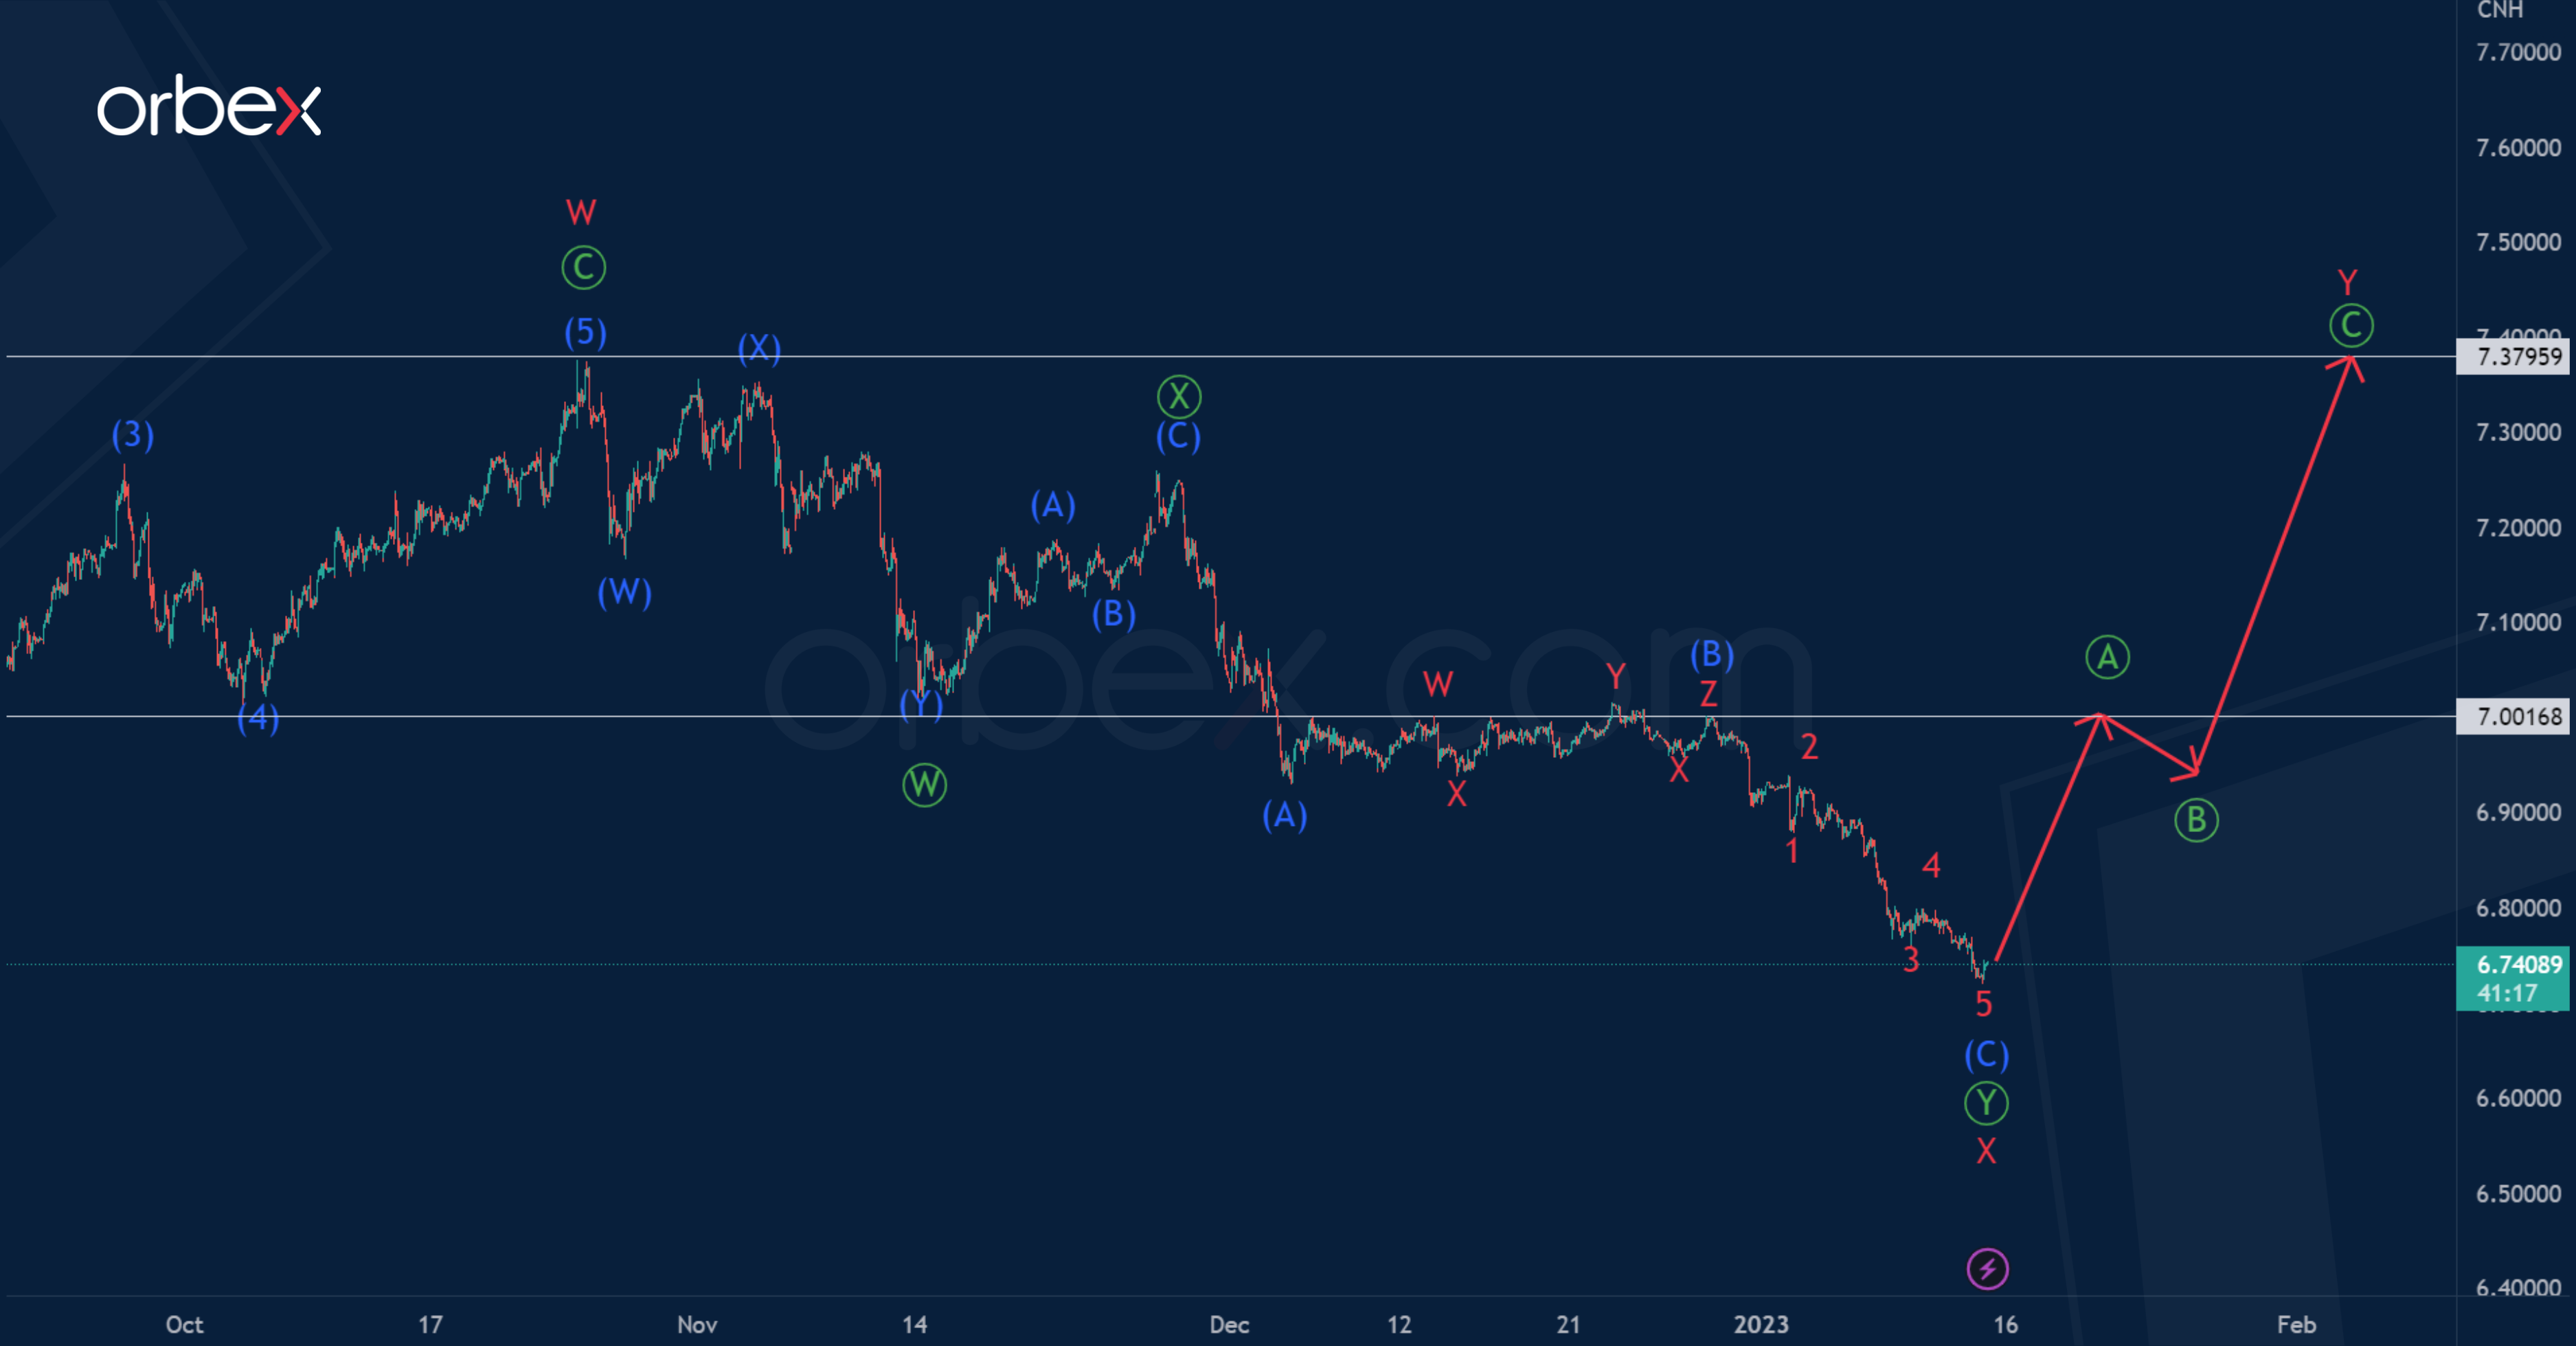
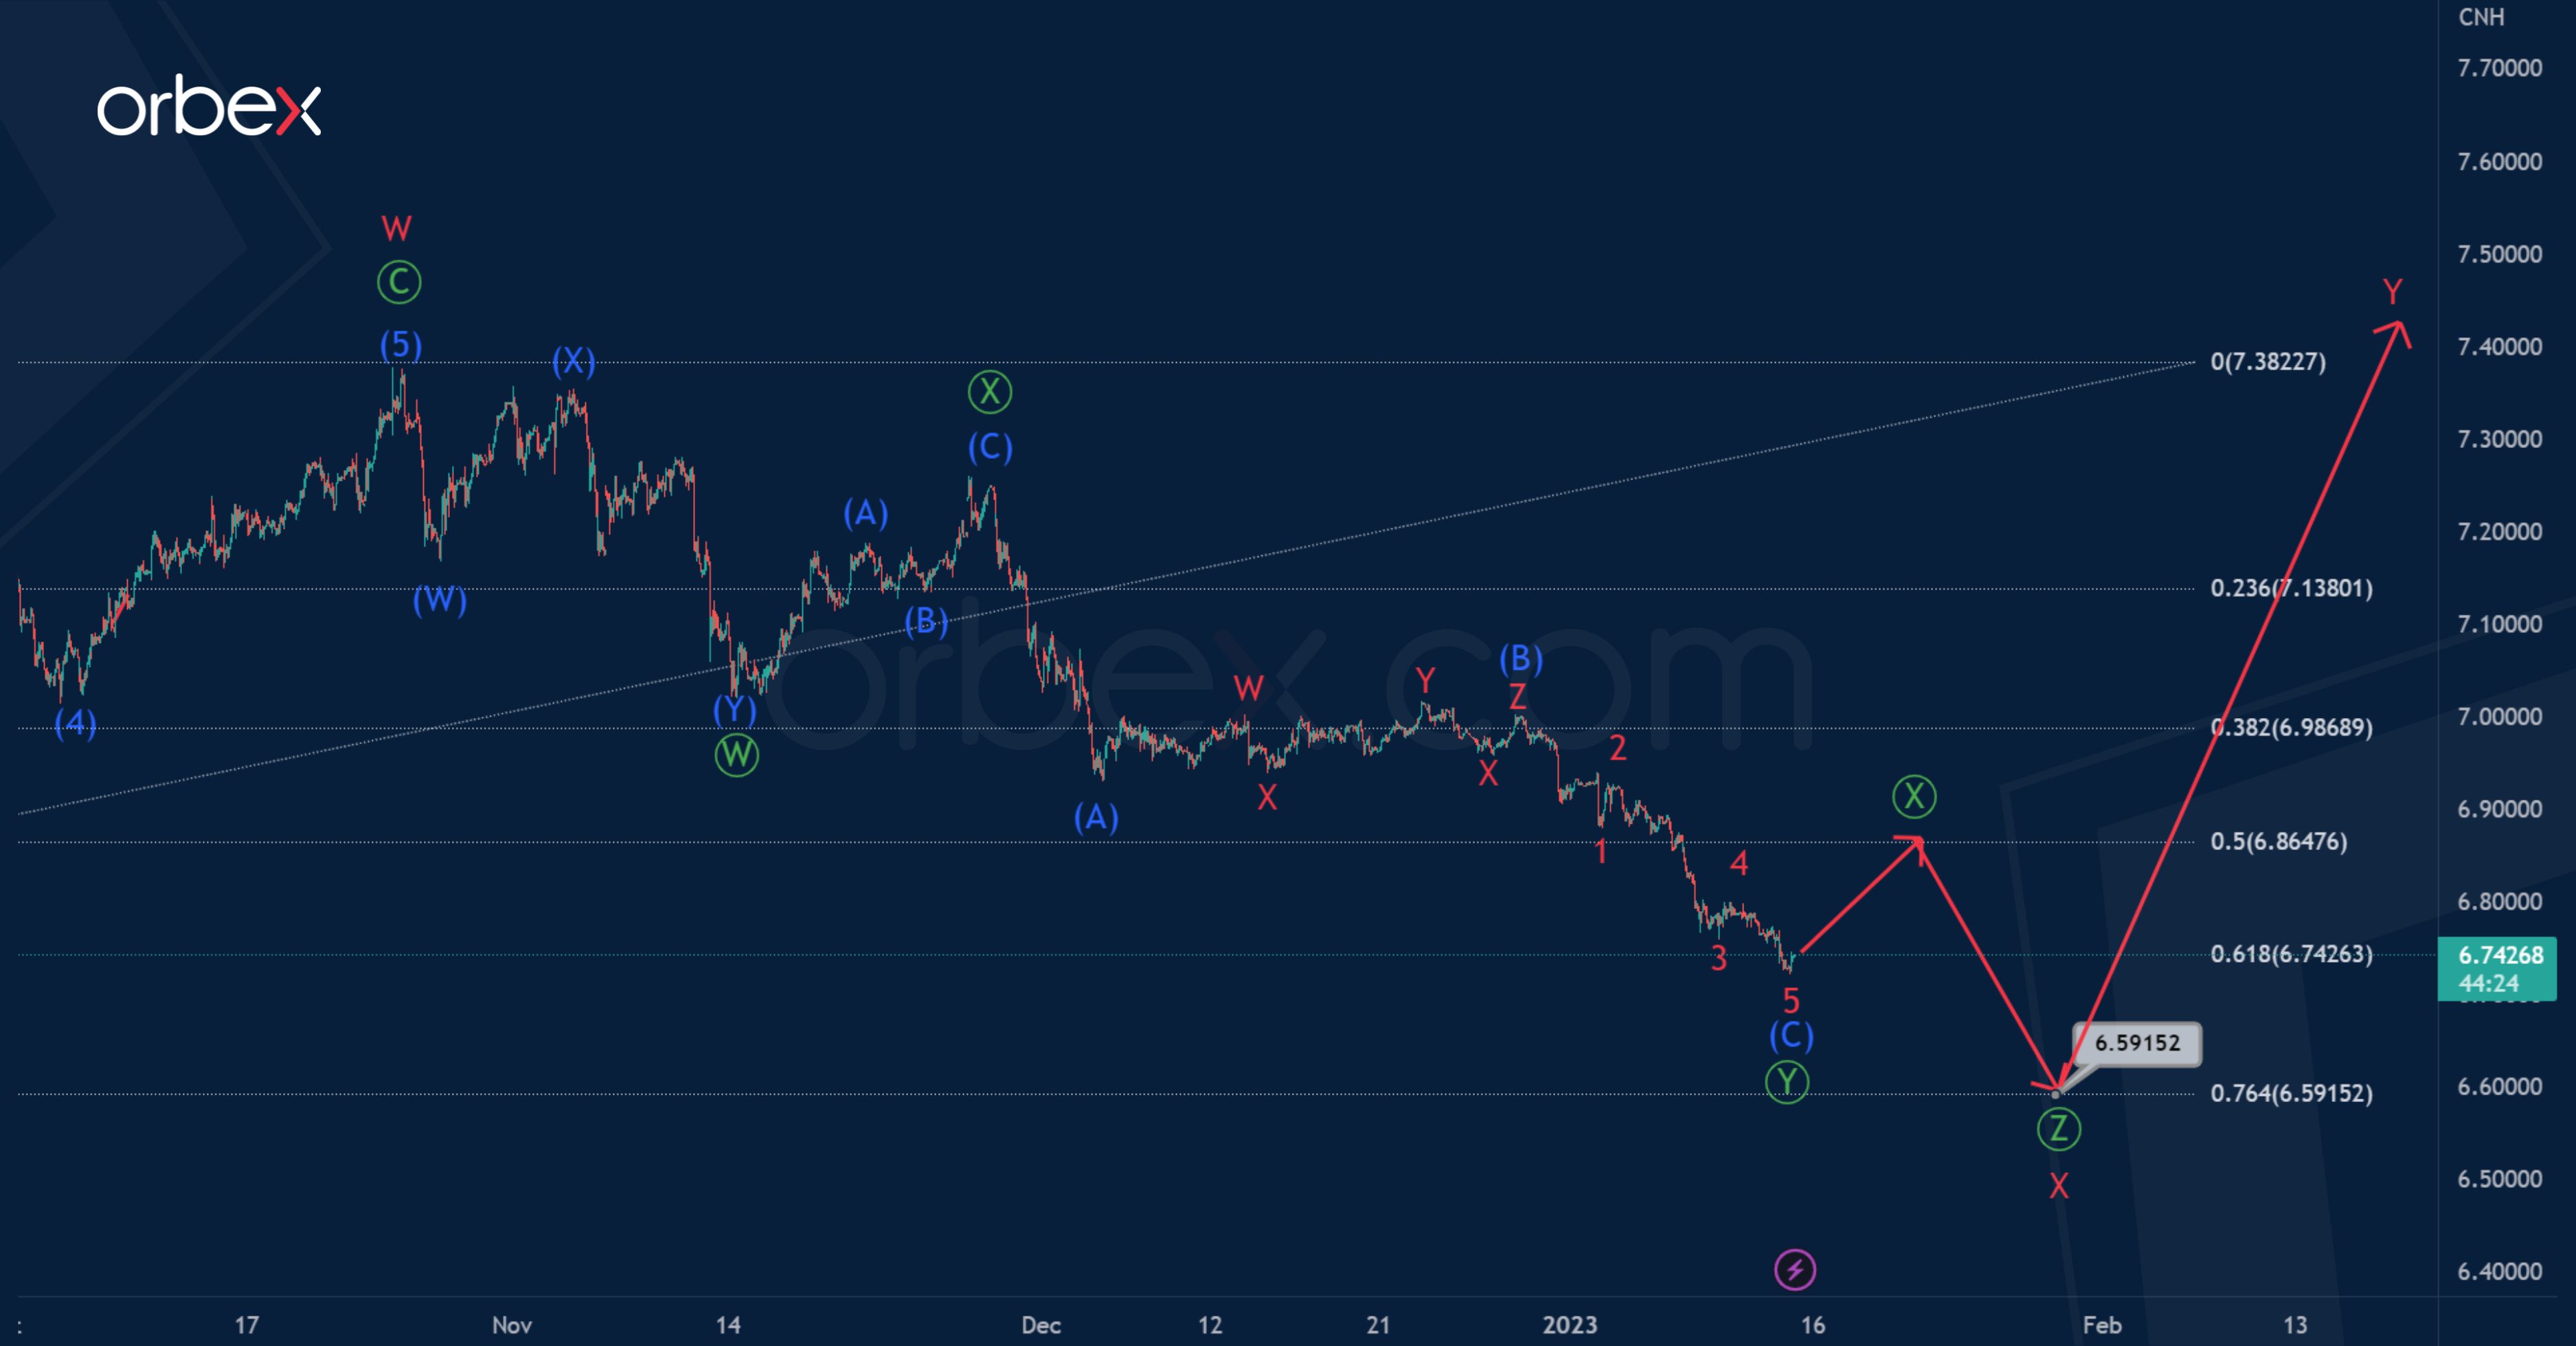
In the long term, the USDCNH pair is expected to form a large double zigzag consisting of three cycle sub-waves w-x-y.
The actionary wave w took the form of a standard zigzag. The bearish intervening wave x may be fully constructed, since at the moment it is completed by a double zigzag of the primary degree Ⓦ-Ⓧ-Ⓨ.
Thus, in the near future, market participants may expect bullish growth in the actionary wave y. Perhaps it will take the form of a standard zigzag Ⓐ-Ⓑ-Ⓒ.
Most likely, we will see the end of the first primary wave Ⓐ at the maximum of 7.00, or a little higher.
Let's consider an alternative scenario in which the price will move in a downtrend. Perhaps the cycle intervening wave x is not yet complete, most likely, it will take the form of a triple zigzag Ⓦ-Ⓧ-Ⓨ-Ⓧ-Ⓩ, not a double one.
If the actionary wave Ⓨ is completed, then a slight increase in the second intervening wave Ⓧ is expected in the near future, after which the fall can be continued in the final primary wave Ⓩ.
The approximate level to which the market may collapse is 6.591. It is determined using Fibonacci lines. At that level, wave x will be at 76.4% of wave w.
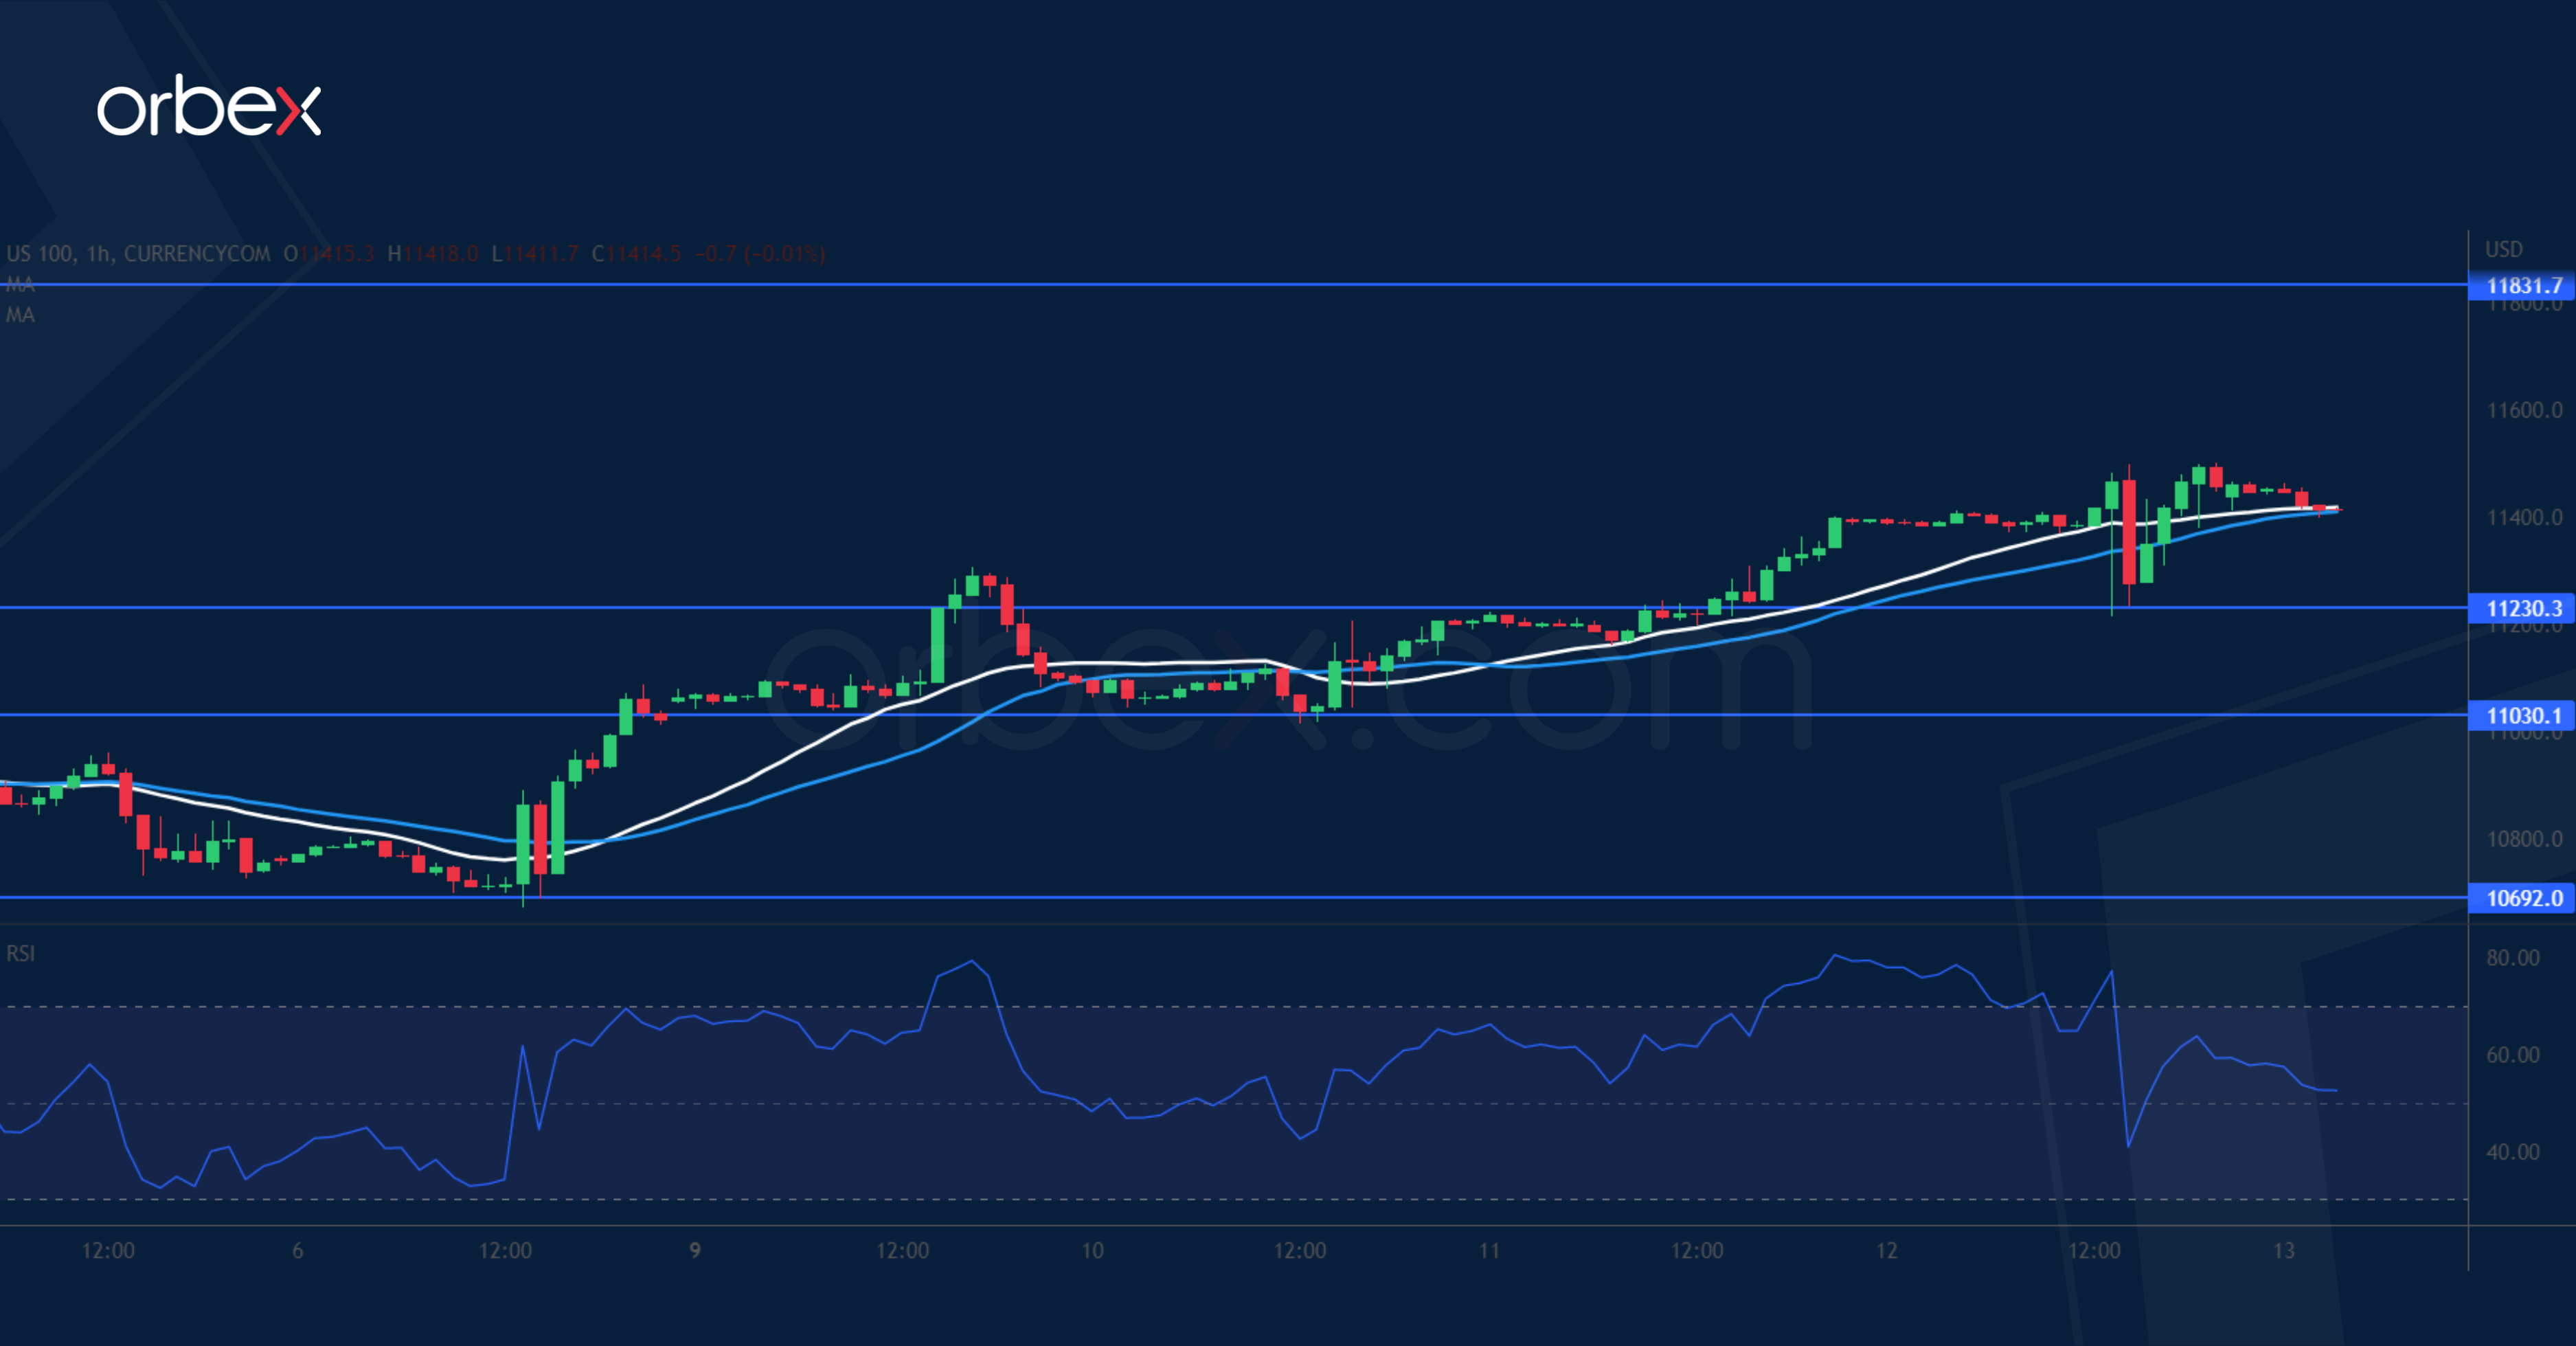
Nasdaq 100 Bounces Higher
The Nasdaq 100 popped higher after data showed that US inflation might have reversed its course. A break above 11280 prompted sellers to cover their positions, easing the downward pressure. After the index had a secure footing over 11030, the subsequent rally suggests that the bulls have taken over. A whipsaw above 11230 indicates solid support as buyers were fast to keep the price action afloat. The start of the liquidation back in mid-December at 11830 could be the next target when momentum buyers get involved.
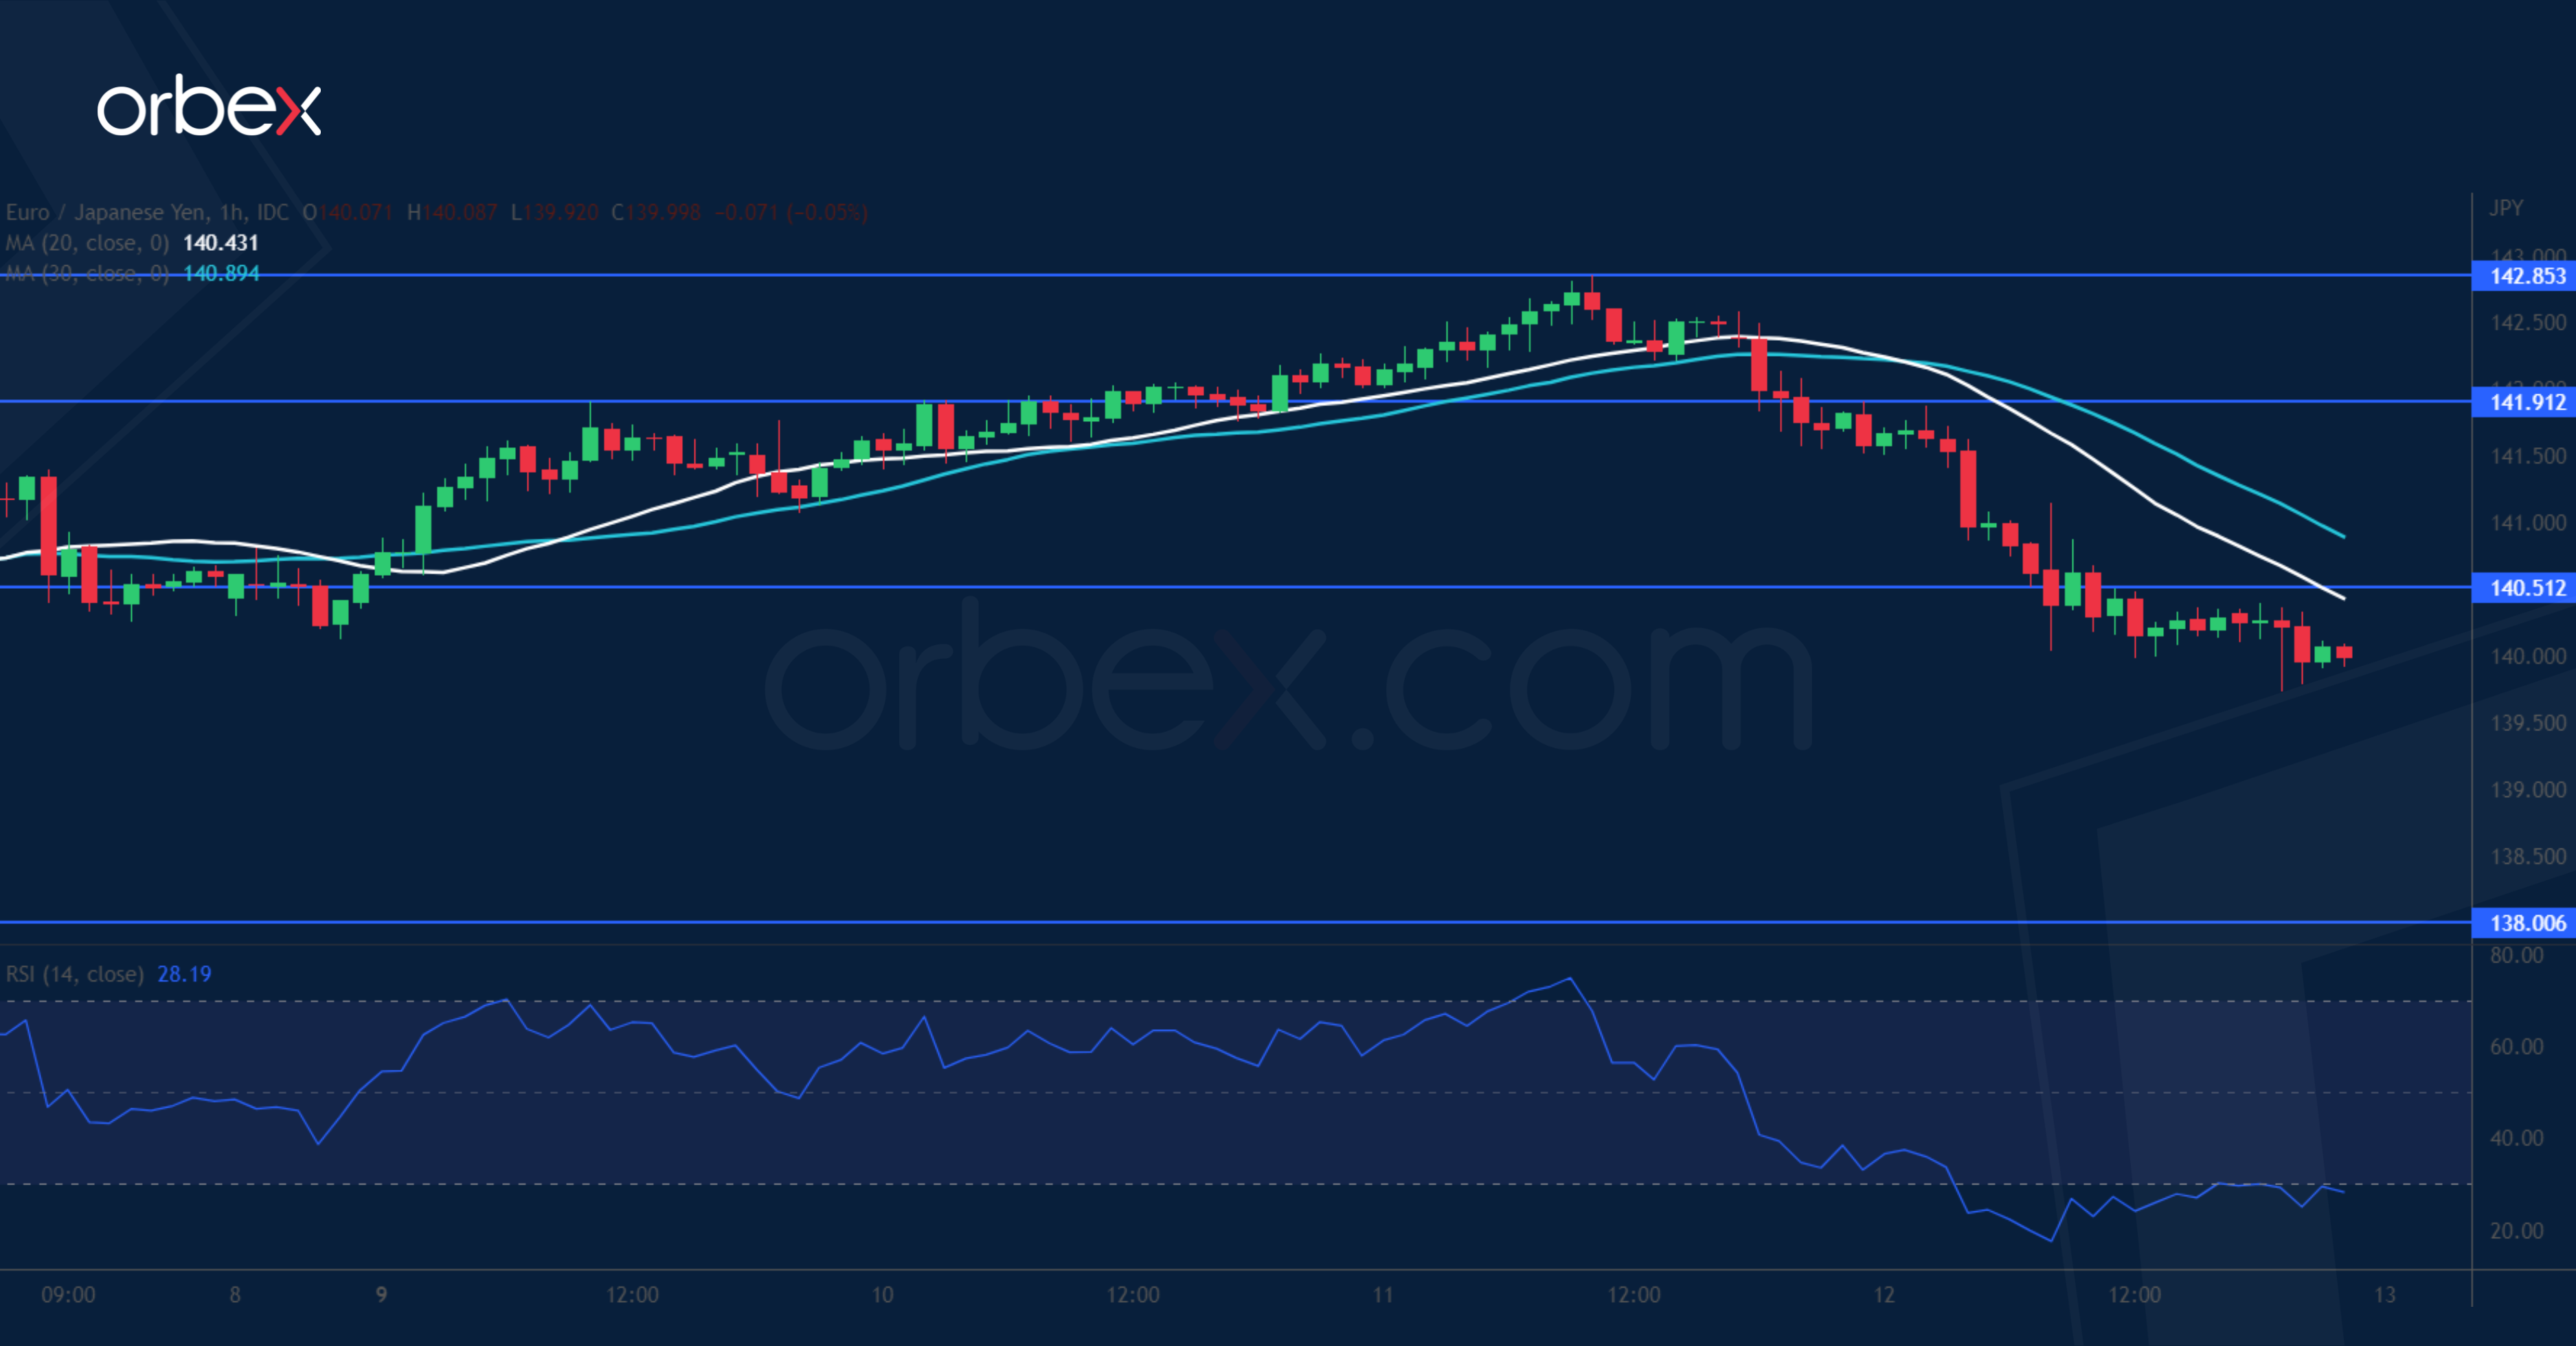
EUR/JPY Struggles for Support
The Japanese yen rallied on rumours that the BOJ would review the side effects of its monetary easing. The pair turned south after it failed to lift offers at the daily resistance 142.85. A drop below 141.80 prompted buyers to bail out, extending losses to previous swing lows around 140.00. A tentative break below this psychological level would indicate that the path of least resistance is down and cause a retest of 138.00. The RSI’s oversold condition may attract some buying interest, with 140.50 as the first resistance.
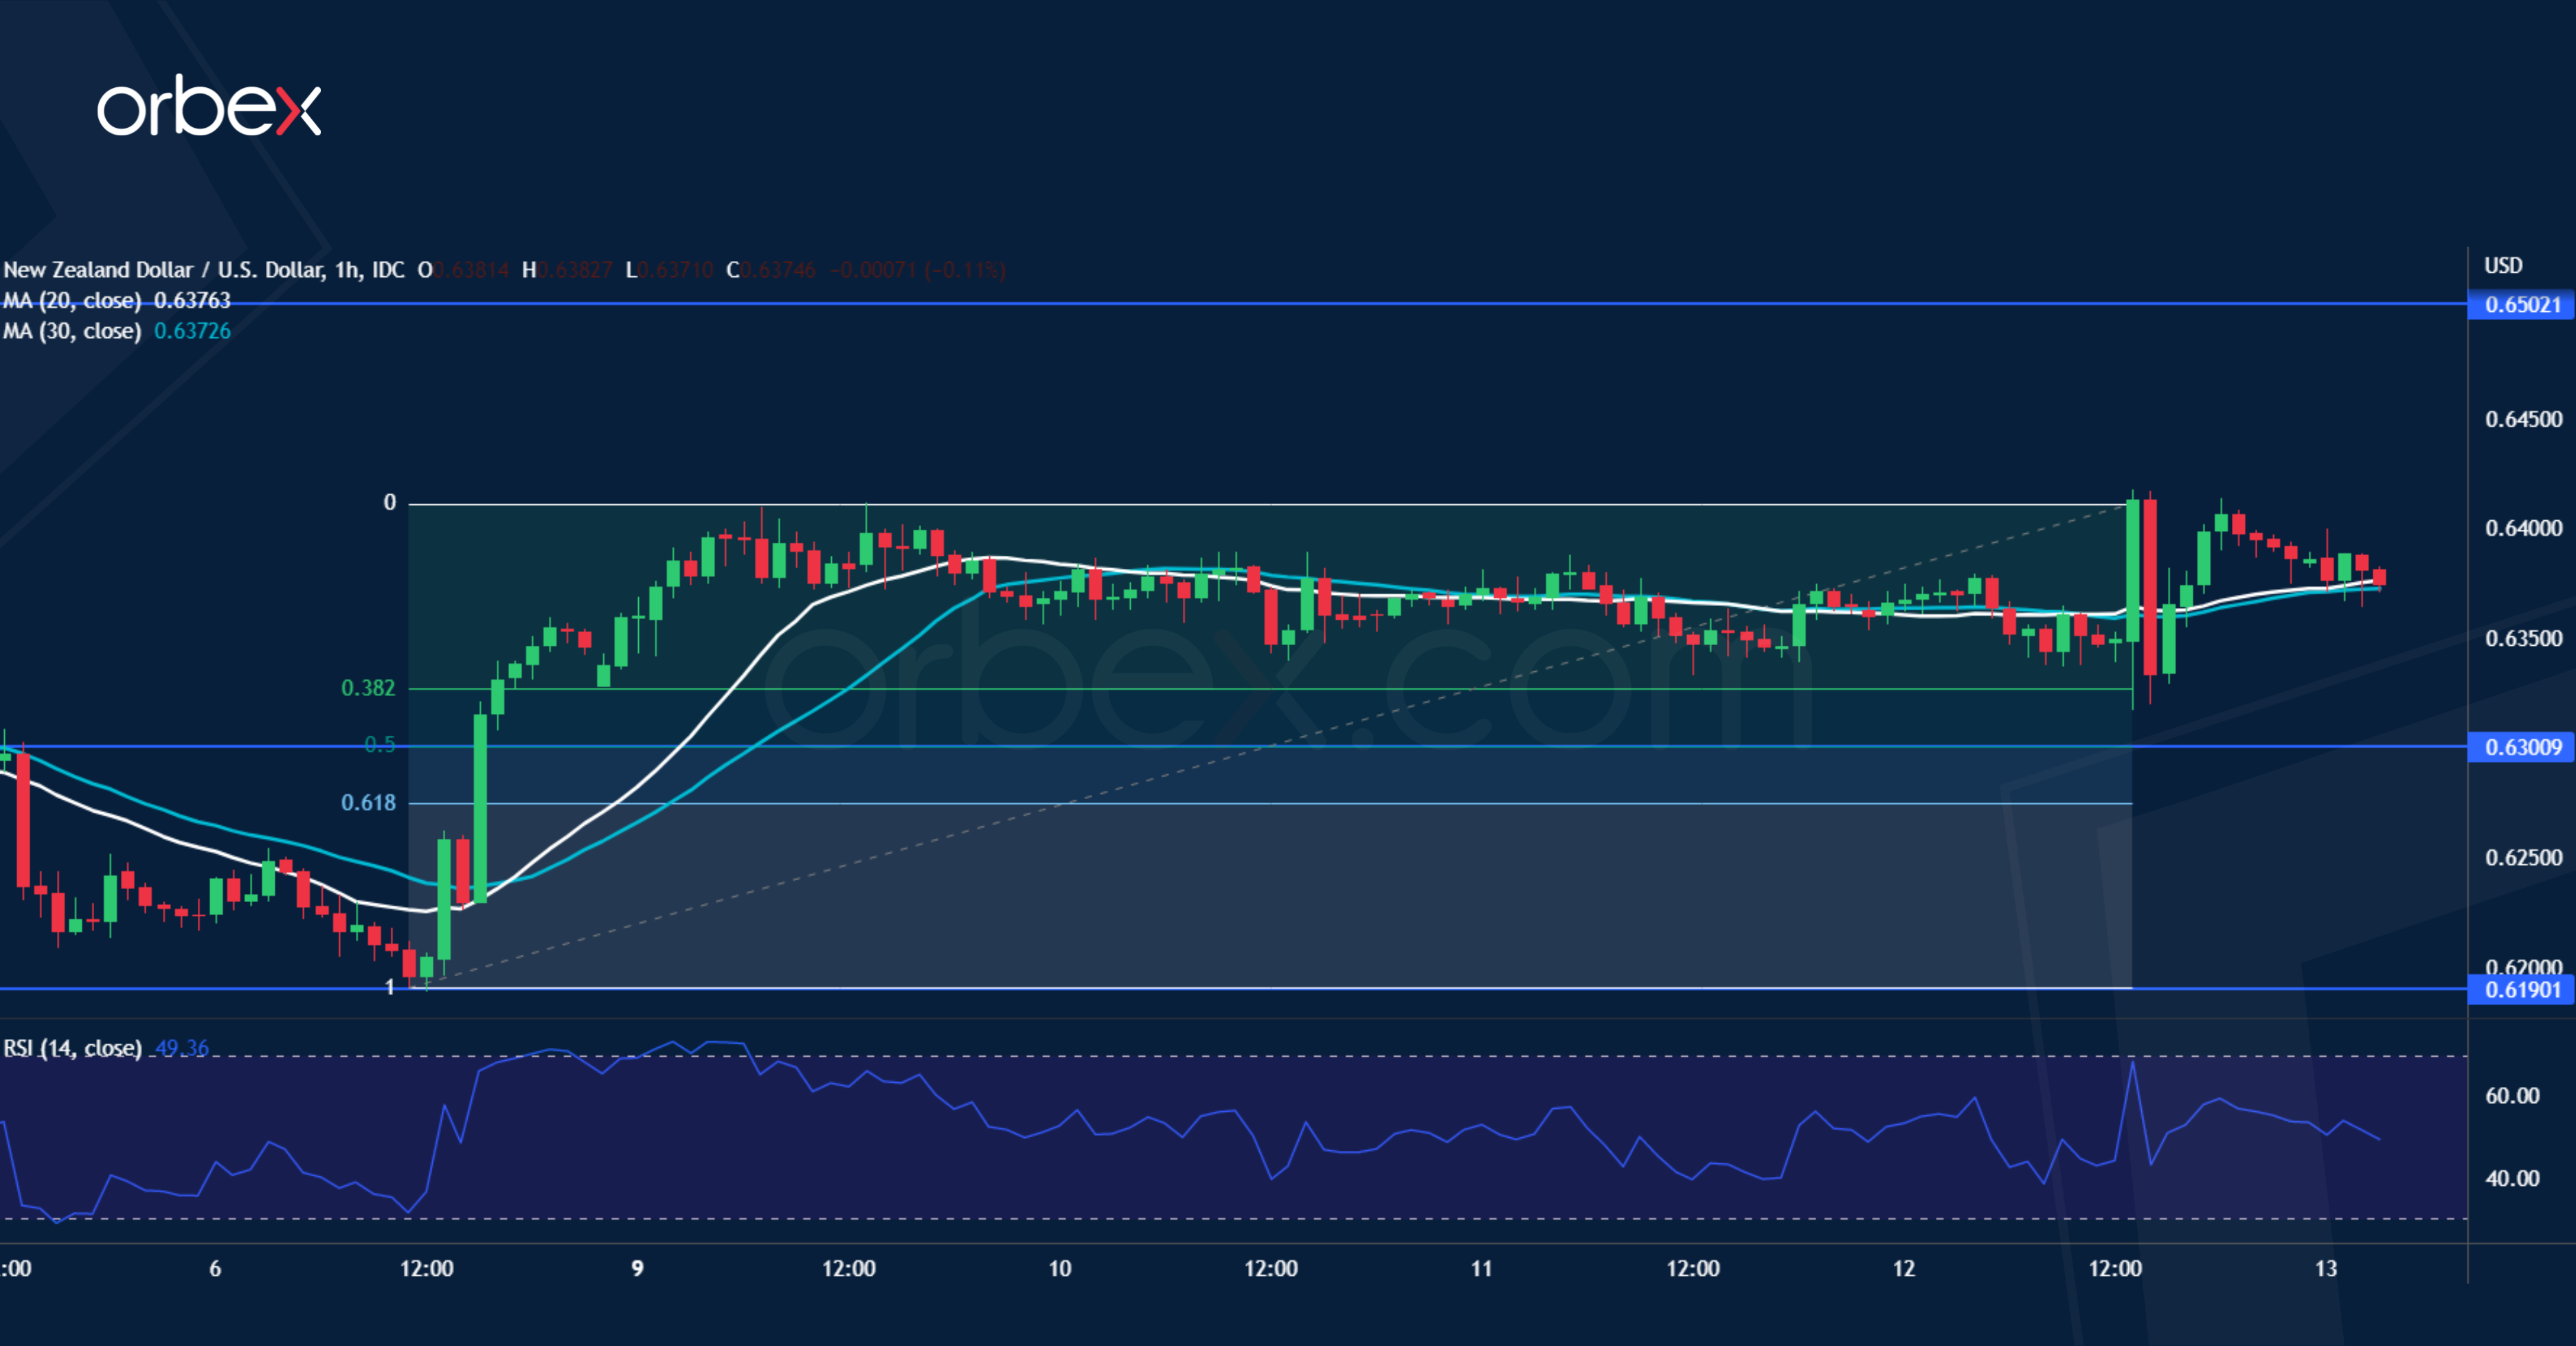
NZD/USD Extends Gains
The US dollar struggles as a slowing CPI foreshadows a dovish Fed. On the daily chart, the upward bias has remained intact after the kiwi bounced off 0.6190. The price then consolidated its gains after clearing the major supply zone around 0.6400. The 38.2% Fibonacci retracement level at 0.6330 coincides with a former swing high, making it a key level to find follow-up interest. The 50% level (0.6300) is a second layer of support. A close back above 0.6410 would open the door to the previous high at 0.6500.
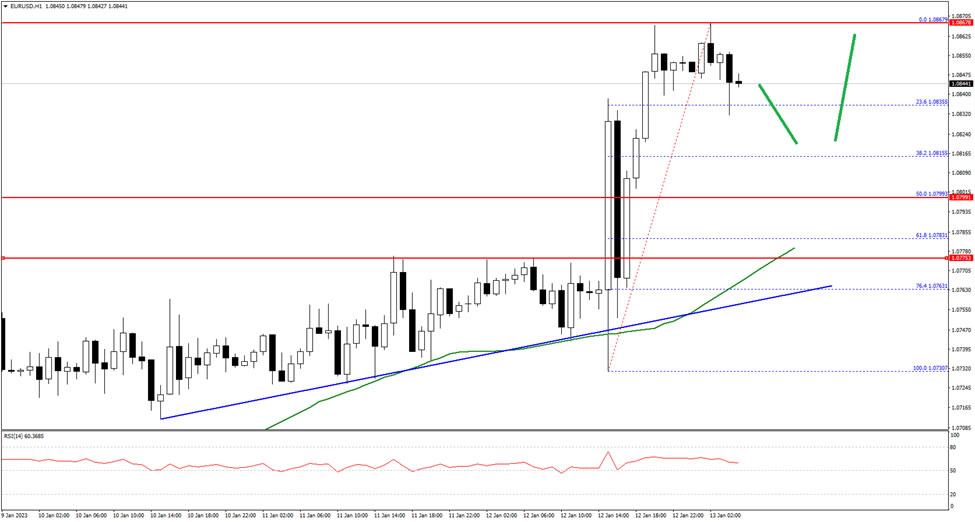
EUR/USD Pair is Consolidating Gains from 1.0867
The Euro started a fresh increase from the 1.0730 zone against the US Dollar. The EUR/USD pair gained pace above the 1.0750 to move into a positive zone.
The pair even traded above the 1.0800 level and the 50 hourly simple moving average. It traded as high as 1.0867 and is currently consolidating gains. An immediate resistance is near the 1.0865 level.
The first major resistance is near 1.0880 on FXOpen. A break above the 1.0880 resistance level could start another increase. In the stated case, it could rise towards the 1.0950 resistance.
Conversely, the pair might start another decline below 1.0820. The next key support is near 1.0800, below the pair could drop towards the 1.0760 level. Any more losses might send the pair towards the 1.0720 level in the near term.
ECB Kazaks: Core inflation currently a key gauge for inflation persistence
ECB Governing Council member Martins Kazaks pushed back on talks that the central bank would cut interest rates by the end of this year. He said he failed to see a "rationale" for that.
"It would take a deep recession with a sizeable jump in unemployment for inflation to sink and thus push for rate cuts," the Latvian central bank governor said. "But that is not likely, given the current macro outlook."
"It is possible for core inflation to continue trending up even as headline inflation is coming down, for instance, due to swings in energy prices," he said. "In my view, core inflation currently is a key gauge for inflation persistence and policy decisions."
He expects interest rate to rise "well into restrictive territory" but declined to estimate the terminal rate. "Uncertainty is too high, and we shall find it step-by-step," he said.
We’d Be Cautious to Bet on a Dollar Reversal Now
Markets
US December CPI was bang in line, coming in at 6.5% y/y (-0.1% m/m) in terms of headline and 5.7% (0.3% m/m) in the core gauge. Markets cheered as inflation momentum continued to slow even though the underlying, sticky price trend remains strong (services inflation at 0.6% m/m to 7.5% y/y, housing costs inflated by 0.7% m/m to 8.1% y/y). US yields dropped between 7.3 bps and 12.1 bps with the belly of the curve outperforming. A stellar $18bn 30y auction added to the leg lower. Critical technical levels in the 2y and 10y around 4.13% and 3.42% were tested but survived. We continue believe that markets are too optimistic about inflation returning to the 2% goal quickly, a view shared by the likes of Fed’s Bullard and Barkin who spoke after the CPI release. Either way, the numbers cemented the downshift by the Fed from a 50 bps tightening pace to 25 bps from early February on. Voting Fed member Harker joined Collins in arguing for such a move and we wouldn’t be surprised to see other calling for that in coming days too. European yields were sucked lower in the slipstream but in the end managed a close well off intraday lows. German bund yields lost 2.9-4.5 bps across the curve. The FX market was all about dollar weakness. DXY fell below the 2020 pandemic surge support (103) to close at 102.24, just below the 62% retracement of the 2022 rally. EUR/USD pushed through 1.0787 resistance for a close around 1.085. JPY-driven strength during the Asian session was accompanied by USD-weakness and brought USD/JPY to 129.25, the first close sub 130 since June. The EU and UK plan to take negotiations about the Northern Irish protocol to the final inning next week. Sterling was unable to profit though, with EUR/USD’s ascent filtering through in EUR/GBP as well. The pair surpassed recent highs/0.8867 resistance and is from a technical perspective headed to 0.90.
Japan’s 10y yield this morning breached through the BoJ’s 0.50% upper yield cap, forcing the central bank into more unscheduled bond buying. It is still the fall-out of a Japanese newspaper reporting yesterday that the central bank will consider more policy tweaks at the meeting next week. This is also what caused the yen surge yesterday and to a lesser extent today. USD/JPY extends its drop to 128.85 even as the dollar in general is slightly better bid after Thursday’s sell-off. EUR/USD stabilizes near yesterday’s close. From a daily perspective and going into the weekend, we’d be cautious to bet on a dollar reversal now, even if yesterday’s reaction looks like an exhaustion move (ever seen the market shift this much on figures that literally couldn’t be more spot on?!). The technical picture doesn’t help either. The next EUR/USD resistance is located at 1.0942. Same goes for US/core bond yields. We’re happy to see 2y and 10y support zones having survived but new tests are likely. Today’s eco calendar contains U. of Michigan consumer confidence and the unofficial (financial) kick-off of the earnings season. UK figures were due this morning. November industrial production disappointed but compared with slightly better figures for the services sector. In a first reaction, sterling doesn’t pick sides. EUR/GBP is trading just below 0.89.
News Headlines
The Bank of Korea raised its policy rate by another 25 bps rate hike to 3.50% this morning. Today’s rate hike brought the total amount of rate increases this cycle to a cumulative 300 bps. The move was largely expected. The BOK shifted to a more neutral guidance on the need for potential further rate increases. ’The board will judge whether the base rate needs to rise further while thoroughly assessing the economic downside risks and financial stability risks, the effect of base Rate raises, the pace of the inflation slowdown and monetary policy changes in major countries.’ Even so, the voting pattern showed that a further rate hike at next meeting isn’t evident. Korea CPI inflation printed at 5.0% Y/Y in December and governor Rhee expects to be around that level until February. The Korean won weakened mostly this morning after a recent rebound to currently trade near USD/KRW 1243.5.
According the China trade data published this morning, exports in dollar terms fell 9.9% compared to the same month last year. Imports dropped 7.5% Y/Y, resulting in a monthly trade surplus of $ 78 bln. Declines both of imports and exports were higher than the previous month, but still less deep than expected. For the whole of 2022 China both printed a record $3.6 trillion exports (+7%) and record trade surplus of $878 bln. A global slowdown and the focus of domestic policy to revive domestic growth might reduce the trade surplus further out in 2023. The yuan (USD/CNY 6.73) this morning, after a recent USD-driven rally, is holding little changed near recent peak levels.
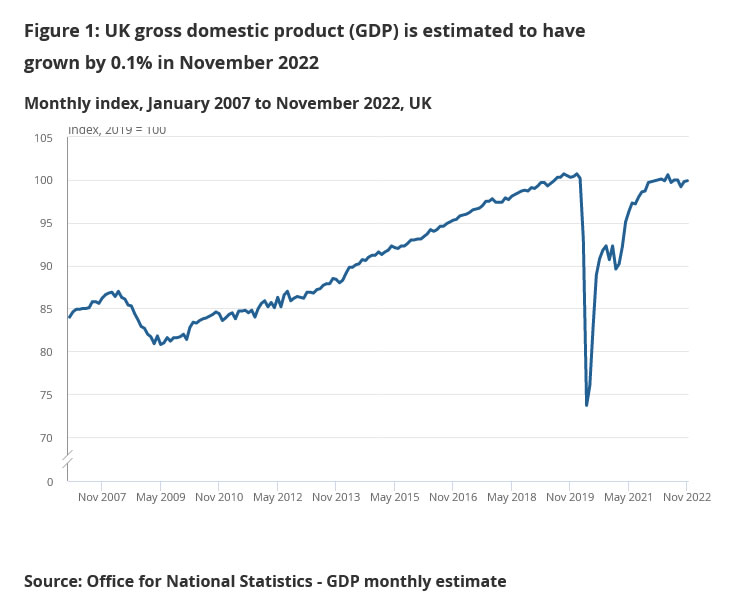
UK GDP grew 0.1% mom in Nov, avoided contraction
UK real GDP grew 0.1% mom in November, much better than expectation of -0.3% mom contraction. Services grew 0.2% mom. Production declined -0.2% mom. Construction was flat. Overall monthly GDP is -0.3% below its pre-pandemic levels.
In the three months to November, GDP fell -0.3% 3mo3mo. there was a -0.1% decline in Services, -1.4% decline in production, with the only growth coming from 0.3% in construction.
Also published, manufacturing production was down -0.5% mom, -5.9% yoy in November, versus expectation of -0.2% mom, -5.2% yoy. Industrial production was down -0.2% mom, -5.1% yoy, versus expectation of -0.1% mom, -2.8% yoy. Goods trade deficit widened to GBP -15.6B, versus expectation of GBP -14.9B.
Attention Shifts to US Bank Earnings
US inflation came in line with expectations. The kneejerk market reaction to the data was surprisingly negative, but the major US stock indices extended rally, while the US dollar dropped sharply.
Why was the kneejerk reaction bad?
Because investors were expecting nothing but a softer-than-expected figure; the hidden expectation was a read below 6.5% for the headline CPI, and a negative number for the monthly core CPI.
That didn’t happen.
Still, inflation eased. And it eased for the 6th straight month, from 9.1% in summer to 6.5% to the end of the year. During this time, the US jobs market remained tight. So, tight that the US economy added 4.5 million jobs in a year, and the unemployment rate fell to 3.5% in December.
Goldilocks?
We will see.
Looking closely into the data, services and food costs, which make inflation stickier and give a headache to the Fed rose; services inflation even soared to the highest levels since September 1982. That’s not good news.
Shelter inflation recorded its largest advance since 1990s. That’s also not great news – although it is said that shelter costs now overstate inflation and is the reason why core CPI accelerated on monthly basis, and there are some lag effects which would fade in the coming months.
Decline in energy prices, on the other hand, explained a part of the easing in inflation, thanks to lower gasoline prices, but energy, especially natural gas and electricity costs didn’t retreat. On the contrary, electricity prices rose nearly 15% over a year, while nat gas prices rose 20%!
This, to me, is the major risk to the future inflation prints, as the Chinese reopening should further boost energy prices, hence inflation in the coming months.
This is also why I don’t expect inflation to continue easing smoothly this year.
25bp is almost certain
All things said, the latest CPI update justifies a 25bp hike from the Federal Reserve (Fed) in February, although the tight jobs market will certainly make the rate hike discussion heated at the heart of the FOMC.
The market’s position is clear. Activity on Fed funds futures now assesses more than 95% chance for a 25bp hike.
The latter, however, doesn’t change the fact that the Fed will continue saying that they will push the rates above the 5% mark.
Whether investors believe them is a completely other story.
In numbers
Despite the negative kneejerk reaction, the S&P500 and Nasdaq both closed the day higher following CPI data in line with expectations.
The S&P500 ended the day 0.34% higher, and at a very important technical level: the index is now testing the ceiling of the 2022 bearish trend and the 200-DMA to the upside.
The 200-DMA has not been broken since April 2022, and has, so far, acted as a sign to sell the top. It could take more (…better-than-expected earnings) to clear resistance around 3990-4000 range.
Earnings expectations are low, but low expectations are easier to beat
According to FactSet, the S&P500 companies could post earnings growth of -4.1% for the Q4.
Energy companies and tech stocks are an exception to this, of course. Energy companies will likely reveal another excellent quarter due to high energy prices, while tech stocks will likely deliver their second straight quarter of negative growth, with a decent 9.5% contraction expected across the sector.
But don’t forget that high expectations are difficult to beat, while low expectations are easier to beat, and the prices move according to where the results fall compared to expectations.
Today, big US banks including JP Morgan, Citigroup, Bank of New York, Bank of America and Wells Fargo will reveal their Q4 results. The US financial sector is also expected to post negative earnings growth for last quarter.
Even higher interest rates are good for interest income, a too-rapid rise in the rates threatens credit quality, loan growth, and net interest margins.