Sample Category Title
GBP/USD Daily Outlook
Daily Pivots: (S1) 1.2119; (P) 1.2183; (R1) 1.2277; More...
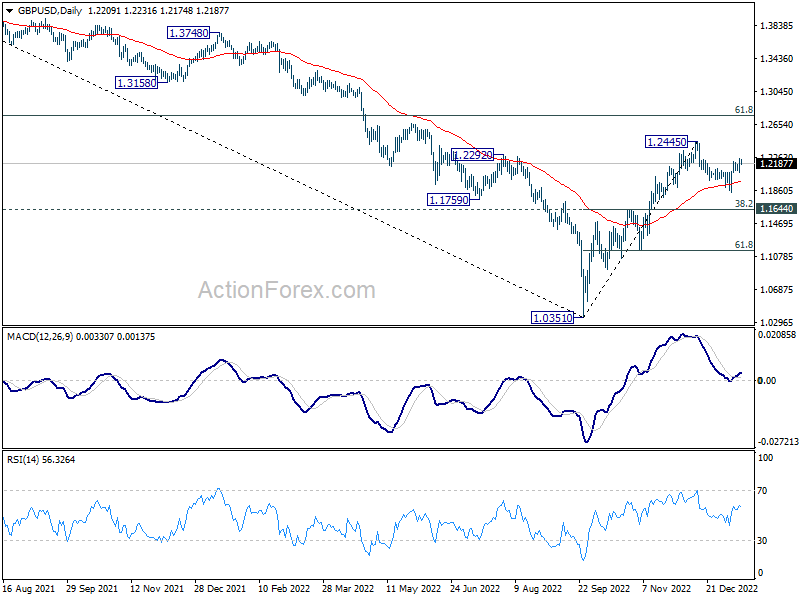
Intraday bias in GBP/USD stays mildly on the upside. Current rise from 1.1840 will target a test on 1.2445 high. Decisive break there will resume whole rally from 1.0351 to 1.2759 fibonacci level. On the downside, break of 1.2086 minor support will turn intraday bias neutral first. Break of 1.1840 will resume the correction from 1.2445 to 38.2% retracement of 1.0351 to 1.2445 at 1.1645.
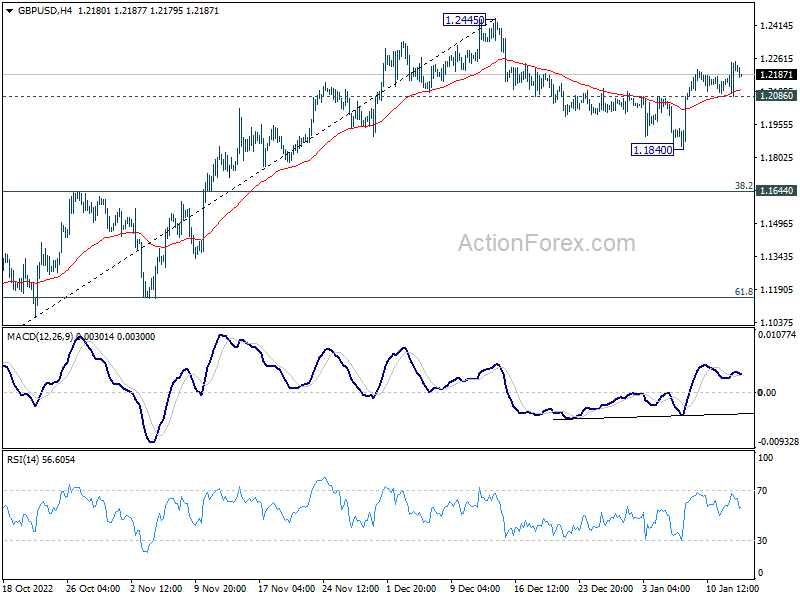
In the bigger picture, rise from 1.0351 medium term bottom is at least correcting whole down trend from 1.4248 (2021 high). Further rise is expected as long as 1.1644 resistance turned support holds. Next target is 61.8% retracement of 1.4248 to 1.0351 at 1.2759. Sustained break there will pave the way back to 1.4248.
USD/CHF Daily Outlook
Daily Pivots: (S1) 0.9239; (P) 0.9300; (R1) 0.9333; More...
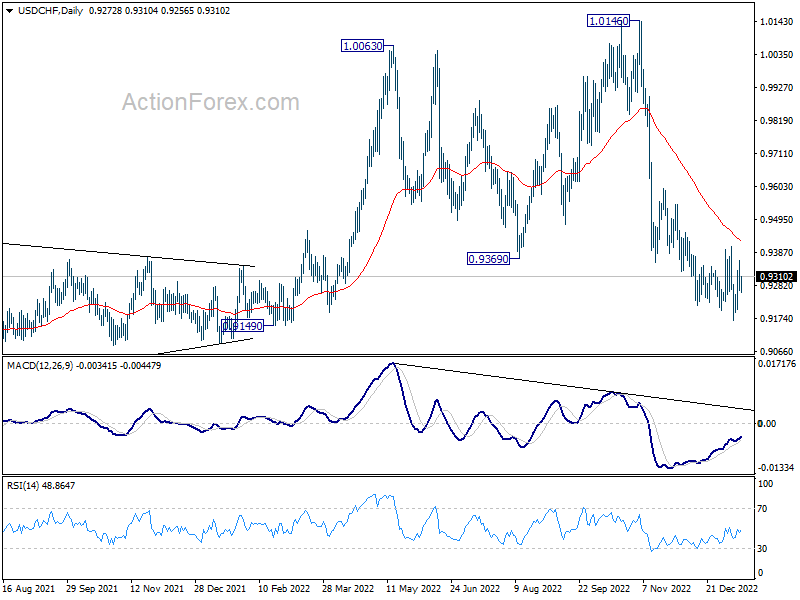
Intraday bias in USD/CHF remains neutral as range trading continues. Further decline is still in favor as long as 0.9407 resistance holds. Break of 0.9165 will resume whole fall from 1.0146. However, firm break of 0.9407 will turn bias back to the upside for strong rebound.
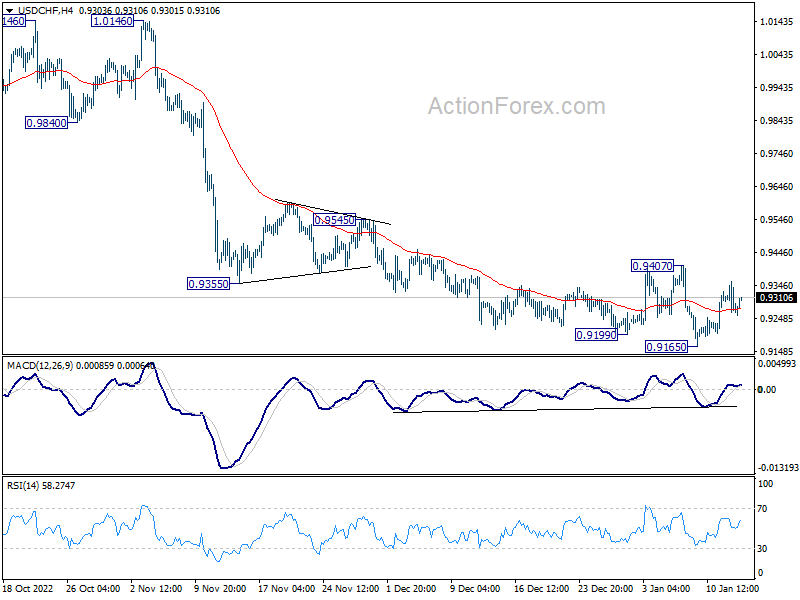
In the bigger picture, rise from 0.8756 (2021 low) has completed at 1.0146, well ahead of 1.0342 long term resistance (2016 high). Based on current downside momentum, fall from 1.0146 should be a medium term down trend itself. Next target is a test on 0.8756 low. Strong support should be seen there to bring rebound. Still, further decline will now be expected as long as 0.9407 resistance holds, in any case.
USD/JPY Daily Outlook
Daily Pivots: (S1) 127.96; (P) 130.24; (R1) 131.60; More...
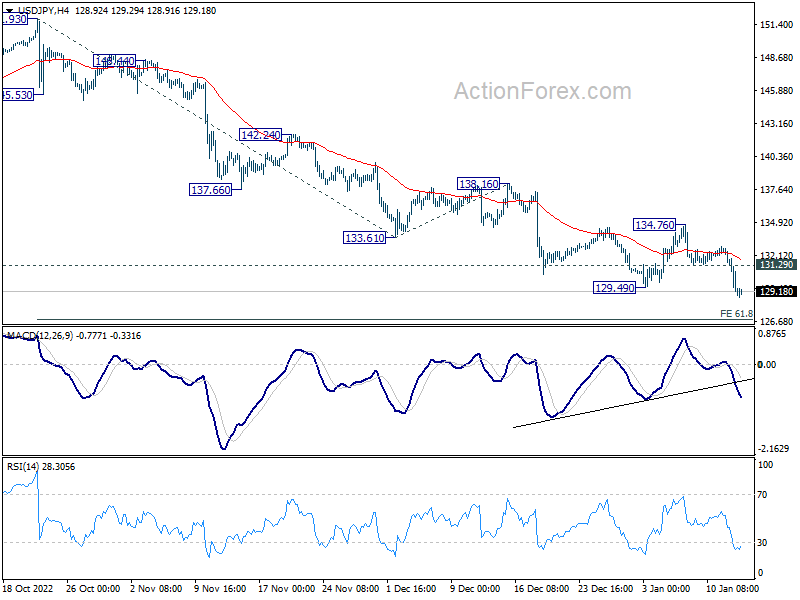
USD/JPY's decline from 151.93 resumed by breaking through 129.49 support. Intraday bias is back on the downside for 61.8% projection of 151.93 to 133.61 from 138.16 at 126.83 next. On the upside, above 131.29 minor resistance will turn intraday bias neutral first. But outlook will remain bearish as long as 134.76 resistance holds, in case of recovery.
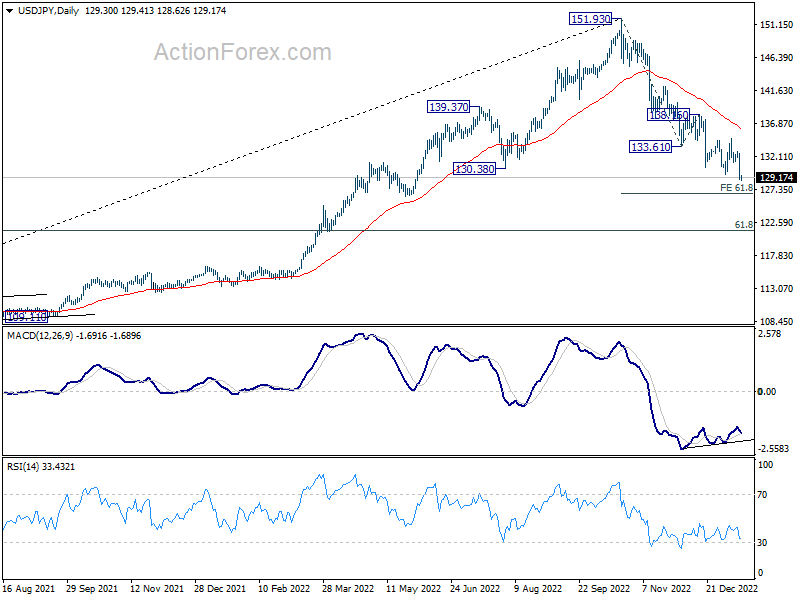
In the bigger picture, a medium term top was in place at 151.93. Sustained trading below 55 week EMA (now at 131.73) would raise the chance of bearish trend reversal. Deeper fall would be seen to 61.8% retracement of 102.58 to 151.93 at 121.43. This will now remain the favored case as long as 55 day EMA (now at 136.06) holds.
Yen Rallies on Narrowing Yield gaps, Dollar Recovering Slightly Elsewhere
While Dollar was sold off overnight, the decline was less severe than originally expected. Indeed, the greenback is currently just the second worst performer for the week, following Swiss Franc. The rally in commodity currencies was also less than convincing with Kiwi and Loonie as third and fourth weakest. Yen is currently the strongest, with help from narrowing yield gap. Euro, is next strongest while Sterling and Aussie are mixed.
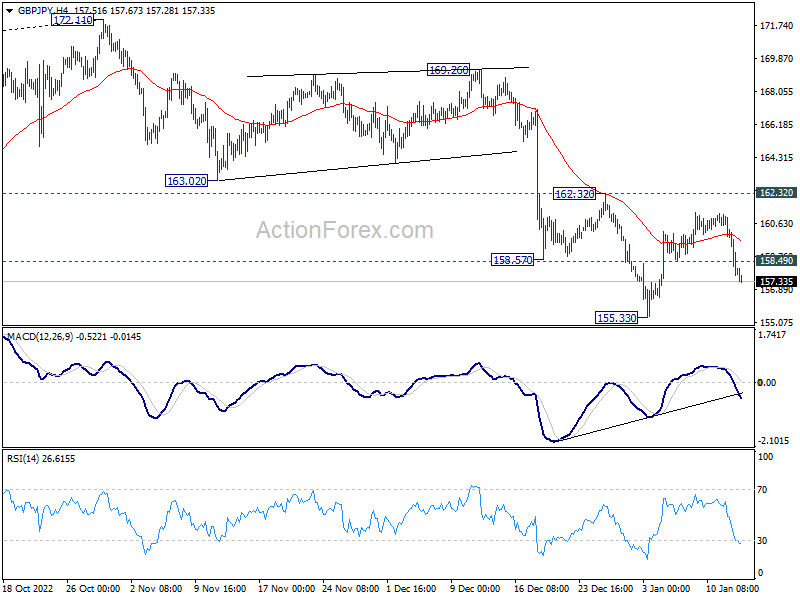
Technically, USD/JPY's break of 129.49 support indicates resumption of the decline from 151.39. Development in EUR/JPY and GBP/JPY also suggest that near term rebounds have completed, and retest of 137.37 and 155.33 could be seen next. Similarly, CAD/JPY could revisit 95.38 soon and AUD/JPY could follow and head back to 87.00.
In Asia, at the time of writing, Nikkei is down -1.15%. Hong Kong HSI is flat. China Shanghai SSE is up 0.47%. Singapore Strait Times is up 0.27%. Japan 10-year JGB yield is up 0.008 at 0.513. Overnight, DOW rose 0.64%. S&P 500 rose 0.34%. NASDAQ rose 0.64%. 10-year yield dropped -0.105 to 3.449.
Fed Bullard prefers getting rates above 5% asap
St. Louis Fed President James Bullard said yesterday that it's "encouraging" that inflation "went in the right direction." "So far, so good. My bottom line for 2023 is that it will be a year of disinflation," he said". Yet, he emphasized his preference is still to get interest rate to above 5% "as soon as possible".
"There's probably too much optimism inflation is going to easily come back to 2%. That is not the history of inflation," Bullard said, "We are really moving into an era of higher nominal interest rates for quite a while going forward as we try to continue to put downward pressure."
Sepataely, Atlanta Fed president Raphael Bostic told CBS that the December inflation data was "welcome news." "It really suggests inflation is moderating and that gives me some comfort that we might be able to move more slowly," he said.
Fed Barkin: Inflation to be more persistent than a simple drop to 2%
Richmond Fed president Tom Barkin said he was "in concept supportive of a path that is slower but longer and potentially higher" depending on how inflation behaves.
But he cautioned that while the average inflation dropped, "the median stayed high. He said. "That's because the average was distorted by declining prices for goods like used cars that escalated unsustainably during the pandemic."
Regarding the median inflation rate, "if the center of the distribution remains above our target, then I think we should continue to move rates," he said. "Inflation is going to be more persistent than a simple drop down to 2%."
BoE Mann: Bringing inflation down may require a significant recession
BoE MPC member Catherine Mann said yesterday that she's "worrying about... underlying inflation dynamic looks pretty robust right now." She explained that past rises in energy prices and other inflationary pressures are getting passed through higher prices of other goods and services.
"Our job is to bring that back to 2%." She added that may require a "significant recession". But, "getting inflation expectations under control, keeping them under control, is important."
"Nobody likes to have higher interest rates. but nobody likes to have double digit inflation either," Mann said.
China export plunged -9.9% yoy in Dec, imports dropped -7.5% yoy
China exports plunged -9.9% yoy in December in USD terms, worst drop since February 2020, but slightly better than expectation of -10.0% yoy. Imports fell -7.5% yoy, better than expectation of -9.8% yoy. Trade surplus widened from USD 69.8B to USD 78.0B, slightly above expectation of USD 77.9B.
In CNY term, exports declined -0.5% yoy while imports rose 2.2% yoy. Trade surplus widened from CNY 494B to CNY 550B, above expectation of USD 533B.
For 2022 as a whole, in US term, exports rose 7.2%, much worse than 2021's 29.6%. Imports rose 1.1%, down sharply from 2021'xs 30.0%.
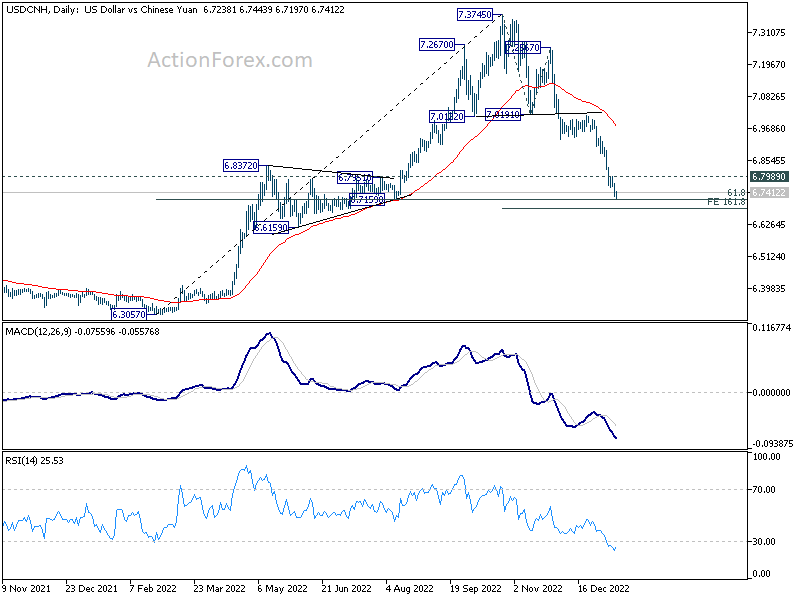
USD/CNH extended the decline from 7.3745 this week on Dollar's broad based selloff. Nevertheless, it's sitting close to an important support zone around 6.7159 (61.8% retracement of 6.3057 to 7.3745 at 6.7140). Considering oversold condition in daily RSI, a rebound should be due. Break of 6.7989 resistance will indicate short term bottoming, and bring rebound. But considering that the falling 55 day is now at around 6.9768, there is little prospect for the rebound to break through 7 handle for now.
Looking ahead
UK GDP, production and goods trade balance are the main focus in European session. Eurozone will also release trade balance and industrial production. Later in the day, US will publish import price index and Michigan consumer sentiment.
USD/JPY Daily Outlook
Daily Pivots: (S1) 127.96; (P) 130.24; (R1) 131.60; More...
USD/JPY's decline from 151.93 resumed by breaking through 129.49 support. Intraday bias is back on the downside for 61.8% projection of 151.93 to 133.61 from 138.16 at 126.83 next. On the upside, above 131.29 minor resistance will turn intraday bias neutral first. But outlook will remain bearish as long as 134.76 resistance holds, in case of recovery.
In the bigger picture, a medium term top was in place at 151.93. Sustained trading below 55 week EMA (now at 131.73) would raise the chance of bearish trend reversal. Deeper fall would be seen to 61.8% retracement of 102.58 to 151.93 at 121.43. This will now remain the favored case as long as 55 day EMA (now at 136.06) holds.
Economic Indicators Update
| GMT | Ccy | Events | Actual | Forecast | Previous | Revised |
|---|---|---|---|---|---|---|
| 23:50 | JPY | Money Supply M2+CD Y/Y Dec | 2.90% | 3.30% | 3.10% | |
| 03:20 | CNY | Trade Balance (USD) Dec | 78.0B | 77.9B | 69.8B | |
| 03:20 | CNY | Exports (USD) Y/Y Dec | -9.90% | -10% | -8.70% | |
| 03:20 | CNY | Imports (USD) Y/Y Dec | -7.50% | -9.80% | -10.60% | |
| 03:20 | CNY | Trade Balance (CNY) Dec | 550B | 533B | 494B | |
| 03:20 | CNY | Exports (CNY) Y/Y Dec | -0.50% | 0.90% | ||
| 03:20 | CNY | Imports (CNY) Y/Y Dec | 2.20% | -1.10% | ||
| 07:00 | GBP | GDP M/M Nov | -0.30% | 0.50% | ||
| 07:00 | GBP | Index of Services 3M/3M Nov | -0.40% | -0.10% | ||
| 07:00 | GBP | Manufacturing Production M/M Nov | -0.20% | 0.70% | ||
| 07:00 | GBP | Manufacturing Production Y/Y Nov | -5.20% | -4.60% | ||
| 07:00 | GBP | Industrial Production Y/Y Nov | -2.80% | -2.40% | ||
| 07:00 | GBP | Industrial Production M/M Nov | -0.10% | 0.00% | ||
| 07:00 | GBP | Goods Trade Balance (GBP) Nov | -14.9B | -14.5B | ||
| 09:00 | EUR | Italy Industrial Output M/M Nov | 0.40% | -1.00% | ||
| 10:00 | EUR | Eurozone Trade Balance (EUR) Nov | -20.0B | -28.3B | ||
| 10:00 | EUR | Eurozone Industrial Production M/M Nov | 0.60% | -2.00% | ||
| 12:00 | GBP | NIESR GDP Estimate (3M) Dec | -0.30% | |||
| 13:30 | USD | Import Price Index M/M Dec | -0.90% | -0.60% | ||
| 15:00 | USD | Michigan Consumer Sentiment Index Jan P | 61.6 | 59.7 |
China export plunged -9.9% yoy in Dec, imports dropped -7.5% yoy
China exports plunged -9.9% yoy in December in USD terms, worst drop since February 2020, but slightly better than expectation of -10.0% yoy. Imports fell -7.5% yoy, better than expectation of -9.8% yoy. Trade surplus widened from USD 69.8B to USD 78.0B, slightly above expectation of USD 77.9B.
In CNY term, exports declined -0.5% yoy while imports rose 2.2% yoy. Trade surplus widened from CNY 494B to CNY 550B, above expectation of USD 533B.
For 2022 as a whole, in US term, exports rose 7.2%, much worse than 2021's 29.6%. Imports rose 1.1%, down sharply from 2021'xs 30.0%.
USD/CNH extended the decline from 7.3745 this week on Dollar's broad based selloff. Nevertheless, it's sitting close to an important support zone around 6.7159 (61.8% retracement of 6.3057 to 7.3745 at 6.7140). Considering oversold condition in daily RSI, a rebound should be due. Break of 6.7989 resistance will indicate short term bottoming, and bring rebound. But considering that the falling 55 day is now at around 6.9768, there is little prospect for the rebound to break through 7 handle for now.
BoE Mann: Bringing inflation down may require a significant recession
BoE MPC member Catherine Mann said yesterday that she's "worrying about... underlying inflation dynamic looks pretty robust right now." She explained that past rises in energy prices and other inflationary pressures are getting passed through higher prices of other goods and services.
"Our job is to bring that back to 2%." She added that may require a "significant recession". But, "getting inflation expectations under control, keeping them under control, is important."
"Nobody likes to have higher interest rates. but nobody likes to have double digit inflation either," Mann said.
Fed Barkin: Inflation to be more persistent than a simple drop to 2%
Richmond Fed president Tom Barkin said he was "in concept supportive of a path that is slower but longer and potentially higher" depending on how inflation behaves.
But he cautioned that while the average inflation dropped, "the median stayed high. He said. "That's because the average was distorted by declining prices for goods like used cars that escalated unsustainably during the pandemic."
Regarding the median inflation rate, "if the center of the distribution remains above our target, then I think we should continue to move rates," he said. "Inflation is going to be more persistent than a simple drop down to 2%."
Fed Bullard prefers getting rates above 5% asap
St. Louis Fed President James Bullard said yesterday that it's "encouraging" that inflation "went in the right direction." "So far, so good. My bottom line for 2023 is that it will be a year of disinflation," he said". Yet, he emphasized his preference is still to get interest rate to above 5% "as soon as possible".
"There's probably too much optimism inflation is going to easily come back to 2%. That is not the history of inflation," Bullard said, "We are really moving into an era of higher nominal interest rates for quite a while going forward as we try to continue to put downward pressure."
USD/JPY Nosedives and At Risk of More Downsides
Key Highlights
- USD/JPY started a fresh decline from the 134.80 resistance.
- It traded below a key bullish trend line with support near 132.10 on the 4-hours chart.
- EUR/USD surged above the 1.0750 resistance zone.
- The UK GDP could contract 0.2% in Nov 2022 (MoM), down from +0.5%.
USD/JPY Technical Analysis
The US Dollar failed again to clear the 134.80 resistance against the Japanese Yen. USD/JPY started a fresh decline and traded below the 133.50 support.
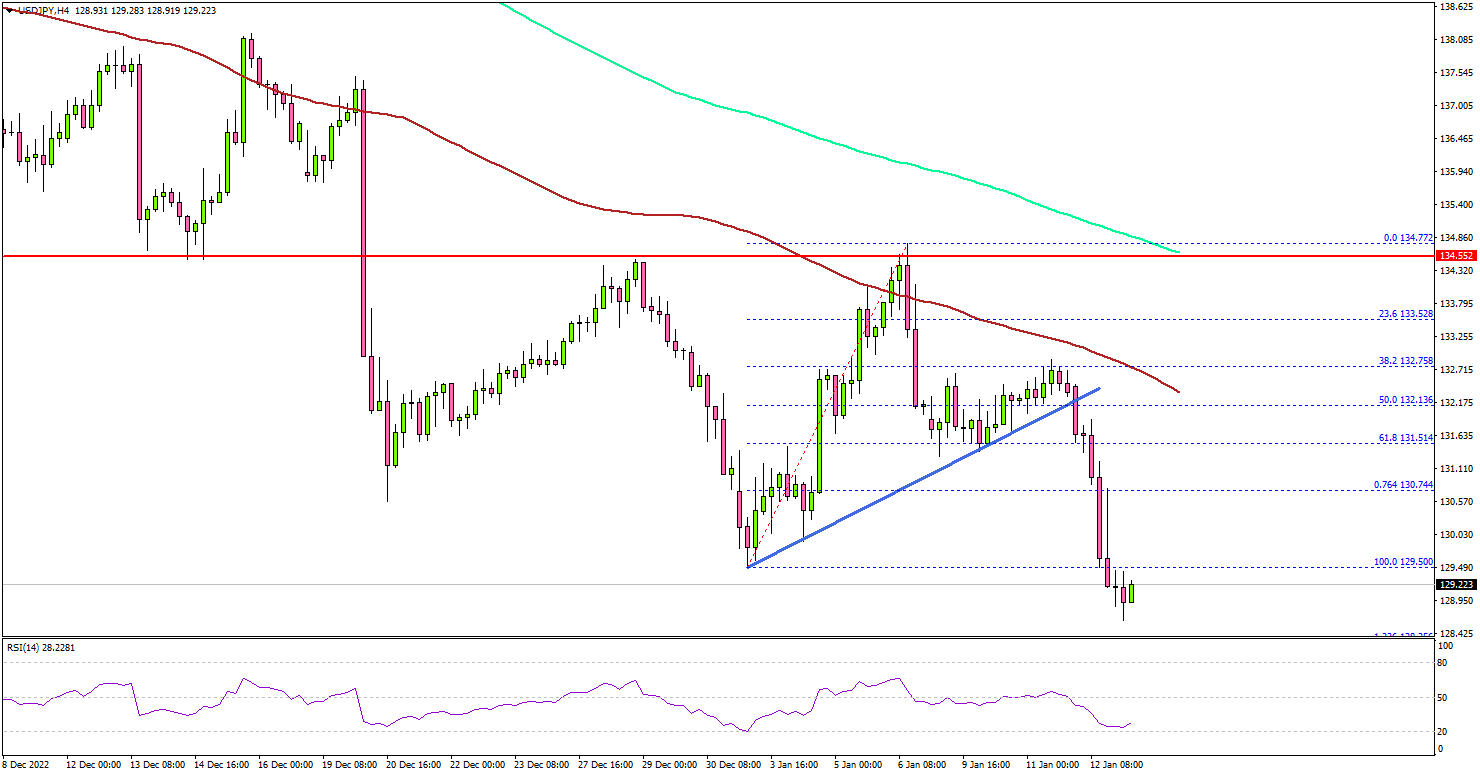
Looking at the 4-hours chart, the pair extended its decline below the 132.50 level, the 100 simple moving average (red, 4-hours) and the 200 simple moving average (green, 4-hours).
The pair also traded below a key bullish trend line with support near 132.10 on the same chart. There was a clear move below the 61.8% Fib retracement level of the upward move from the 129.50 swing low to 134.77 high.
On the downside, there is a major support at 129.20. The next major support is near the 128.80 level. A downside break below the 128.80 zone might push the pair lower.
The next major support sits near the 127.50 level. Any more losses might open the doors for a move towards the 126.00 support zone.
On the upside, an initial resistance is near the 131.50 level. The next major resistance may perhaps be near 132.00. A clear move above the 132.00 resistance might start a steady increase. In the stated case, USD/JPY could even surpass the 132.50 level. In the stated case, the pair could rise towards the 133.20 level.
Looking at EUR/USD, the pair gained pace and was able to clear the 1.0750 resistance zone, opening the doors for more gains.
Economic Releases
- UK GDP for Nov 2022 (MoM) - Forecast -0.2%, versus +0.5% previous.
- UK Industrial Production for Nov 2022 (MoM) - Forecast -0.3%, versus 0% previous.
- UK Manufacturing Production for Nov 2022 (MoM) - Forecast -0.2%, versus +0.7% previous.
Natural Gas (NG): A Look at Elliott Wave Decline and Target Area
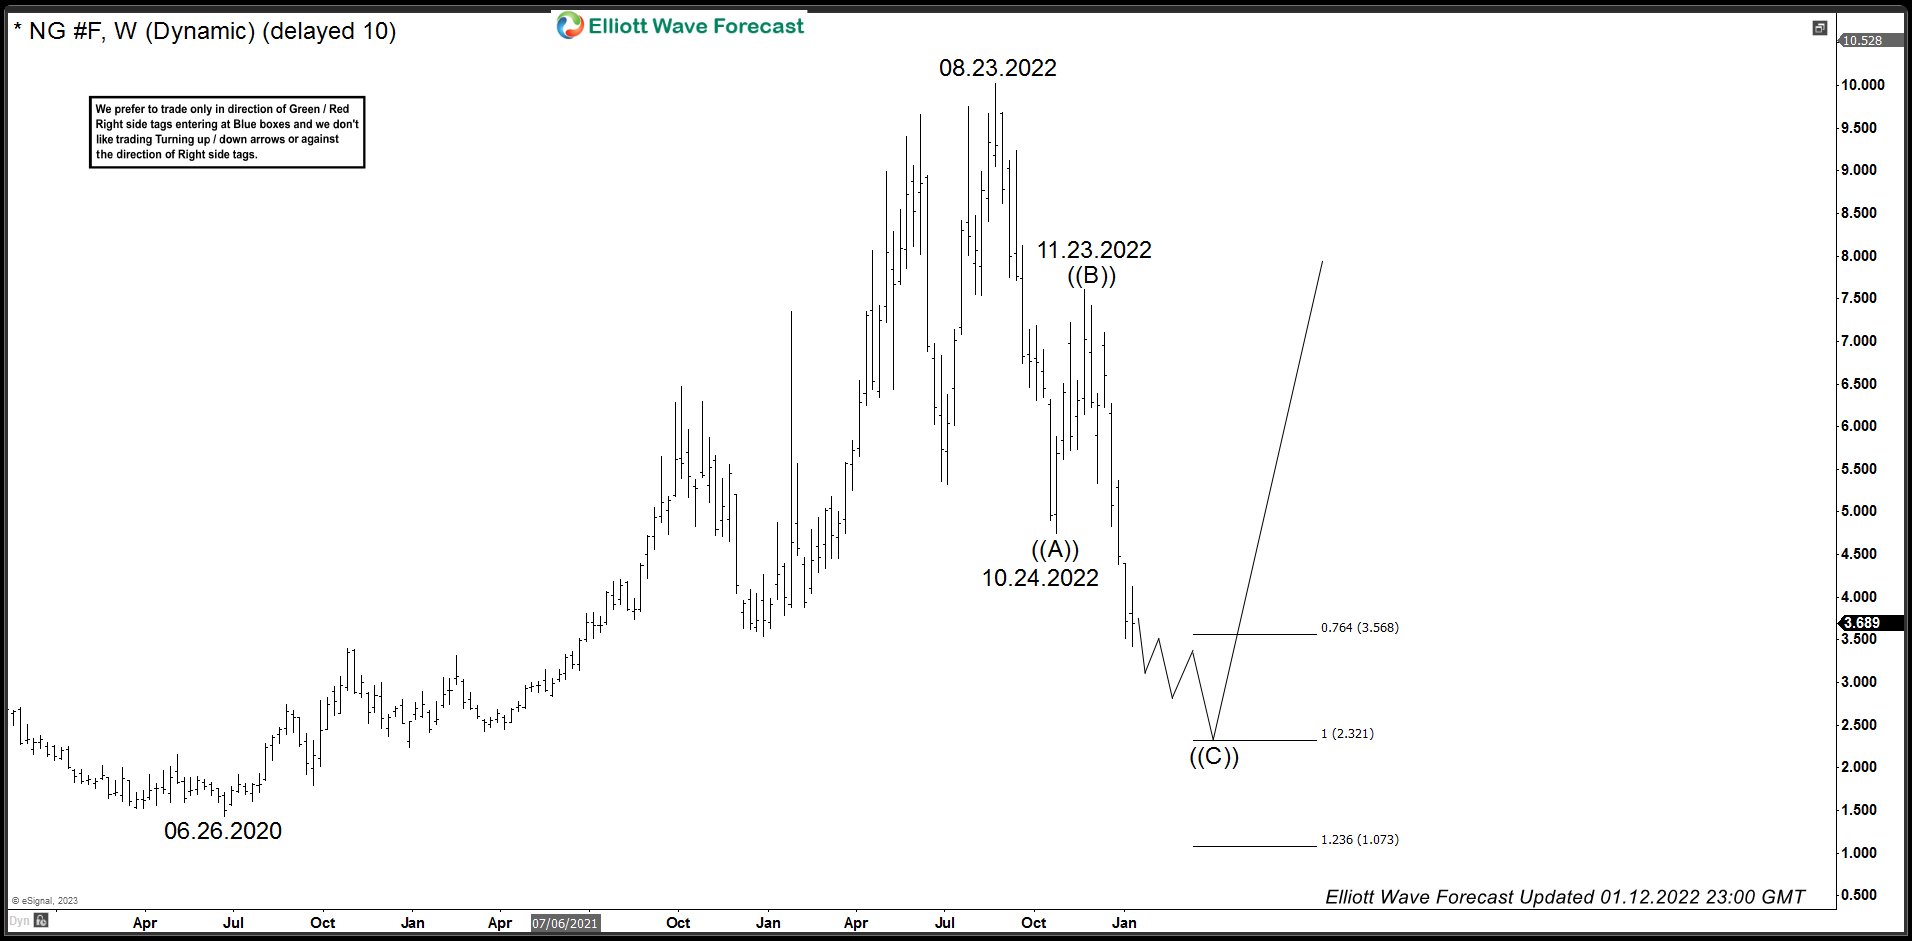
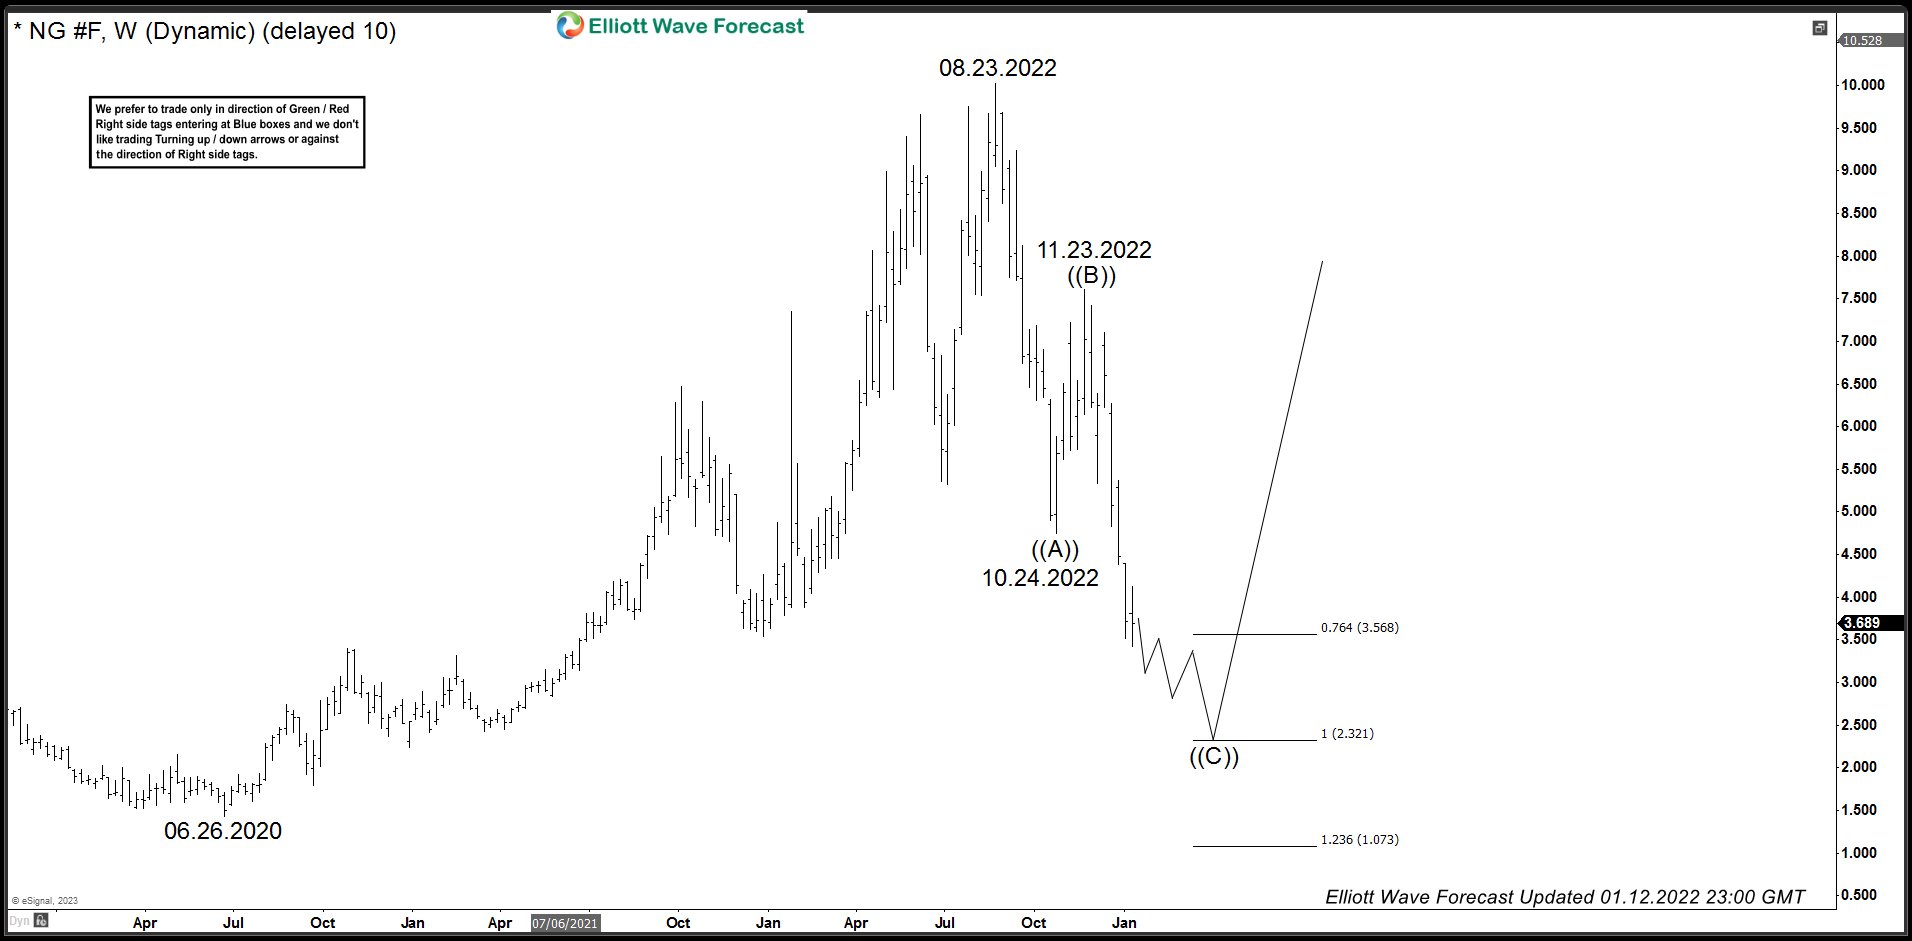
Natural Gas (NG) has lost over 63% in value since the peak in August 2022. It has been a rather sharp decline with a sizeable recovery in the middle before the decline resumed again. Today, we will take a look at Elliott Wave structure of the decline from August 2022 peak, show some charts from members area to explain how we have been calling it lower for a while and now that October 24, 2022 low has been broken, what will be the next target area.
Natural Gas 4 Hour Elliott Wave Analysis – 5 December 2022
Chart below shows Natgas initial decline from 08.23.2022 peak was an Elliott Wave Impulse within which wave (1) ended at 9.05, wave (2) ended at 9.682, wave (3) ended at 6.305, wave (4) ended at 7.188 and wave (5) ended at 4.75. Since we expected this decline to be part of a correction so we labelled it wave ((A)) anticipating the correction to unfold as a Zigzag Elliott Wave structure. Impulsive decline from 08.23.2022 peak was followed by a corrective recovery to 7.604 which we labelled as wave ((B)) and then the decline resumed again. We expected some more downside to complete wave (1) before a bounce in wave (2) to fail below 7.604 high for extension lower in wave (3) of ((C)).
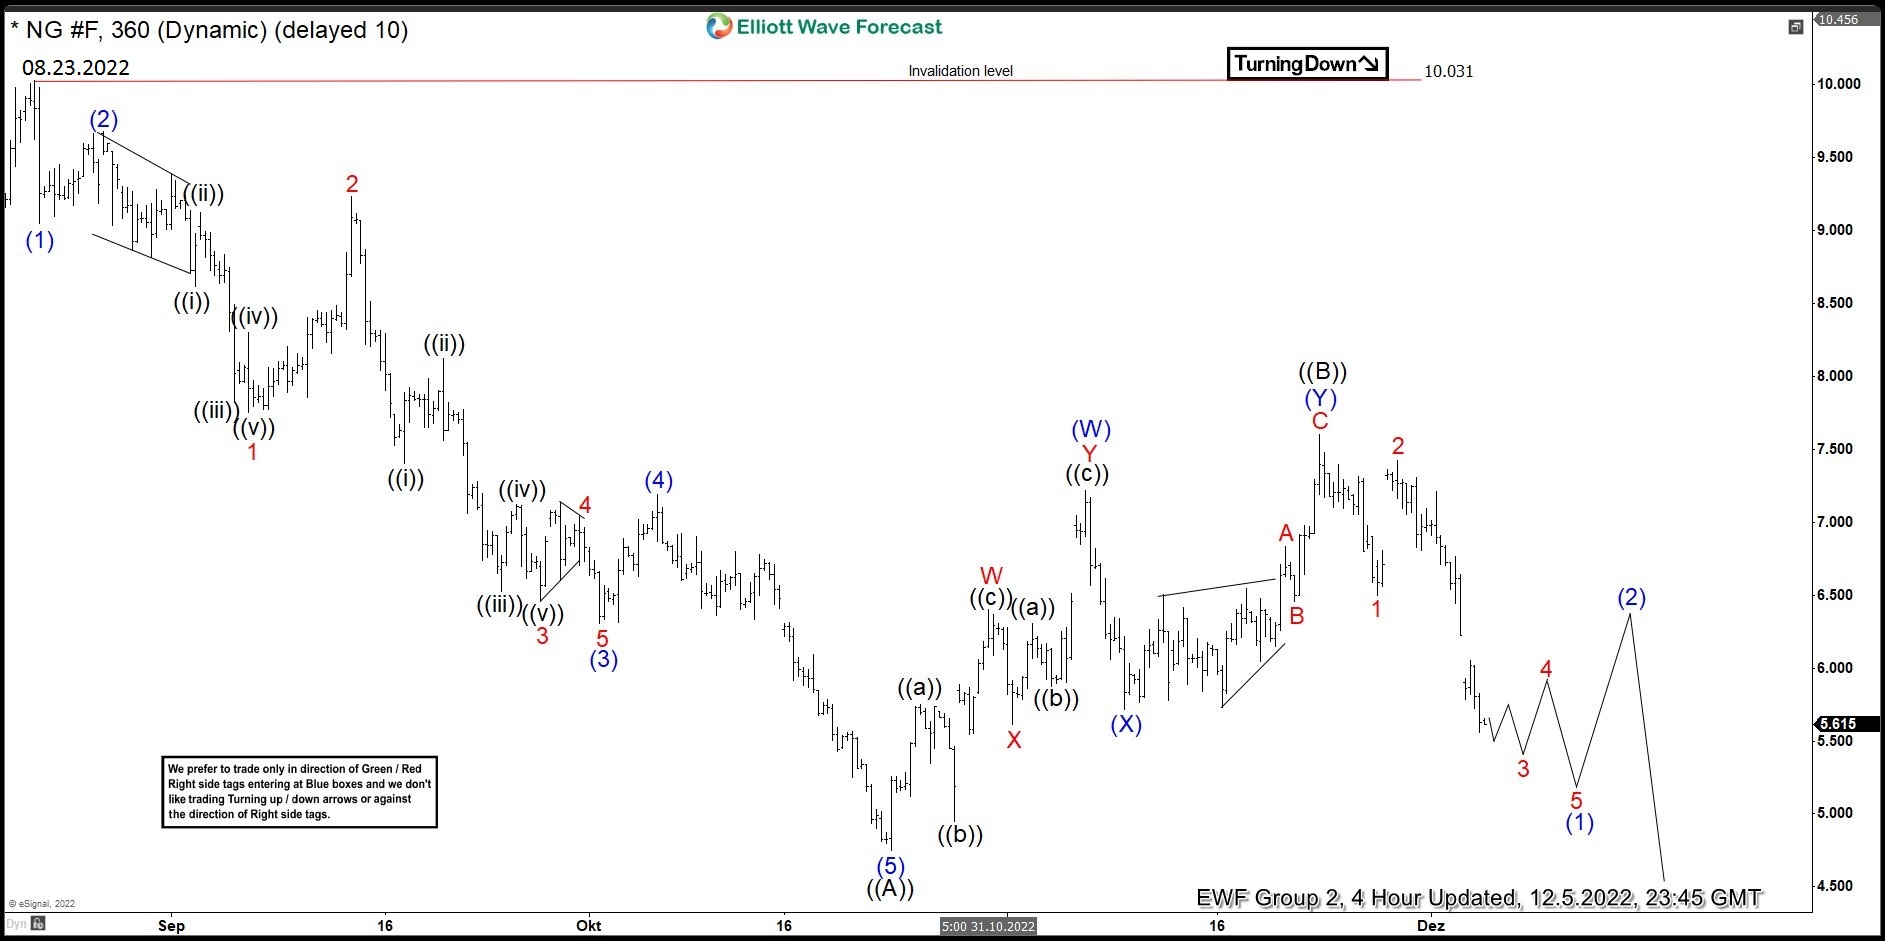
Natural Gas 4 Hour Elliott Wave Analysis – 11 January 2023
We can see wave (1) completed at 5.337, this was followed by a sharp recovery in wave (2) to 7.105 and then decline resumed. We have already seen a break of wave ((A)) low at 4.75 with price currently trading at 3.652. Chart shows that we are trading within wave 3 of (3) which has either ended at 3,422 or will see a bit more downside to complete wave 3 of (3). Once wave 3 is complete, expect a bounce in wave 4 and lower again in wave 5 of (3). Then, expect another bounce in wave (4) and another leg lower in wave (5) to complete 5 waves down in wave ((C)).
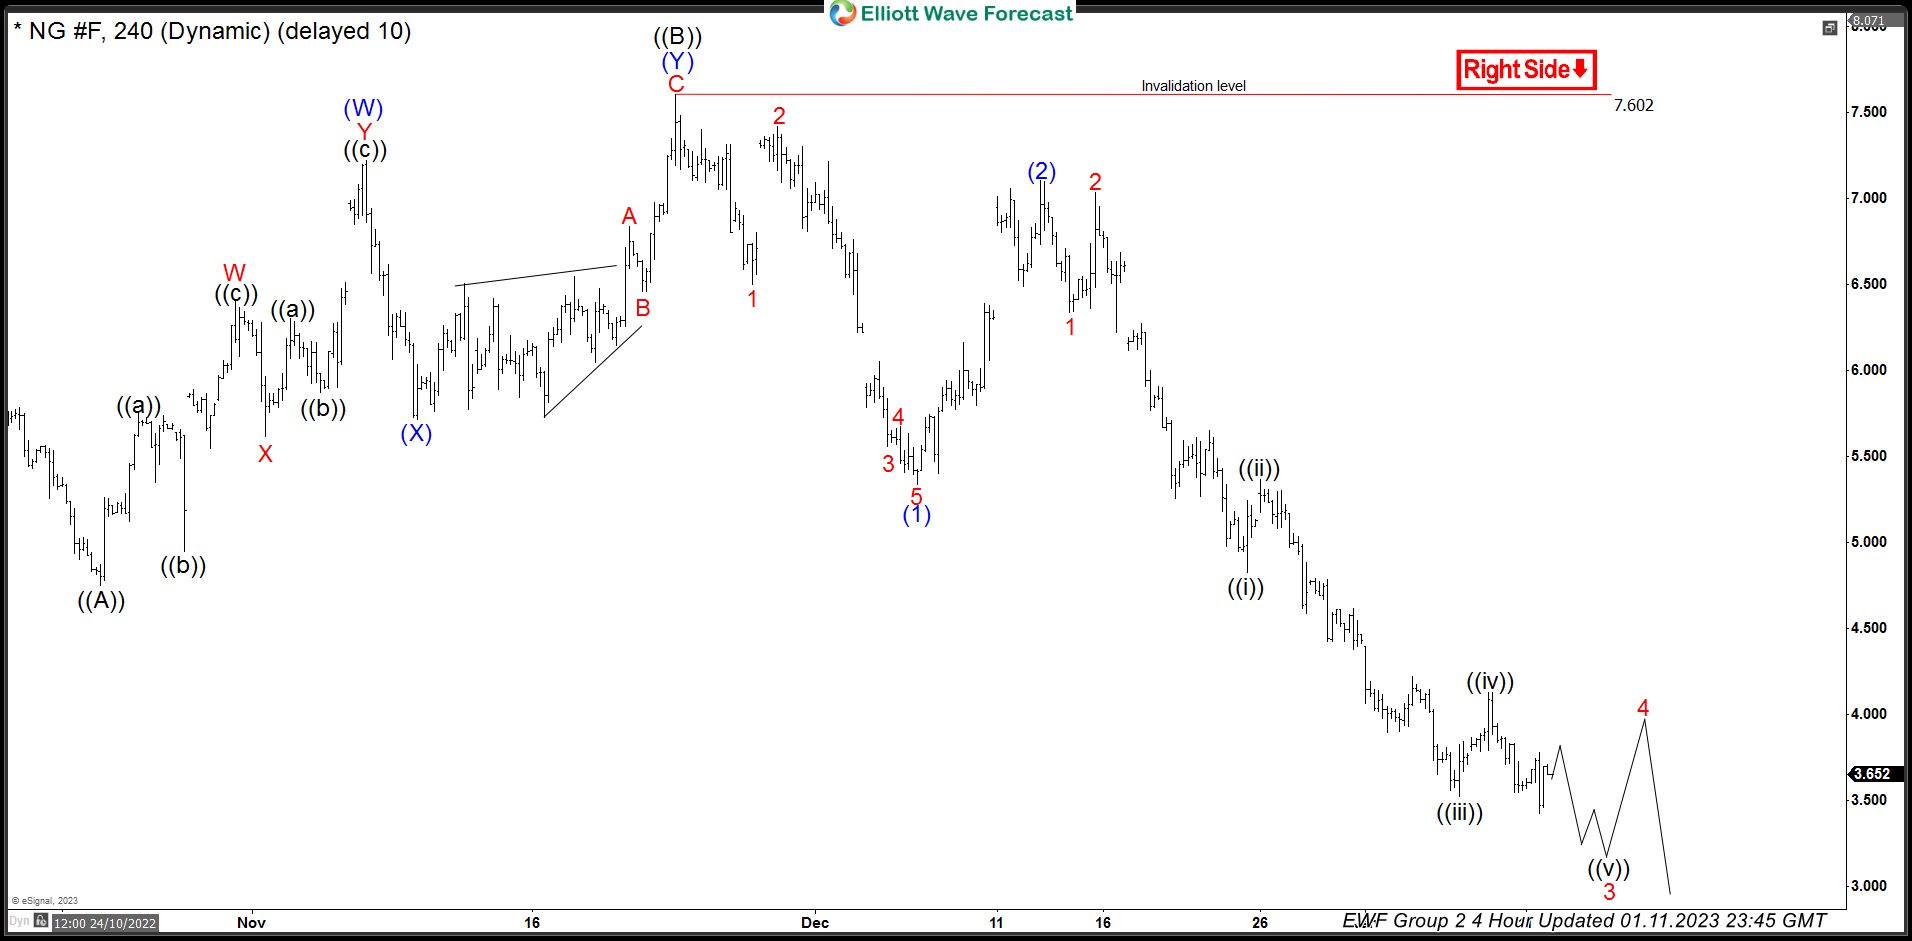
Natural Gas – Target Area
Chart below shows the target area with ideal area between 2.321 – 1.073 which is 100 – 123.6% Fibonacci extension of the first leg down from 08.23.2022 peak to 10.24.2022 low projected lower from 11.23.2022 peak. This is where buyers should be entering the market and then resume the rally for a new high above 08.23.2022 peak or produce a larger 3 waves bounce at least.