Sample Category Title
ECB Survey: Consumer inflation expectations reversed in Nov
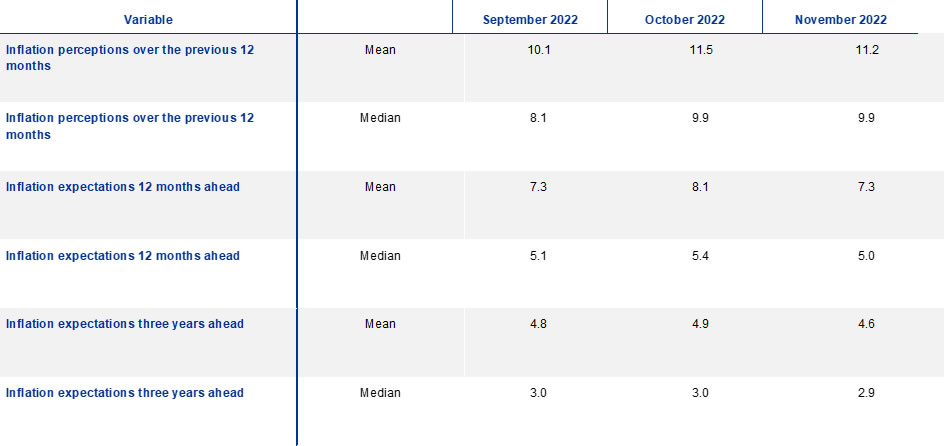
In ECB's November Consumer Expectations Survey, mean inflation expectations for the 12 months ahead dropped back to 7.3%, comparing to October's 8.1% and September's 7.3%.
Median inflation expectations for the 12 months ahead dropped to 5.0%, comparing to October's 5.4% and September's 5.1%.
Mean inflation expectations for the 3 years ahead dropped to 4.6%, comparing to October's 4.9%, and September's 4.8%.
Median inflation expectations for the 3 years ahead dropped to 2.9%, comparing to October's 3.0%, and September's 3.0%.
ECB Bulletin: Headline inflation to stay above target until mid-2025
In the monthly Economic Bulletin, ECB said, "evidence from surveys and markets shows that forecasters continue to expect inflation to peak soon, with longer-term expectations remaining at around the ECB 2.0% target." Still, "close monitoring is warranted given the further above-target revisions of some indicators".
In the December Eurosystem staff macroeconomic projections, headline inflation in Eurozone ill fall from average 8.4% in 2022 to 6.3% in 2023, 3.4% in 2024, and then 2.3% in 2025. Headline inflation is expected to remain above the ECB's target of 2.0% until mid-2025
USDCHF Awaits Its Next Leg Higher; Bears Still Around
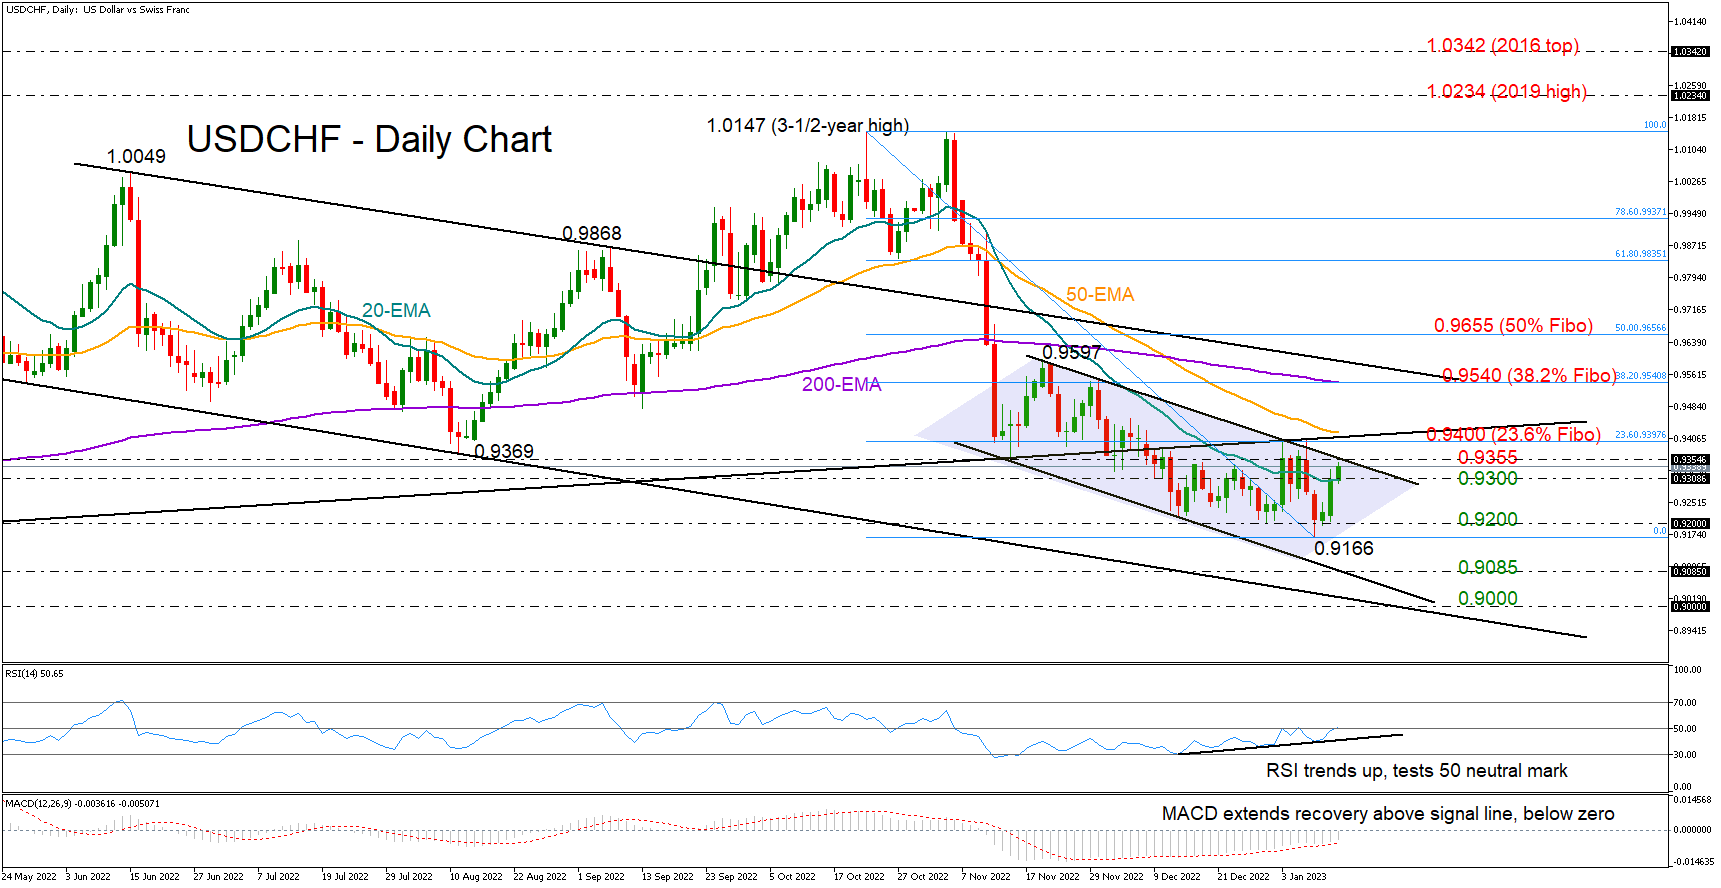
USDCHF is making another attempt at breaking above the 0.9300 level and the 20-day exponential moving average (EMA) after Wednesday’s quick bounce on the 0.9200 floor.
The pair avoided a drop towards the lower boundary of the short-term bearish channel earlier in the week, raising hopes for a bullish breakout above 0.9355. The RSI and the MACD are also sending some encouraging signals as the indicators have been trending positively and against the market direction since mid-December, displaying a bullish divergence setup; this is usually considered a sign that buyers are gaining control.
That said, with the tough constraining line laying overhead at 0.9400, buying tendencies could soon fade. Note that the 23.6% Fibonacci retracement of the latest downleg and the 50-day EMA are within the same neighborhood.
If the bulls successfully knock down that wall, the price may speed up towards the 200-day EMA and the 38.2% Fibonacci zone of 0.9540. Then, the falling trendline, which connects the highs from June 15 and September 7, may come on the radar ahead of the 50% Fibonacci of 0.9655.
In the case that the price closes below the 20-day EMA once again, all eyes will turn back to the 0.9200 base. Failure to pivot here could confirm additional losses towards the channel’s lower boundary seen around 0.9085. The support line drawn from the May 27 low could be the next target around 0.9000.
Summarizing, although USDCHF seems to be setting the ground for an upside reversal, downside risks will keep lingering in the background as long as the pair trades below 0.9400.
US Dollar Index: Triple Zigzag Pattern Likely to Complete Near 101.41
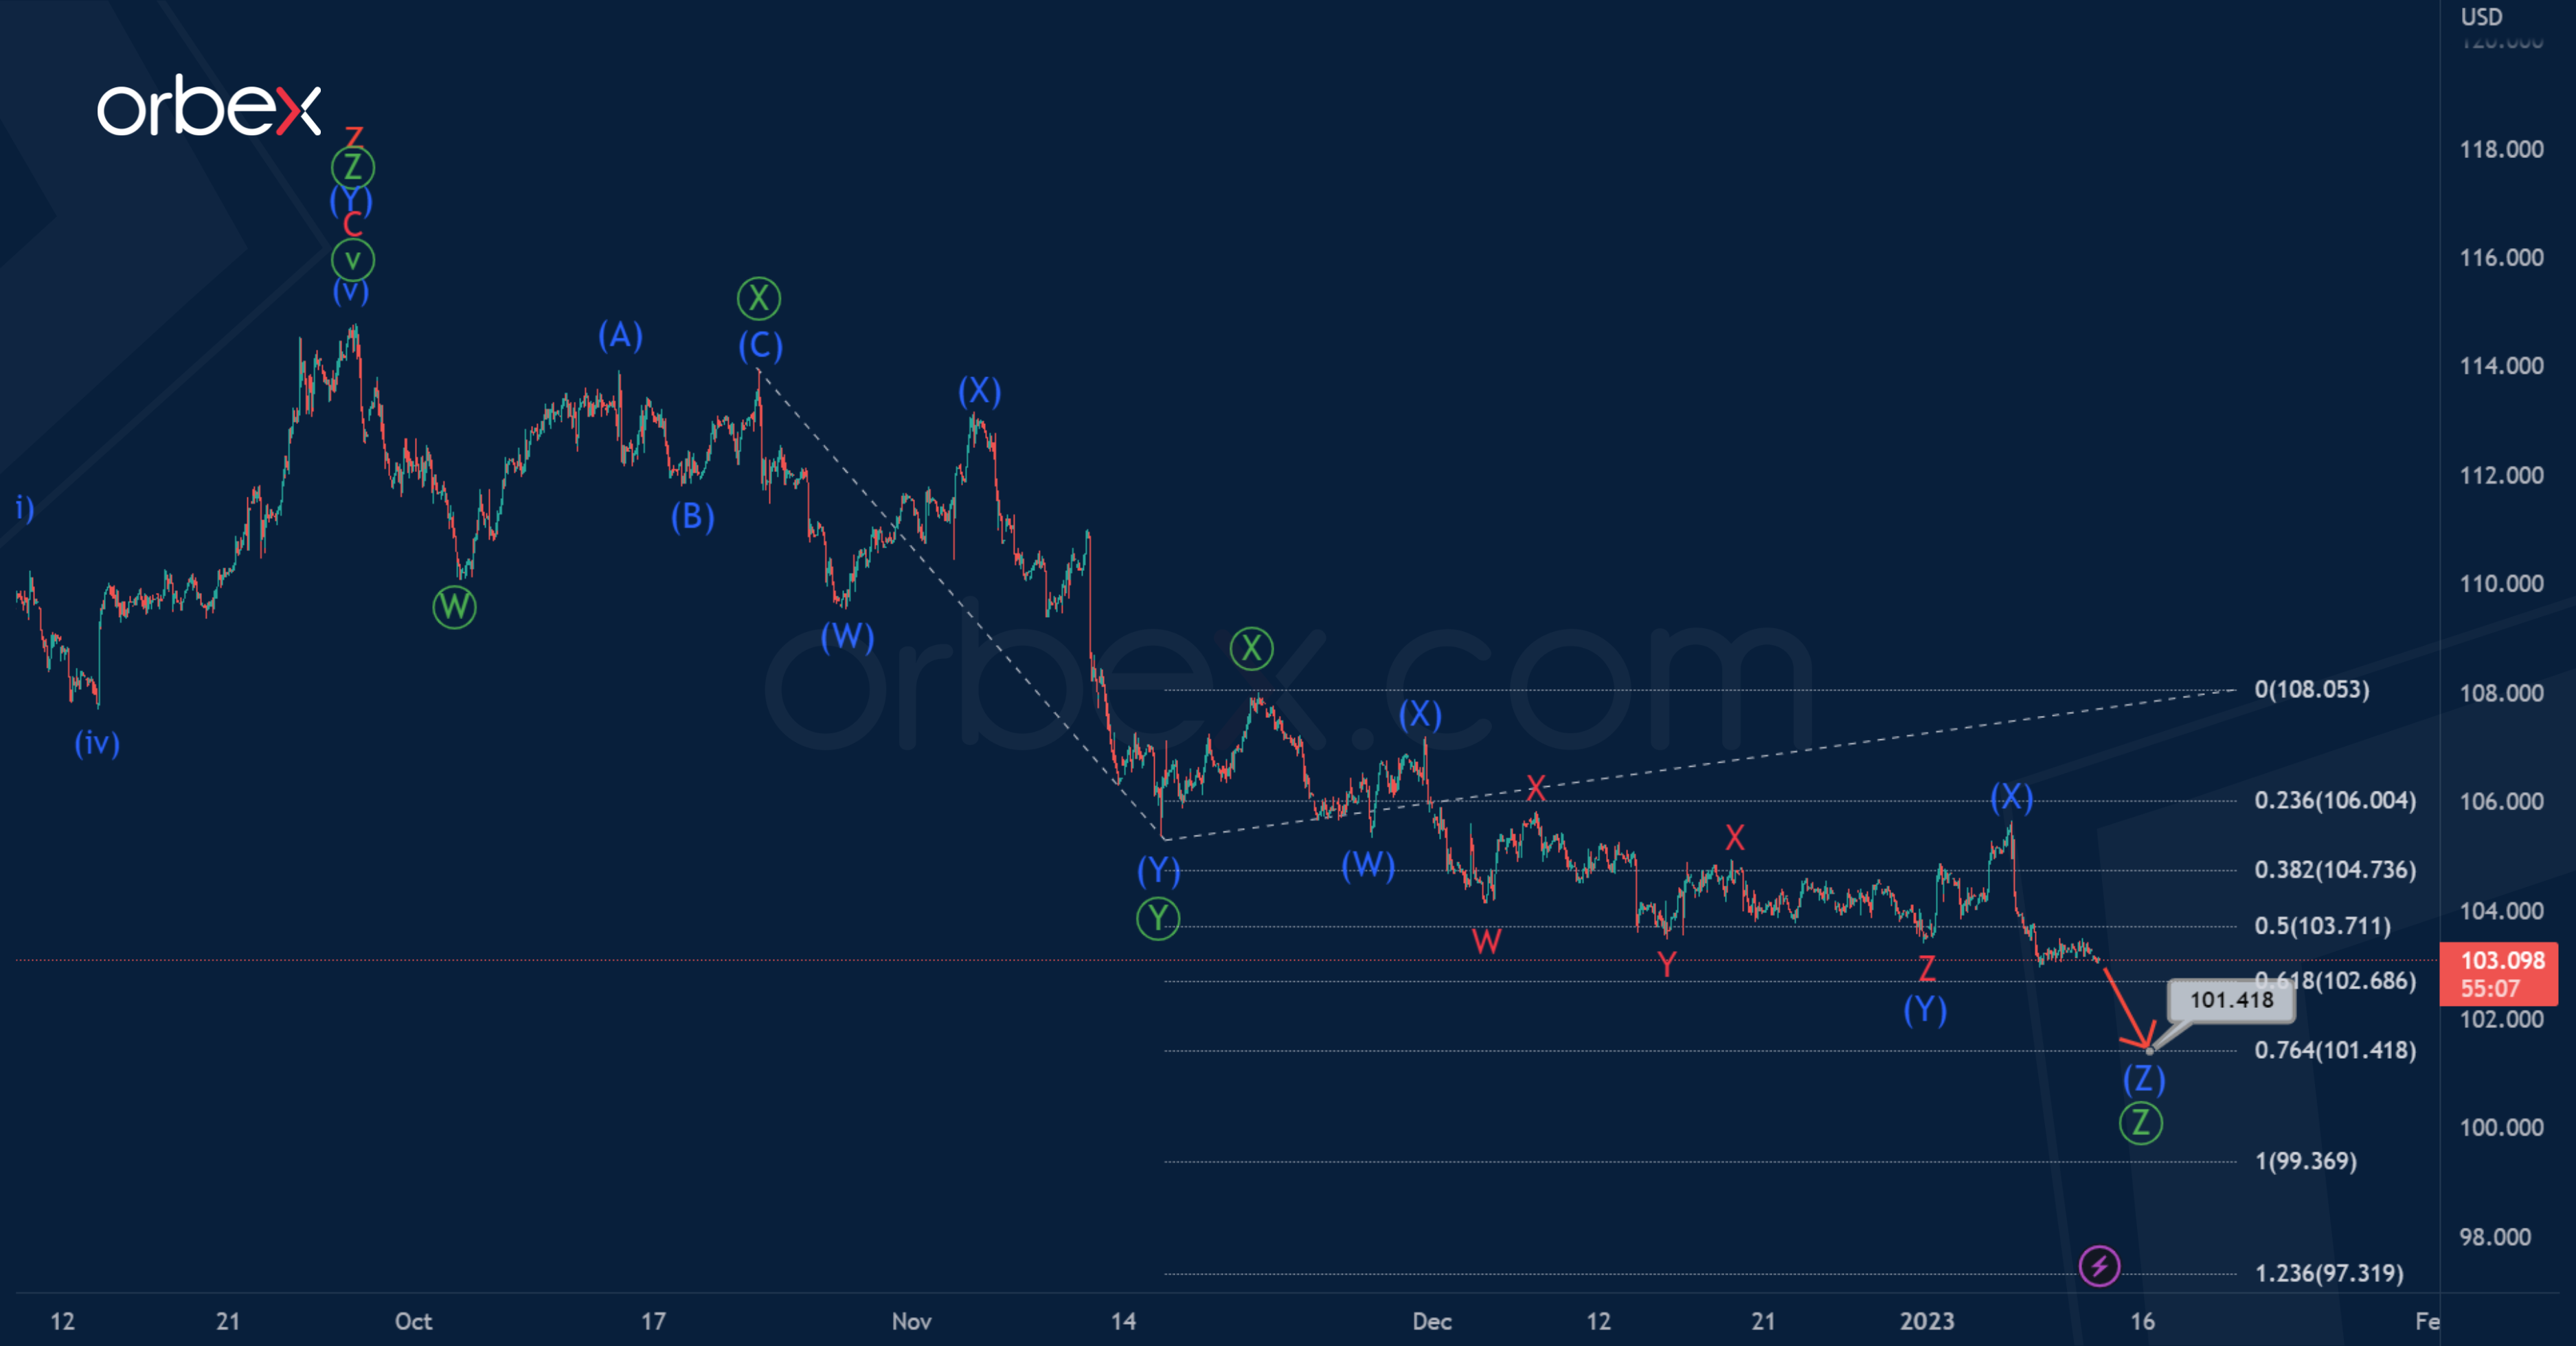
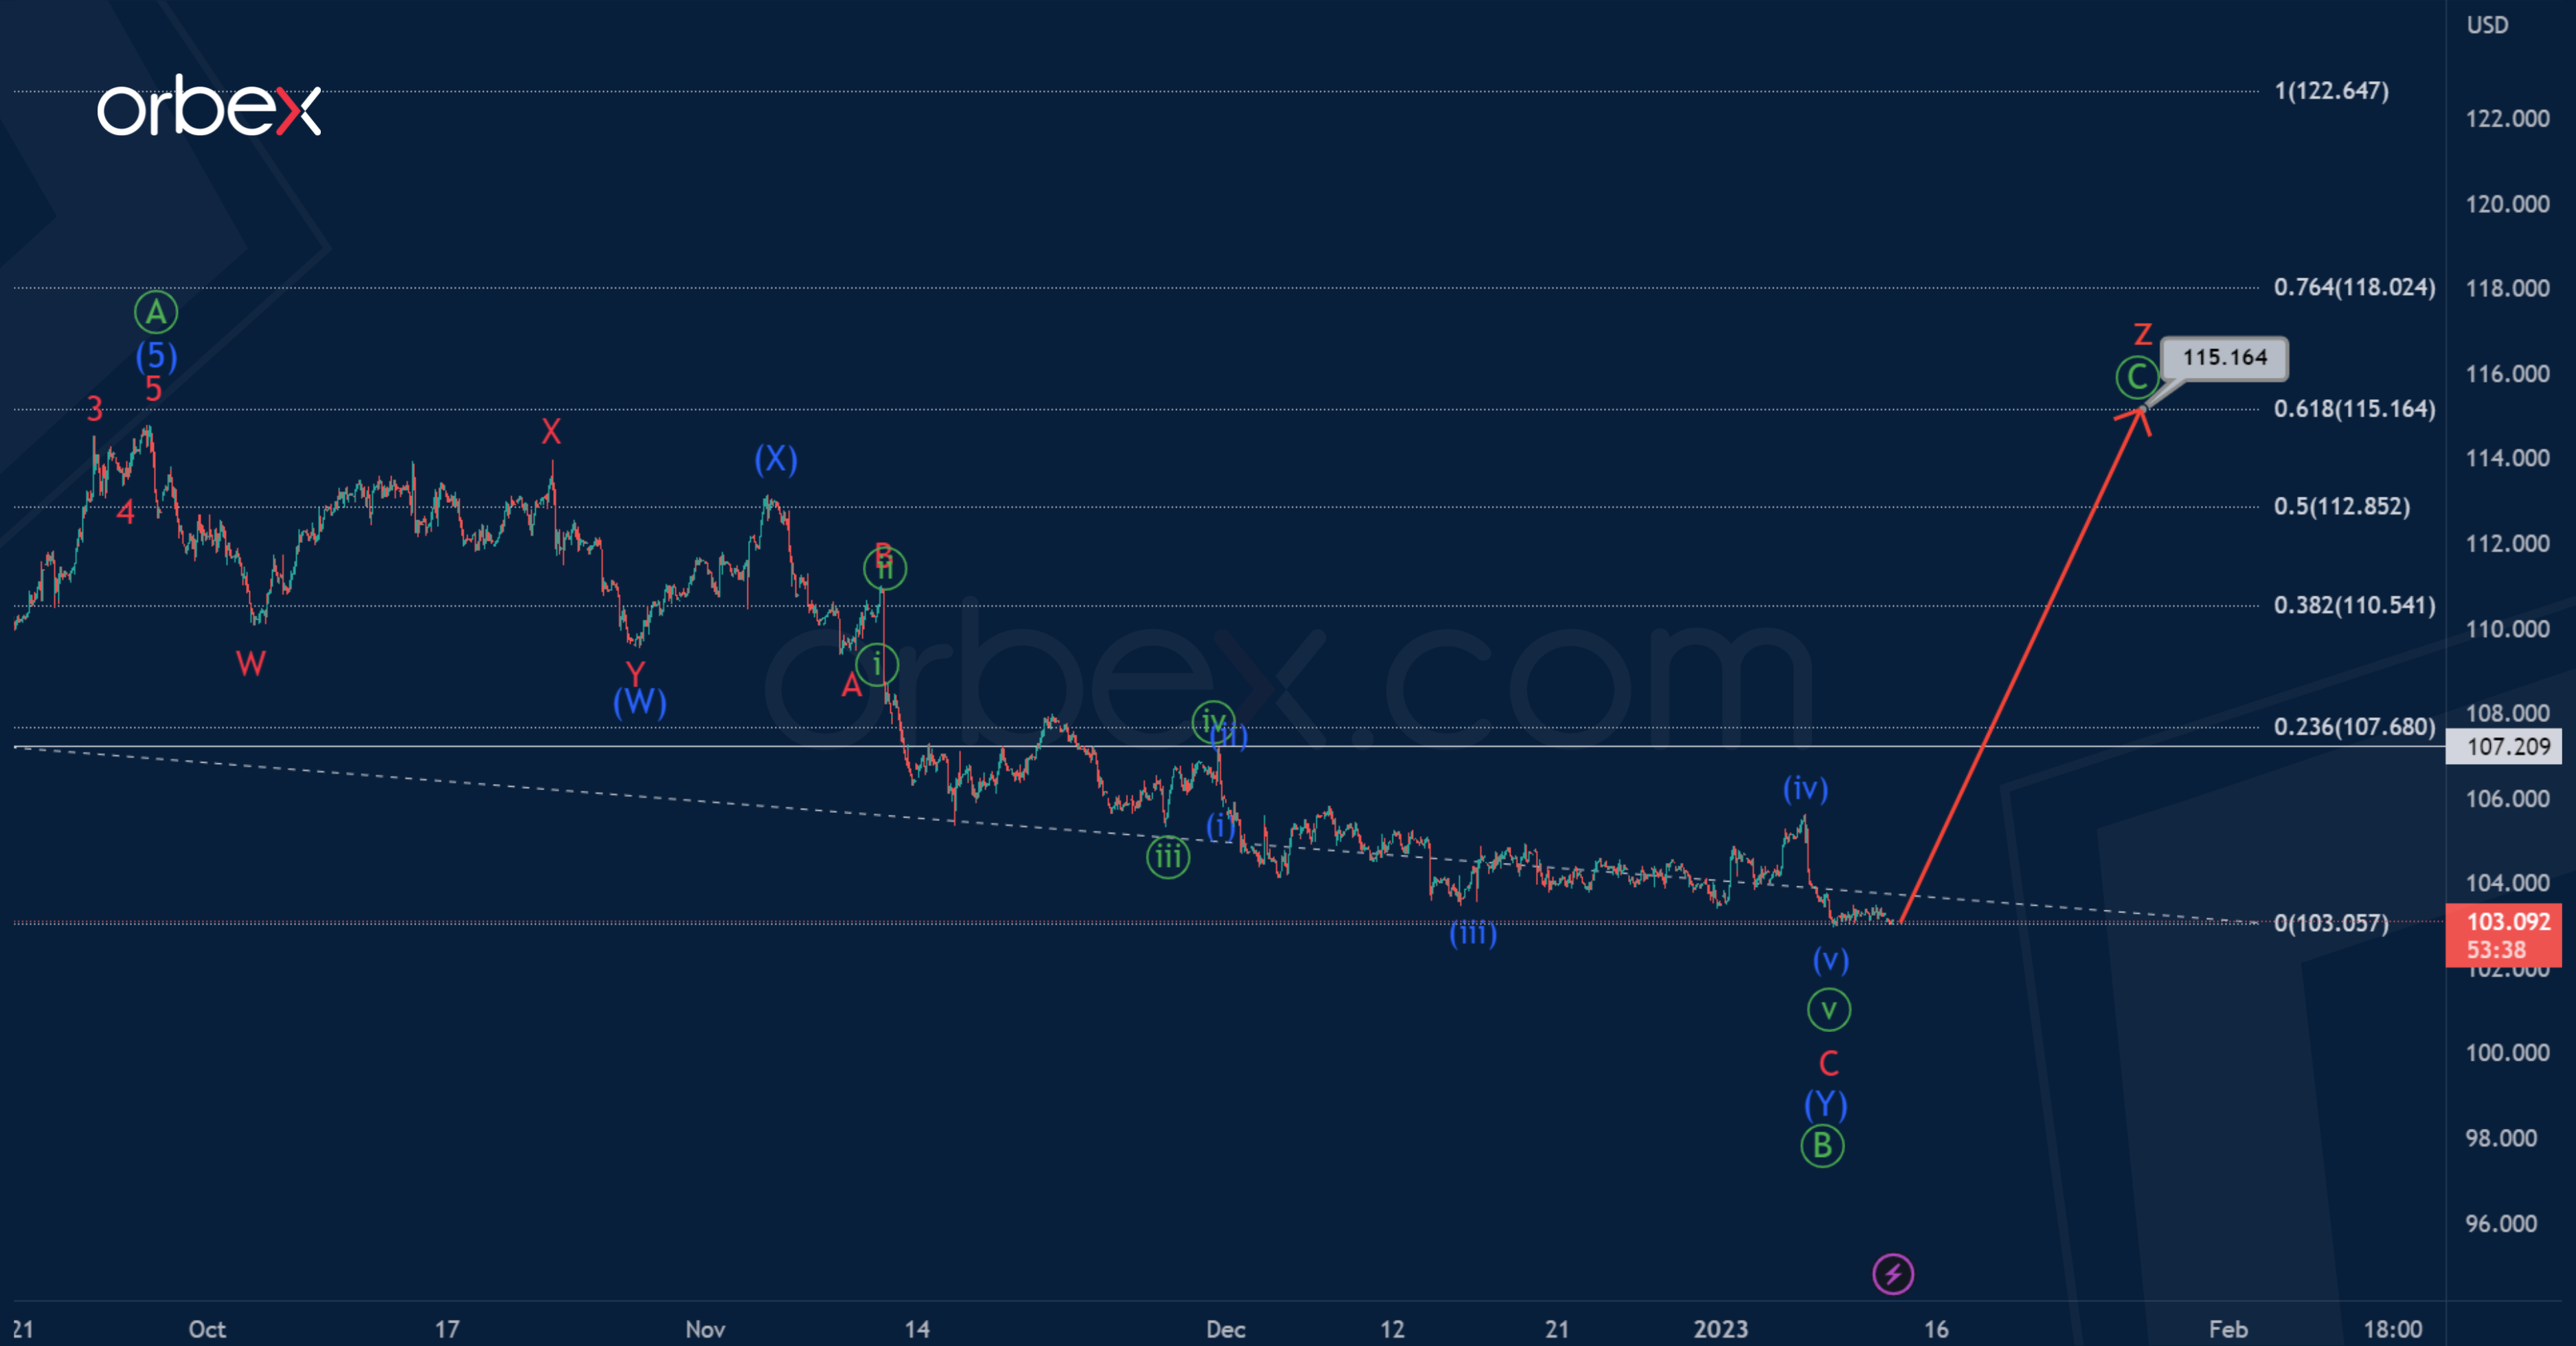
The DXY index chart shows the end of the global corrective trend, which took the form of a triple zigzag consisting of five main cycle waves w-x-y-x-z.
Thus, the market may currently be at the beginning of the first part of a major bearish trend.
It is assumed that the bears form a triple zigzag pattern Ⓦ-Ⓧ-Ⓨ-Ⓧ-Ⓩ. It seems that the sub-waves Ⓦ-Ⓧ-Ⓨ-Ⓧ have already been completed. In the near future, the price is expected to continue falling in the primary wave Ⓩ. Its end is possible near 101.41. At that level, it will be at 76.4% of wave Ⓨ. The wave Ⓩ itself is also similar to an intermediate triple zigzag.
Let's consider an alternative scenario in which the formation of a cycle triple zigzag will continue.
The wave z may take the form of a zigzag Ⓐ-Ⓑ-Ⓒ, where the first impulse Ⓐ and the correction Ⓑ in the form of an intermediate double zigzag are already completed. The entire wave z can complete its pattern near 115.16. At that level, it will be at the 61.8% Fibonacci extension of wave y.
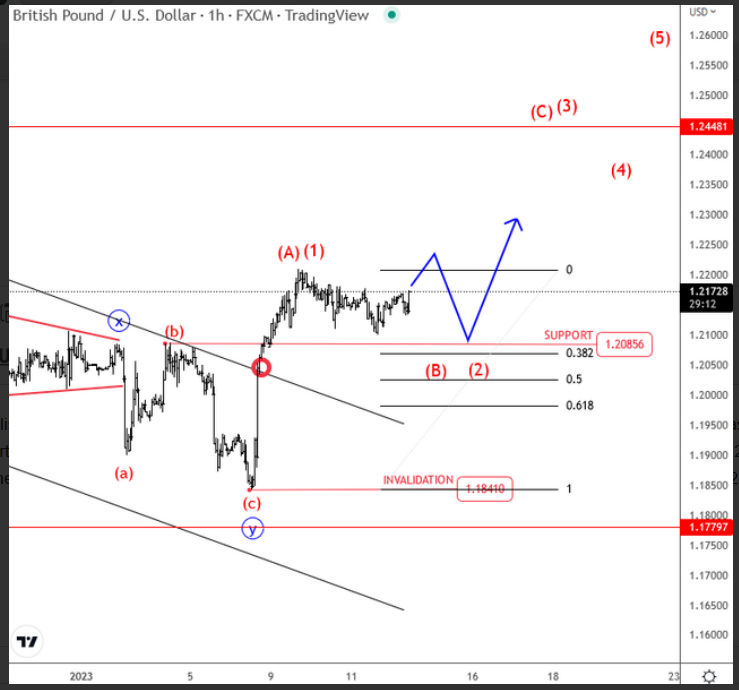
Cable Breaking 1.2085 Resistance, New Support?
Cable has made a nice bullish turn from 1.1840 area so there can be more gains coming after current intraday pullback that already has a corrective look for wave 2/B. However, because of important US CPI and volatility, there is a chance that the pair will retest the lower supports still, near 1.2085. A daily close above 1.2250 will suggests that the correction is finished. In both cases, we expect more gains while the market is trading above 1.2085.
AUDUSD Stalls Below the 4-Month Peak
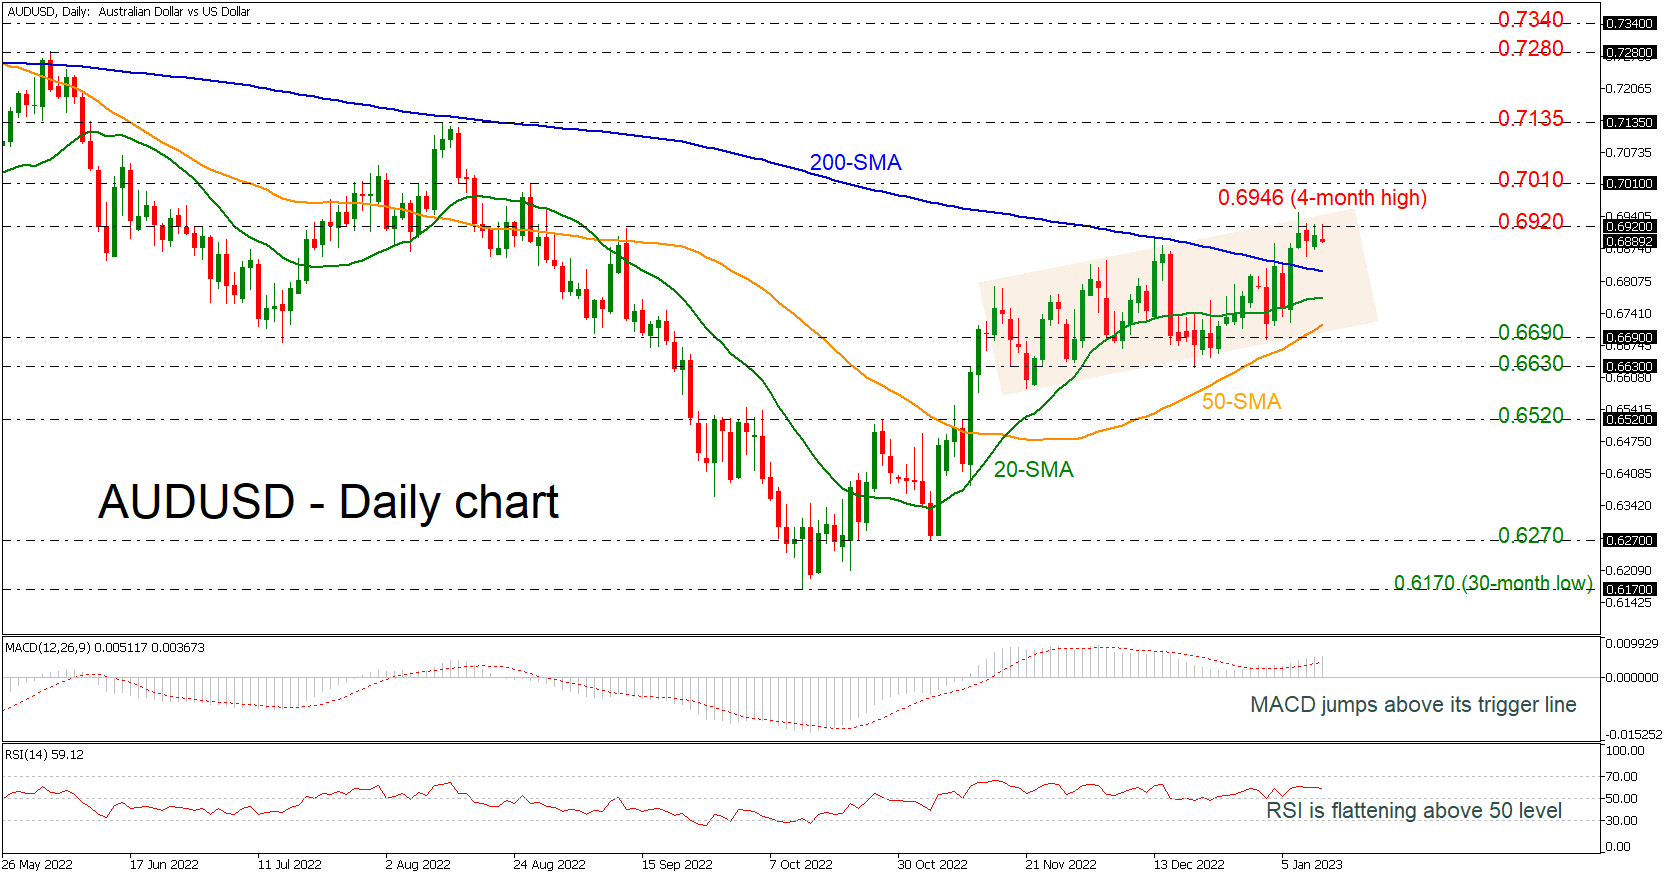
AUDUSD is finding strong resistance at the 0.6920 barrier, which is near the upper boundary of the short-term upward sloping channel. The RSI indicator reflects a stall in the positive momentum, as it is flattening in the bullish territory. However, the MACD is strengthening its movement above its trigger and zero lines.
To the upside, an initial important resistance region from the 0.6920 high to the four-month peak of 0.6946 could prove difficult to overrun. Conquering this, the 0.7010 resistance could halt the climb towards 0.7135.
Otherwise, if sellers manage to close decisively below the 200-day simple moving average (SMA) at 0.6830 and the 20-day SMA at 0.6770 it could deter the price from encountering the 50-day SMA at 0.6720. Marginally below this line, the 0.6690 may challenge bears’ efforts to revisit the 0.6630 support, penetrating the ascending channel to the downside.
Summarizing, AUDUSD may open the way for more increases if there is a climb above the four-month peak of 0.6946. On the other hand, a drop below 0.6690 could switch the outlook to neutral.
Will the Inflation Report Deliver?
European equity markets opened cautiously higher on Thursday, following a mixed session in Asia amid nerves around the US inflation release later in the day.
This inflation print has been the main topic of conversation all week. The jobs report last Friday changed the dynamic in the markets and ensured that not only was this CPI report going to be important but in all likelihood pivotal ahead of next month's Fed meeting.
We've gone from inflation declining but the labour market being stubbornly tight to both appearing to sing from the same hymn sheet. Cracks are appearing in the economy following a very aggressive tightening cycle that's leading to cooling demand, prices, and wage demands. Unemployment remains low as employers have been reluctant to lay people off but there's every chance that will follow.
The Fed doesn't want to be responsible for a needlessly sharp downturn and the lag effect of monetary policy means that is a risk when the central bank is raising rates as aggressively as they have been. Another good inflation report today, particularly on the core side, will give policymakers more than enough reason to slow the pace of tightening further and even lower the terminal rate projections in March, if it continues.
Oil steadies as traders grow more optimistic
Oil prices have steadied this morning after recovering strongly on Wednesday. Enthusiasm is building in the aftermath of last week's jobs report and a positive inflation reading today could further fuel that. The prospect of a softer landing, even avoiding recession, is as good as investors could have realistically hoped for once it became clear how high inflation was going to rise last year.
A softer landing for the US, and perhaps elsewhere, combined with a strong economic rebound in China following the current Covid wave could make for a much better year than feared and stimulate extra crude demand. Of course, this case very much focuses on the promising scenarios but they are also increasingly looking like the more plausible ones as well.
Gold trading around pivotal technical zone
The gold rally is continuing to stall around $1,880, the lower end of a range that has been a major point of support and resistance in recent year. The range between $1,880 and $1,920 could be pivotal once more, either as a barrier of resistance in the event that inflation disappoints, or a signal of renewed bullishness if a positive report is the catalyst for a break above. Either way, we could see plenty of volatility in the aftermath of the release.
Bitcoin buoyed by risk recovery
Bitcoin is capitalising on the improvement in risk appetite that we're seeing in the broader markets, rallying more than 4% today before paring gains just shy of the December peak. After weeks of treading water between $16,000 and $17,000, cryptos have been given new life by the jobs report and the risk rally that has ensued. Another positive inflation reading today could see it trading at levels not seen since the early days of the FTX collapse.
US Oil Struggles for Bids
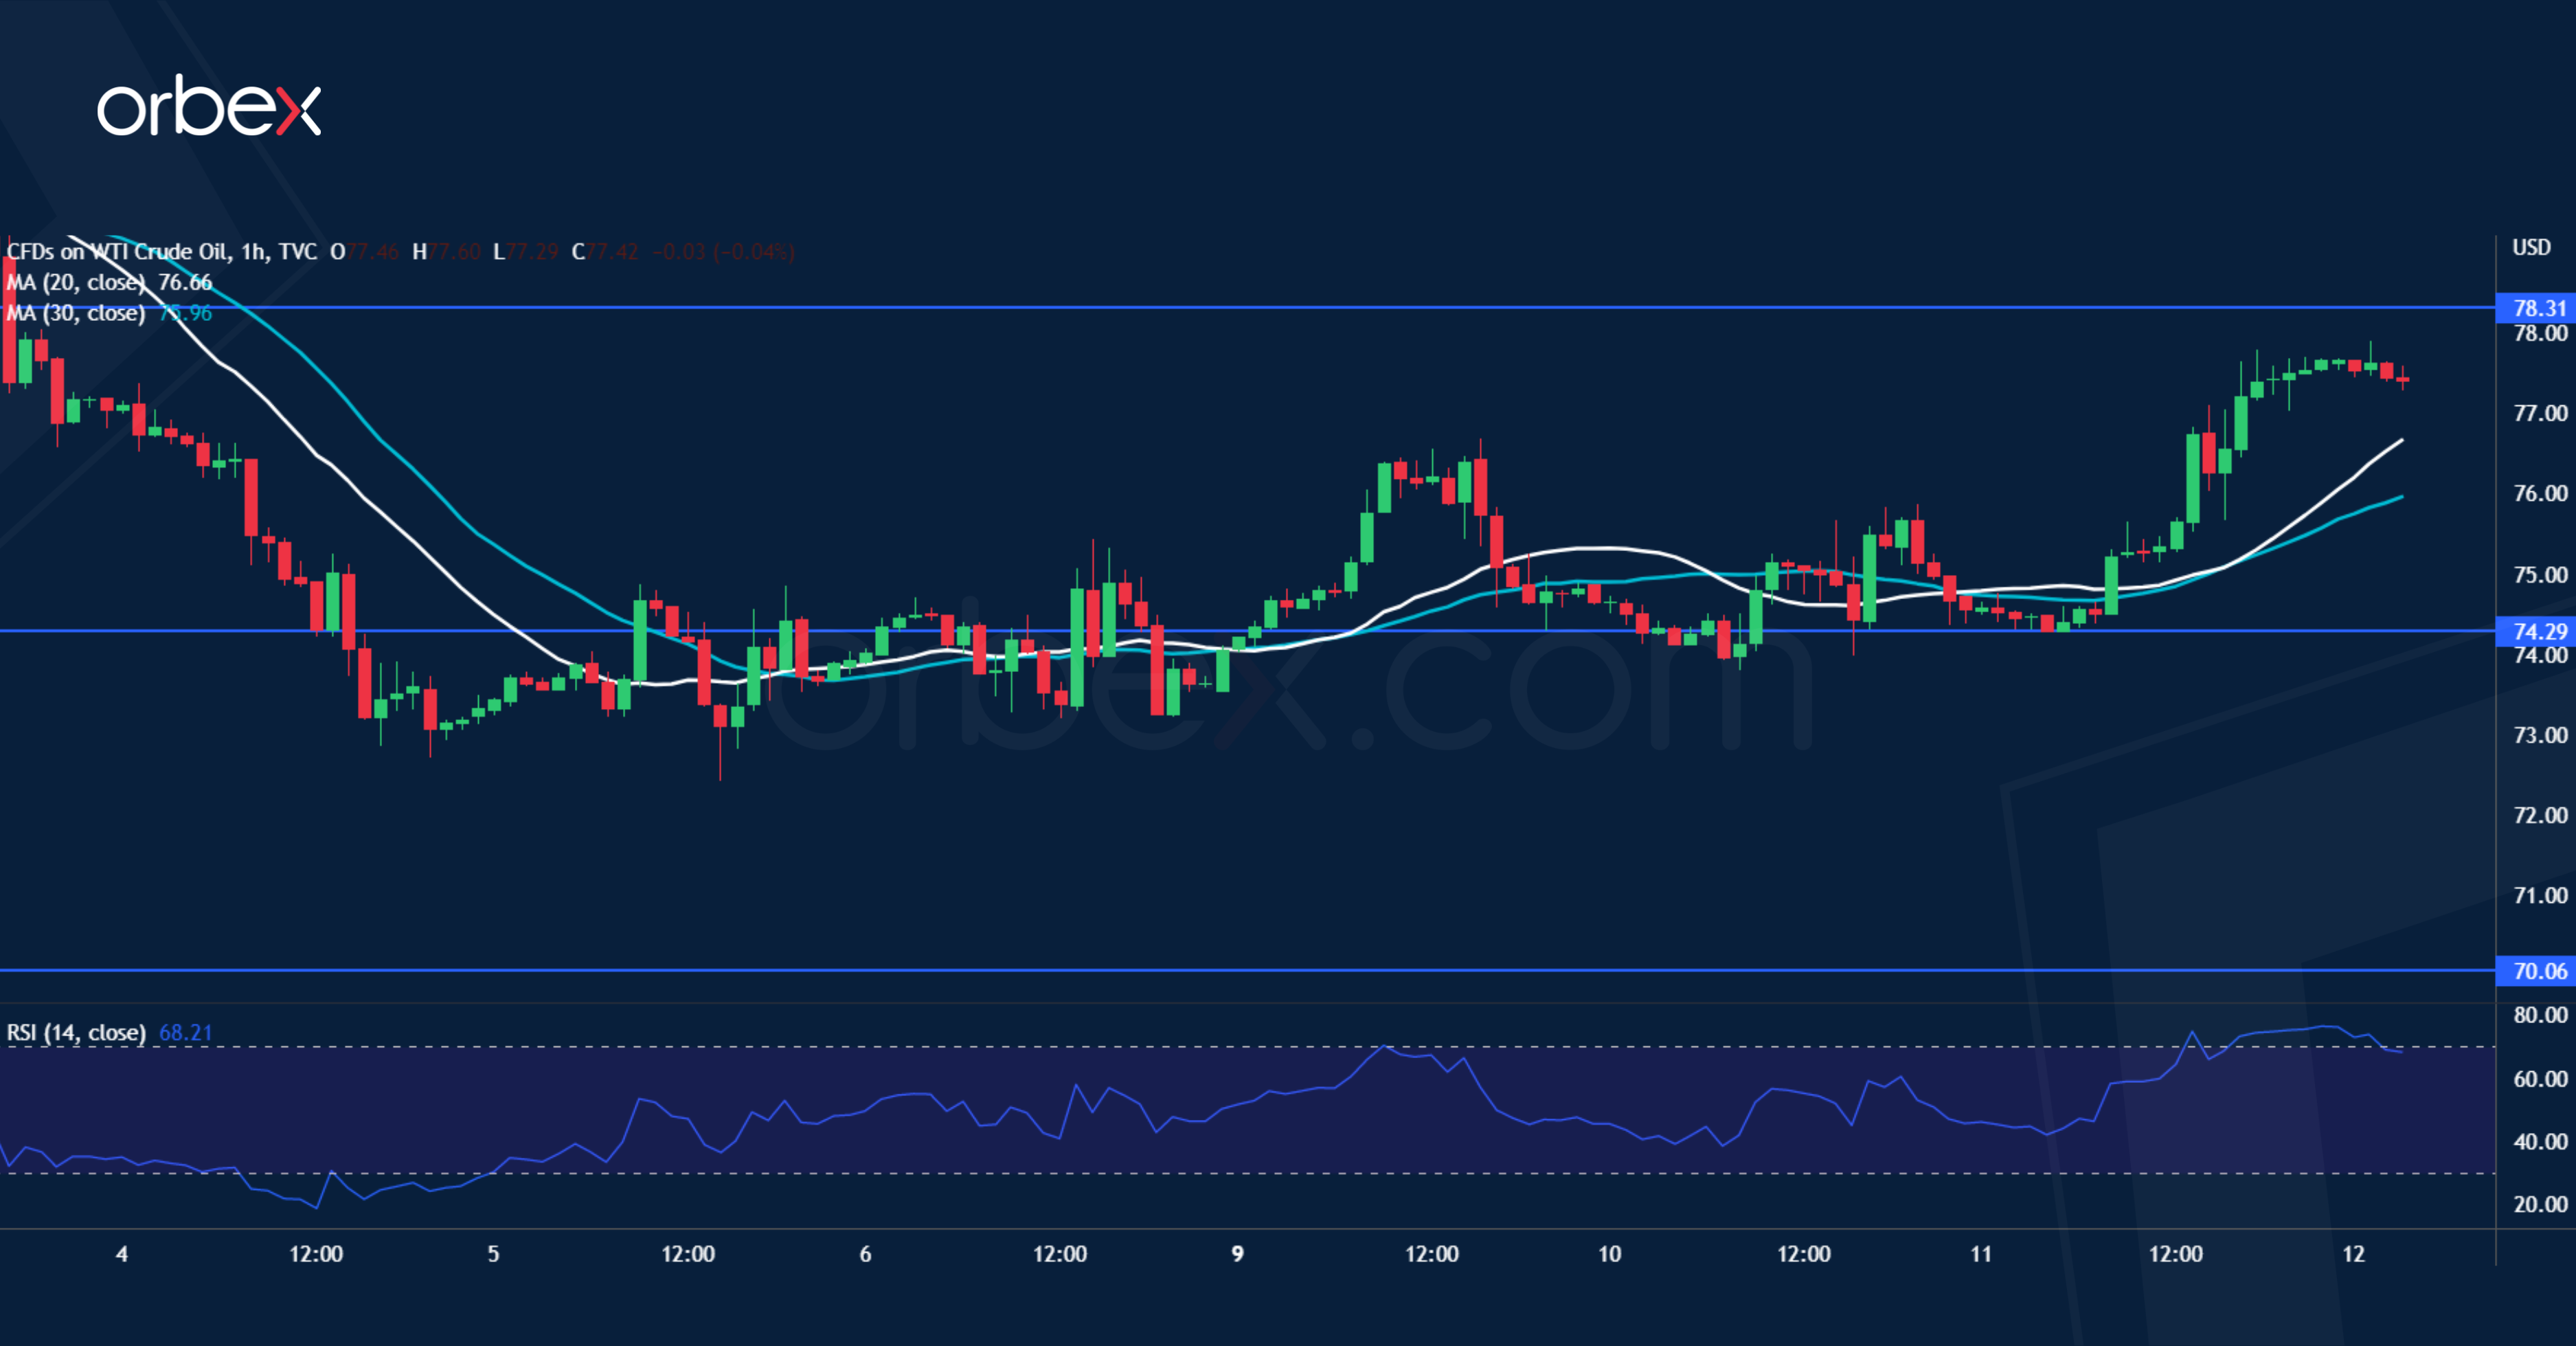
WTI crude jumped as the EU worked on more sanctions against Moscow. The price is consolidating above 70.00 as the bulls cling on the psychological level and 12-month low. The 70.00-81.10 range may be narrowing as traders probe levels back and forth. 74.30 is a fresh support to prevent the commodity from revisiting the critical floor right below. A close above the former support 78.30 may brighten up the mood and attract more buying interests. Only a rally above 81.00 would pave the way for a bullish reversal.
XAU/USD to Test Key Resistance
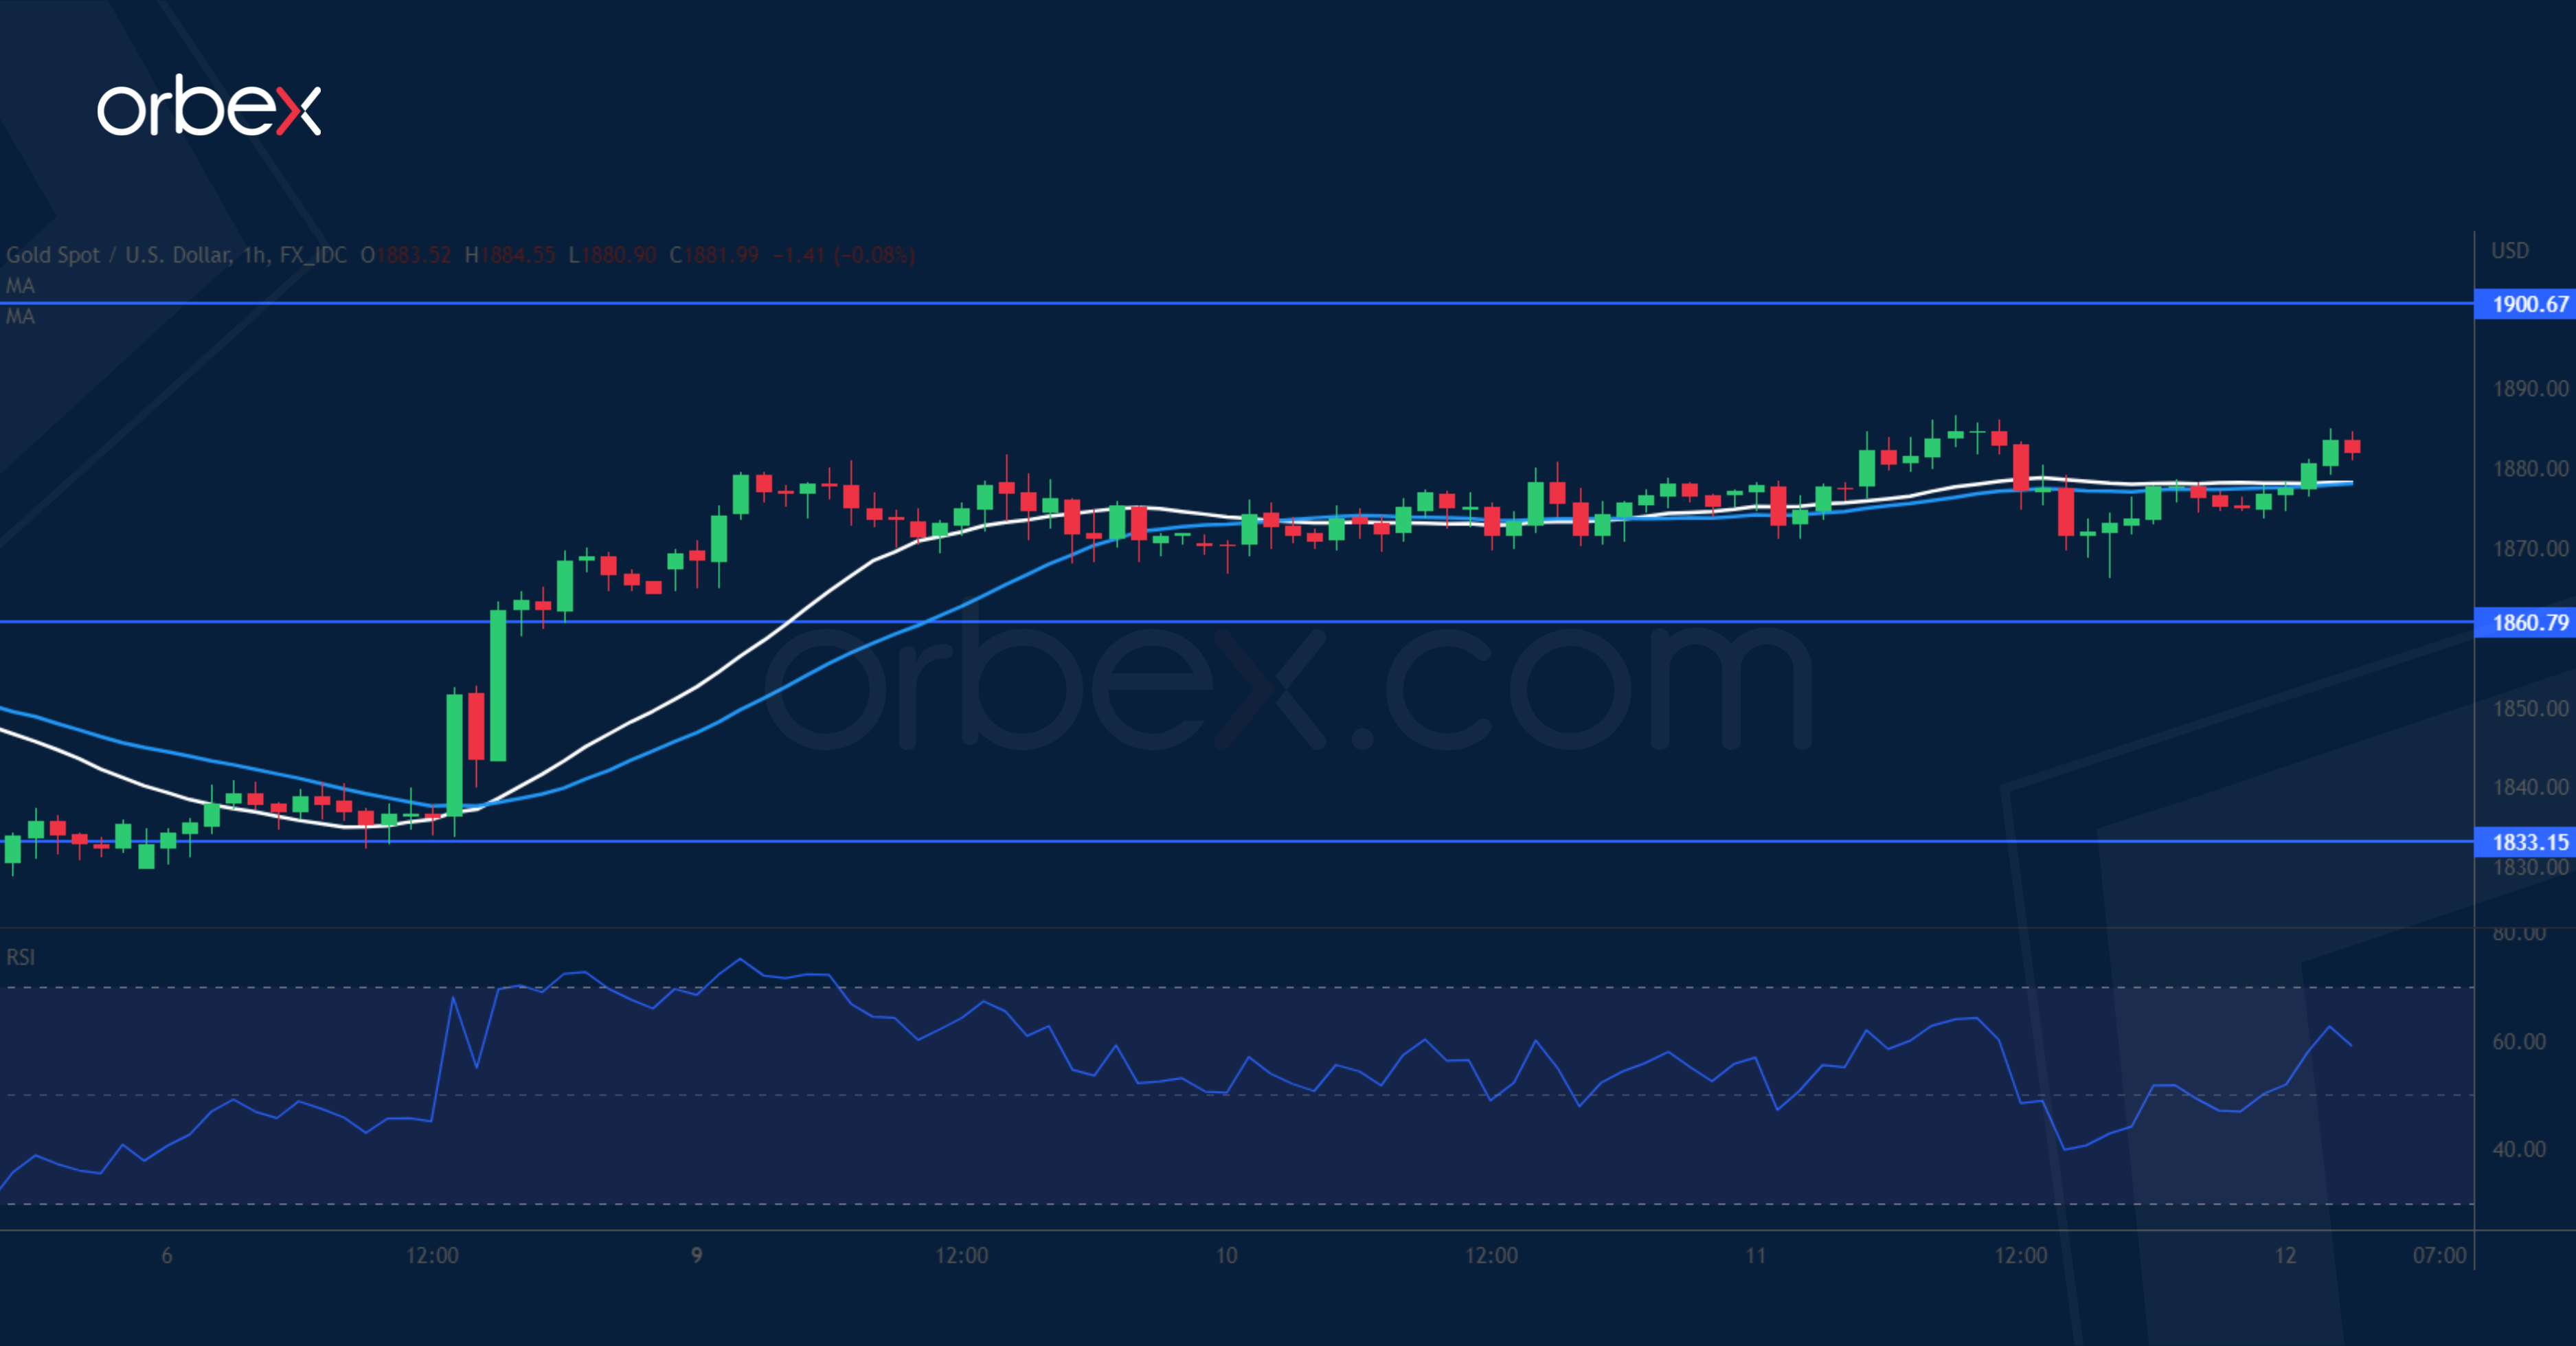
Gold drifts sideways as traders reposition ahead of the US CPI. Following a brief fallback, a new high above 1860 indicates a strong bullish drive. The psychological level of 1900 sits with the start of a sell-off back in May and could act as a key obstacle ahead. The RSI’s repeatedly overbought condition on the daily chart may prompt short-term buyers to take profit, weakening the momentum. The resistance-turned-support at 1860 is the first level to expect follow-ups and 1833 on the 20-day moving average is a critical support.
USD/CHF Claws Back Losses
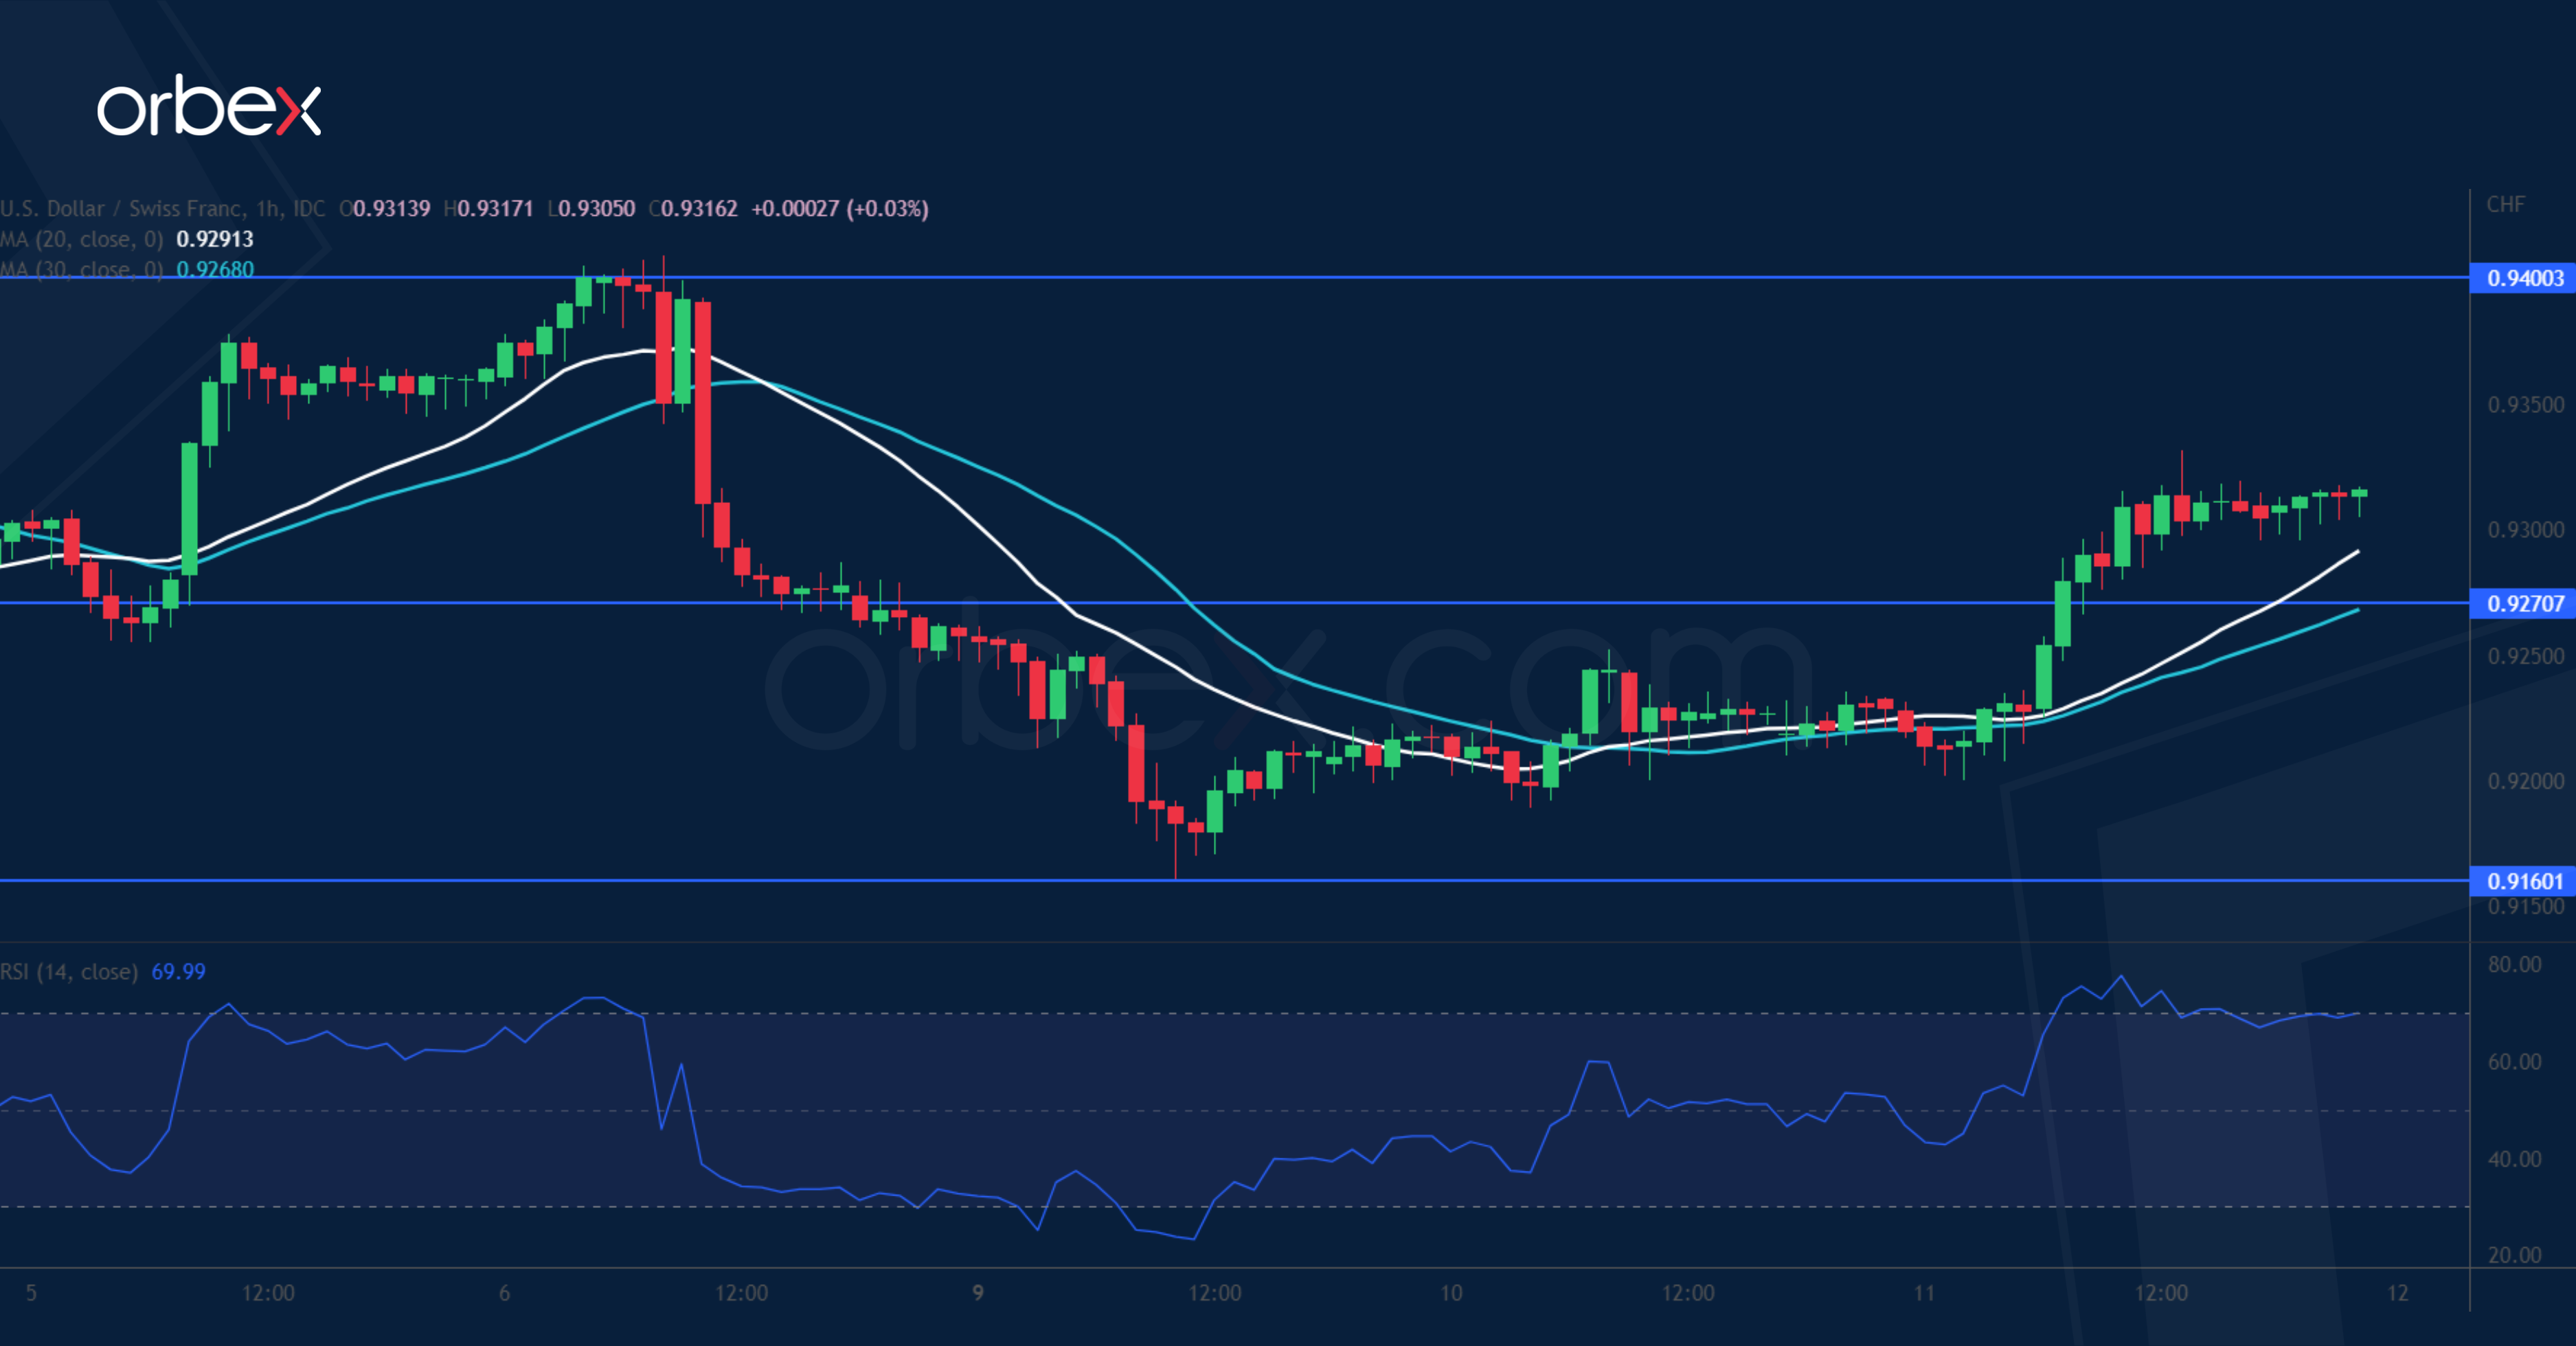
The Swiss franc plunged across the board after a pickup in risk sentiment. After a double top at 0.9400, a drop below 0.9260 had put the bulls in an awkward position. Last March’s lows around 0.9160 has attracted some bargain hunting. Then a close above 0.9270 revealed strong momentum, turning it into a support. Selling pressure could be expected at 0.9400 but a break above this major hurdle could trigger a recovery in the weeks to come. In the meantime, the RSI’s overbought situation may grant a limited pullback.