

Sample Category Title
USD/CHF Daily Outlook
Daily Pivots: (S1) 0.9236; (P) 0.9283; (R1) 0.9362; More...
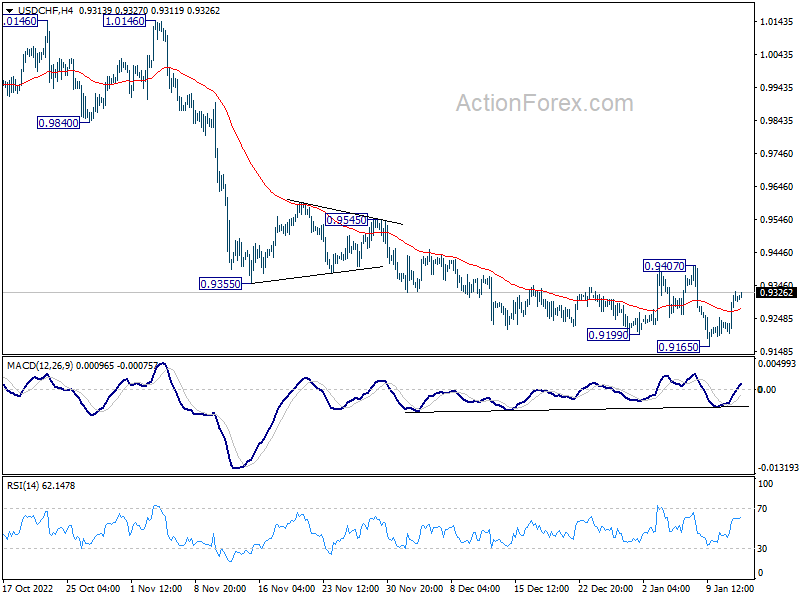
USD/CHF is staying in range of 0.9165/9407 and intraday bias remains neutral. Further decline is still in favor as long as 0.9407 resistance holds. Break of 0.9165 will resume whole fall from 1.0146. However, firm break of 0.9407 will turn bias back to the upside for strong rebound.
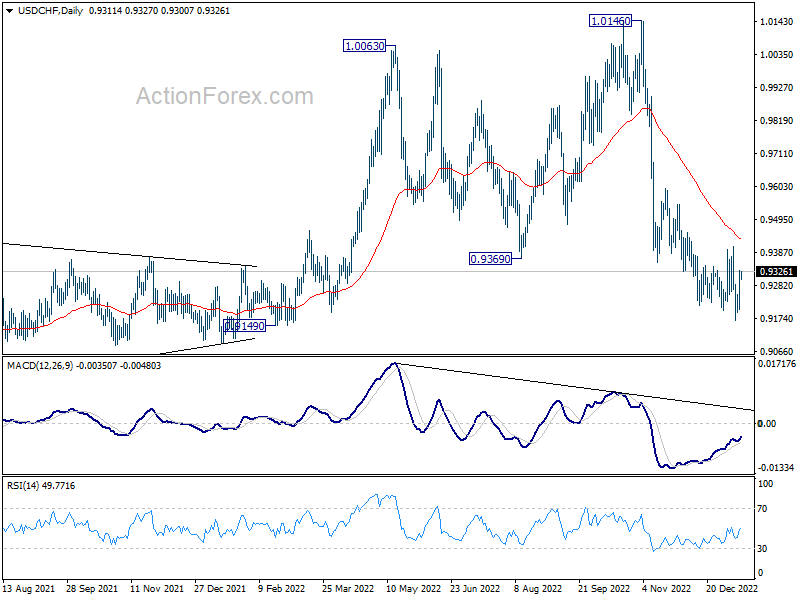
In the bigger picture, rise from 0.8756 (2021 low) has completed at 1.0146, well ahead of 1.0342 long term resistance (2016 high). Based on current downside momentum, fall from 1.0146 should be a medium term down trend itself. Next target is a test on 0.8756 low. Strong support should be seen there to bring rebound. Still, further decline will now be expected as long as 0.9407 resistance holds, in any case.
GBP/USD Daily Outlook
Daily Pivots: (S1) 1.2107; (P) 1.2143; (R1) 1.2184; More...
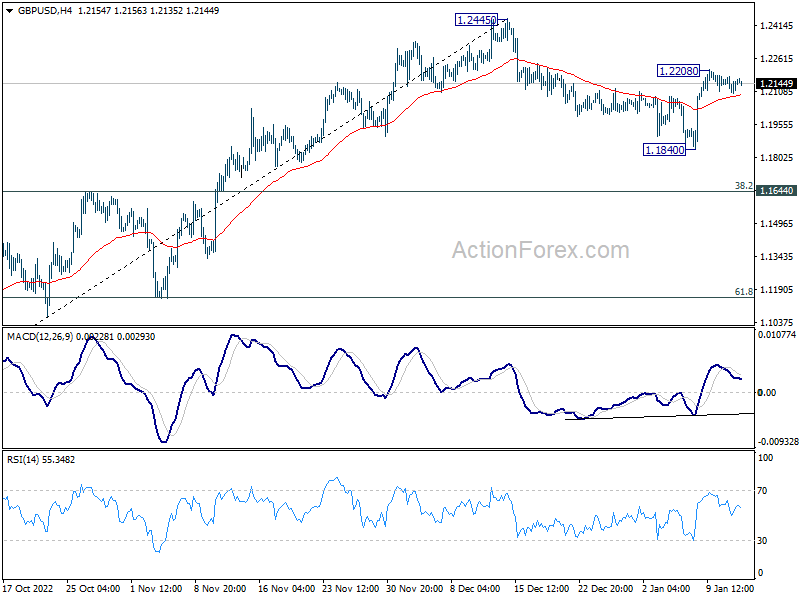
Intraday bias in GBP/USD remains neutral for the moment. On the upside, above 1.2208 will resume the rise to retest 1.2445 high. Decisive break there will resume whole rally from 1.0351 to 1.2759 fibonacci level. Nevertheless, break of 1.1840 will resume the correction from 1.2445 to 38.2% retracement of 1.0351 to 1.2445 at 1.1645.
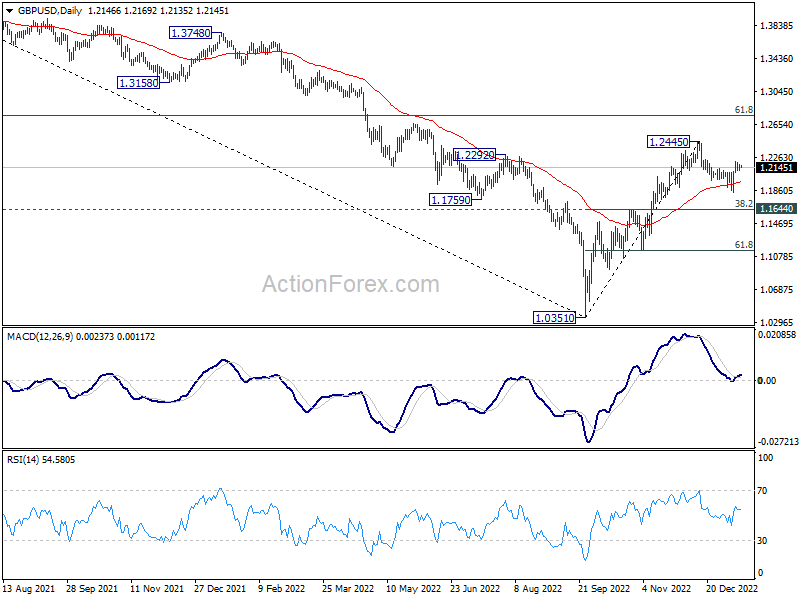
In the bigger picture, rise from 1.0351 medium term bottom is at least correcting whole down trend from 1.4248 (2021 high). Further rise is expected as long as 1.1644 resistance turned support holds. Next target is 61.8% retracement of 1.4248 to 1.0351 at 1.2759. Sustained break there will pave the way back to 1.4248.
Decisive US CPI Report Today
Market movers today
It's finally time for the US CPI, a key data point for the Fed's decision on 1 February of whether to hike by 25bp or 50bp. Lower gasoline and food prices will likely weigh on the headline (0.0%), but services should continue to support core (0.3%). Manheim index signals that used car prices have surprisingly increased modestly, so core goods could have less negative contribution on core than what has been the case over the past couple of months.
US also releases initial jobless claims and the Fed's James Bullard is set to speak at 17.30, CET hence after the CPI release.
The ECB publishes the Monthly Bulletin as well as Consumer Expectations Survey.
In the Nordics we get Norwegian mainland GDP for November and Danish unemployment for December. For more information see the Nordics section.
The 60 second overview
Ahead of US CPI: markets have been in a wait-and-see mode for the majority of the week amid several Fed members pointing to today's CPI release as decisive for whether the Fed will hike policy rates by 25bp or 50bp at the next monetary policy meeting early February. Market sentiment has been slightly tilted towards a low print following a range of data lately suggesting that inflation has peaked. This in turn has contributed to lifting equities and sending both nominal and real rates lower. Markets price roughly 30bp worth of Fed hikes for the upcoming meeting - we still lean towards 50bp - highlighting how a higher inflation print today would have bigger market implications than a low print.
Chinese inflation figures released overnight showed a sharper-than-expected drop in producer prices (heavily commodity driven) while consumer prices accelerated in line with expectations in y/y-terms. Historically, a lower Chinese PPI-CPI inflation differential has coincided with lower global inflationary pressures.
Market moves this morning have been very limited although the majority of the big Asian equity indices have followed their US counterparts into green territory. Oil prices have sustained the rallies from yesterday's session as Brent crude now again trades solidly above USD 80/bbl.
EUR/USD rise: the combination of markets pricing in a lower peak in US policy rates, ECB maintaining a hawkish tone, European natural gas prices having been more than halved over the last month and China re-opening optimism have sent EUR/USD spot almost 3 figures higher over the last week. We highlight that a lot of optimism now seems priced into the single currency which suggests an asymmetric sensitivity to negative news going forward. Our base case still entails a lower EUR/USD when looking 3-6M ahead.
Japan: Overnight the Yomiuri newspaper brought the news that Bank of Japan at next week's policy meeting will review the side-effects of its ultra-easy monetary policy stance as well as recent bond moves. While unconfirmed the news still sent JPY rates higher and USD/JPY lower as markets now put a higher probability of Bank of Japan already next week tweaking its yield-curve control setup further. In December the central bank lifted the cap on the trading range for the 10Y JGB from 25bp to 50bp which marked the beginning to the end for the ultra-easy monetary policy stance which, as the only G10 central bank, Bank of Japan pursued doing 2022. Any change of policy would also be important for global markets as higher JPY yields could return Japanese investors to the domestic market and hence drive an upward pressure on global yields.
FI: Sentiment turned very bullish for bonds yesterday with a dramatic decline in bond yields ahead of the US CPI data for December. Some surveys indicate that market participants expect inflation to come in lower than expected. This should be supportive for the bond market.
FX: EUR found a broad based bid yesterday. Most notably EUR/CHF climbed above parity again, but EUR/JPY rose above 142 and EUR/USD held steady above 1.07. EUR/SEK rose close to 11.30 again.
Credit: The constructive market backdrop returned yesterday where Xover tightened 10bp and Main 2.2bp, closing in 415 and 80bp, respectively. The upbeat sentiment was also visible in primary where new deals were priced at modest new issue concessions.
Nordic macro
Norway. Norwegian growth has held up surprisingly well given the headwinds from strong cost growth, rapid inflation and higher interest rates, and has also been better than predicted by leading indicators. Stronger-than-expected growth in consumption in particular, but also higher business investment and mainland exports, have been the main drivers. We expect much of this picture to be intact in November, and that mainland GDP rose 0.1% m/m.
Denmark. The labour market indicator from Statistics Denmark will provide the first glimpse of unemployment in December. There is not much sign of unemployment actually beginning to rise yet, even though both companies and we expect this will happen soon.
Elliott Wave Suggests FTSE Should Extend Higher
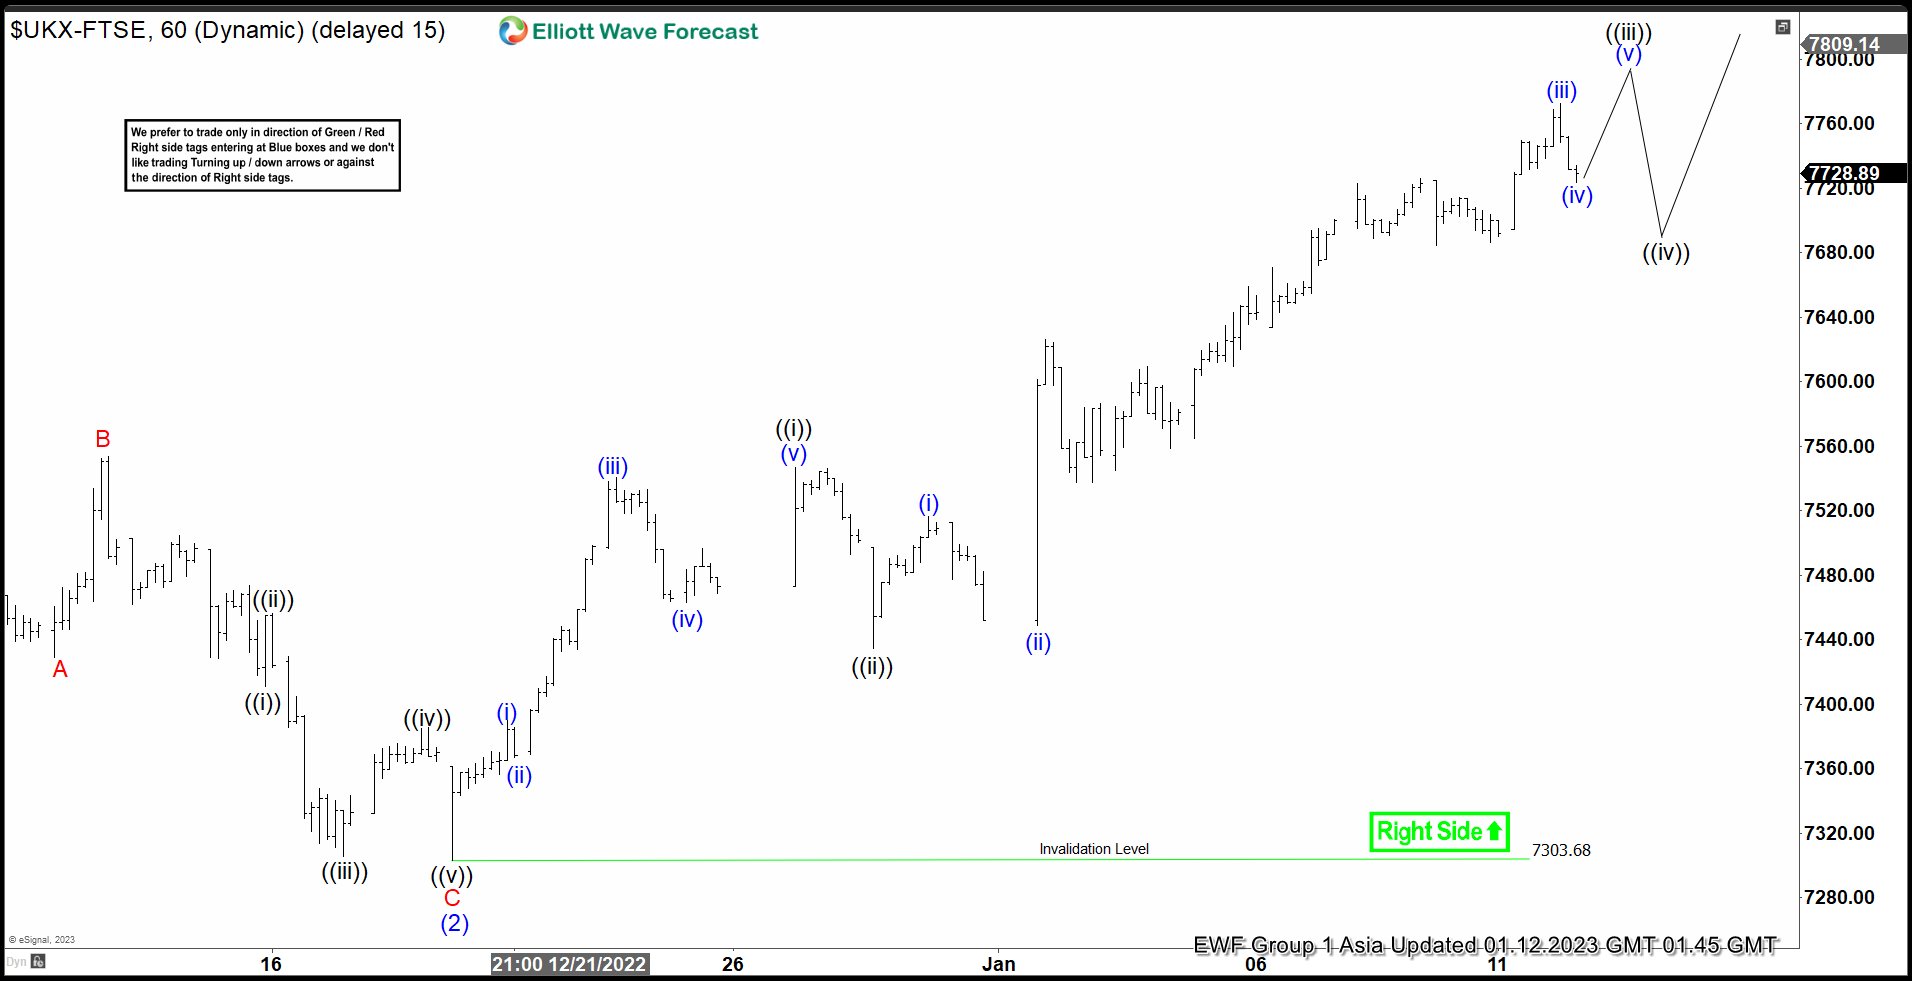
FTSE shows an incomplete bullish sequence from 10.13.2022 low favoring further upside. Up from 10.13.2022 low, rally is unfolding as a 5 waves impulse Elliott Wave structure. Wave (1) ended at 7599.7 and dips in wave (2) ended at 7303.68 as the 1 hour chart below shows. Wave (3) higher is in progress with internal subdivision as another 5 waves in lesser degree. Up from wave (2), wave (i) ended at 7389.92 and wave (ii) ended at 7366.88. Wave (iii) higher ended at 7540.31 and pullback in wave (iv) ended at 7462.80. Final leg wave (v) ended at 7547 and this completed wave ((i)). Pullback in wave ((ii)) ended at 7434.64.
Up from there, wave (i) ended at 7516.36 and pullback in wave (ii) ended at 7448.69. Index then rallies higher in wave (iii) towards 7772.37 and wave (iv) is either completed or expected to complete soon. Index should rally higher 1 more leg to end wave (v) and this should complete wave ((iii)) in higher degree. Afterwards, expect a pullback in wave ((iv)) to correct cycle from 12.29.2022 low before the rally resumes. As far as pivot at 7303.68 low stays intact, expect pullback to find support in 3, 7, or 11 swing for further upside.
FTSE 60 Minutes Elliott Wave Chart
EUR/USD Daily Outlook
Daily Pivots: (S1) 1.0730; (P) 1.0753; (R1) 1.0780; More...
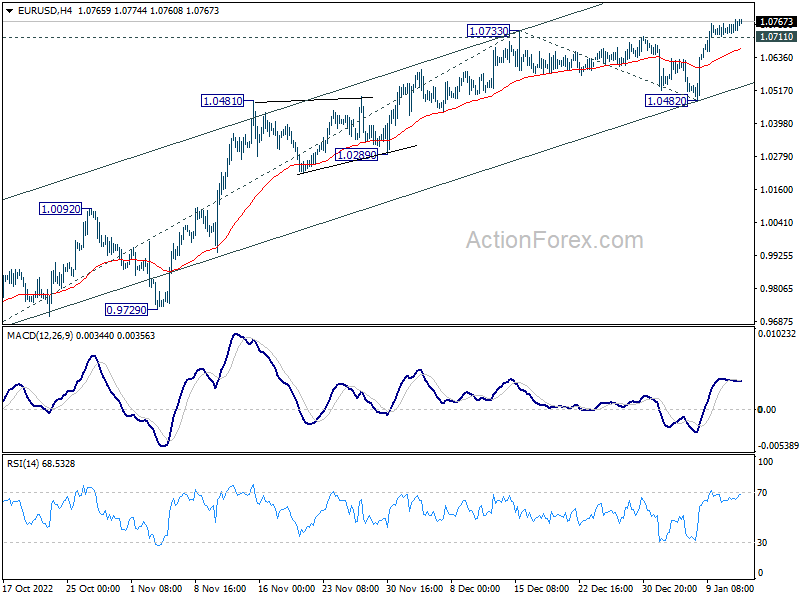
Intraday bias in EUR/USD remains on the upside despite some loss of upside momentum. Current rally from 0.9534 would target 61.8% projection of 0.9630 to 1.0733 from 1.0482 at 1.1164. On the downside, below 1.0711 minor support will turn intraday bias neutral again first. But near term outlook will stay bullish as long as 1.0482 support holds, in case of retreat.
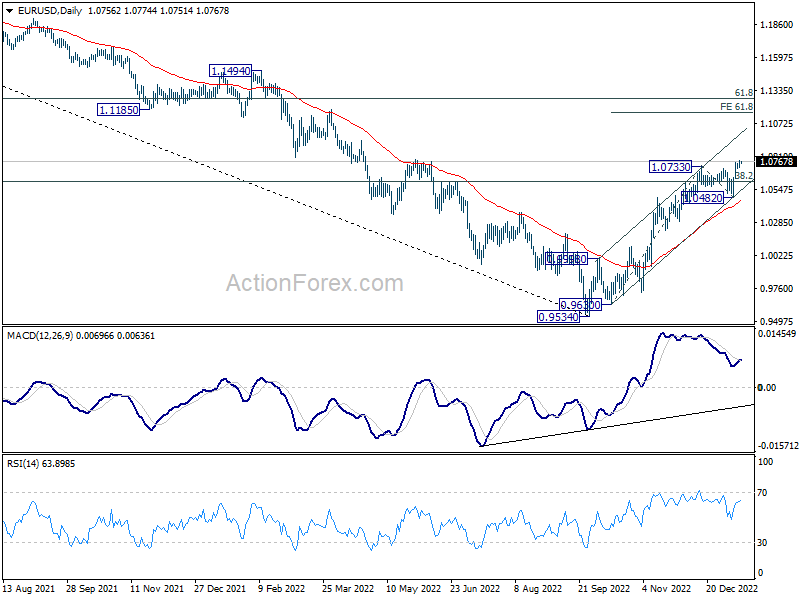
In the bigger picture, focus stays on 38.2% retracement of 1.2348 (2021 high) to 0.9534 at 1.0609. Rejection by 1.0609 will suggest that price actions from 0.9534 medium term bottom are developing into a corrective pattern. Thus, medium bearishness is retained for another fall through 0.9534 at a later stage. However, sustained break of 1.0609 will raise the chance of trend reversal and target 61.8% retracement at 1.1273.
Dollar Down But Not Out Yet as CPI Awaited
At this point so far, Euro is the strongest one for the week, while Swiss Franc is the weakest, thanks to the upside breakout and rally yesterday. Dollar is more on the soft side too but there is still no clear follow through selling after the decline on Monday. Apparently, traders are still holding their bets, and await today's US consumer inflation data. Clear deceleration in both headline and core CPI is expected, which should give a nod to a smaller 25bps hike by Fed in February.
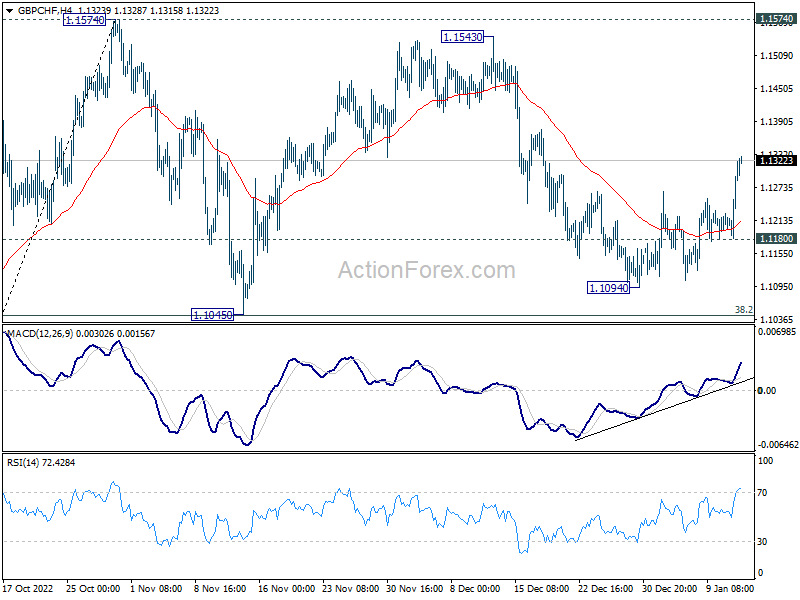
Technically, following up on GBP/CHF, after yesterday's rise, corrective pattern from 1.1574 should have completed with three waves to 1.1094. Further rally is now expected as long as 1.1180 support holds. Retest of 1.1543/74 resistance zone should be seen next. With EUR/GBP struggling to break through 0.8876 resistance firmly, current moves in European majors are more about Swiss Franc's own weakness.
In Asia, at the time of writing, Nikkei is up 0.05%. Hong Kong HSI is down -0.30%. China Shanghai SSE is down -0.16%. Singapore Strait Times is down -0.45%. Japan 10-year JGB yield is up 0.0039 at 0.510. Overnight, DOW rose 0.80%. S&P 500 rose 1.28%. NASDAQ rose 1.76%. 10-year yield dropped -0.067 to 3.554.
Fed Collins: I'd lean to 25 for Feb meeting
Boston Fed President Susan Collins said in a New York Times interview that "25 or 50 would be reasonable " for rate hike in February. She added, "I'd lean at this stage to 25, but it's very data-dependent."
"Adjusting slowly gives more time to assess the incoming data before we make each decision, as we get close to where we're going to hold. Smaller changes give us more flexibility," she said.
ECB de Cos: We plan to continue increasing interest rates significantly in the next meetings
Governing Council member Pablo Hernandez De Cos said yesterday, "we plan to continue increasing interest rates significantly in the next meetings." Also, tightening will continue "until reaching sufficiently restrictive levels to ensure that the inflation returns to the 2% target over the medium term."
"Keeping interest rates at tight levels will reduce inflation by dampening demand and will also protect against the risk of a persistent upward shift in inflation expectations", he explained.
De Cos also noted that Since last meeting, markets have raised the expected terminal rate by 30bps to 3.4%. However, market rates incorporated a positive premium, and "the market's genuine expectation of what the maximum level of the deposit facility rate would be is somewhat below that figure."
On the data front
New Zealand building permits rose 7.0% mom in November. Australia trade surplus widened to AUD 13.2B in November, above expectation of AUD 11.3B. Japan bank lending rose 2.7% yoy in December, current account reported surplus of JPY 1.92T in November. China CPI rose to 1.8% yoy in December while PPI rose to -0.7% yoy.
Looking ahead, US CPI is the main focus today while jobless claims will also be released.
EUR/USD Daily Outlook
Daily Pivots: (S1) 1.0730; (P) 1.0753; (R1) 1.0780; More...
Intraday bias in EUR/USD remains on the upside despite some loss of upside momentum. Current rally from 0.9534 would target 61.8% projection of 0.9630 to 1.0733 from 1.0482 at 1.1164. On the downside, below 1.0711 minor support will turn intraday bias neutral again first. But near term outlook will stay bullish as long as 1.0482 support holds, in case of retreat.
In the bigger picture, focus stays on 38.2% retracement of 1.2348 (2021 high) to 0.9534 at 1.0609. Rejection by 1.0609 will suggest that price actions from 0.9534 medium term bottom are developing into a corrective pattern. Thus, medium bearishness is retained for another fall through 0.9534 at a later stage. However, sustained break of 1.0609 will raise the chance of trend reversal and target 61.8% retracement at 1.1273.
Economic Indicators Update
| GMT | Ccy | Events | Actual | Forecast | Previous | Revised |
|---|---|---|---|---|---|---|
| 21:45 | NZD | Building Permits M/M Nov | 7.00% | -10.70% | ||
| 23:50 | JPY | Bank Lending Y/Y Dec | 2.70% | 2.80% | 2.70% | |
| 23:50 | JPY | Current Account (JPY) Nov | 1.92T | 0.65T | -0.61T | |
| 00:30 | AUD | Trade Balance (AUD) Nov | 13.20B | 11.30B | 12.22B | 12.74B |
| 01:30 | CNY | CPI Y/Y Dec | 1.80% | 1.80% | 1.60% | |
| 01:30 | CNY | PPI Y/Y Dec | -0.70% | -0.10% | -1.30% | |
| 05:00 | JPY | Eco Watchers Survey: Current Dec | 47.9 | 47.8 | 48.1 | |
| 09:00 | EUR | ECB Economic Bulletin | ||||
| 13:30 | USD | Initial Jobless Claims (Jan 6) | 210K | 204K | ||
| 13:30 | USD | CPI M/M Dec | 0.00% | 0.10% | ||
| 13:30 | USD | CPI Y/Y Dec | 6.50% | 7.10% | ||
| 13:30 | USD | CPI Core M/M Dec | 0.30% | 0.20% | ||
| 13:30 | USD | CPI Core Y/Y Dec | 5.70% | 6.00% | ||
| 15:30 | USD | Natural Gas Storage | -15B | -221B |
What Does the CPI Have in Store?
On January 12, the Bureau of Statistics will publish the figures for the Consumer Price Index (CPI), a key index for determining interest rates. While we await the release, experts forecast a decline in the CPI data, a hint at weaker Dollar values in the global markets. According to the analysts' expectations, the CPI m/m will decline from 0.1% to -0.1%, whereas the CPI y/y is expected to fall to 6.5% against the 7.1% in November. However, Core CPI is expected to rise by 0.1% from the 0.2% previous result.
With this in mind, it would be crucial to evaluate the current inclinations of the markets from a technical point of view ahead of these releases.
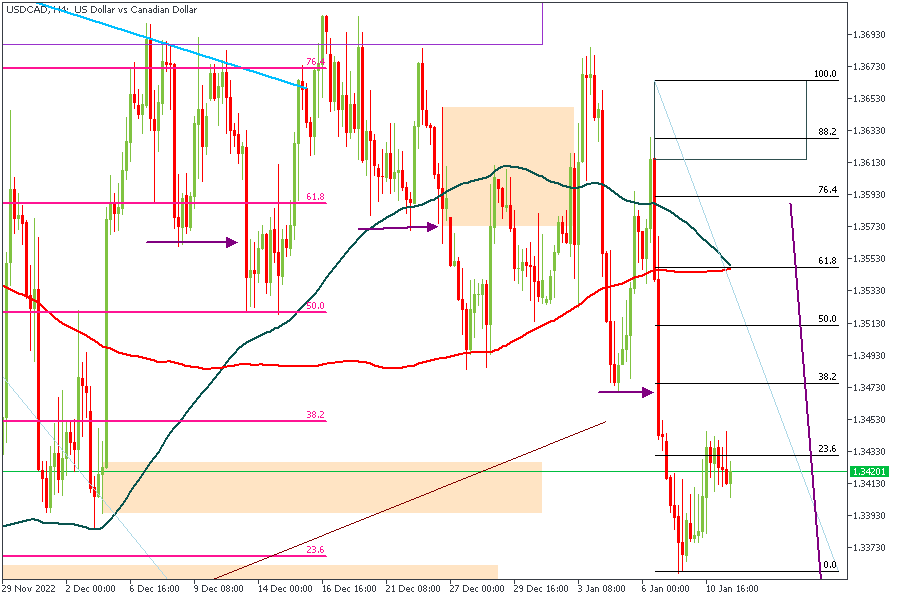
USDCAD
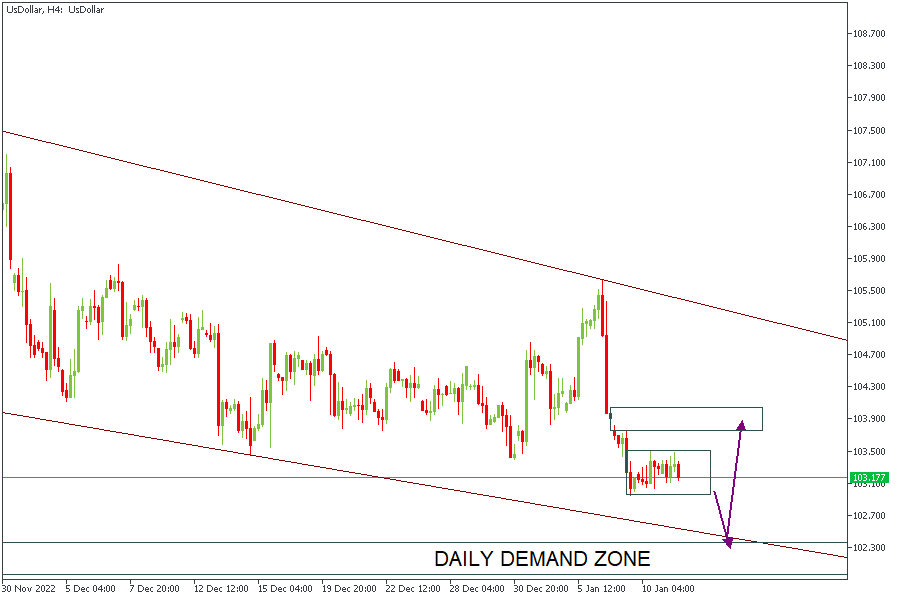
Based on the US Dollar index chart's current ranging behavior despite an overall bearish outlook. With a bullish correction, I expect the price to seize the opportunity to complete a much more robust retracement into my Fibonacci kill zone. Afterward, we could see the price decline further below the recent low.
The Fibonacci retracement levels, Moving Averages, and a rally-base-drop supply zone are added confirmations for this bias.
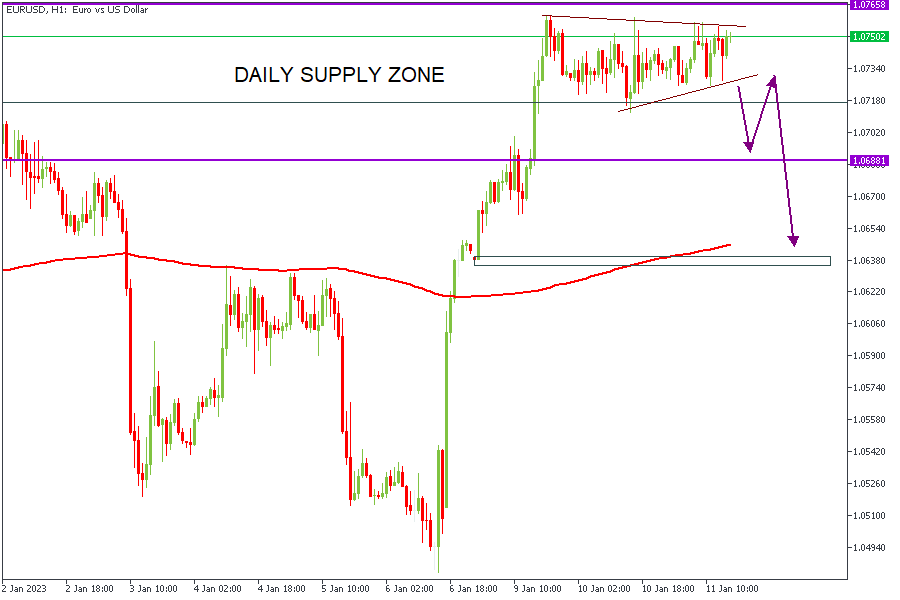
EURUSD
EURUSD is currently trading within a supply zone on the Daily timeframe. However, it is consolidating within a wedge. If the actual CPI release follows the expected figures, the USD will weaken. I plan to take buy entries off the 200-SMA on the hourly timeframe.
The 200-SMA, pivot zone, and rally-base-rally demand zone are my confluences.
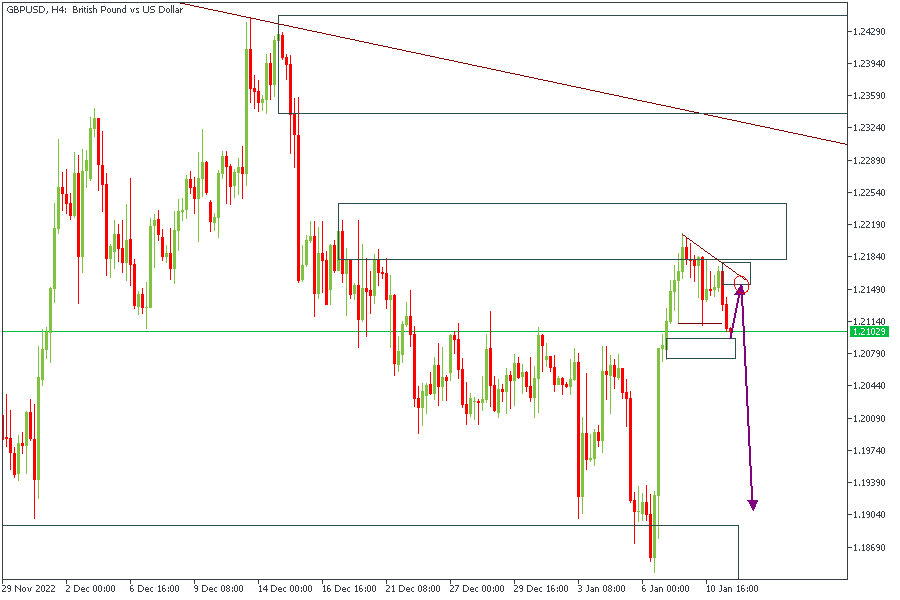
GBPUSD
GBPUSD may experience some initial decline as a correction of the recent bullish structure break. It would mean we likely see GBPUSD slide to the 76.4% bullish impulse, an added confirmation to the demand zone.
USDJPY
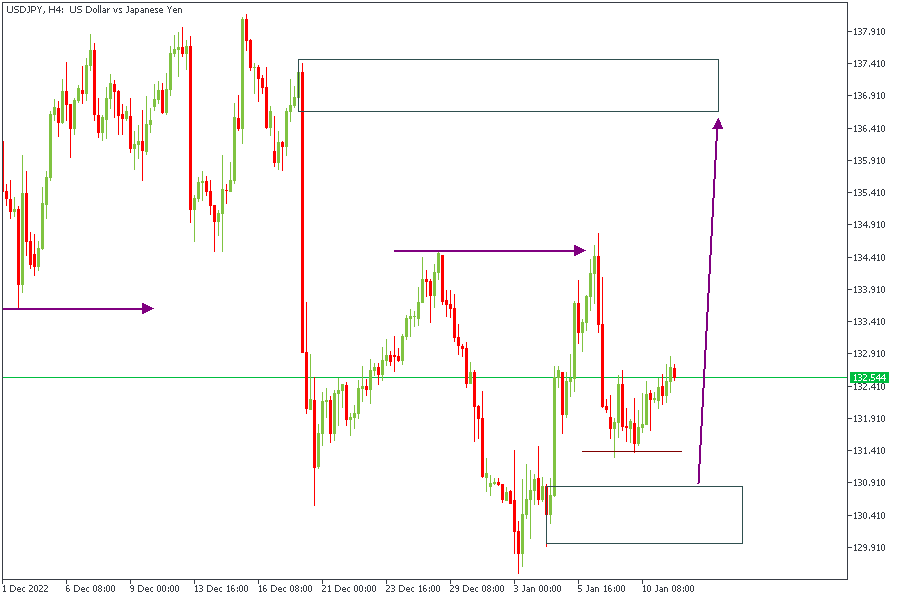
USDJPY has had an overall bearish outlook for over a week now. However, I am still waiting for the price to tap into the supply zone I marked at the top of the chart. For the price to get there, though, there should be an initial bullish correction to create a conducive retracement before the drop.
The rally-base-drop supply zone, equal-high liquidity grab, and Fibonacci kill zone are my major confluences for this trade.
XAUUSD (GOLD)
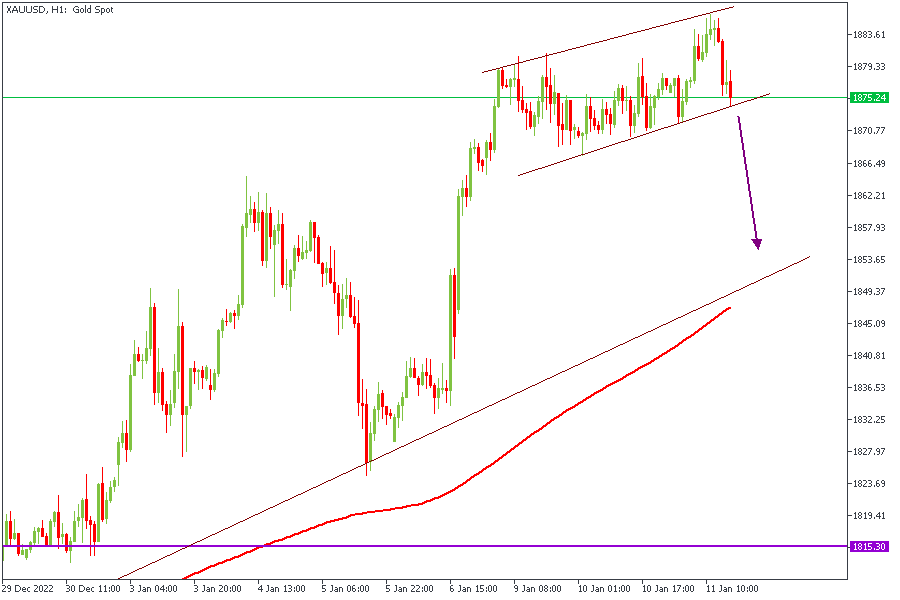
It will likely be the primary focus of many traders during the fundamental release. My chips favor the price reaching down to the 200-SMA + trendline support, as shown on the chart.
The bullish break of structure, rally-base-rally demand zone, and the Fibonacci 200-SMA are my confluences for this trade.
CONCLUSION
The views above are solely based on technical Analysis techniques using my Smart Money approach. Hence, it is essential to understand that the trading of CFDs comes at a risk. If properly managed, you may retain all of your trading capital. To avoid costly mistakes while you look to trade these opportunities, be sure to do your due diligence and manage your risk appropriately. You can access more of such trade ideas and prompt market updates on the telegram channel.
Technical Outlook and Review
USD/JPY:
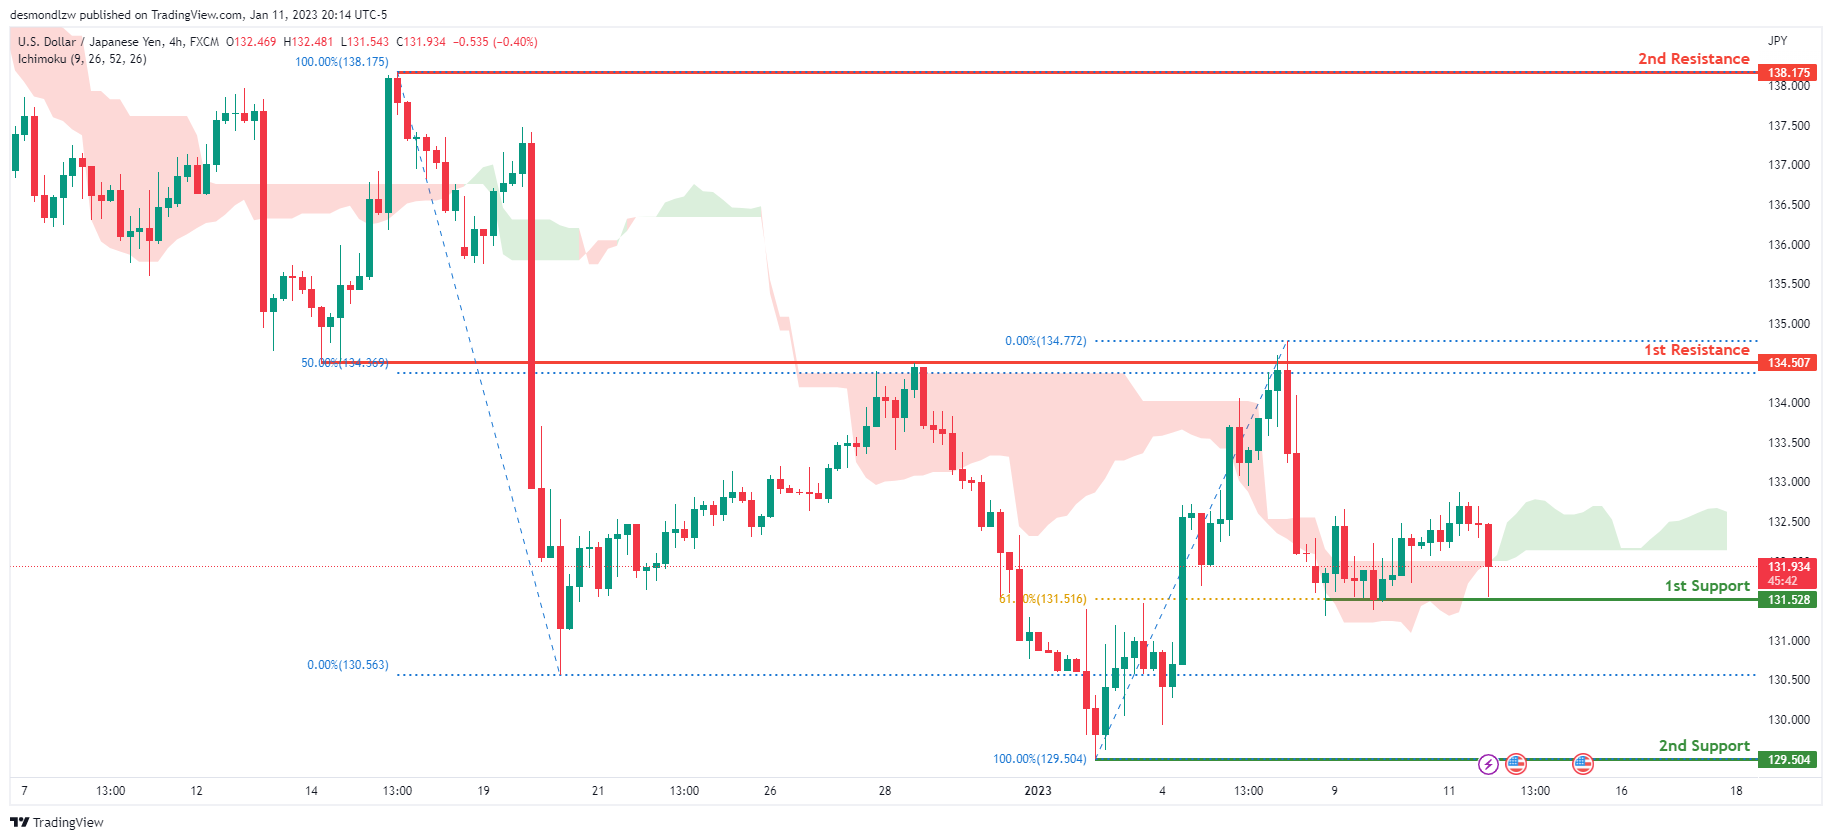
Looking at the H4 chart, my overall bias for USDJPY is bullish due to the current price being above the Ichimoku cloud, indicating a bullish market. If this bullish momentum continues, expect the price to possibly head back up towards the 1st resistance level at 134.507, where the 50% Fibonacci line is. In an alternate scenario, price could possibly break the 1st support at 131.528, where the 61.8% Fibonacci line is, before heading towards the 2nd support at 129.504, where the previous swing low is.
Areas of consideration:
- H4 time frame, 1st resistance at 134.507
- H4 time frame, 1st support at 131.528
- H4 time frame, 2nd support at 129.504
DXY:
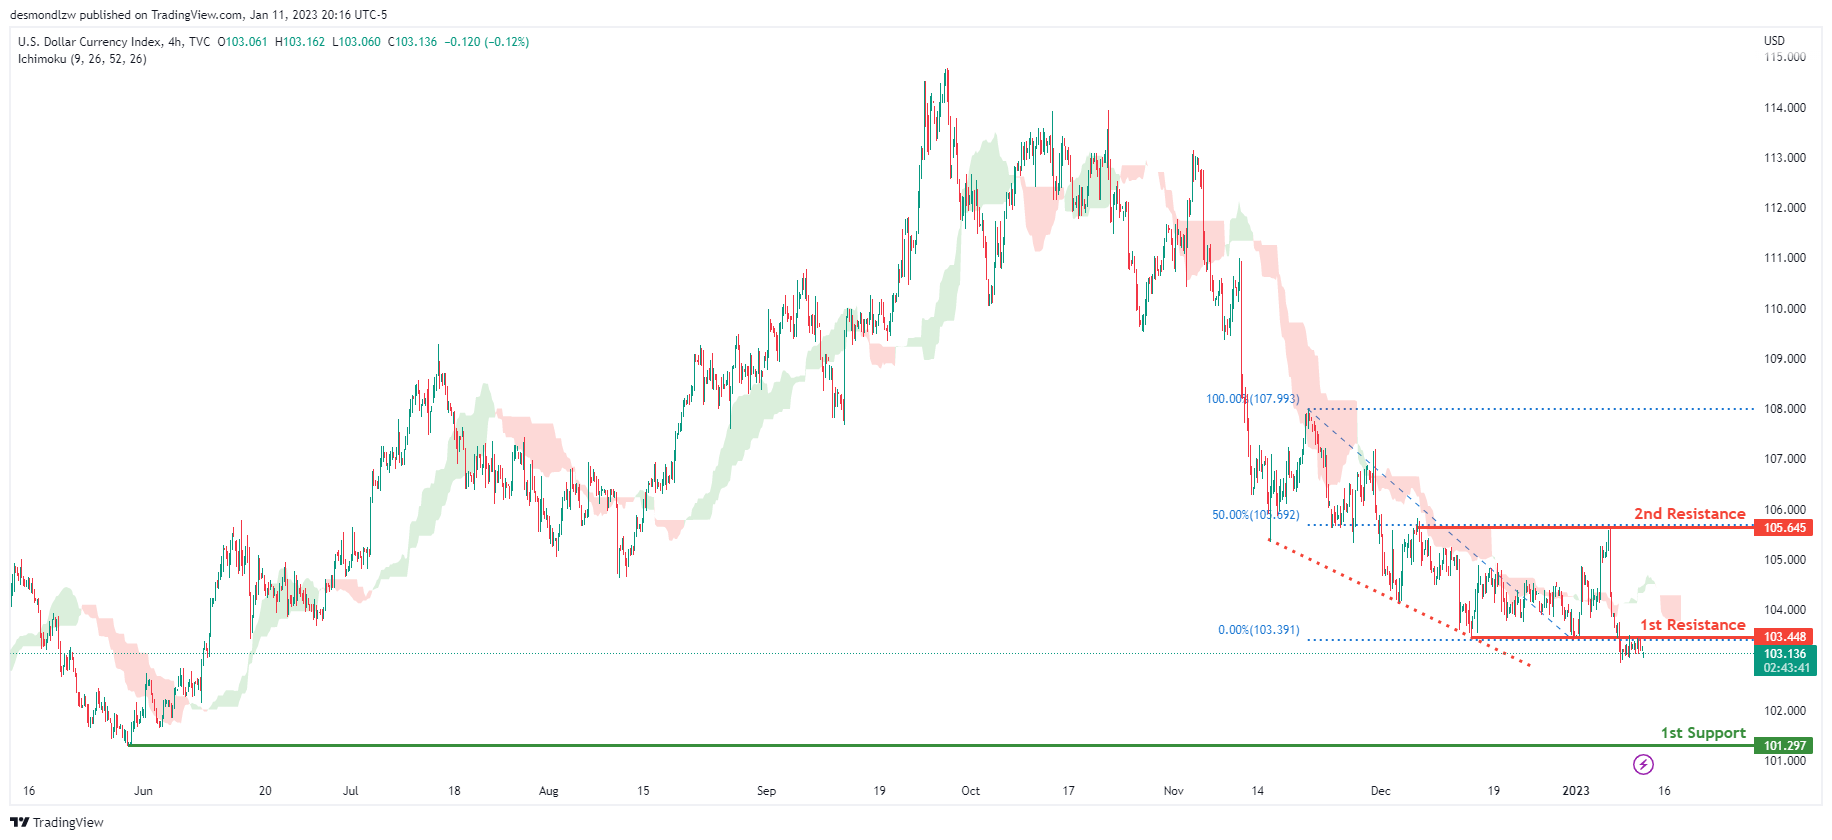
Looking at the H4 chart, my overall bias for DXY is bearish due to the current price being below the Ichimoku cloud, indicating a bearish market. To add confluence to this, price is along a descending trend line which indicates a bearish market. If this bearish momentum continues, expect the price to possibly continue heading towards the 1st support at 101.297, where the previous lows and liquidity hotspots are. In an alternative scenario, price could head back up to retest the 1st resistance at 103.448, where the previous low is.
Areas of consideration:
- H4 time frame, 1st resistance at 103.448
- H4 time frame, 1st support at 101.297
EUR/USD:
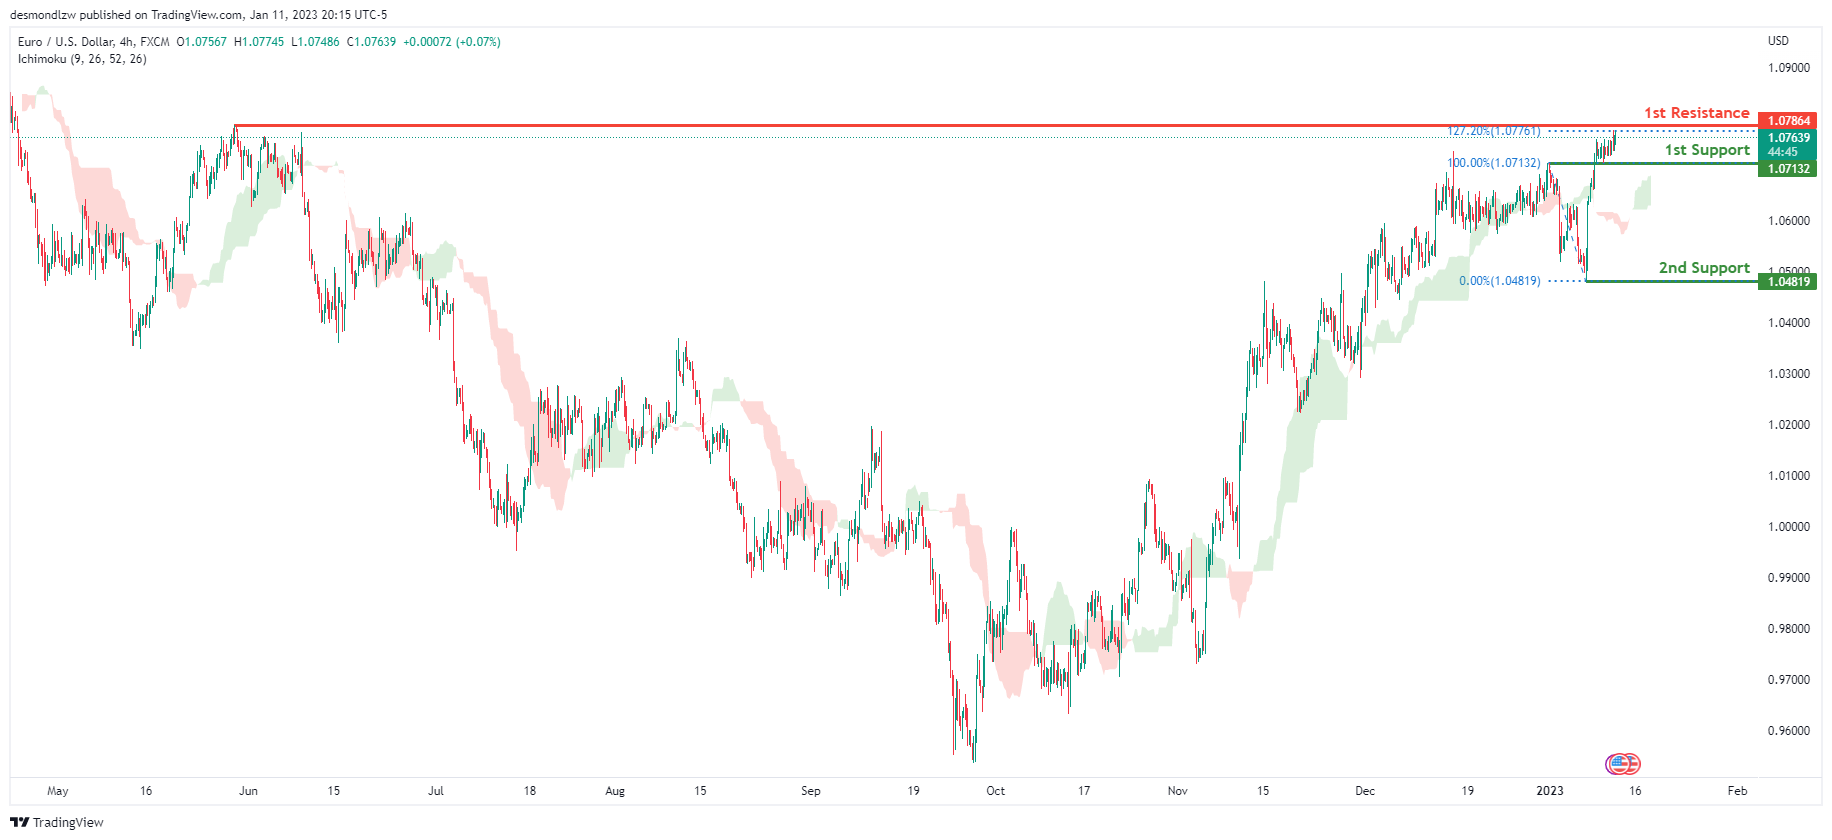
Looking at the H4 chart, my overall bias for EURUSD is bullish due to the current price being above the Ichimoku cloud, indicating a bullish market structure. If this bullish momentum continues, expect the price to possibly continue heading towards the 1st resistance at 1.07864, where the previous swing high is. In an alternate scenario, price could possibly head back down to retest the 1st support level at 1.07132, where the previous swing high is.
Areas of consideration :
- H4 1st resistance at 1.07864
- H4 1st support at 1.07132
GBP/USD:
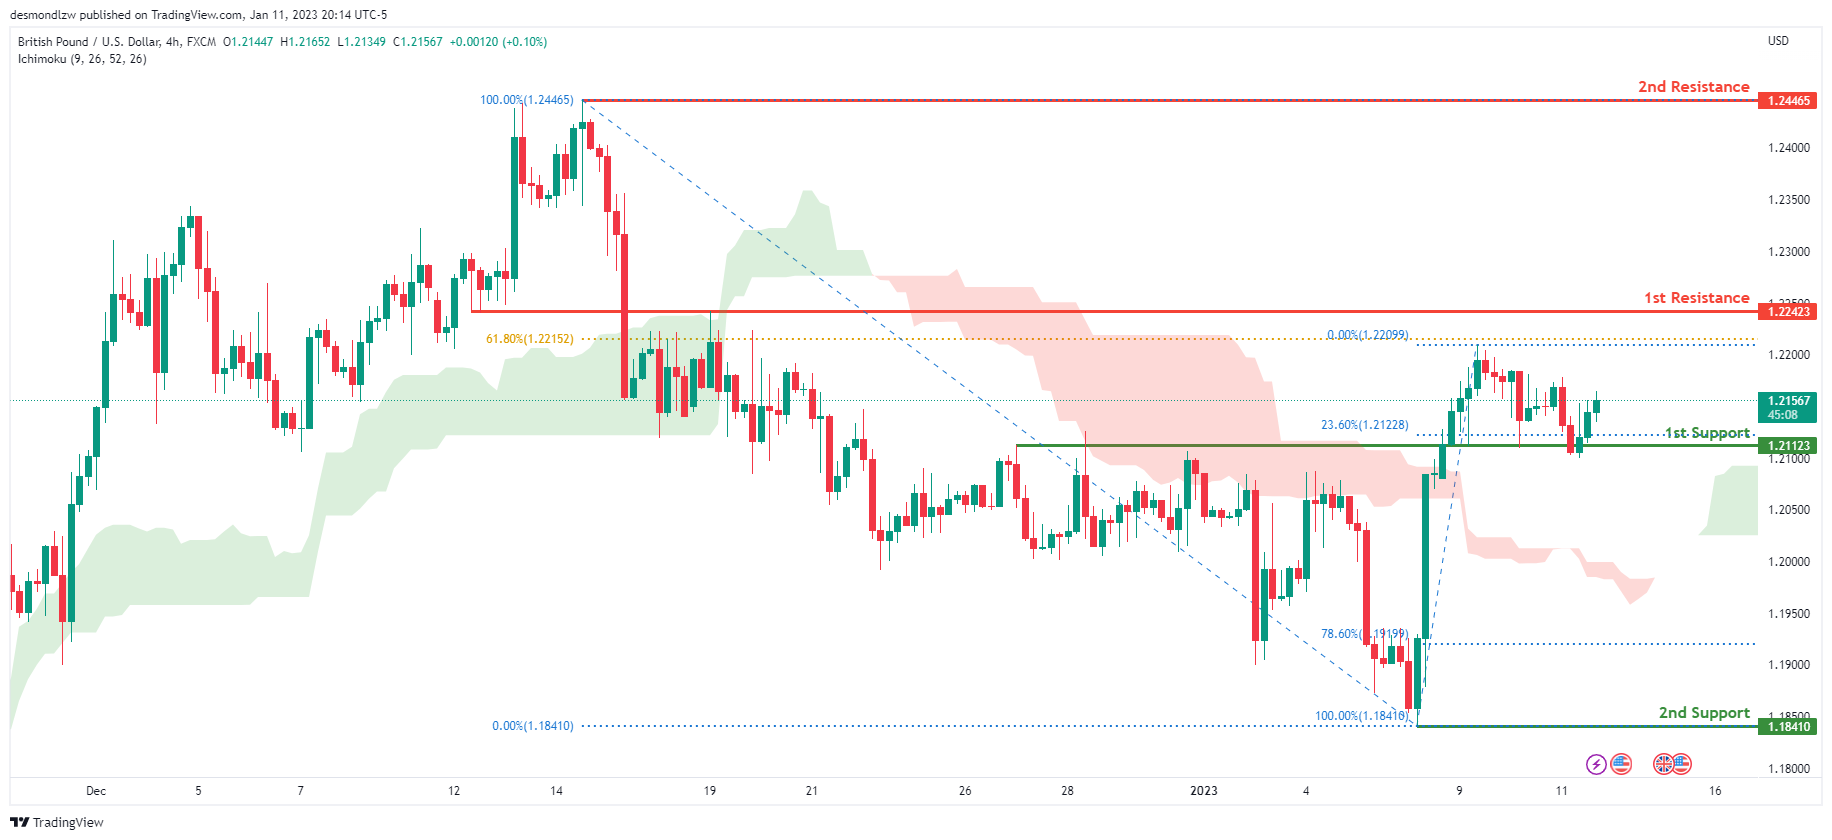
Looking at the H4 chart, my overall bias for GBPUSD is bullish due to the current price being above the Ichimoku cloud, indicating a bullish market. If this bullish momentum continues, expect price to possibly continue heading towards the 1st resistance line at 1.22423, slightly above where the 61.8% Fibonacci line is. In an alternate scenario, price could possibly head back down towards the 1st support at 1.21123, where the 23.6% Fibonacci line is
Areas of consideration:
- H4 1st resistance at 1.22423
- H4 1st support at 1.21068
USD/CHF:
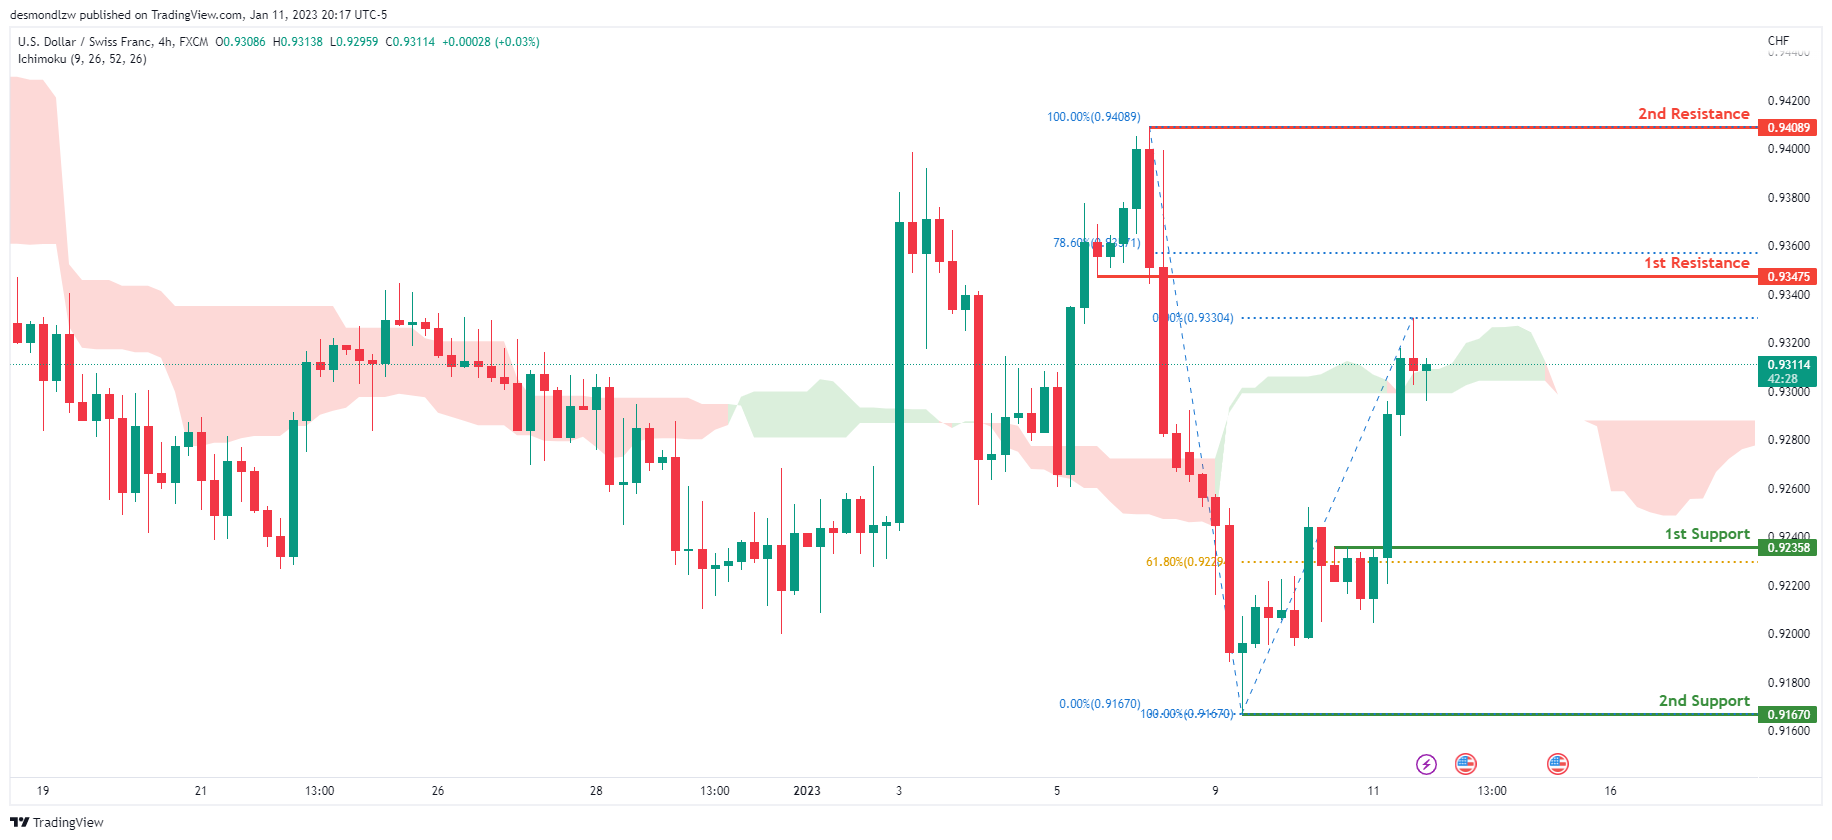
Looking at the H4 chart, my overall bias for USDCHF is bullish due to the current price being above the Ichimoku cloud, indicating a bullish market. If the current bullish trend continues, expect the price to head towards the 1st resistance at 0.93475, where the 78.6% Fibonacci line is. In an alternative scenario, price could possibly head back down to retest the 1st support at 0.92358, where the 61.8% Fibonacci line is.
Areas of consideration
- H4 1st support at 0.92358
- H4 1st resistance at 0.93475
XAU/USD (GOLD):
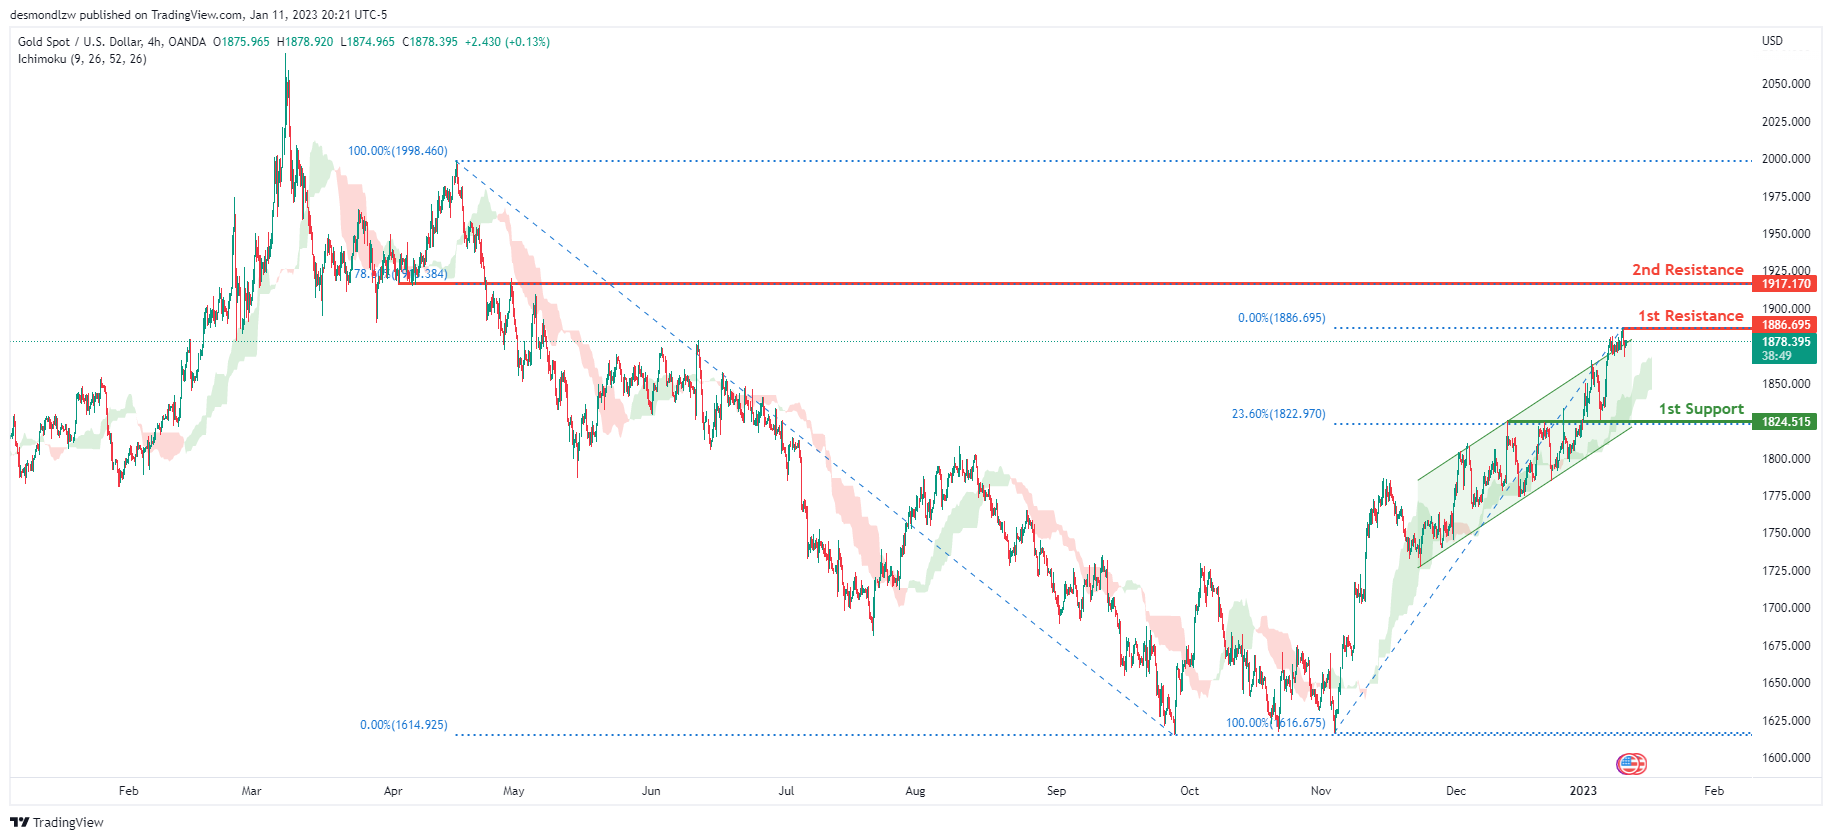
Looking at the H4 chart, my overall bias for XAUUSD is bullish due to the current price crossing above the Ichimoku cloud, indicating a bullish market. To add support to this bias, price has also broken above the bullish ascending channel. If this bullish momentum continues, expect the price to possibly break the 1st resistance at 1886.695 where the recent high is, before heading towards the 2nd resistance at 1917.170, where the 78.6% Fibonacci line is. In an alternative scenario, price could possibly head back down towards the 1st support at 1824.515, where the 23.6% Fibonacci line is.
Areas of consideration:
- H4 time frame, 1st resistance at 1886.695
- H4 time frame, 2nd resistance at 1917.170
- H4 time frame, 1st support at 1824.515
- H4 time frame, 2nd support at 1833.445
AUD/USD:
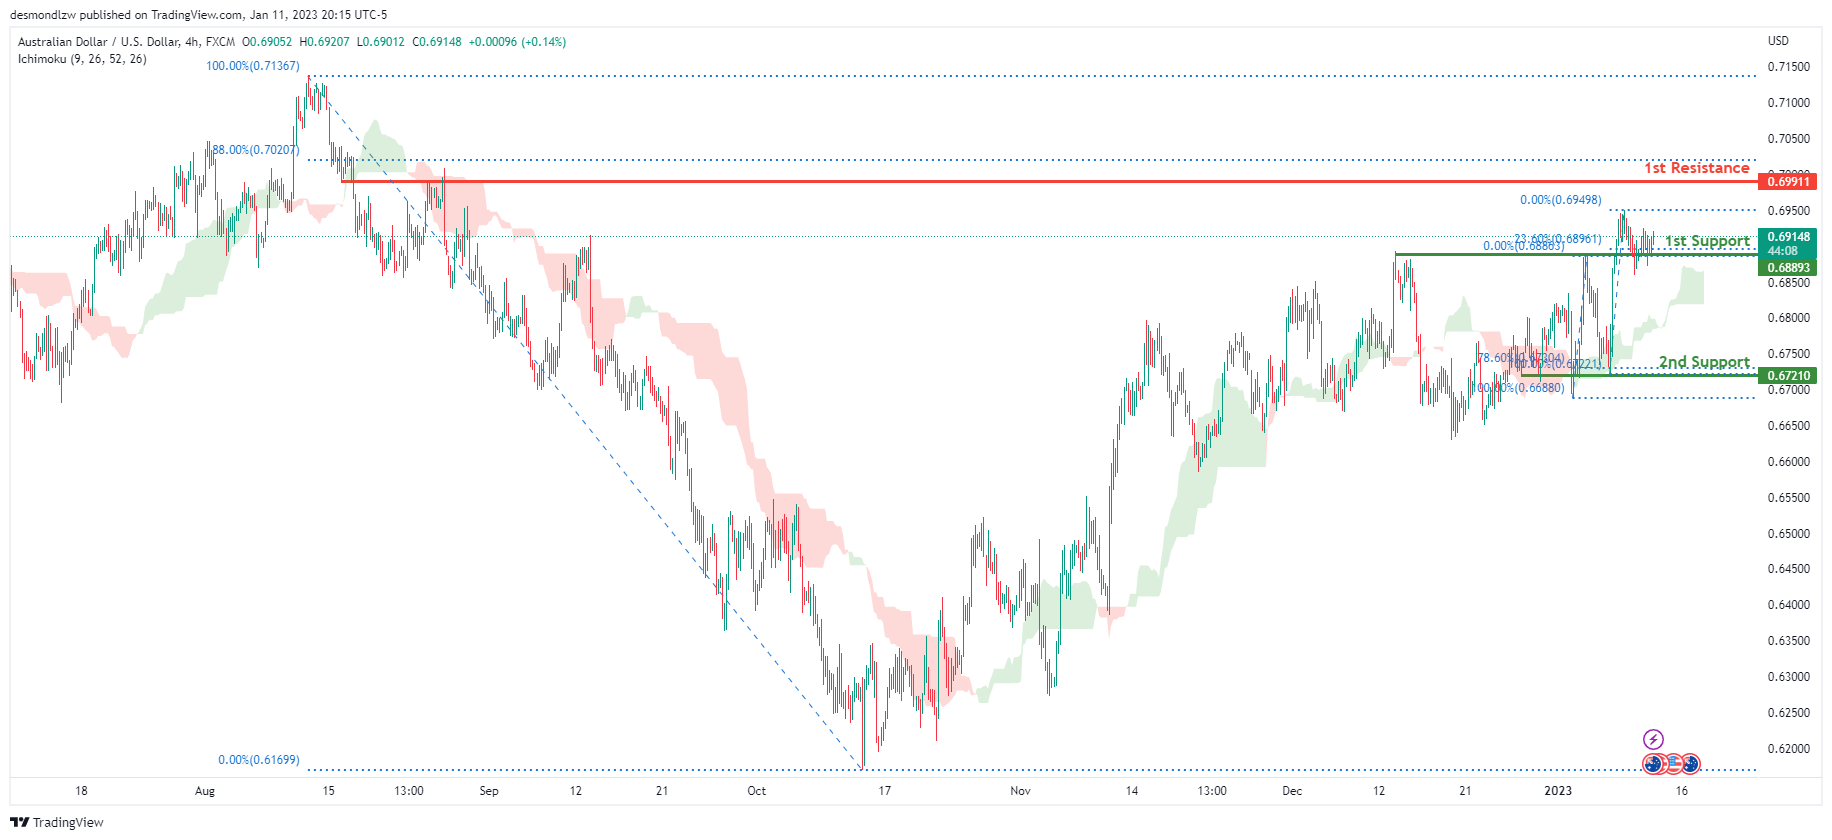
Looking at the H4 chart, my overall bias for AUDUSD is bullish due to the current price being above the Ichimoku cloud, indicating a bullish market. If this bullish momentum continues, expect the price to continue heading towards the 1st resistance at 0.69911, where the 88% Fibonacci line is. In an alternative scenario, price could possibly head back down towards the 1st support at 0.68893, where the 23.6% Fibonacci line is.
Areas of consideration
- H4, 1st resistance at 0.69911
- H4, 1st support at 0.68893
NZD/USD:
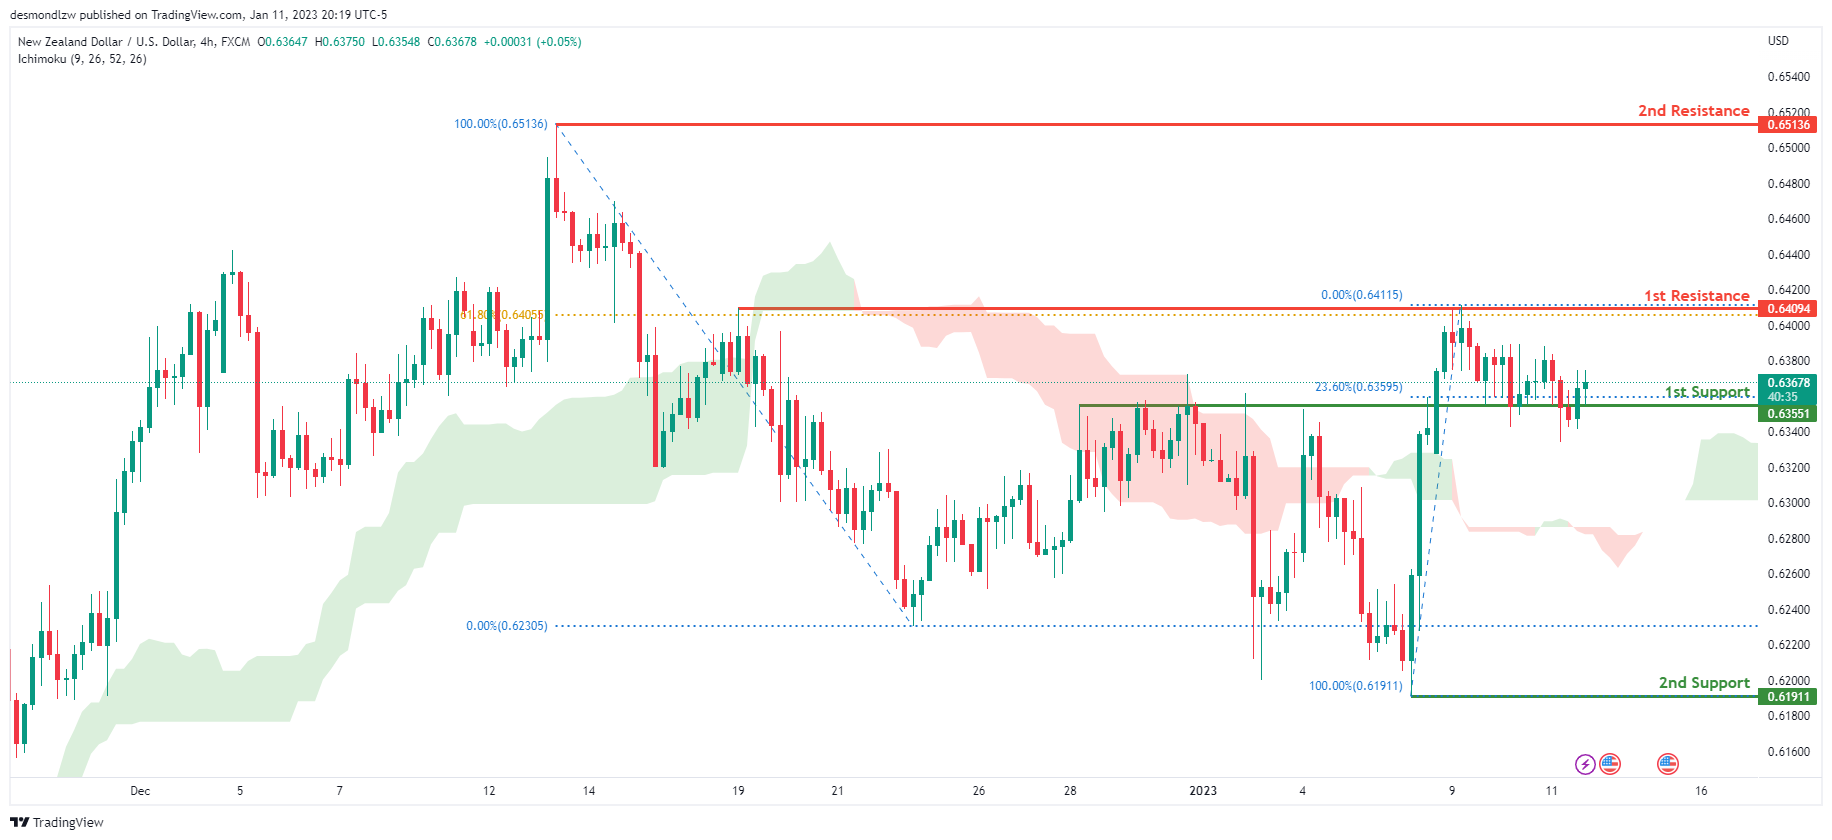
Looking at the H4 chart, my overall bias for NZDUSD is bullish due to the current price being above the Ichimoku cloud, indicating a bullish market. If this bullish momentum continues, expect price to possibly continue heading towards the 1st resistance at 0.64094, where the 61.8% Fibonacci line is. In an alternate scenario, price could possibly head back down to retest the 1st support at 0.63551, where the 23.6% Fibonacci line is
Areas of consideration:
- H4 time frame, 1st resistance at 0.64094
- H4 time frame, 1st support at 0.63551
USD/CAD:
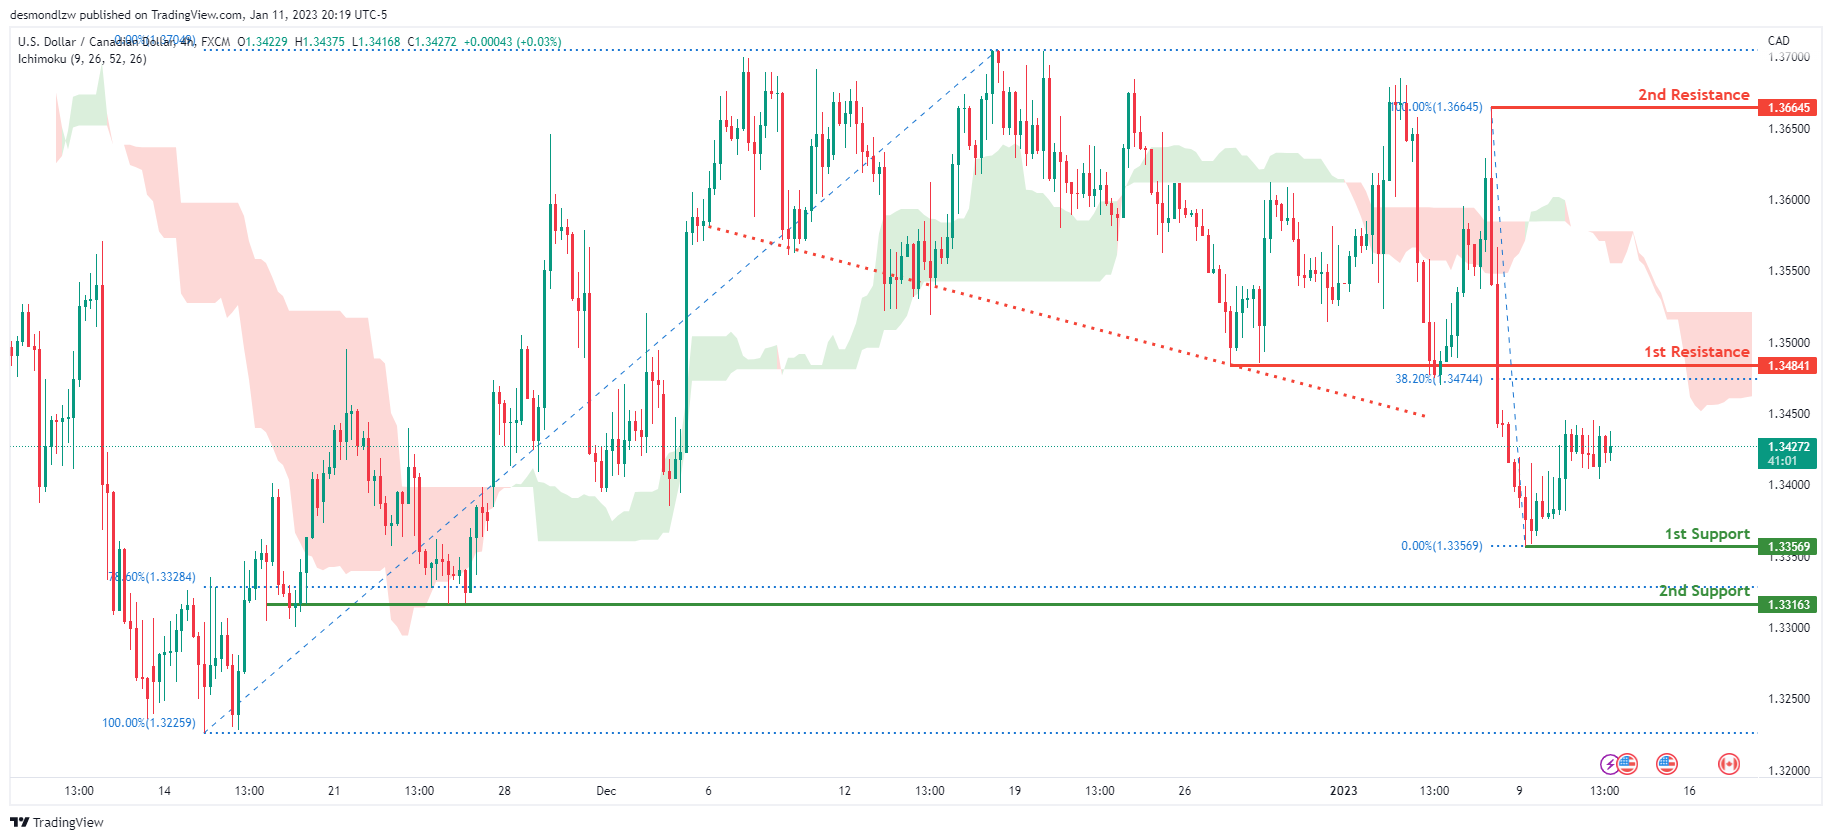
On the H4 chart, the overall bias for USDCAD is bearish. To add confluence to this, the price is below the Ichimoku cloud which indicates a bearish market. To add support to this bias, price has also broken under the descending trendline indicating strong bearish momentum. If this bearish momentum continues, expect the price to possibly head towards the 1st support at 1.33569, where the recent low is. In an alternative scenario, price could head back up to retest the 1st resistance at 1.34841, where the 38.2% Fibonacci line is.
Areas of consideration:
- H4 time frame, 1st resistance at 1.34841
- H4 time frame, 1st support at 1.33569
OIL:
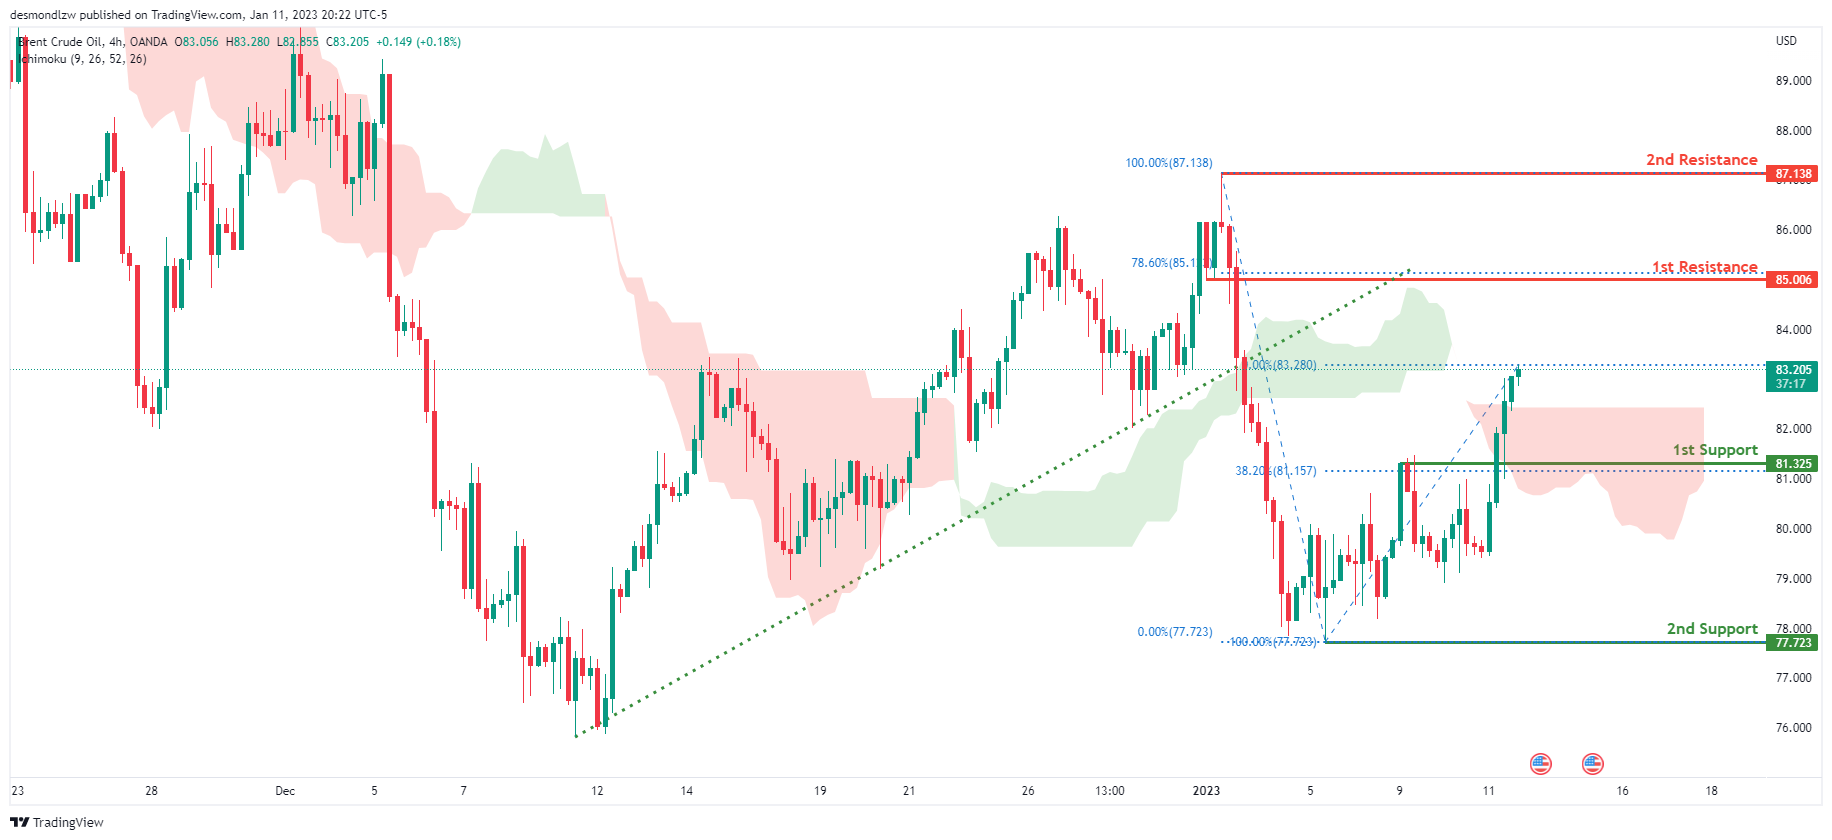
Looking at the H4 chart, my overall bias for BCOUSD is bullish due to the current price crossing above the Ichimoku cloud, indicating a bullish market. If this bullish momentum continues, expect the price to possibly continue heading towards the 1st resistance at 85.006, where the 78.6% Fibonacci line is. In an alternate scenario, price could possibly head back down to retest the 1st support at 81.325, slightly below where the 38.2% Fibonacci line is
Areas of consideration:
- H4 time frame, 1st resistance at 85.006
- H4 time frame,1st support at 81.325
Dow Jones Industrial Average:
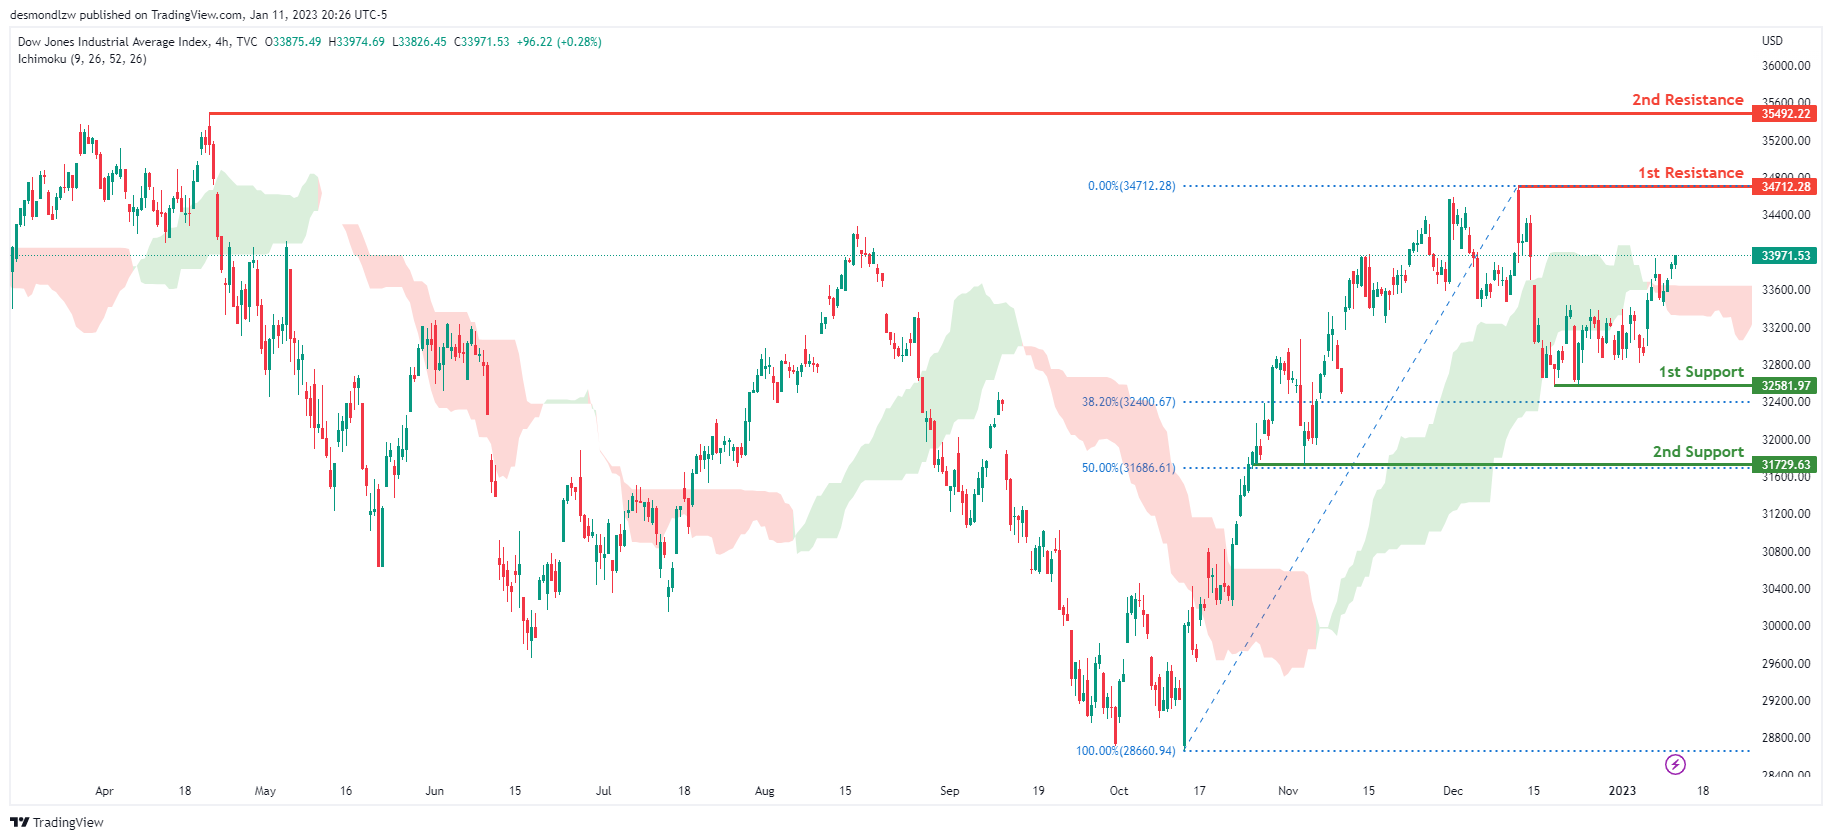
On the H4 chart, the overall bias for DJI is bearish. To add confluence to this, the price is crossing below the Ichimoku cloud which indicates a bearish market. If this bearish momentum continues, expect the price to head back down towards the 1st support at 32581.97, slightly above where the 38.2% Fibonacci line is. In an alternative scenario, price could possibly continue heading towards the 1st resistance line at 34712.28, where the recent swing high is.
Areas of consideration:
- H4 time frame, 1st support at 32581.97
- H4 time frame, 1st Resistance at 34712.28
DAX:
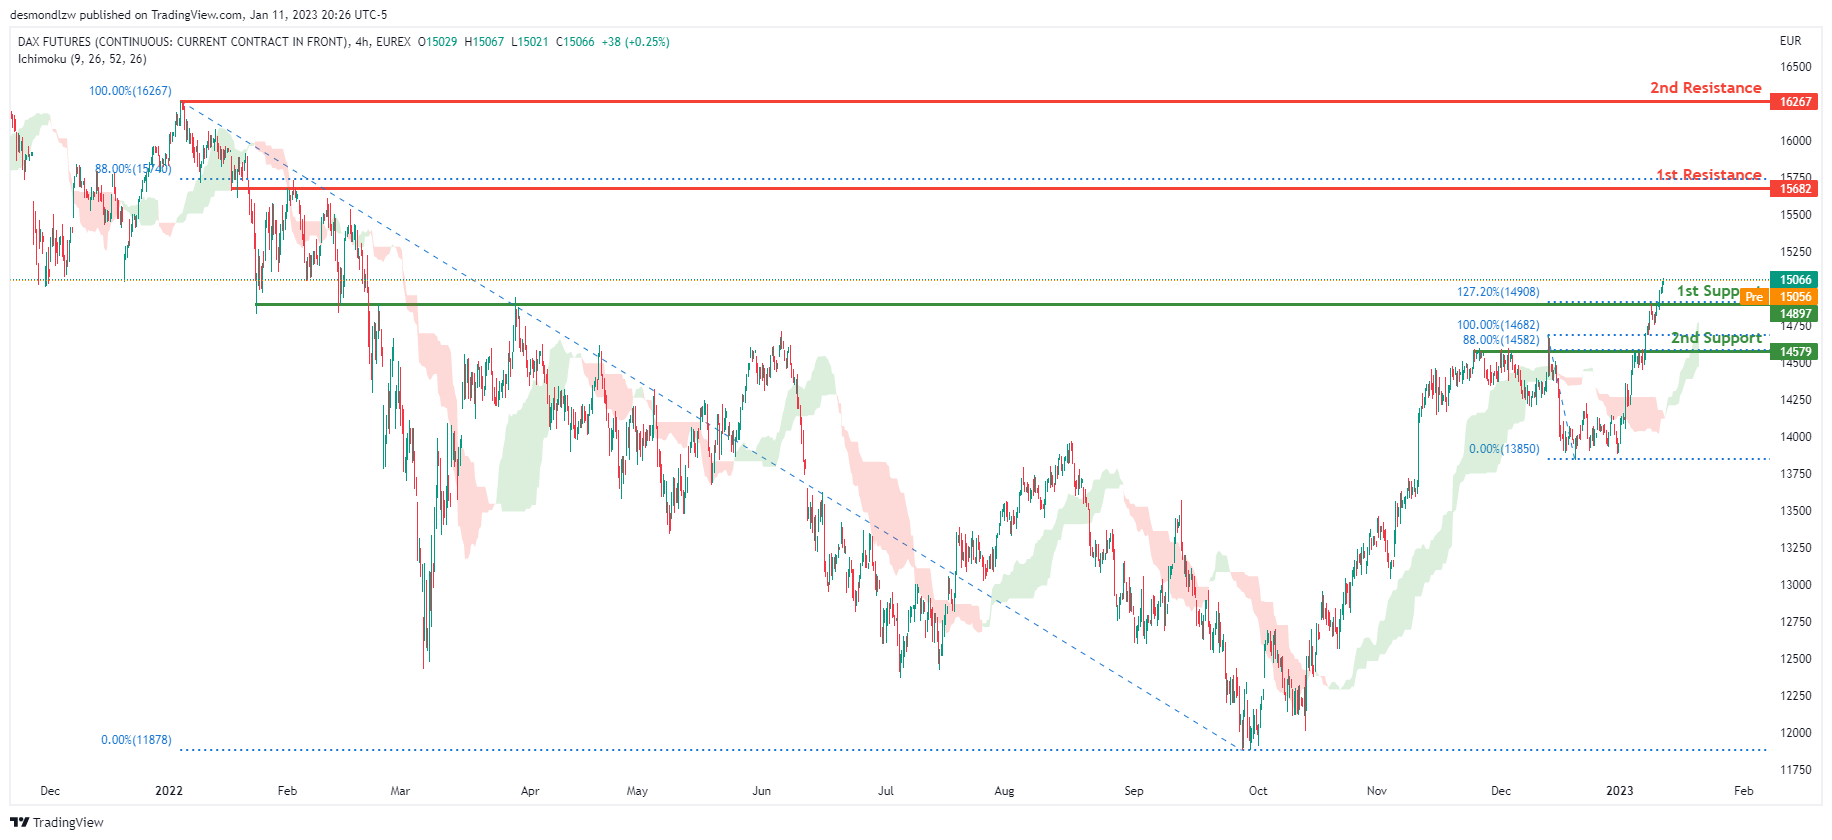
Looking at the H4 chart, my overall bias for DAX is bullish due to the current price crossing above the Ichimoku cloud, indicating a bullish market. If this bullish momentum continues, expect the price to possibly head towards the 1st resistance line at 15682, where the 88% Fibonacci line is. In an alternative scenario, price could possibly head down to break the 1st support at 14897, where the 127.2% Fibonacci extension line is, before heading towards the 2nd support at 14579, where the 88% Fibonacci line is.
Areas of consideration:
- H4 time frame, 1st resistance is at 15682
- H4 time frame, 1st support is at 14897
- H4 time frame, 2nd support is at 14579
ETHUSD:
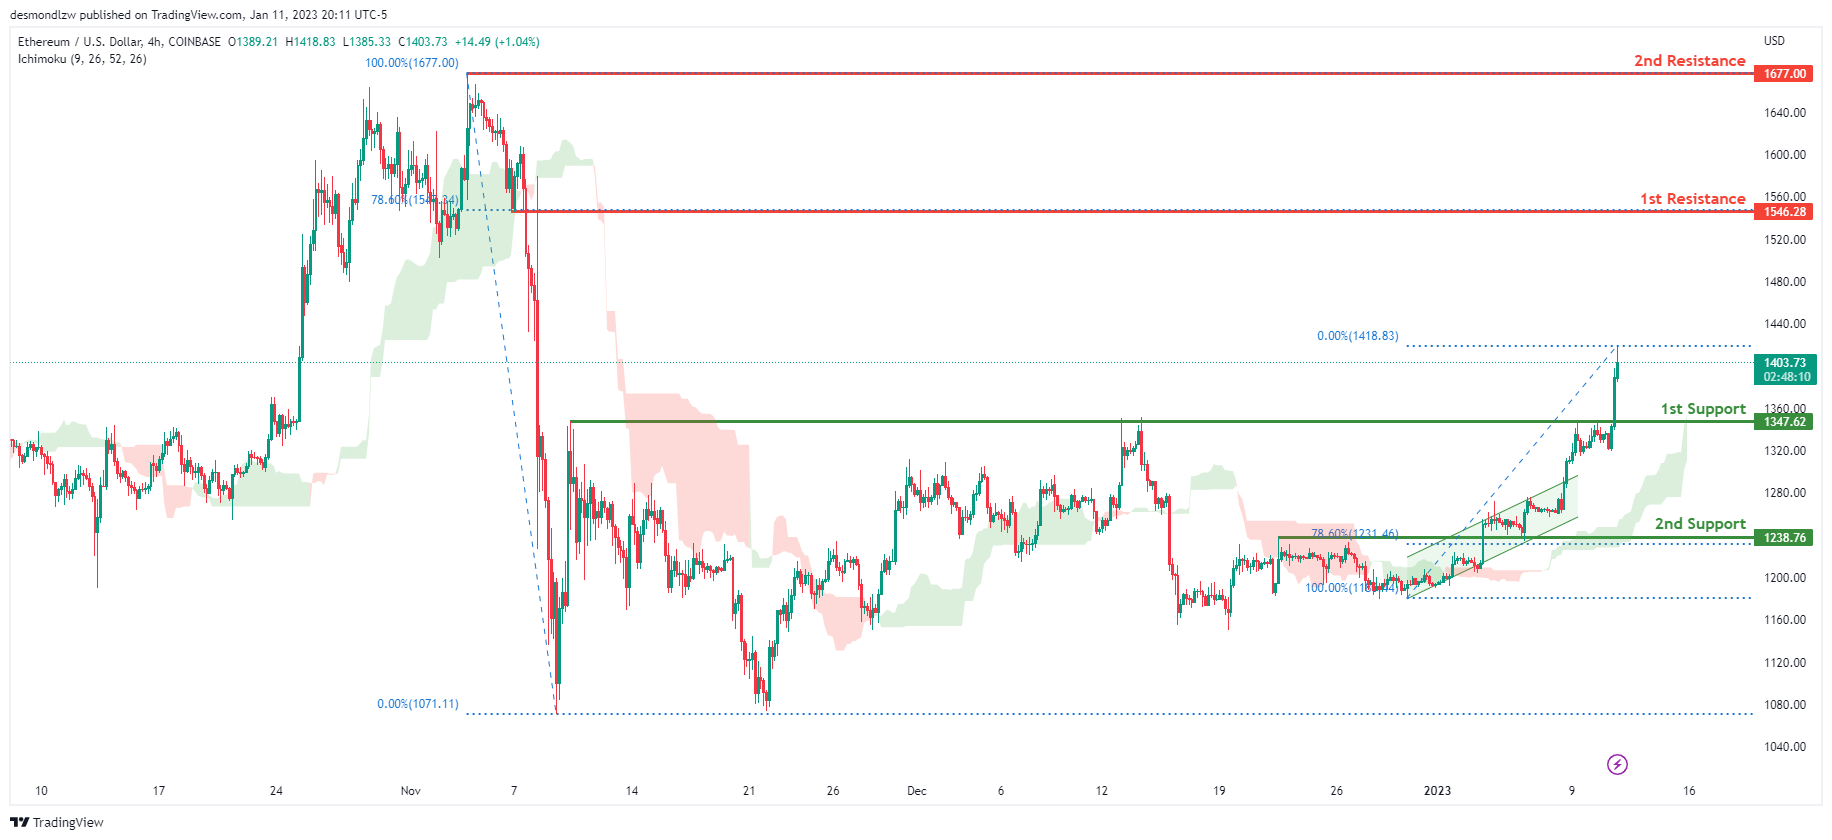
Looking at the H4 chart, my overall bias for ETHUSD is bullish due to the current price crossing above the Ichimoku cloud, indicating a bullish market. To add support to this bias, price is also broken upwards from an ascending channel. If this bullish momentum continues, expect the price to head towards the 1st resistance at 1546.28, where the 78.6% Fibonacci line is. In an alternative scenario, price could head back down to retest the 1st support at 1347.62, where the previous high is.
Areas of consideration:
- H4 time frame, 1st resistance of 1546.28
- H4 time frame, 1st support at 1347.62
BTCUSD:
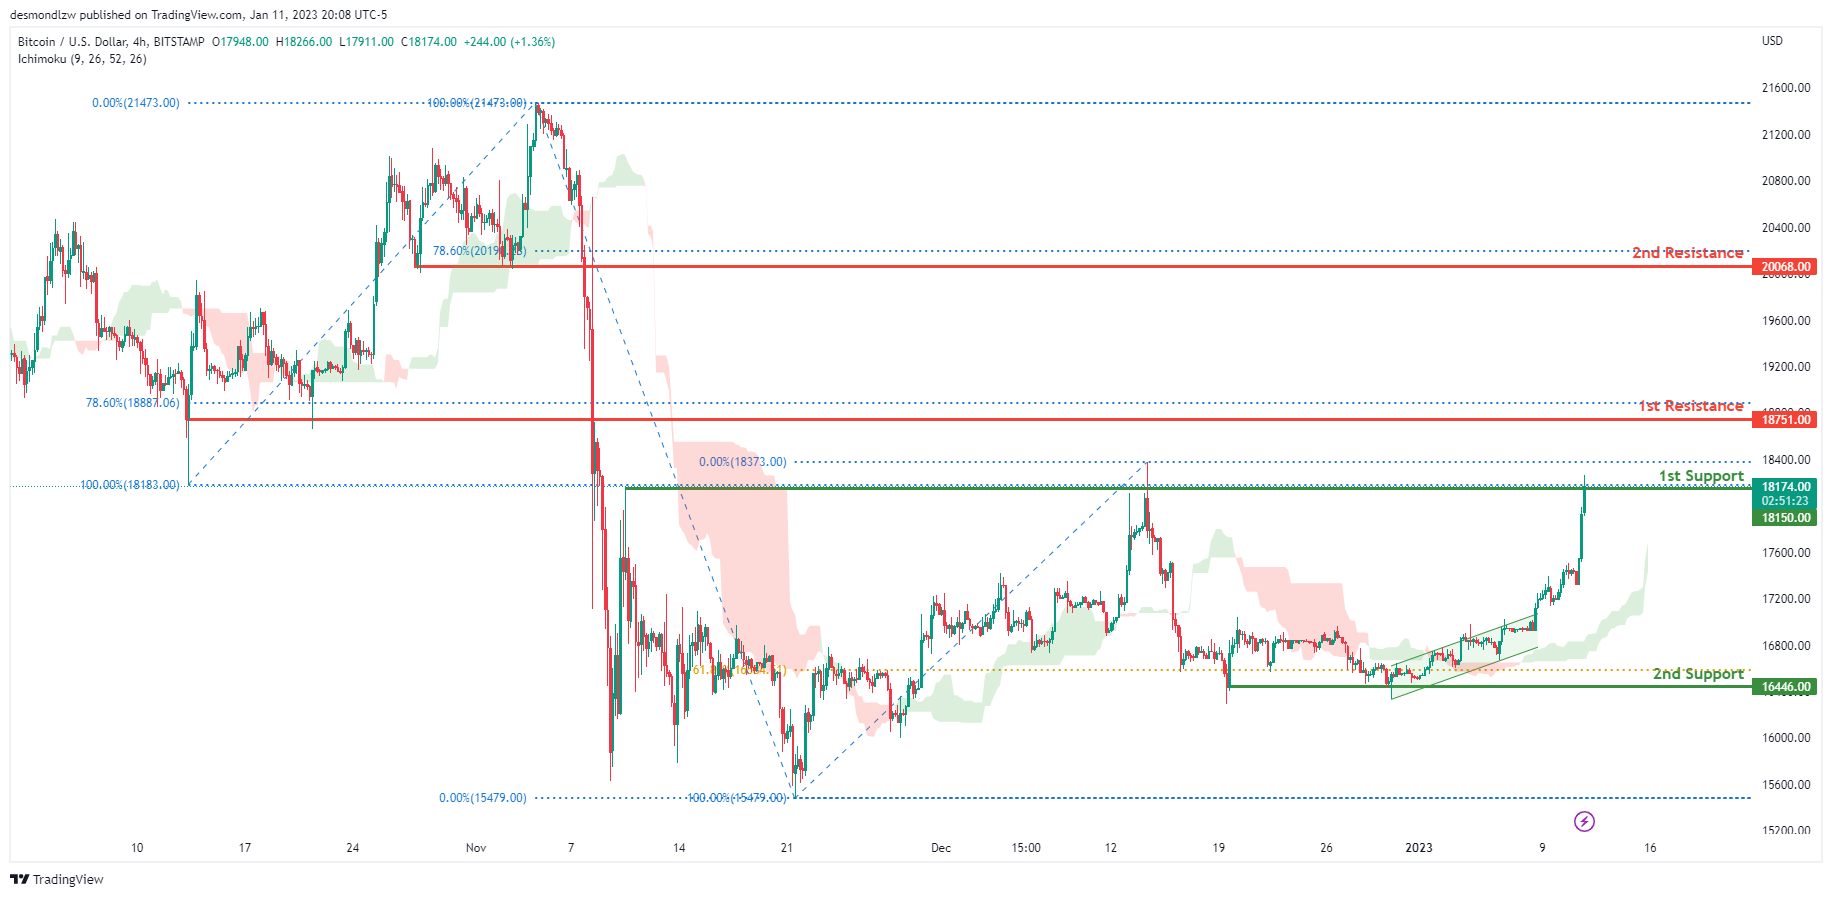
Looking at the H4 chart, my overall bias for BTCUSD is bullish due to the current price being above the Ichimoku cloud, indicating a bullish market. To add support to this bias, price has also broken above a bullish ascending channel. If this bullish momentum continues, expect the price to possibly continue heading towards the 1st resistance at 18751.00, where the 78.6% Fibonacci line is. In an alternative scenario, price could possibly head back down breaking the 1st support at 18150.00, where the recent high is, before heading towards the 2nd support at 16446.00, where the 61.8% Fibonacci line is.
Areas of consideration:
- H4 time frame, 1st resistance 18751.00
- H4 time frame, 1st support at 18150.00
- H4 time frame, 2nd support at 16446.00
S&P 500:
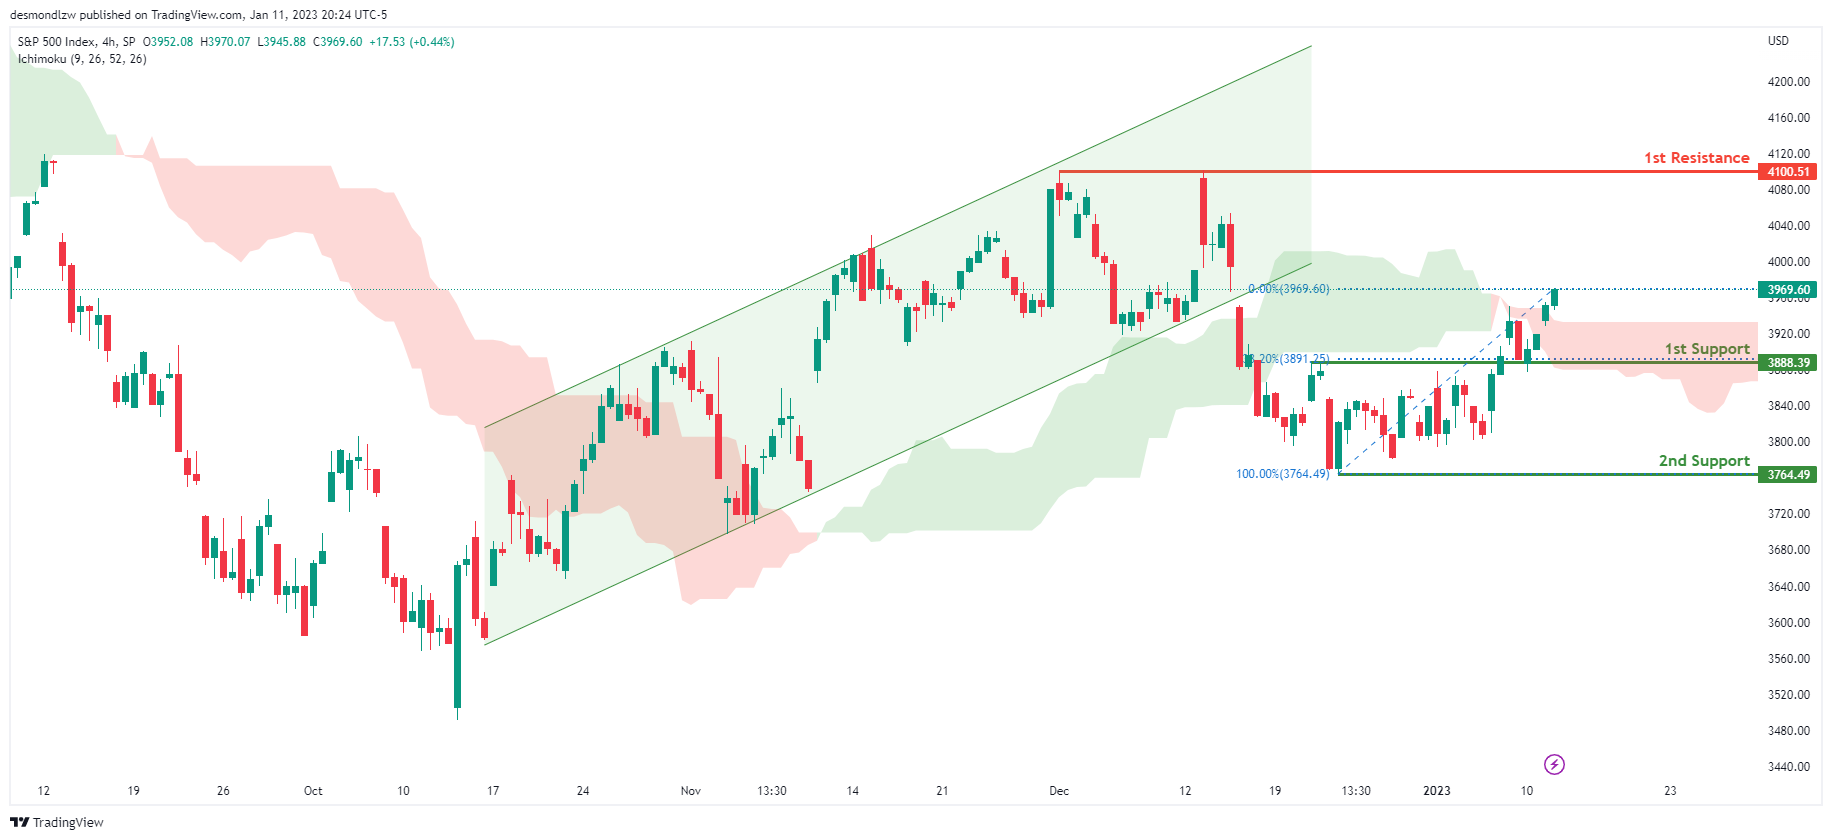
Looking at the H4 chart, my overall bias for S&P500 is bullish due to the current price being above the Ichimoku cloud, indicating a bullish market. If this bullish momentum continues, expect the price to continue heading towards the 1st resistance at 4100.51, where the previous high is. In an alternative scenario, price could possibly head back down to retest the 1st support at 3888.39, where the 38.2% Fibonacci line is.
Areas of consideration:
- H4 time frame, 1st support at 3888.39
- H4 time frame, 1st resistance at 4100.51
Crude Oil Price Aims Key Upside Break, US CPI Next
Key Highlights
- Crude oil price started a decent increase from the $72.50 zone.
- A key bullish trend line is forming with support near $75.20 on the 4-hours chart.
- Gold price is still struggling to clear the $1,825 resistance zone.
- Bitcoin price might rally if it clears the $18,000 resistance.
Crude Oil Price Technical Analysis
Crude oil price started a fresh decline from the $81.50 resistance against the US Dollar. The price declined below $78, but it found support near the $72.50 zone.
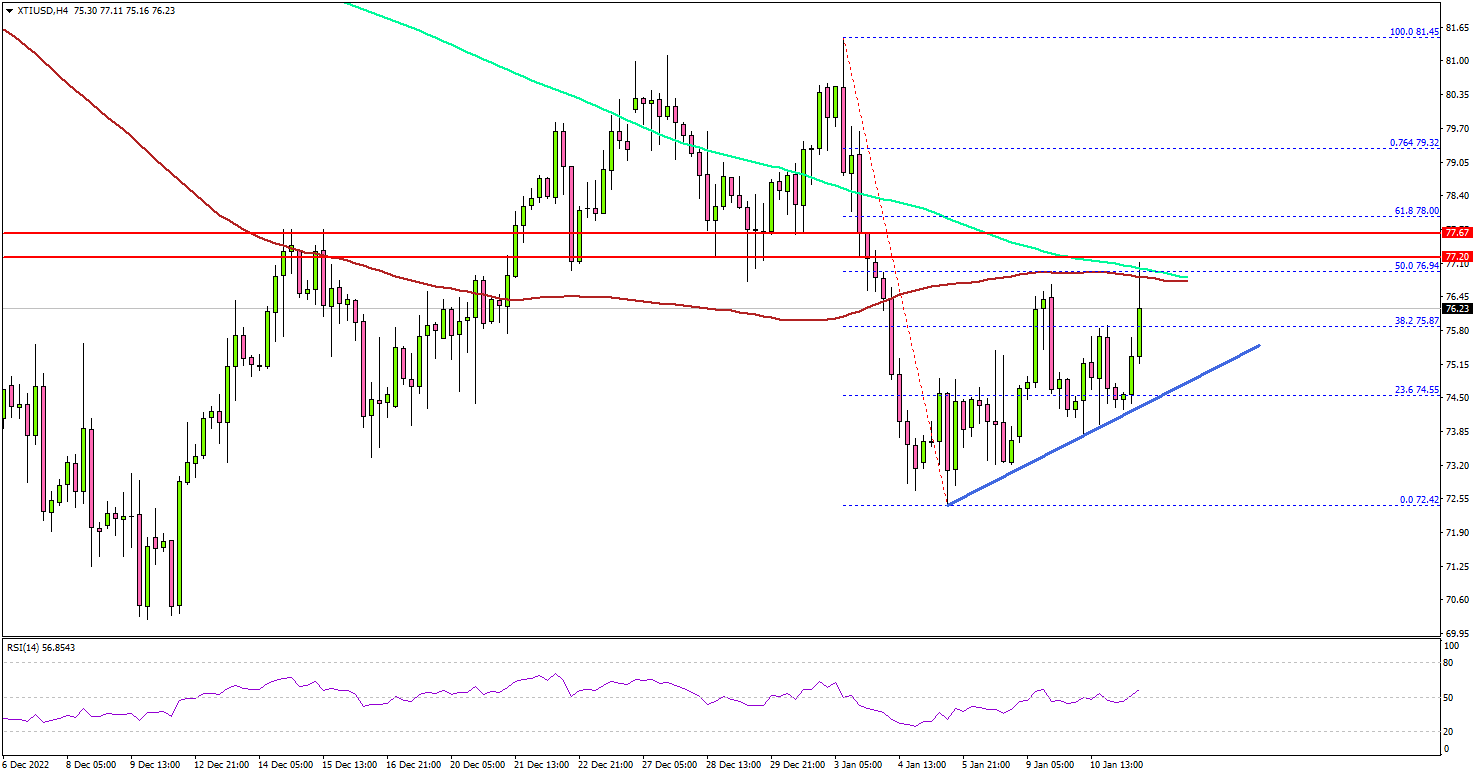
Looking at the 4-hours chart of XTI/USD, the price traded as low as $72.42. Recently, there was a decent increase above the $74 and $74.50 resistance levels. The price was able to clear the 38.2% Fib retracement level of the downward move from the $81.45 swing high to $72.42 low.
However, the price seems to be facing a lot of hurdles near $77, the 100 simple moving average (red, 4-hours), and the 200 simple moving average (green, 4-hours). It is also close to the 50% Fib retracement level of the downward move from the $81.45 swing high to $72.42 low.
The next major resistance is near the $78 zone. A clear move above the $78 resistance could open the doors for another steady increase towards $82 or even $84.
If not, the price might drop again from $78. An immediate support is now forming near the $75.20 zone. There is also a key bullish trend line forming with support near $75.20 on the same chart.
The next major support sits near the $73.20 level. Any more losses might call for a test of the $72.40 support zone in the coming days.
Looking at bitcoin price, there was an upside break above the $17,000 resistance, but there are still many barriers on the upside.
Economic Releases to Watch Today
- US Initial Jobless Claims - Forecast 215K, versus 204K previous.
- US Consumer Price Index for Dec 2022 (MoM) – Forecast 0%, versus +0.1% previous.
- US Consumer Price Index for Dec 2022 (YoY) – Forecast +6.5%, versus +7.1% previous.
- US Consumer Price Index Ex Food & Energy for Dec 2022 (YoY) – Forecast +5.7%, versus +6.0% previous.
Fed Collins: I’d lean to 25 for Feb meeting
Boston Fed President Susan Collins said in a New York Times interview that "25 or 50 would be reasonable " for rate hike in February. She added, "I'd lean at this stage to 25, but it's very data-dependent."
"Adjusting slowly gives more time to assess the incoming data before we make each decision, as we get close to where we're going to hold. Smaller changes give us more flexibility," she said.