
Sample Category Title
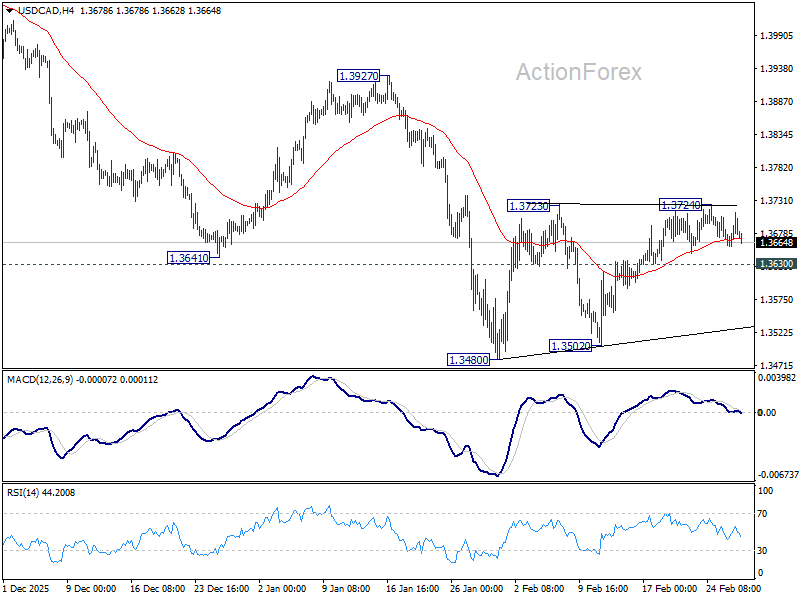
USD/CAD Daily Outlook
Daily Pivots: (S1) 1.3656; (P) 1.3685; (R1) 1.3710; More...
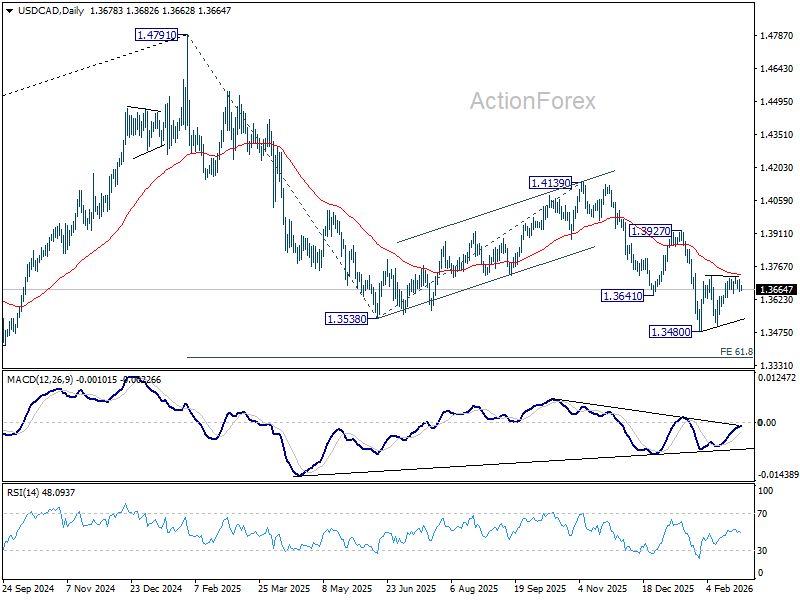
Outlook in USD/CAD is unchanged and intraday bias stays neutral. Consolidations from 1.3480 is in progress and stronger rebound might be seen. But upside should be limited by 55 D EMA (now at 1.3728) to complete the pattern. On the downside, below 1.3630 minor support will bring retest of 1.3480 low. Firm break there will resume larger down trend from 1.4791 to 61.8% projection of 1.4791 to 1.3538 from 1.4139 at 1.3365. However, sustained break of 55 D EMA will bring further rise to 1.3927 resistance and above.
In the bigger picture, price actions from 1.4791 are seen as a corrective pattern to the whole up trend from 1.2005 (2021 low). Deeper fall could be seen as the pattern extends, to 61.8% retracement of 1.2005 to 1.4791 at 1.3069. For now, medium term outlook will be neutral at best, until there are signs that the correction has completed, or that a bearish trend reversal is confirmed.
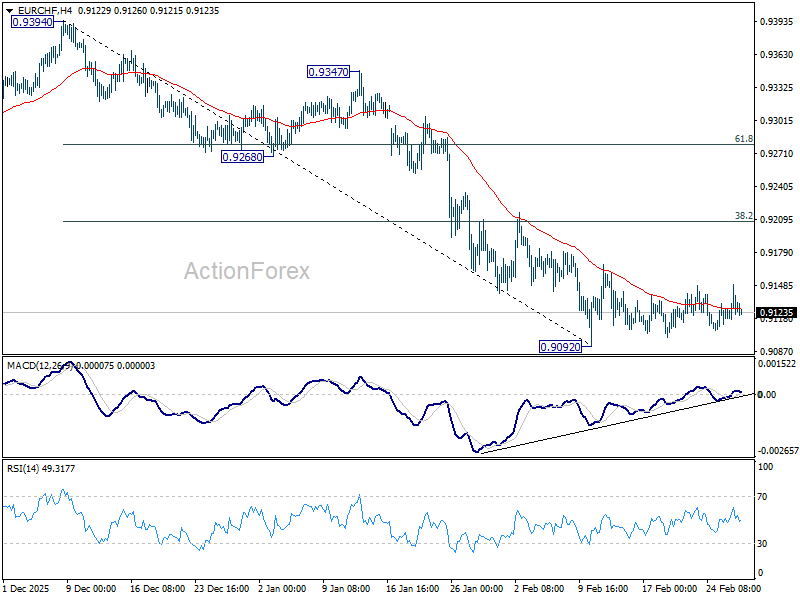
EUR/CHF Daily Outlook
Daily Pivots: (S1) 0.9114; (P) 0.9132; (R1) 0.9151; More....
EUR/CHF is still bounded in consolidations pattern from 0.9092 and intraday bias stays neutral. Stronger rebound might be seen but upside should be limited by 38.2% retracement of 0.9394 to 0.9092 at 0.9207. On the downside, firm break of 0.9092 will resume larger down trend.
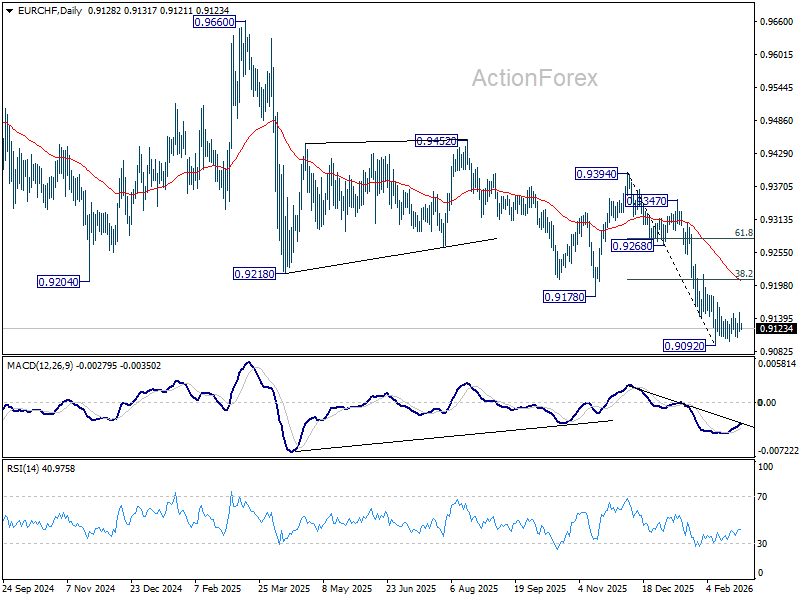
In the bigger picture, down trend from 0.9928 (2024 high) is still in progress with falling 55 W EMA (now at 0.9326) intact. Next target is 61.8% projection of 1.1149 to 0.9407 from 0.9928 at 0.8851. Outlook will stay bearish as long as 0.9394 resistance holds, in case of rebound.
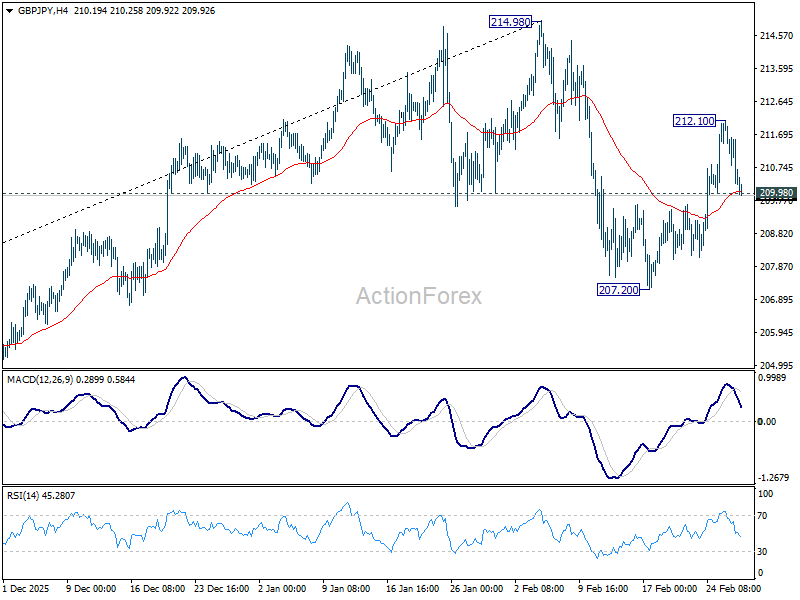
GBP/JPY Daily Outlook
Daily Pivots: (S1) 209.81; (P) 210.99; (R1) 211.72; More...
Intraday bias in GBP/JPY is turned neutral again with current retreat. Pull back from 214.98 could have completed as a near term correction at 207.20. Above 212.10 will bring retest of 214.98 first. Firm break there will resume larger up trend. For now, risk will stay on the upside as long as 207.20 holds.
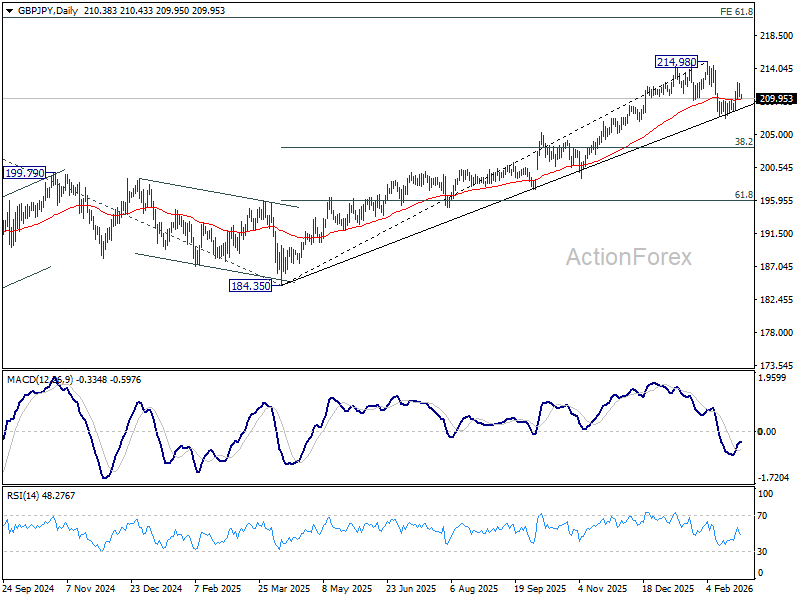
In the bigger picture, current development argues that price actions from 214.98 might be a near term consolidation pattern only. That is, larger up trend from 123.94 (2020 low) is still in progress. Firm break of 214.98 will target 61.8% projection of 148.93 (2022 low) to 208.09 (2024 high) from 184.35 at 220.90. On the downside, though, break of 207.20 will revive that case that it's already in a larger scale correction.
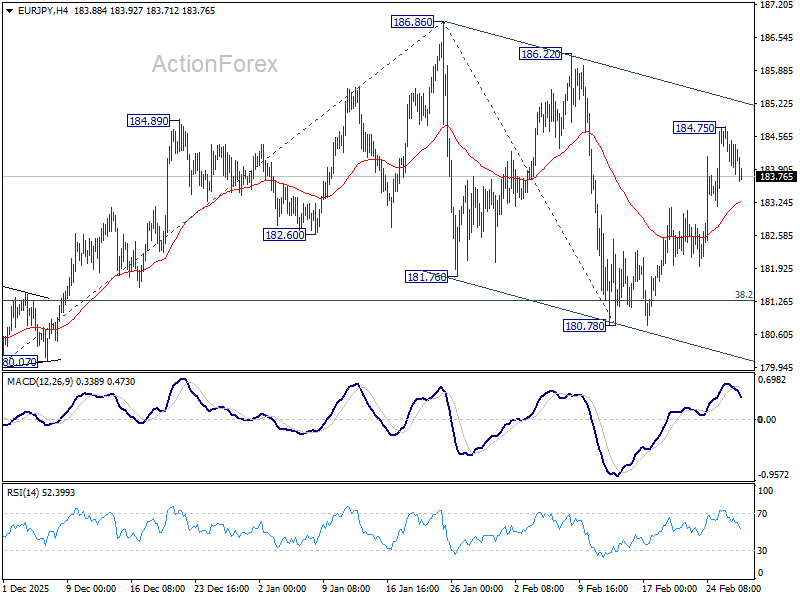
EUR/JPY Daily Outlook
Daily Pivots: (S1) 183.75; (P) 184.29; (R1) 184.76; More...
Intraday in EUR/JPY is turned neutral first with current retreat. Outlook is unchanged that correction from 186.86 should have completed with three waves down to 180.78. Above 184.75 will bring retest of 186.22/86 resistance zone. Decisive break there will confirm larger up trend resumption. Next target is 61.8% projection of 172.24 to 186.86 from 180.78 at 189.81. Overall, outlook will remain bullish as long as 38.2% retracement of 172.24 to 186.86 at 181.27, in case of deep retreat.
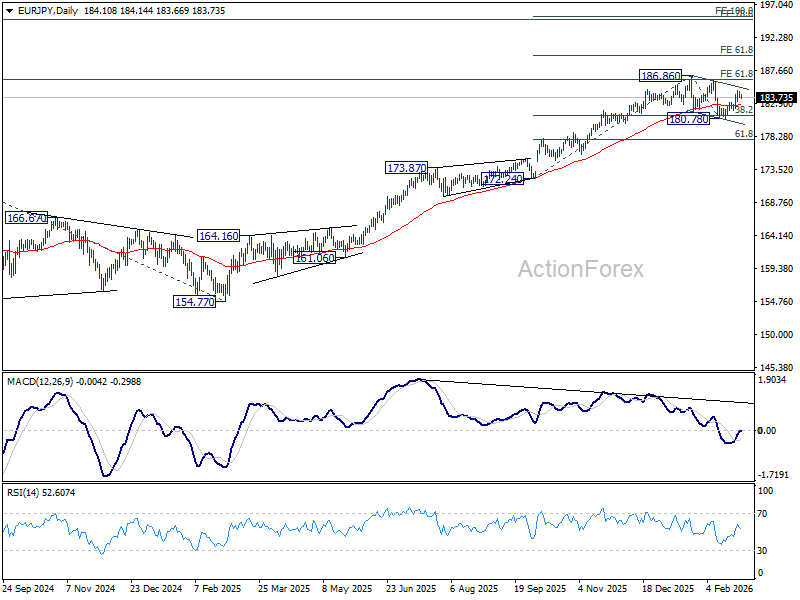
In the bigger picture, current development suggests that price actions from 186.86 are merely a near term corrective pattern. In other words, the long term up trend is still in progress. Firm break of 186.86 will pave the way to 78.6% projection of 124.37 (2022 low) to 175.41 (2025 high) from 154.77 at 194.88 next. This will now remain the favored case as long as 180.78 support holds.
EUR/AUD Daily Outlook
Daily Pivots: (S1) 1.6536; (P) 1.6612; (R1) 1.6654; More...
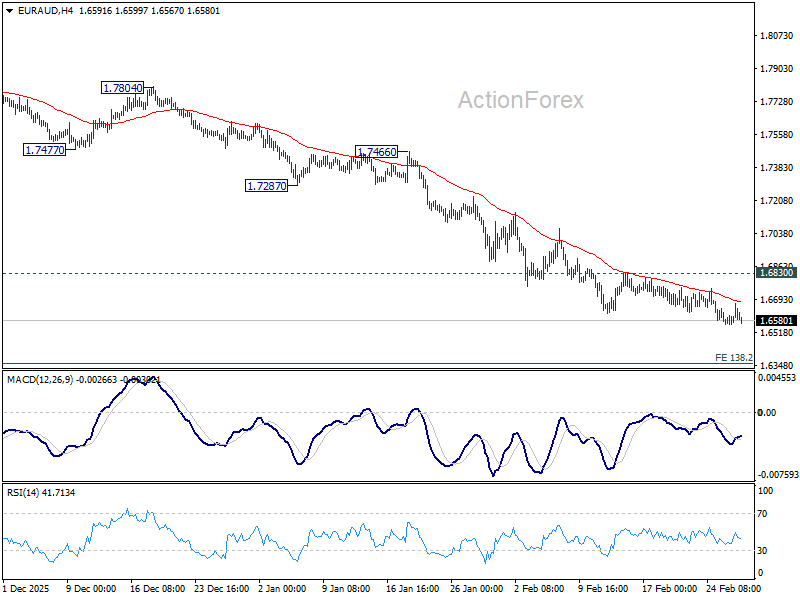
There is no clear sign of bottoming in EUR/AUD yet despite loss of momentum as seen in 4H MACD. Intraday bias remains on the downside. Fall from 1.8554 is in progress and should target 138.2% projection of 1.8554 to 1.7245 from 1.8160 at 1.6351 next. Near term outlook will remain bearish as long as 1.6830 resistance holds, in case of recovery.
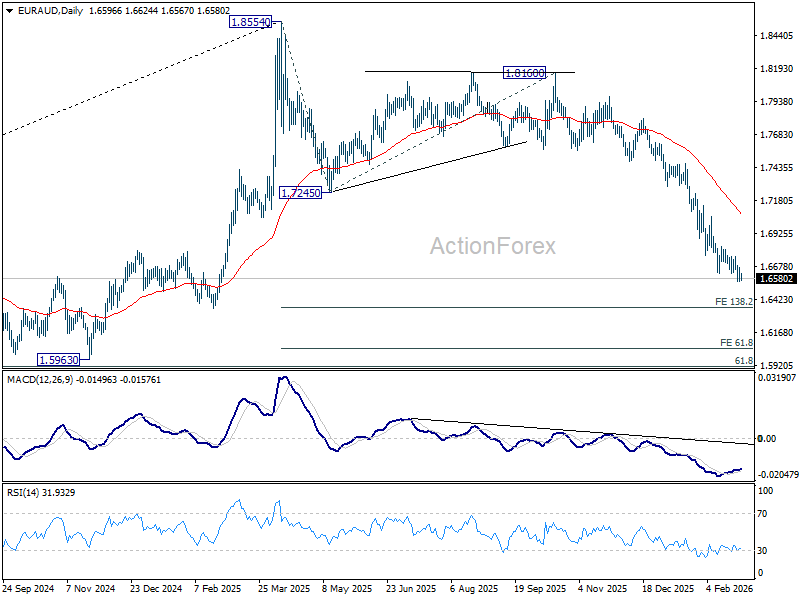
In the bigger picture, fall from 1.8554 medium term top is seen as reversing the whole up trend from 1.4281 (2022 low). Deeper decline should be seen to 61.8% retracement of 1.4281 to 1.8554 at 1.5913, which is slightly below 1.5963 structural support. For now, risk will stay on the downside as long as 1.7245 support turned resistance holds, even in case of strong rebound.
EUR/GBP Daily Outlook
Daily Pivots: (S1) 0.8718; (P) 0.8738; (R1) 0.8769; More…
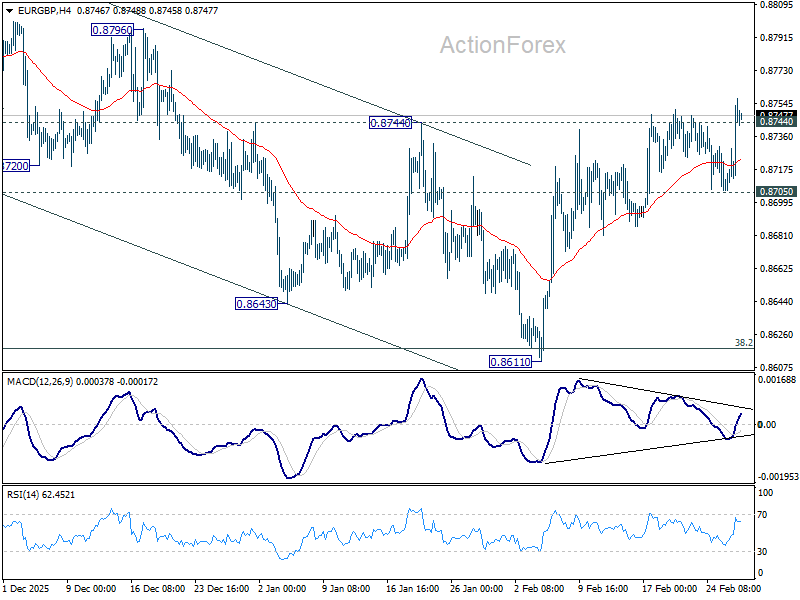
EUR/GBP's rebound from 0.8611 is resuming and intraday bias is back on the upside. Sustained trading above 0.8744 resistance will solidify the case that fall from 0.8863 has completed as a correction at 0.8661. Further rise should then be seen back to retest 0.8663 high. On the downside, below 0.8705 support will turn intraday bias neutral again first. But near term outlook will stay bullish as long as 38.2% retracement of 0.8221 to 0.8663 at 0.8618 holds.
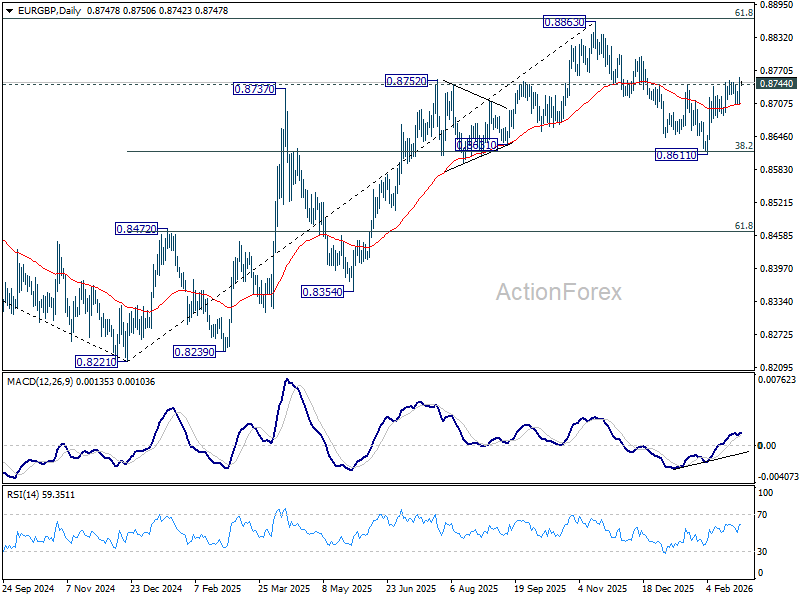
In the bigger picture, focus remains on 61.8% retracement of 0.9267 to 0.8221 at 0.8867. Rejection by this level will keep the rise from 0.8221 medium term bottom (2024) as a corrective move. Sustained trading below 55 W EMA (now at 0.8636) should confirm that this corrective bounce has completed. However, decisive break of 0.8867 will suggest that EUR/GBP is already reversing whole decline from 0.9267 (2022 high). That should pave the way back to 0.9267.
Sterling Attempts Downside Break as Loonie Awaits GDP
Forex markets are closing out February in subdued fashion, with activity thinning as traders hold back from fresh positioning ahead of a heavy data calendar next week. Aussie remains the standout performer, supported by stronger-than-expected inflation data earlier this week, which reinforced expectations that the RBA will deliver another rate hike in May. Swiss Franc and Euro are also on the firmer side, reflecting a mild defensive undertone beneath the surface.
At the other end, Yen remains the weakest currency of the week. Bets for an April hike by the BoJ have receded amid political noise and mixed inflation signals. While some officials have kept March or April alive as possibilities, markets appear skeptical that tightening will come again that soon. Dollar and Loonie are also soft, though not under heavy selling pressure. Greenback is struggling to extend any rebound as risk sentiment stabilizes, while Canadian Dollar is cautious ahead of domestic growth data.
Sterling stands out as the notable underperformer today. The currency has fallen broadly and is attempting to break below its near-term range against Euro. There is no single headline driving the move, but expectations for a March rate cut by the BoE are continuing to build.
Political uncertainty may be compounding the pressure. The UK Labour looks set to lose the Gorton and Denton by-election, a constituency traditionally aligned with the party. A defeat there would deal another blow to Prime Minister Keir Starmer, who has faced mounting political headwinds since the start of the year. Some analysts speculate that a loss—particularly to the Green Party—could push Chancellor Rachel Reeves toward a looser fiscal stance in the upcoming Spring Statement, to regain left-leaning voters. That prospect, combined with easing expectations, weighs on Sterling.
Attention later today will turn to Canada’s GDP release. Monthly GDP is expected to rise 0.1% mom in December, with Q4 growth seen essentially flat. The numbers will be closely watched for confirmation that the economy is stabilizing rather than slipping.
The BoC is currently in an extended pause, having brought rates to 2.25% and signaled that easing may be complete. Market pricing reflects a broadly steady path from here. However, a surprise contraction in Q4 would challenge that narrative and revive speculation of a “fine-tuning” cut to cushion against a deeper slowdown.
In Asia, at the time of writing, Nikkei is up 0.14%. Hong Kong HSI is up 0.77%. China Shanghai SSE is down -0.17%. Singapore Strait Times is up 0.33%. Japan 10-year JGB yield is down -0.027 at 2.130. Overnight, DOW rose 0.03%. S&P 500 fell -0.54%. NASDAQ fell -1.18%. 10-year yield fell -0.031 to 4.017.
Subsidy effect pulls Tokyo core CPI down to 1.8%, but underlying inflation firms
Inflation in Tokyo eased further in February, with core CPI (ex-fresh food) falling to 1.8% yoy from 2.0% yoy. While slightly above market expectations of 1.7% yoy, the reading marks the third straight monthly slowdown and the lowest level since October 2024, slipping back under the BoJ’s 2% target.
The primary driver was a sharp drop in energy prices, which declined -9.2% yoy as the government’s temporary utility subsidies began to take effect. The program has mechanically dampened readings and was broadly expected to weigh on inflation for several months.
Beneath the surface, however, price dynamics remain more persistent. Core-core inflation (excluding fresh food and energy) rose to 2.5% yoy from 2.4% yoy, suggesting domestic demand conditions and wage-driven pricing remain intact. Headline CPI also ticked up modestly from 1.5% yoy to 1.6% yoy.
Japan's industrial production rose 2.2% mom on auto strength, but forward signals soft
Japan’s industrial production rose 2.2% mom in January, marking the first increase in three months, though falling well short of expectations for a 5.5%. .
Production expanded in 13 of 15 sectors, with automakers posting a notable 9.1% gain amid solid demand for passenger vehicles both domestically and overseas. However, weakness persisted in production machinery, where output declined on softer demand for semiconductor-manufacturing equipment.
The Ministry of Economy, Trade and Industry maintained its assessment that industrial production “fluctuates indecisively”. Officials noted that companies remain wary of US tariff policy developments and the Chinese growth outlook, even if no direct impact was evident in the latest data.
Looking ahead, manufacturers expect output to dip -0.5% in February and -2.6% in March.
In contrast, retail sales surprised to the upside, rising 1.8% yoy against expectations of just 0.2%.
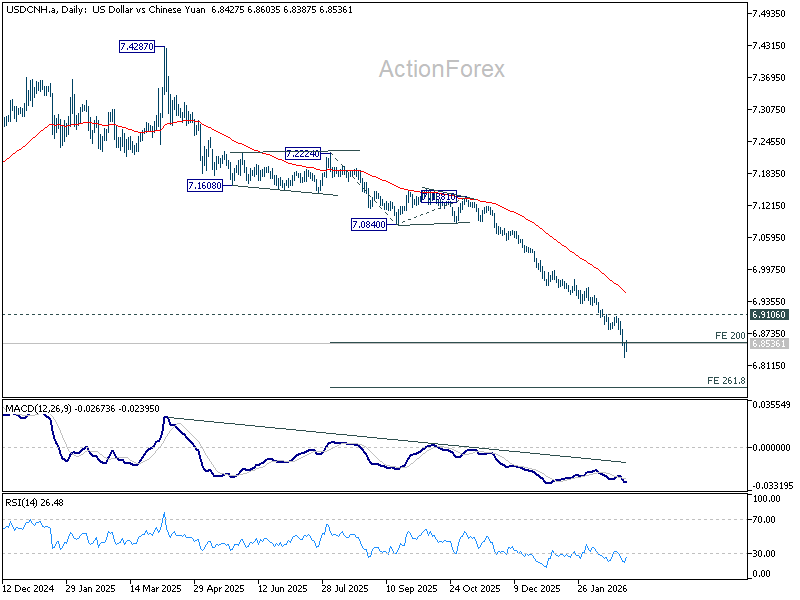
PBOC cuts FX risk reserve to temper Yuan strength, but downtrend in USD/CNH intact
The People's Bank of China announced today that it will lower the foreign exchange risk reserve requirement for financial institutions purchasing foreign exchange via forwards to zero from 20%, effective March 2. The move reverses a September 2022 tightening measure that had been introduced to curb rapid Yuan depreciation and stem capital outflows.
At the time, the higher reserve requirement made it more costly to bet against the Yuan. Now, with the currency having surged to a near three-year high against Dollar, the adjustment signals a shift in priorities. The central bank framed the decision as support for enterprises in managing exchange-rate risks, while reiterating its commitment to maintaining the renminbi at a “reasonable and balanced level.”
Markets widely interpret the move as an attempt to slow the pace of rapid appreciation rather than to trigger depreciation outright. Yuan strength has been broad-based this week, reflecting improving sentiment around China’s trade positioning and a softer Dollar backdrop.
USD/CNH recovered mildly on the news, but the bounce has not altered the prevailing technical picture. The pair has broken through 200% projection of 7.2224 to 7.0840 from 7.1381 at 6.8613 this week, and there is no clear sign of bottoming. Technically, near-term outlook remains bearish as long as 6.9106 resistance caps rebounds. The next downside target lies at the 261.8% projection at 6.7758.
EUR/GBP Daily Outlook
Daily Pivots: (S1) 0.8718; (P) 0.8738; (R1) 0.8769; More…
EUR/GBP's rebound from 0.8611 is resuming and intraday bias is back on the upside. Sustained trading above 0.8744 resistance will solidify the case that fall from 0.8863 has completed as a correction at 0.8661. Further rise should then be seen back to retest 0.8663 high. On the downside, below 0.8705 support will turn intraday bias neutral again first. But near term outlook will stay bullish as long as 38.2% retracement of 0.8221 to 0.8663 at 0.8618 holds.

In the bigger picture, focus remains on 61.8% retracement of 0.9267 to 0.8221 at 0.8867. Rejection by this level will keep the rise from 0.8221 medium term bottom (2024) as a corrective move. Sustained trading below 55 W EMA (now at 0.8636) should confirm that this corrective bounce has completed. However, decisive break of 0.8867 will suggest that EUR/GBP is already reversing whole decline from 0.9267 (2022 high). That should pave the way back to 0.9267.

USD/JPY Climbs Higher, Bulls Eye Fresh Upside Extension Ahead
Key Highlights
- USD/JPY regained traction and climbed above the 155.00 resistance.
- A rising channel is forming with support at 155.50 on the 4-hour chart.
- EUR/USD is struggling to clear the 1.1840 and 1.1860 resistance levels.
- Crude Oil prices trimmed some gains and corrected below $65.20.
USD/JPY Technical Analysis
The US Dollar formed a base above 154.00 against the Japanese Yen. USD/JPY started a steady increase above 154.80 and 155.00.
Looking at the 4-hour chart, the pair settled above 155.00, the 100 simple moving average (red, 4-hour), and the 200 simple moving average (green, 4-hour). There was a clear move above the 61.8% Fib retracement level of the downward move from the 157.66 swing high to the 152.27 low.
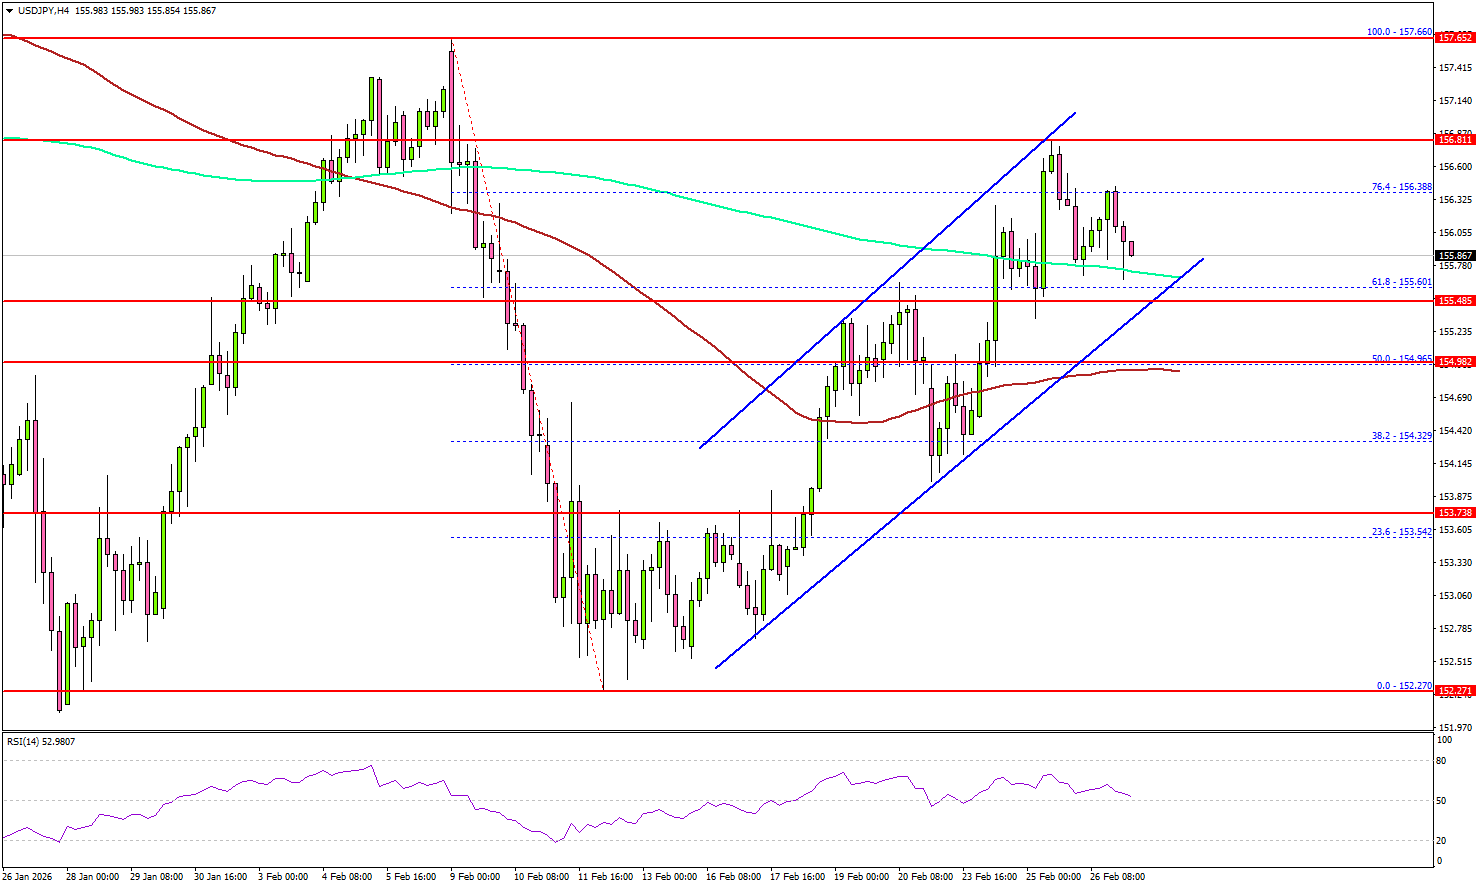
On the upside, the pair is now facing hurdles near 156.50. The first major resistance sits at 156.80. A close above 156.80 could open the doors for more gains. In the stated case, the bulls could aim for a move to 157.20. The main resistance sits near 158.00.
Immediate support could be 155.50. There is also a rising channel forming with support at 155.50. The first major area for the bulls might be near 155.00 or the 100 simple moving average (red, 4-hour).
The main support sits at 154.70, below which the pair might gain bearish momentum. In the stated case, it could even revisit 153.80 in the coming days.
Looking at EUR/USD, the pair started a recovery wave, but the bears seem to be active near the 1.1840 and 1.1860 levels.
Upcoming Key Economic Events:
- US Producer Price Index for Jan 2026 (MoM) – Forecast +0.3%, versus +0.5% previous.
- US Producer Price Index for Jan 2026 (YoY) – Forecast +2.6%, versus +3.0% previous.
- Chicago Purchasing Manager’s Index for Feb 2026 – Forecast 52.8, versus 54.0 previous.
PBOC cuts FX risk reserve to temper Yuan strength, but downtrend in USD/CNH intact
The People's Bank of China announced today that it will lower the foreign exchange risk reserve requirement for financial institutions purchasing foreign exchange via forwards to zero from 20%, effective March 2. The move reverses a September 2022 tightening measure that had been introduced to curb rapid Yuan depreciation and stem capital outflows.
At the time, the higher reserve requirement made it more costly to bet against the Yuan. Now, with the currency having surged to a near three-year high against Dollar, the adjustment signals a shift in priorities. The central bank framed the decision as support for enterprises in managing exchange-rate risks, while reiterating its commitment to maintaining the renminbi at a “reasonable and balanced level.”
Markets widely interpret the move as an attempt to slow the pace of rapid appreciation rather than to trigger depreciation outright. Yuan strength has been broad-based this week, reflecting improving sentiment around China’s trade positioning and a softer Dollar backdrop.
USD/CNH recovered mildly on the news, but the bounce has not altered the prevailing technical picture. The pair has broken through 200% projection of 7.2224 to 7.0840 from 7.1381 at 6.8613 this week, and there is no clear sign of bottoming. Technically, near-term outlook remains bearish as long as 6.9106 resistance caps rebounds. The next downside target lies at the 261.8% projection at 6.7758.
Japan’s industrial production rises 2.2% mom on auto strength, but forward signals soft
Japan’s industrial production rose 2.2% mom in January, marking the first increase in three months, though falling well short of expectations for a 5.5%. .
Production expanded in 13 of 15 sectors, with automakers posting a notable 9.1% gain amid solid demand for passenger vehicles both domestically and overseas. However, weakness persisted in production machinery, where output declined on softer demand for semiconductor-manufacturing equipment.
The Ministry of Economy, Trade and Industry maintained its assessment that industrial production “fluctuates indecisively”. Officials noted that companies remain wary of US tariff policy developments and the Chinese growth outlook, even if no direct impact was evident in the latest data.
Looking ahead, manufacturers expect output to dip -0.5% in February and -2.6% in March.
In contrast, retail sales surprised to the upside, rising 1.8% yoy against expectations of just 0.2%.