
Sample Category Title
EUR/USD in Positive Territory: Dollar Weakness Presents Opportunities for Investors
EUR/USD rose for the second consecutive day and is approaching 1.1819. Sentiment towards the US dollar remains under pressure amid uncertainty over US tariff policy, which is eroding confidence in the American currency.
US Trade Representative Jamieson Greer stated that tariff rates for individual countries could be increased from the current 10% to 15% or higher, but did not specify the criteria for such changes.
President Donald Trump adopted a measured tone on tariffs in his annual address to Congress. At the same time, he made it clear that he would not change his strategy, despite the Supreme Court’s decision to cancel his large-scale “reciprocal” duties.
In terms of monetary policy, the market expects the Fed to keep interest rates unchanged at its next meeting.
Additional caution stems from ongoing negotiations between the US and Iran on the nuclear program, the next round of which is taking place today in Geneva.
Technical Analysis
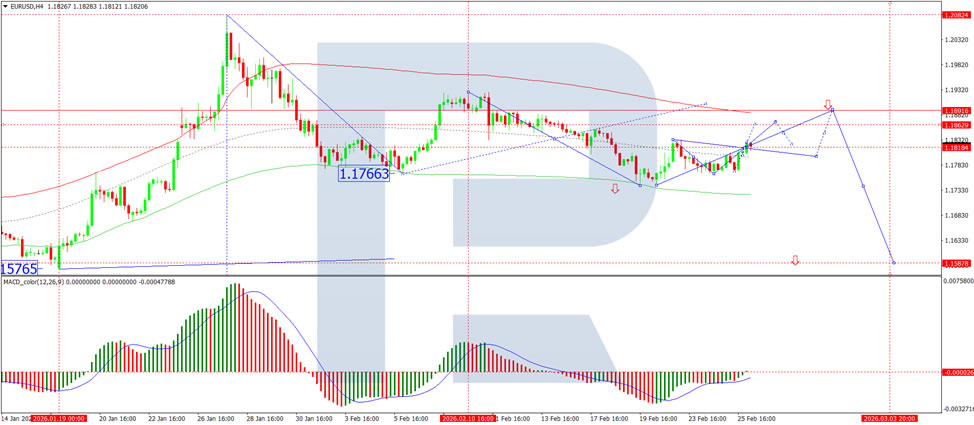
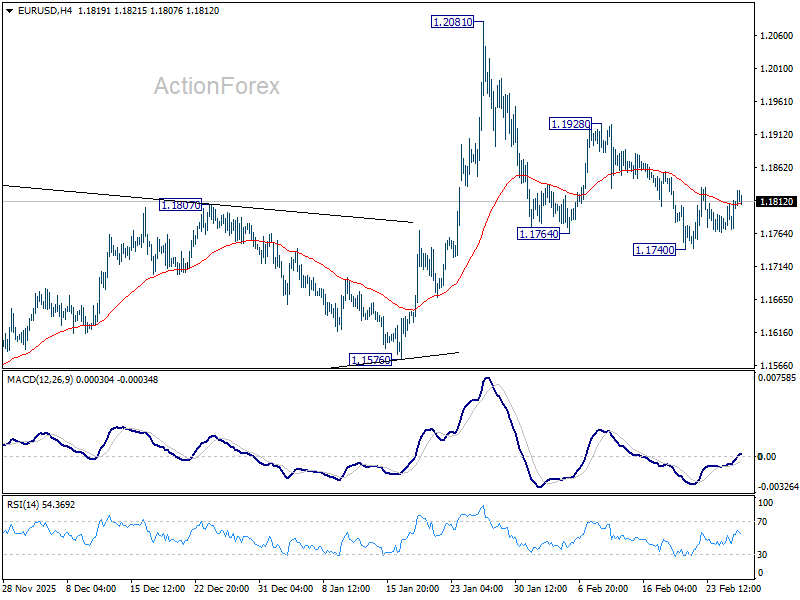
On the H4 chart, EUR/USD is forming a consolidation range around 1.1818. An upward move towards 1.1862 appears likely, with scope for an extension towards 1.1888. Technically, this scenario is supported by the MACD indicator: its signal line remains above zero and is pointing higher, reflecting sustained bullish momentum.
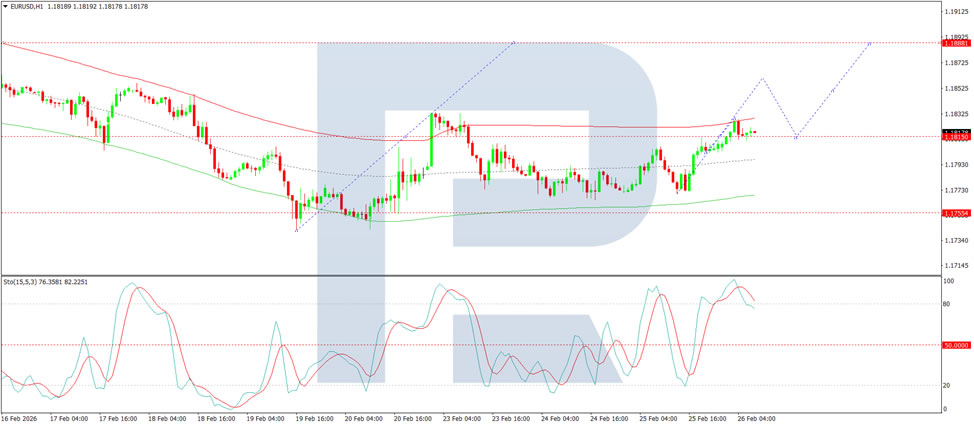
On the H1 chart, the pair is developing the next upward wave towards 1.1860. After reaching this level, a pullback towards 1.1818 could follow, before a renewed advance towards 1.1888. Technically, this scenario is supported by the Stochastic oscillator, with its signal line above 50 and rising towards 80.
Conclusion
In summary, EUR/USD continues its gradual recovery as persistent uncertainty surrounding US tariff policy weighs on dollar sentiment. While Trump’s Congressional address offered no clarity on the trade front, and ongoing US-Iran negotiations add a layer of geopolitical caution, the technical picture remains constructive. The pair is building momentum within a consolidation range, with upside targets at 1.1862 and 1.1888. Both MACD and Stochastic indicators support the bullish bias, suggesting further gains are likely in the near term. The key level to watch is 1.1818 – holding above this support keeps the upward trajectory intact, while a break below could signal a temporary pause. For now, the path of least resistance appears higher.
USD/JPY Stalls at Pennant Resistance Near 156.30
- USDJPY pauses upside at key resistance level.
- Holding the 50‑day SMA remains crucial for bullish bias.
- Momentum indicators reflect indecision.
USDJPY is trading under pressure near the upper boundary of a pennant pattern around 156.30. The yen firmed after BoJ Governor Ueda highlighted the March and April meetings as possible windows for rate hikes, while the dollar eased amid trade uncertainty and improving sentiment around tech earnings.
Technically, attention remains on the repeated tests of the pennant’s upper trendline at 156.30. A clean breakout would signal renewed upside within the broader uptrend. However, momentum indicators show hesitation – the stochastics are flat near overbought territory, the RSI sits just above the 50-neutral mark, and the MACD remains negative but above its signal line.
The pair is also probing support at the 50‑day simple moving average (SMA). A decisive break below would expose the 20‑day SMA near 155.10, then the weekly low around the 154.00 level. Below this, key structural support sits at the pennant base, aligned with the long-term uptrend from April and the 152.80 floor that has held since November. A drop through that region would shift the near‑term outlook to neutral.
Conversely, a breakout could encounter resistance at the February 9 trough near 157.60, then the multi‑year peak around 159.45, and finally the September highs above the 160.00 intervention zone.
Overall, USDJPY is consolidating at a critical structural level, testing the pennant ceiling while momentum still lags, reflecting a neutral bias ahead of key data from both economies on Friday. A sustained close above the 50‑day SMA is needed to keep the bullish breakout scenario alive.
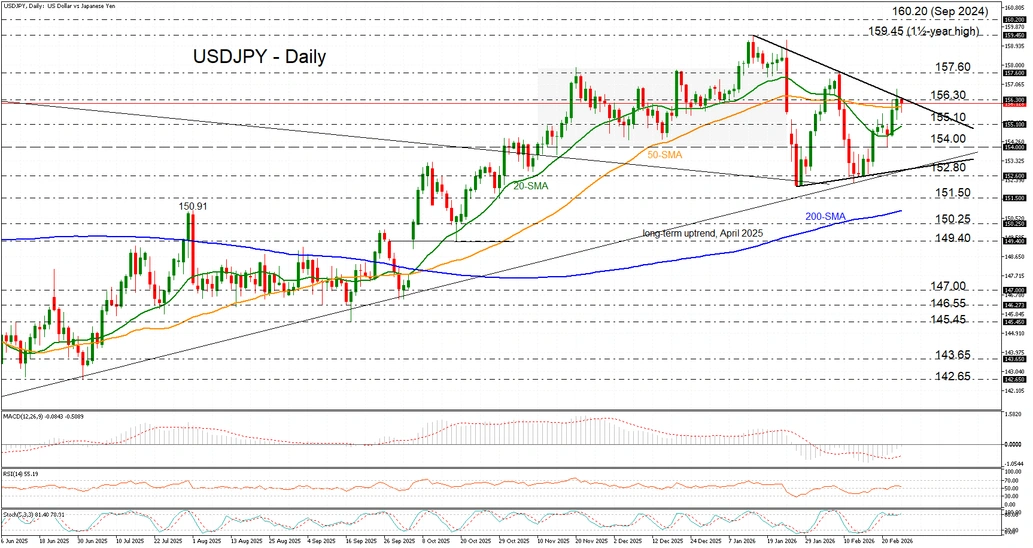
Chart Alert: WTI Crude Oil Bullish Flag in Play Above $64.15 as US-Iran Talk Looms
Key takeaways
- Oil pullback within strong uptrend: WTI eased 2.4% from its six-month high near $67 after a surprise 16 million-barrel surge in US crude inventories, but remains one of 2026’s top-performing assets with a 14.2% YTD gain.
- Geopolitical risk premium intact: Rising Middle East tensions and upcoming US-Iran nuclear talks in Geneva continue to underpin oil prices, keeping the broader bullish narrative alive despite short-term volatility.
- Bullish flag formation above key support: WTI is consolidating in a bullish flag above $64.15 and its 20-day MA. A breakout above $67 could target $67.80 and $69.08/69.35, while a break below $64.15 risks a pullback toward $62.38/62.05.
Since hitting a 6-month high of around $67.00/barrel last Thursday, 19 February 2026, the price action of WTI crude oil has staged a minor pullback of -2.4% to print an intraday low of around $65.20 on Wednesday, 25 February.
Yesterday’s lackluster movement in oil has been due to higher-than-expected U.S. crude inventories that rose by 16 million barrels last week, the most in three years, above consensus estimates of 1.5 million barrels, according to data compiled by the Energy Information Administration.
WTI crude is one of the top outperformers so far in 2026
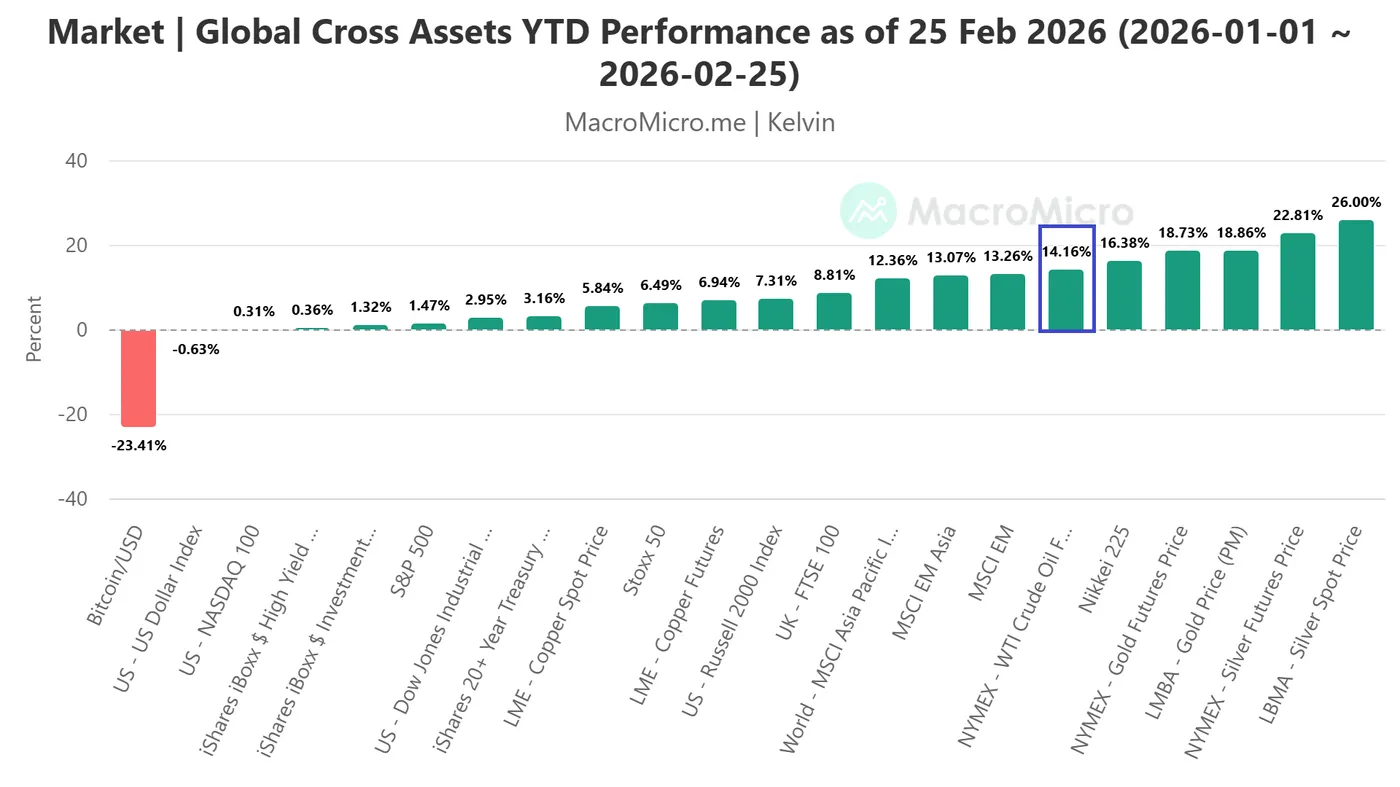
Fig. 1: WTI crude & other key cross assets year-to-date performances as of 25 Feb 2026 (Source: MacroMicro)
Oil has been one of the best-performing asset classes so far this year due to rising geopolitical risk premiums, especially out of the Middle East, as the US military forces amass in the region around the Red Sea ahead of the third round of US-Iran nuclear talks on Thursday, 26 February in Geneva.
WTI crude oil futures recorded a year-to-date gain of 14.2% as of Wednesday, 25 February 2026 (see Fig. 1). Let’s now focus on the short-term technicals of WTI crude.
WTI Oil – Bullish consolidation above 20-day moving average
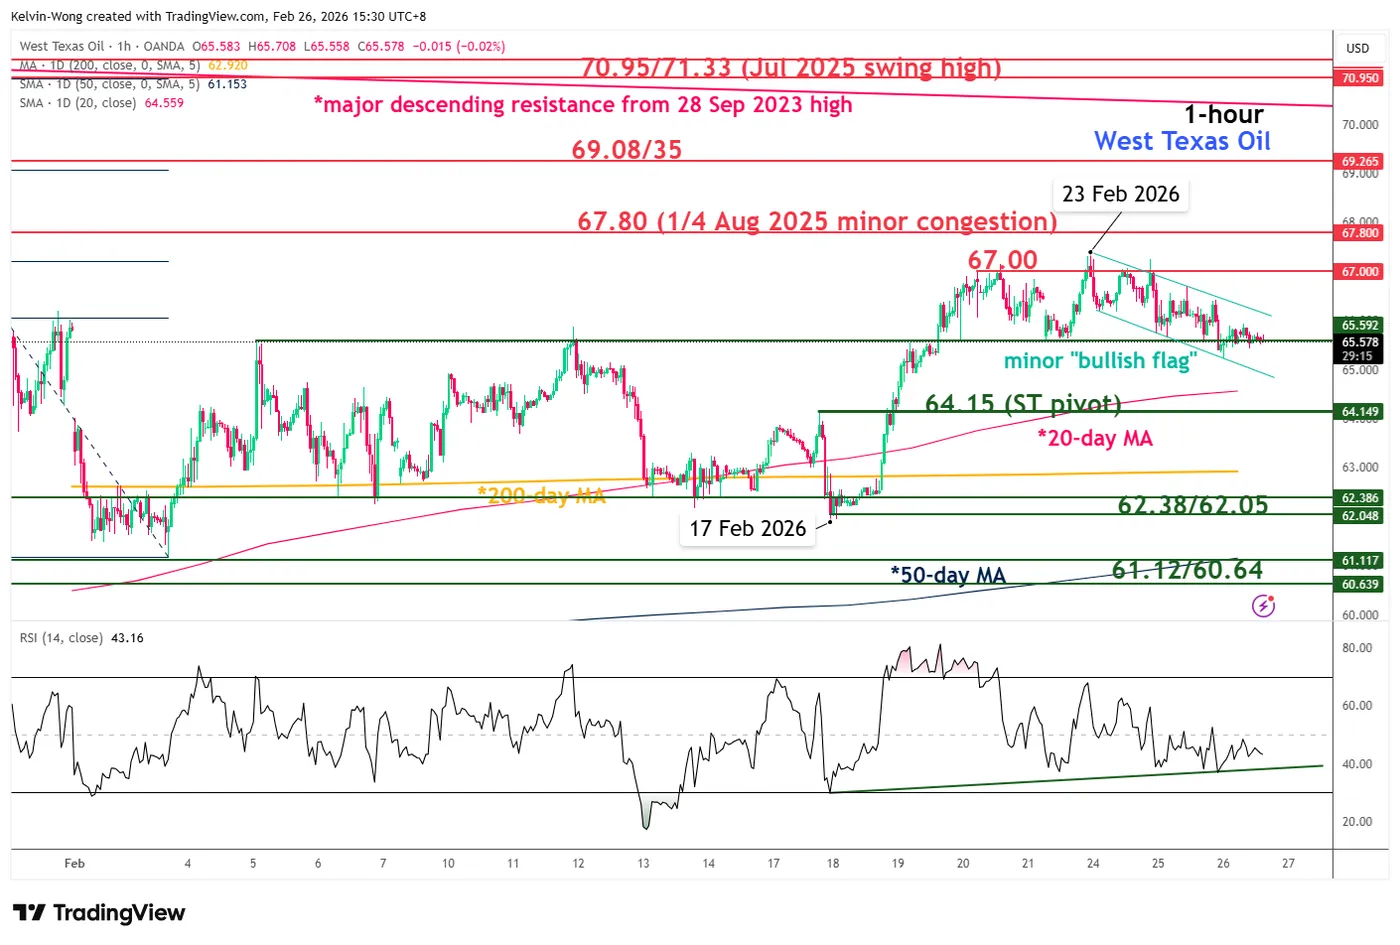
Fig. 2: West Texas Oil CFD minor trend as of 26 Feb 2026 (Source: TradingView)
Since Monday, 23 February 2026, the price actions of West Texas Oil CFD (a proxy of the WTI crude oil futures) have evolved into a potential minor “bullish flag” configuration, a type of bullish consolidation within an ongoing uptrend phase (see Fig. 2).
Watch the $64.15 key short-term pivotal support. A clearance above $67.00 increases the odds of a continuation of the minor bullish impulsive upmove sequence for the next intermediate resistances to come in at $67.80 and $69.08/69.35 (also a Fibonacci extension) in the first step.
However, a break and an hourly close below $64.15 invalidates the bullish tone for a slide to retest the next intermediate support zone of $62.38/62.05 (also the key 200-day moving average).
Key elements to support the bullish bias on WTI Oil
- Minor “bullish flag” configuration in play since Monday, 23 February 2026, above a rising 20-day moving average.
- The hourly RSI momentum indicator remains supported by an ascending trendline at around the 40 level.
USD/JPY Pulls Back After a Period of Gains
As the USD/JPY chart shows, the pair posted solid bullish momentum in the second half of February. This move was driven by a combination of fundamental factors, including:
- → The appointment of two academics to the central bank’s board, both regarded as strong advocates of economic stimulus through a weaker yen and accommodative lending conditions.
- → Concerns over further interest rate hikes, voiced by Japanese Prime Minister Sanae Takaichi during a meeting with Bank of Japan Governor Kazuo Ueda.
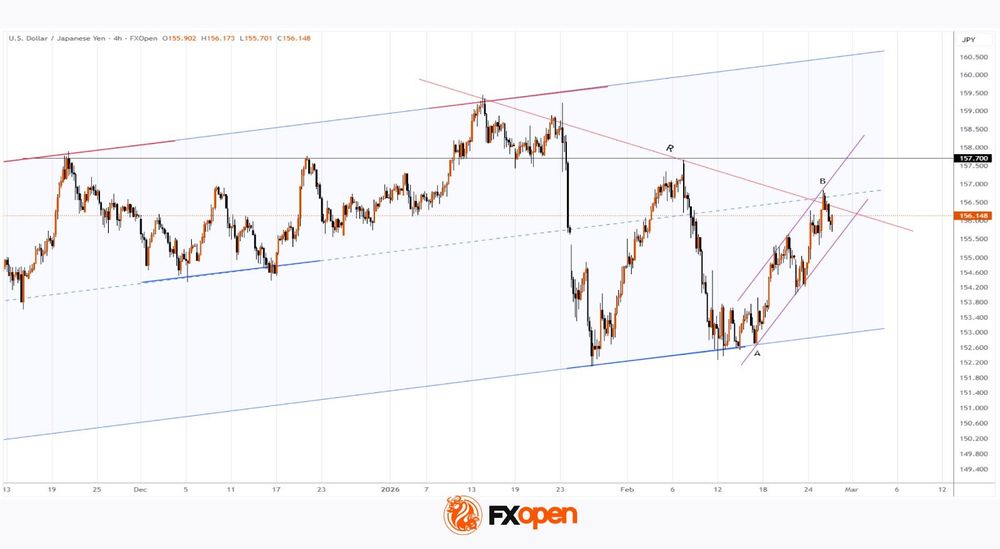
Expectations of a softer yen led to renewed weakness in the currency (A→B), forming the upward trajectory highlighted in purple.
However, on Wednesday the pair retreated, which appears to be an interim pullback from point B. Technical analysis of the USD/JPY chart suggests that extending the move along the purple trajectory may prove challenging.
Factors that could favour the bears include:
- → The median line of the ascending channel (constructed from key reversal points marked by thicker lines). The median often acts as a balance zone where supply and demand converge and trends lose momentum.
- → The proximity of the significant 157.70 resistance level, which already acted as resistance in 2025. Although price broke above it in January 2026 (with the level briefly showing signs of support), following the sharp sell-off on 23 January it once again served as a barrier for bulls on 9 February.
- → Trend line R, drawn through the lower highs of 2026.
Therefore, it cannot be ruled out that the lower purple boundary may be breached by bears, potentially leading the market into a period of consolidation while awaiting fresh economic and political catalysts.
Trade over 50 forex markets 24 hours a day with FXOpen. Take advantage of low commissions, deep liquidity, and spreads from 0.0 pips (additional fees may apply). Open your FXOpen account now or learn more about trading forex with FXOpen.
This article represents the opinion of the Companies operating under the FXOpen brand only. It is not to be construed as an offer, solicitation, or recommendation with respect to products and services provided by the Companies operating under the FXOpen brand, nor is it to be considered financial advice.
Yen on a (Slightly) Better Footing
Markets
Core bond and FX trading yesterday mostly was captured in technical trading. Eco data were few and uncertainty on AI moved to a bit to the background. US, UK and EMU yields stabilized or gained a few bps, taking a breather after this month’s protracted decline, often nearing first support levels. US yields added between 2.8 bps (5-y) and 1 bp (2-y). A $70 bln 5-y US Treasury auction tailed and met cautious investors interest. EMU yields changed less than 1 bp. Equity markets left AI-related uncertainty behind with Eurostoxx 50 (+0.93%) touching a new record. US indices gained between 0.63% (Dow) and 1.26% (Nasdaq), counting down to the Nvidia results after the close. FX cross rates stayed within the established ranges. The dollar initially held up well, but lost momentum as trading proceeded. US Trade Representative Jamieson Greer indicating that President Trump still intends to raise the global tariff to 15% (where appropriate) highlighted uncertainty related to US trade policy, often a negative for the dollar. EUR/USD regained the 1.18 big figure (close 1.181). For the DXY trade-weighted index, a test of the 98 big figure was rejected (close 97.7). The yen initially suffered from (perceived) pressure from the government on the BoJ to remain cautious on further policy tightening, but USD/JPY finally also eased from the intraday peak levels, closing at 156.4 from 155.9.
Asian equities show a mixed picture this morning. US futures are trading slightly in red. Nvidia results were strong but the market reaction for now is guarded. The dollar also loses modest ground (DXY.97.6, EUR/USD 1.182). The yuan continues its ‘astonishing’ comeback. At USD/CNY 6.84, the Chinese currency trades at the strongest level against the dollar since March 2023. The yen is on a (slightly) better footing compared to previous days. (Hawkish) BoJ member Takata advocated the central bank should engage in a further gear shift as he assesses that the 2% inflation target has been achieved. BoJ governor Ueda in an interview also indicated that the bank at least will take a close look at the data to decide on the timing of further hikes. The yen this morning ‘rebounds’ to USD/JPY 156. The US and EMU eco calendar mostly contains data that only have limited impact on trading. US weekly jobless claims are a wildcard. Also keep an eye at the a $44 bln 7-y US Treasury auction. On equity markets, question is which direction sentiment tilts after the Nvidia results. (Geo)politics might again come to the forefront as US-Iran nuclear talks resume in Geneva. Brent oil holds near $71 p/b. UK markets keep a close eye on a vote for a lawmaker seat in Manchester, seen as a ‘referendum’ on PM Starmer. A labour defeat might rekindle uncertainty similar to what happened early this month, potentially weighting on UK bonds and sterling. EUR/GBP for now holds just north of 0.87.
News & Views
The Bank of Korea unanimously decided to leave the Base Rate unchanged for a sixth meeting at 2.5%. Inflation is expected to remain stable near the target level. Consumer price and core inflation for this year are forecast at respectively 2.2% and 2.1% (vs 2.1% and 2% in November), affected by upward cost pressures on some items, including electronic devices. Economic growth is projected to continue improving at a stronger than expected pace, supported by a recovery in consumption and strong exports (global chip demand). The central bank now estimates growth at 2% for the year, up from 1.8% in November, with a balanced risk assessment. Risks to financial stability nevertheless remain as highlighted by volatility in FX (KRW, JPY), housing (price growth slowing in Seoul and surrounding areas thanks to government’s macroprudential policy) and stock markets. The BoK’s conditional interest rate horizon (doubled from 3 to 6 months) suggests a strong leaning to keeping policy rate stable over this time horizon. The Korean won this morning tested its best levels against USD so far this year at USD/KRW 1420 which is the neckline of a technical triple top formation with final target at 1360.
The IMF concluded its regular Article IV consultation of the US. Incorporating the effects of the various policy changes, staff expect growth to accelerate in 2026 to around 2.4% (on a q4/q4 basis). The inflationary impulse from tariffs is expected to wane in the coming months, allowing core PCE inflation to fall back to 2% by early 2027. Risks to the near-term outlook for growth and inflation are seen as balanced. The unemployment rate is seen steading close to 4% in 2026-2027 as the effects of slower employment growth and the ongoing slowing of population growth balance each other out. Such scenario should allow the Fed to lower the Fed funds target rate towards 3.25%-3.5% by year-end. Under current policies, the general government deficit is expected to remain in the 7-8 percent of GDP range, causing general government debt to reach 140 percent of GDP by 2031. Together with increasing levels of short-term debt this represents a growing stability risk to the US and global economy.
EUR/USD Daily Outlook
Daily Pivots: (S1) 1.1783; (P) 1.1799; (R1) 1.1826; More….
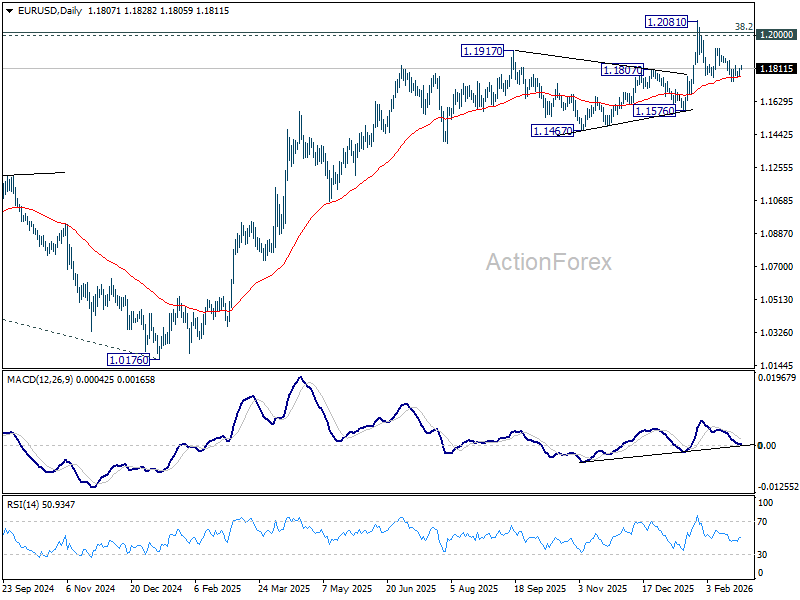
No change in EUR/USD's outlook and intraday bias stays neutral at this point. Near term risk will remain on the downside as long as 1.1928 resistance holds. Below 1.1740 temporary low will target 1.1576 support next. Firm break there should confirm rejection by 1.2 key psychological level and turn near term outlook bearish. However, break of 1.1928 argue that fall from 1.2081 has completed as a correction, and revive near term bullishness. Retest of 1.2081 should then be seen next.
In the bigger picture, as long as 55 W EMA (now at 1.1494) holds, up trend from 0.9534 (2022 low) is still in favor to continue. Decisive break of 1.2 key psychological level will add to the case of long term bullish trend reversal. Next medium term target will be 138.2% projection of 0.9534 to 1.1274 from 1.0176 at 1.2581. However, sustained trading below 55 W EMA will argue that rise from 0.9534 has completed as a three wave corrective bounce, and keep long term outlook bearish.
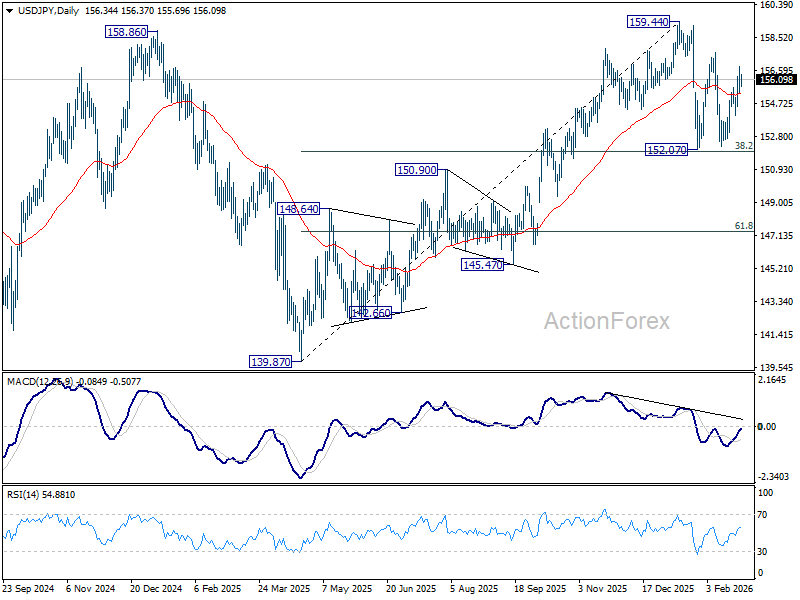
USD/JPY Daily Outlook
Daily Pivots: (S1) 155.54; (P) 156.19; (R1) 157.02; More...
Intraday bias in USD/JPY is turned neutral with current retreat. On the upside, above 156.81 temporary top will resumed the rally from 152.25 to 157.65 resistance first. Firm break there will target a retest on 159.44. high. On the downside, however, break of 153.90 will bring deeper fall to 152.25 support. Overall, with 38.2% retracement of 139.87 to 159.44 at 151.96 intact, price actions from 159.44 are seen as a corrective pattern. Also, rise from 139.87 is expected to resume through 159.44 at a later stage.
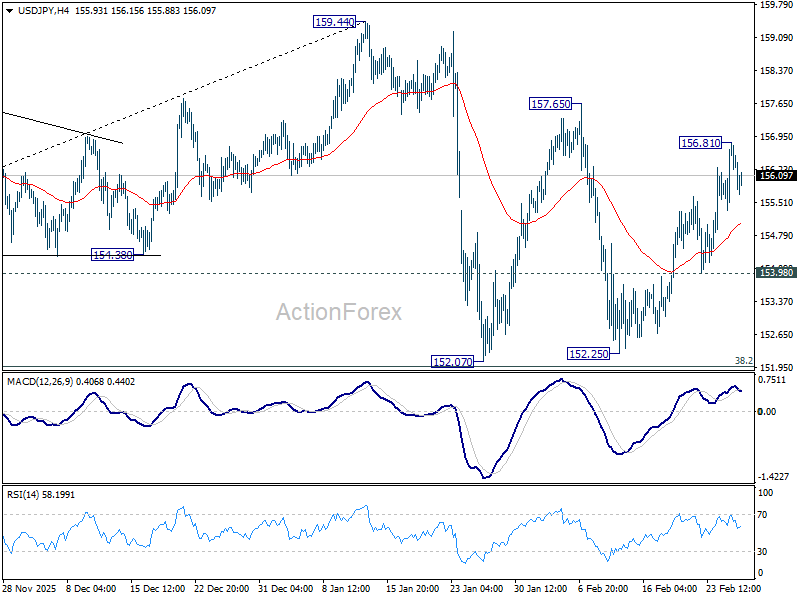
In the bigger picture, outlook is unchanged that corrective pattern from 161.94 (2024 high) should have completed with three waves at 139.87. Larger up trend from 102.58 (2021 low) could be ready to resume through 161.94. This will remain the favored case as long as 55 W EMA (now at 151.93) holds. However, sustained break of 55 W EMA will argue that the pattern from 161.94 is extending with another falling leg.
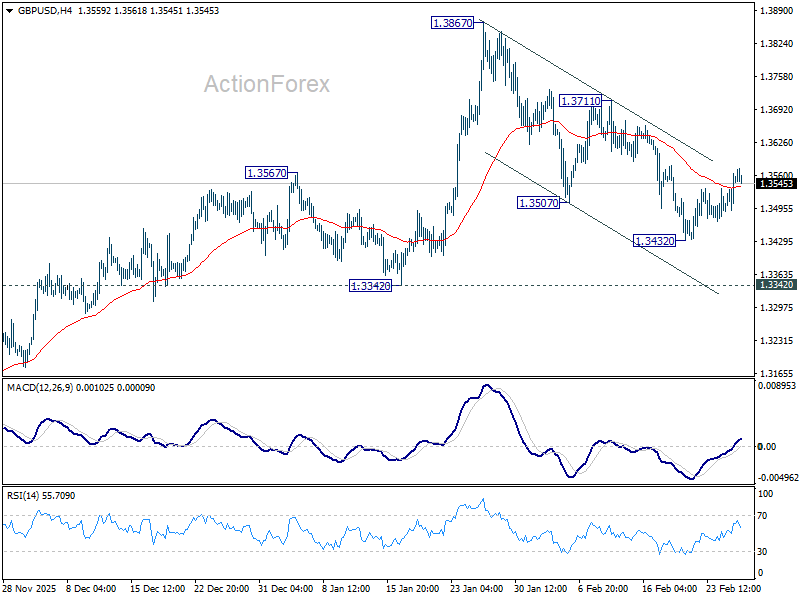
GBP/USD Daily Outlook
Daily Pivots: (S1) 1.3509; (P) 1.3537; (R1) 1.3588; More...
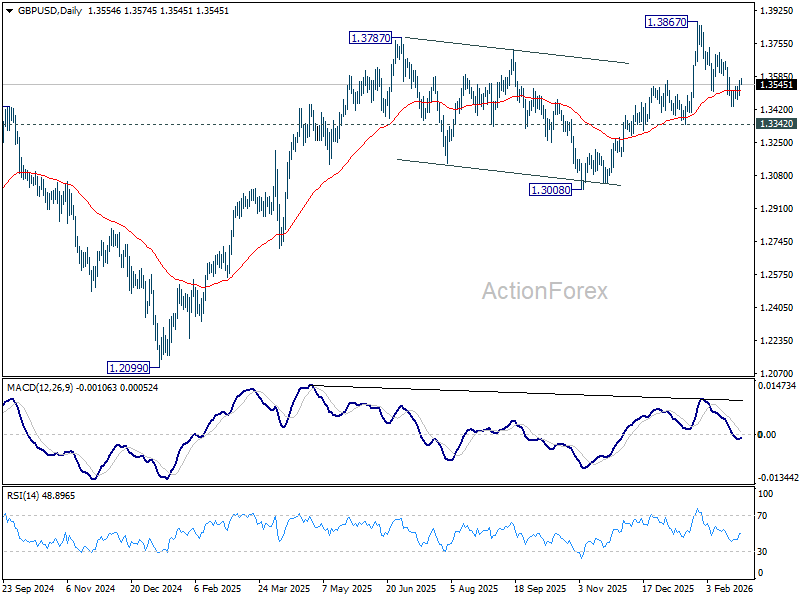
Intraday bias in GBP/USD remains neutral for the moment. On the downside, below 1.3432 will resume the fall from 1.3867 to 1.3342 support. Firm break there should confirm that it's already correcting the whole rise from 1.2099. However, break of 1.3711 resistance will argue that the decline has completed as a near term correction, and turn bias back to the upside for retesting 1.3867.
In the bigger picture, as long as 1.3008 support holds, rise from 1.3051 (2022 low) should still be in progress for 1.4284 key resistance (2021 high). Decisive break there will add to the case of long term bullish trend reversal. However, firm break of 1.3008 will raise the chance of medium term bearish reversal and target 1.2099 support next.
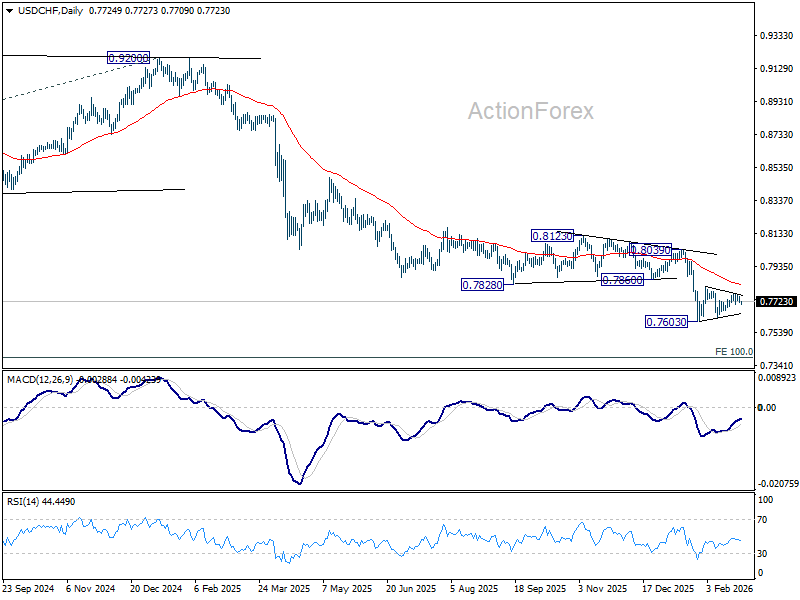
USD/CHF Daily Outlook
Daily Pivots: (S1) 0.7712; (P) 0.7735; (R1) 0.7751; More….
Intraday bias in USD/CHF remains neutral as consolidation pattern from 0.7603 is still extending. In case of stronger rise, upside upside should be limited by 55 D EMA (now at 0.7828) to complete the pattern. On the downside, below 0.7627 will bring retest of 0.7603. Firm break there will resume larger down trend, and target 0.7382 projection level next. However, sustained break of 55 D EMA will indicate that a larger scale corrective bounce in underway and target 0.8039 resistance next.
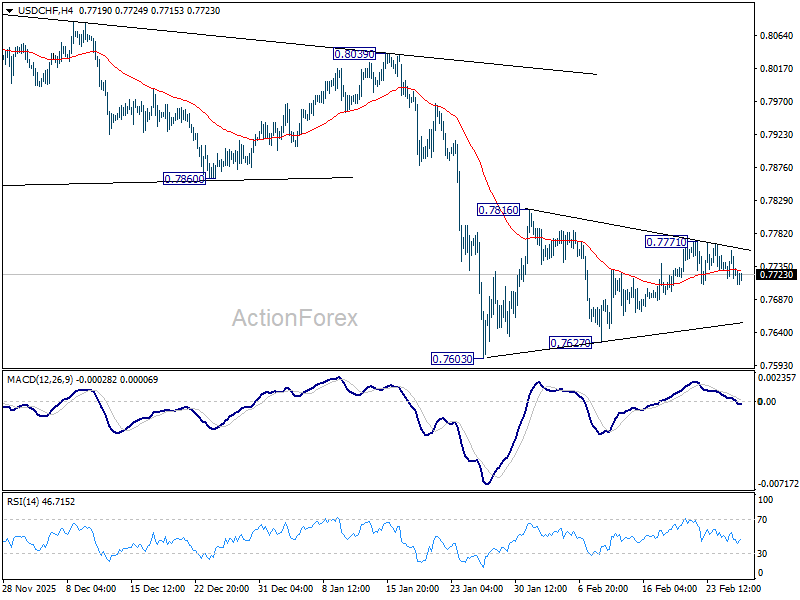
In the bigger picture, down trend from 1.0342 (2017 high) is still in progress. Next target is 100% projection of 1.0146 (2022 high) to 0.8332 from 0.9200 at 0.7382. In any case, outlook will stay bearish as long as 0.8123 resistance holds.
Nvidia Shines, Yet Markets Stay Cautious
No surprise, Nvidia announced another spectacular set of results when it reported its Q4 earnings yesterday, after the US closing bell. The company posted $68.1bn in revenue, 73% higher than the same period last year, with 90% of that coming from its data-center division. Net income almost doubled, and gross margin improved to 75% — all significantly better than analysts had expected.
Addressing concerns that Google’s TPUs — designed for AI inference, far more energy-efficient and cheaper than Nvidia’s — could steal business, Jensen Huang said that his company is “the king of inference today” and that the Blackwell and next-generation Vera Rubin platforms “will extend that leadership further”, adding that adoption of agentic AI is skyrocketing.
Although his words may sound over-the-top, Huang has delivered consistently on his promises over the past three years.
Looking ahead, Nvidia projected Q1 revenue of $78bn, well above the $73bn forecast by equity analysts.
In short: The results were great, the forecast was great, the guidance was great.
Beneath the surface, the gap between revenue and cash generated also narrowed meaningfully.
Nvidia rose 3% in after-hours trading and is likely to challenge the $200+ mark at the open. If that reaction seems modest given the strength of the results, it’s because important concerns remain:
- The Coastal Journal — which had previously highlighted the gap between Nvidia’s revenue and cash, comparing its accounting practices to Enron’s — flagged again that 36% of Nvidia’s revenue now comes from two large clients.
- These clients, not explicitly disclosed, are likely among those leveraging their balance sheets to make these purchases, a point investors are growingly dislike.
So, while Nvidia delivered another blockbuster quarter, it doesn’t fully revive global risk appetite. SoftBank rebounded almost 4% in Japan this morning, but Nasdaq futures are pointing lower, trailing major US and European peers. Nvidia can keep its own head above water, but it may not drive global risk appetite alone, anymore.
In other earnings, Salesforce — closely watched amid the SaaS-pocalyptic environment — slipped 4.5% in after-hours trade despite beating analyst expectations on both revenue and EPS. Investors focused on Salesforce’s fiscal 2027 guidance, which came in just below consensus and signaled only mid-single-digit revenue growth. Many traders interpreted this as a sign that near-term growth remains tepid amid broader concerns about slowing enterprise tech spending and AI competition.
The latter may not improve appetite in software stocks.
But this could: Anthropic Claude, originally a major driver of SaaS fears, reported a hack exposing sensitive Mexican government data. This incident could at least provide support for cybersecurity stocks.
Overall, analysts worldwide have pushed back against Citrini’s earlier report predicting that AI would destroy jobs, companies and economies. Many — including myself — criticize the report as overly dramatic, bordering on science fiction.
What is less speculative, however, is the rise in private credit default risks. UBS this week increased private credit default risk warnings from 13% to 15%, noting that aggressive AI disruption could stress corporate borrowers. JPMorgan’s CEO drew parallels with the subprime crisis.
In short, AI fears may be overdone, but market reactions could temporarily amplify risks to financial assets, which is never good news.
Zooming out, the S&P 500 is set for a softer open despite gains in Asian tech indices. With waning US tech appetite, the rotation trade may need to do the heavy lifting to keep the S&P 500 positive.
This rotation trade now has a new acronym: HALO — Heavy Assets, Low Obsolescence. It suggests that companies with large physical assets are likely to attract capital flows as they are less vulnerable to rapid technological disruption, unlike many high-growth software/AI names. Investors are rotating from expensive AI and growth stocks into businesses with tangible infrastructure and long-lived assets — energy, materials, industrials, shipping, and other “real world” enterprises.
In this context, the FTSE 100 is well positioned to benefit from HALO inflows, rallying from record to record, driven by energy and mining names. Interestingly, yesterday’s inflows were strong enough to offset sterling’s strength.
In FX, the US Dollar remains under selling pressure against most majors. The EUR/USD extends gains above the 50-DMA, supported by softer-than-expected euro-area inflation, which reinforces expectations that the European Central Bank (ECB) could support European economies amid renewed external stress — yes, I’m looking at you, tariff uncertainty. The USD/JPY retraced yesterday’s advance, but yen bears remain confident given the government’s preference for a softer Bank of Japan (BoJ) policy over normalization.
In metals, Gold consolidates near $5’200, while US crude is marginally down, with tactical bulls waiting in ambush. Rising US-Iran tensions could push crude above $68pb toward $70pb, whereas easing tensions should bring it below the 200-DMA near $62.85pb.
Absent major data or events, today should focus on digesting Nvidia results and software commentary to gauge the next steps: Are the latest market risks regarding technology waning, are investors ready to jump back in, or has the valuation pullback been too soft to make technology interesting for dip buyers? I would bet on the latter.