
Sample Category Title
Sunset Market Commentary
Markets
Global markets remain indecisive. European yields are changing 1-2 bps across the curve. The (absence of) movement came as ECB president Lagarde testified at a hearing before the Committee of Economic and Monetary affairs of the European Parliament. Lagarde assessed that inflation has fallen markedly and is fluctuating in a narrow range near 2%. Headline inflation in January even dropped to 1.7%. The ECB chair remains relatively optimistic on growth. Wage growth remains elevated but has eased gradually and is expected to continue to moderate to around 3% in the medium term. Interestingly, Lagarde elaborated on the gap between actual inflation data and inflation as perceived by consumers. Citizens still perceive prices to be rising faster than the official data suggest. This gap, while not unusual by historic standards, ‘has implications for economic decisions and for trust in institutions – trust that helps anchor inflation expectations’. In this respect, ECB consumer CPI inflation expectations will be published (January) tomorrow. Even as the ECB projects CPI inflation to hold close to 2% over the policy horizon, consumers in the December survey saw 1-y inflation expectations at 2.8% and 3-y expectations at 2.6%. The ECB chair at this stage elaborating on the topic at least does not suggest that the central bank is inclined to swiftly react to a (temporary) undershoot of headline inflation. US yields initially also traded unchanged, but finally some further easing continued (2-3 bps across the curve). Weekly jobless claims rose slightly from 208k to 212k. However, data might be distorted due to the Presidents Day Holiday. Even so, the level at least also suggest nothing worrisome happening on the US labour market. Similar hesitancy on equity markets as investors stay cautious in their assessment on solid Nvidia results published yesterday in the US after the close. Still, the EuroStoxx 50 touched a new all-time record intraday (currently little changed). US indices open mixed (Dow +0.45%; Nasdaq + -0.5%). On FX, EUR/USD is going nowhere near the 1.18 big figure. The yen this morning tried a cautions rebound as (hawkish) BOJ member Takata reiterated his view that Japan almost reached price stability, paving the way for further normalization. However, both the rise in Japanese yields and the yen was limited and/or temporary (yen). Markets apparently aren’t convinced that Takata’s assessment has enough weight to counterbalance PM Takaichi ‘hope’ for monetary policy to continue supporting her reflationist approach. USD/JPY hovers near 156.
News & Views
Belgian inflation in February quickened to 1.45% from 1.1% with a 0.54% monthly pace picking up too from last month’s 0.44%. Core inflation, which does not take into account energy products and unprocessed food, stood at 2.83% in February, compared to 2.54% in January. Inflation for services has gone from 4.32% to 4.75% while rents inflation decreased from 3.55% last month to 3.48% this month. Food inflation stands at 0.66% this month, up from 0.44%. Plane tickets (25.1%), electricity (3.9%) and natural gas (4.5%) showed some of the biggest increases. Clothing (-3.3%) and confectionery (-2.9%) weighed down on the index. The first inflation estimate according to the European harmonised index of consumer prices (HICP) amounts to 1.4% in February 2026.
Former Italian PM Enrico Letta in an Op-ed for Politico doubled down on his long-standing call for the completion of the European single market. He considers it as the strongest response Europe can offer in “a world reshaped by Trump and by the accelerating logic of geopolitical competition”. Letta said we currently have the sum of 27 national markets, calling it a political and strategical weakness that we pay for in higher costs, weaker investments, slower innovation and reduced capacity to act in the world. He proposes the One Market Act in which a small number of game-changing priorities are outlined so that things remain realistic yet ambitious. Three of them are sectoral with Letta calling for a true savings and investments union to unlock private capital, a complete energy union to reduce (external) exposedness and a united telecom that allows for technological sovereignty. Letta additionally stresses the importance of free flow of knowledge, data, research and skills while advocating for a European legal framework (the 28th regime) alongside national ones so that companies can scale across borders with simplicity. Finally, Letta said a stronger market must go hand in hand with cohesion, essential services, SMEs and a robust social dimension as not to undermine support for the European project.
EUR/USD Mid-Day Outlook
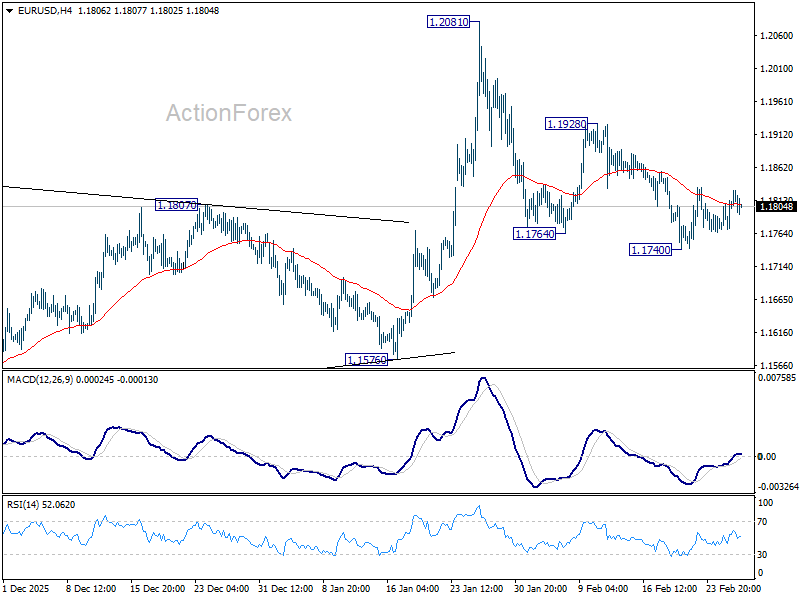
Daily Pivots: (S1) 1.1783; (P) 1.1799; (R1) 1.1826; More….
Intraday bias in EUR/USD stays neutral for the moment. Near term risk will remain on the downside as long as 1.1928 resistance holds. Below 1.1740 temporary low will target 1.1576 support next. Firm break there should confirm rejection by 1.2 key psychological level and turn near term outlook bearish. However, break of 1.1928 argue that fall from 1.2081 has completed as a correction, and revive near term bullishness. Retest of 1.2081 should then be seen next.
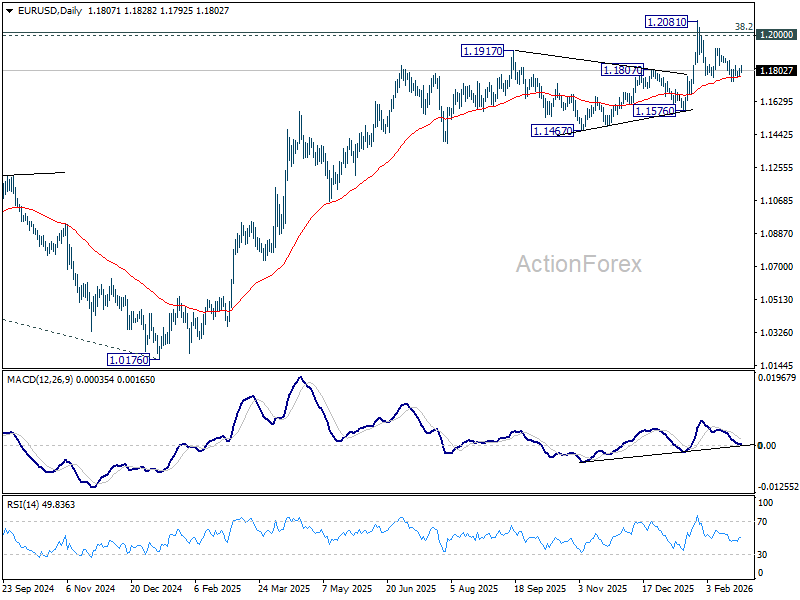
In the bigger picture, as long as 55 W EMA (now at 1.1494) holds, up trend from 0.9534 (2022 low) is still in favor to continue. Decisive break of 1.2 key psychological level will add to the case of long term bullish trend reversal. Next medium term target will be 138.2% projection of 0.9534 to 1.1274 from 1.0176 at 1.2581. However, sustained trading below 55 W EMA will argue that rise from 0.9534 has completed as a three wave corrective bounce, and keep long term outlook bearish.
GBP/USD Mid-Day Outlook
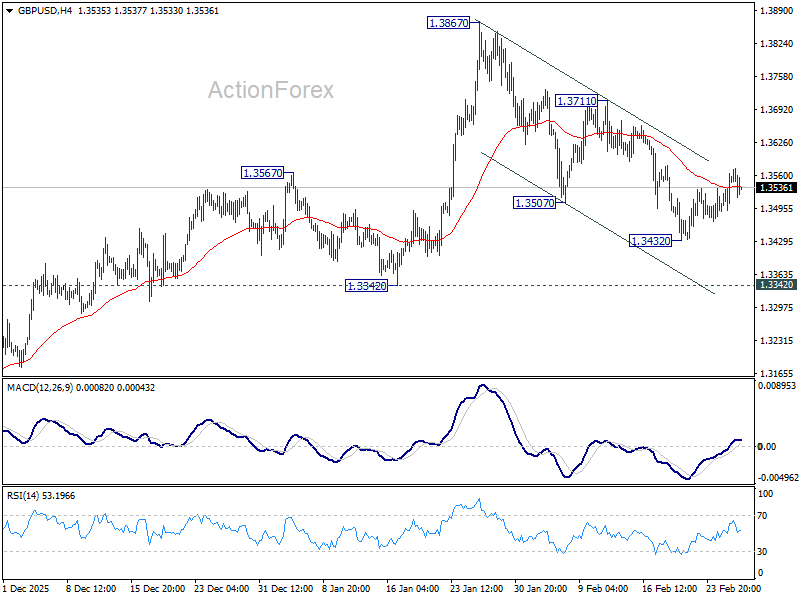
Daily Pivots: (S1) 1.3509; (P) 1.3537; (R1) 1.3588; More...
Range trading continues in GBP/USD and intraday bias stays neutral. On the downside, below 1.3432 will resume the fall from 1.3867 to 1.3342 support. Firm break there should confirm that it's already correcting the whole rise from 1.2099. However, break of 1.3711 resistance will argue that the decline has completed as a near term correction, and turn bias back to the upside for retesting 1.3867.
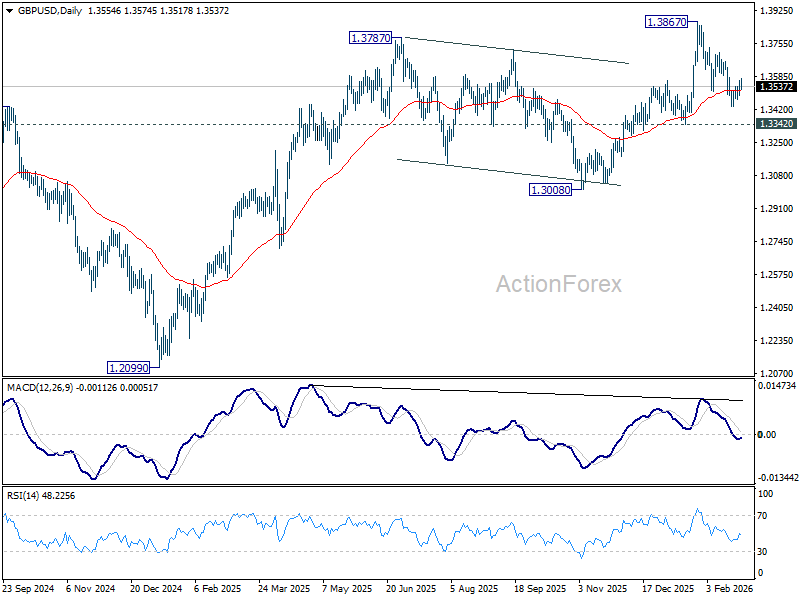
In the bigger picture, as long as 1.3008 support holds, rise from 1.3051 (2022 low) should still be in progress for 1.4284 key resistance (2021 high). Decisive break there will add to the case of long term bullish trend reversal. However, firm break of 1.3008 will raise the chance of medium term bearish reversal and target 1.2099 support next.
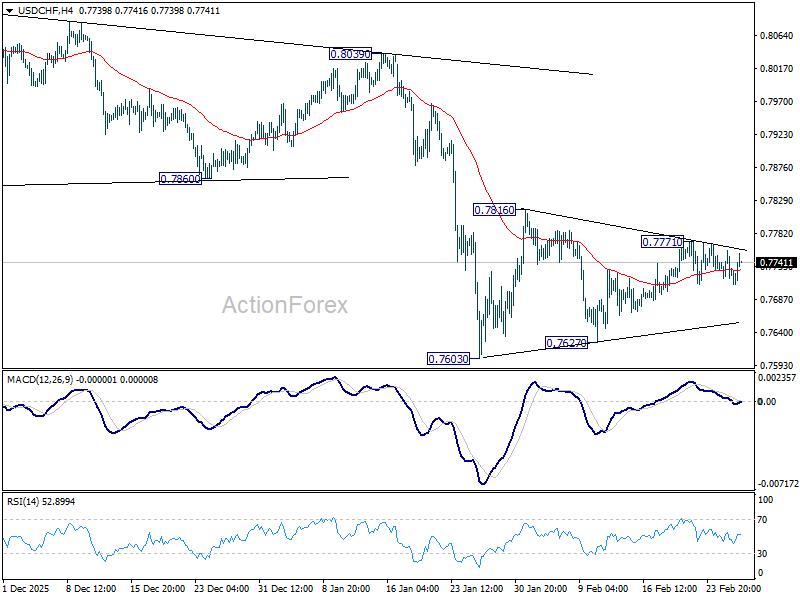
USD/CHF Mid-Day Outlook
Daily Pivots: (S1) 0.7712; (P) 0.7735; (R1) 0.7751; More….
USD/CHF is still extending consolidation pattern from 0.7603 and intraday bias remains neutral. In case of stronger rise, upside should be limited by 55 D EMA (now at 0.7828) to complete the pattern. On the downside, below 0.7627 will bring retest of 0.7603. Firm break there will resume larger down trend, and target 0.7382 projection level next. However, sustained break of 55 D EMA will indicate that a larger scale corrective bounce in underway and target 0.8039 resistance next.
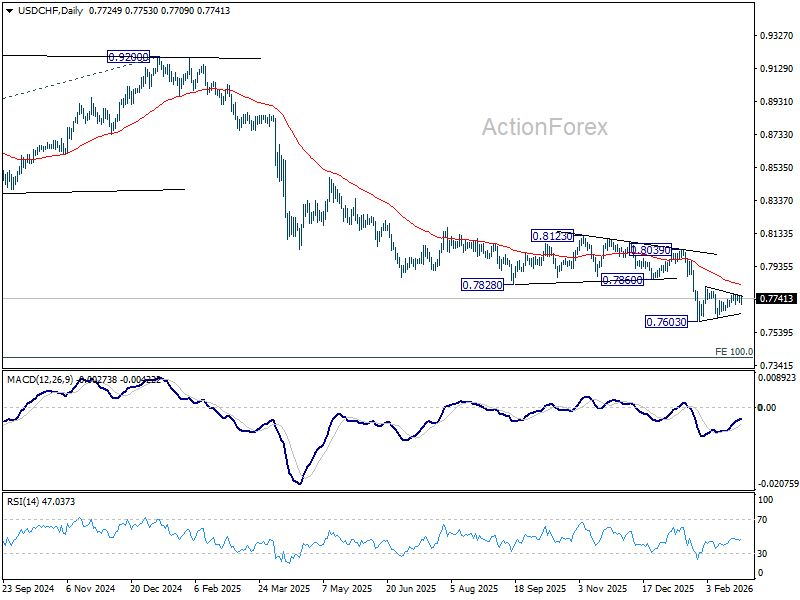
In the bigger picture, down trend from 1.0342 (2017 high) is still in progress. Next target is 100% projection of 1.0146 (2022 high) to 0.8332 from 0.9200 at 0.7382. In any case, outlook will stay bearish as long as 0.8123 resistance holds.
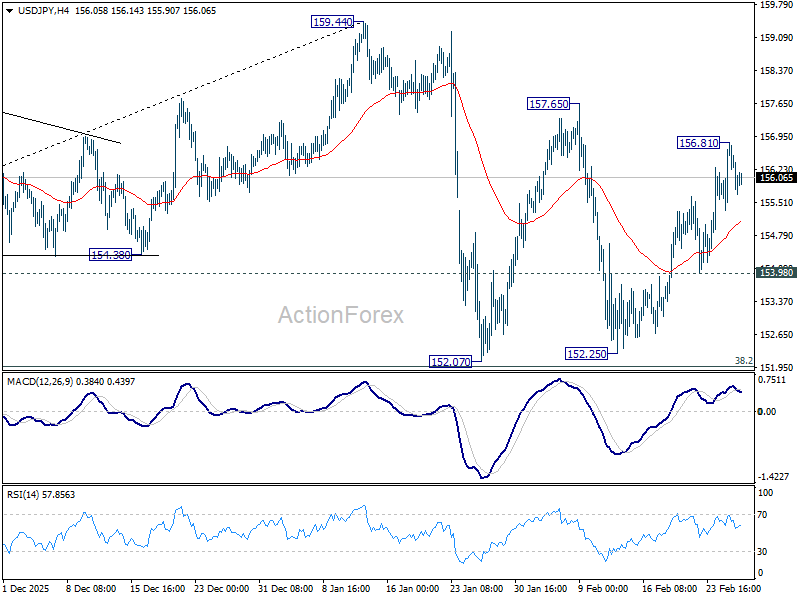
USD/JPY Mid-Day Outlook
Daily Pivots: (S1) 155.54; (P) 156.19; (R1) 157.02; More...
Intraday bias in USD/JPY remains neutral and some more consolidations could be seen below 156.81 temporary top. On the upside, above 156.81 will resume the rally from 152.25 to 157.65 resistance first. Firm break there will target a retest on 159.44. high. On the downside, however, break of 153.90 will bring deeper fall to 152.25 support. Overall, with 38.2% retracement of 139.87 to 159.44 at 151.96 intact, price actions from 159.44 are seen as a corrective pattern. Also, rise from 139.87 is expected to resume through 159.44 at a later stage.
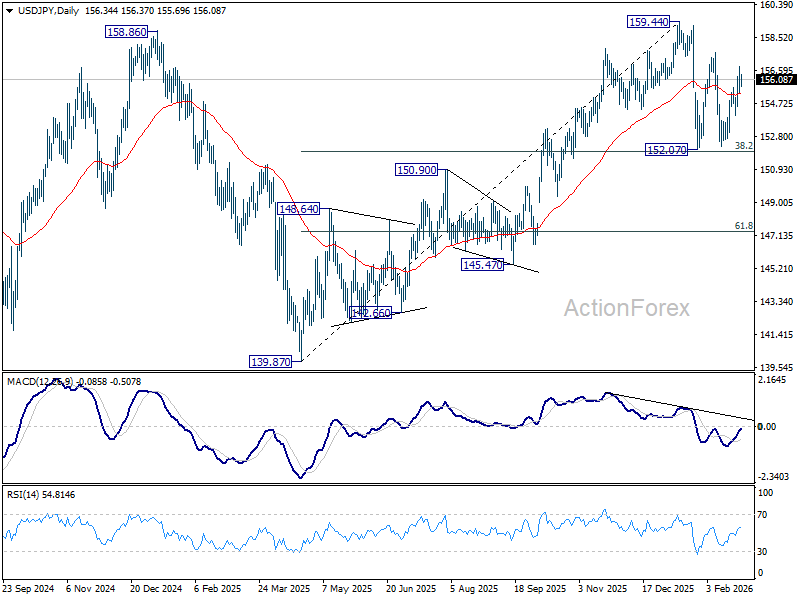
In the bigger picture, outlook is unchanged that corrective pattern from 161.94 (2024 high) should have completed with three waves at 139.87. Larger up trend from 102.58 (2021 low) could be ready to resume through 161.94. This will remain the favored case as long as 55 W EMA (now at 151.93) holds. However, sustained break of 55 W EMA will argue that the pattern from 161.94 is extending with another falling leg.
FX Calm as Oil Slips on Receding War Risk, Yuan Breaks Higher
FX markets are subdued, with major pairs largely contained within recent ranges. Dollar is edging higher from earlier lows, but the move lacks follow-through amid a strong risk-on backdrop. Yen staged a mild recovery after hawkish signals from BoJ officials, yet it remains the week’s worst performer. Risk-on dynamics continue to outweigh policy rhetoric.
For the week so far, Australian Dollar still tops the board, though upside momentum has softened. The currency appears to be consolidating after its CPI-driven advance, while struggling to break decisively against the greenback. Sterling and Euro are also on the firmer side, while Kiwi and Swiss Franc trade in the middle. On the other hand, Yen, Dollar, and Loonie sit at the bottom of the leaderboard.
With no major data releases today, currencies are trading off broader risk tone and geopolitical developments, particularly the latest round of US-Iran negotiations in Geneva. Ahead of that, oil prices have dipped notably, with WTI slipping back below 65 and Brent under 70, reversing last week’s surge. The pullback reflects growing optimism that diplomacy may prevail over escalation.
The third round of US-Iran negotiations opened in Geneva. Reports from Geneva suggest Iran is showing seriousness and flexibility, potentially paving the way for at least an interim nuclear agreement. While tensions remain, investors increasingly see the probability of immediate military conflict as lower than earlier feared.
The standout story, however, is Chinese Yuan. It has reached its strongest level against Dollar since early 2023 and broken a significant technical barrier against Euro, marking its strongest level since May 2025. This is not merely a Dollar-weakness move. The appreciation is broad-based and could reflect shifting geopolitical calculations.
German Chancellor Friedrich Merz’s visit to Beijing appears to be a contributing factor. European officials have openly called for a stronger Yuan to help rebalance trade. The surge in Yuan is being read as a "calculated concession" by Beijing. By allowing the Yuan to rise, China is signaling a willingness to reduce the trade imbalance in exchange for avoiding a "two-front" trade war with both the US and the EU. Additionally, some investors anticipate the People's Bank of China will tolerate continued appreciation into the “Two Sessions” to reinforce economic stability messaging.
In Europe, at the time of writing, FTSE is up 0.21%. DAX is up 0.44%. CAC is up 0.89%. UK 10-year yield is down -0.023 at 4.300. Germany 10-year yield is down -0.001 at 2.709. Earlier in Asia, Nikkei rose 0.29%. Hong Kong HSI fell -1.44%. China Shanghai SSE fell -0.01%. Singapore Strait Times fell -0.87%. Japan 10-year JGB yield rose 0.01 to 2.157.
US initial jobless claims edge higher to 212k, vs exp 211k
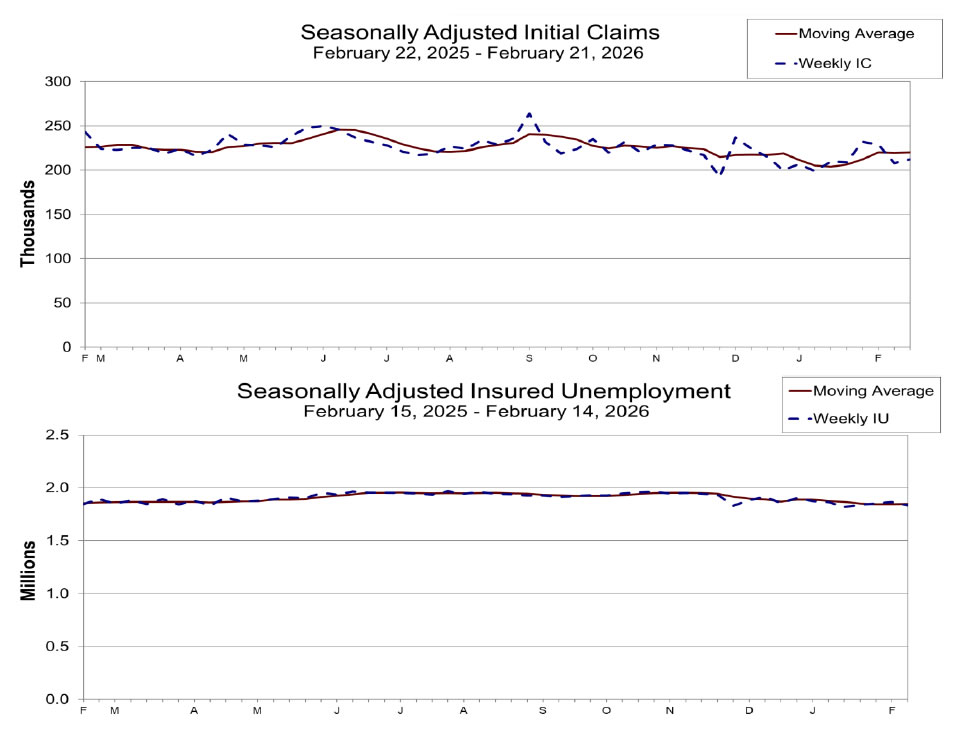
US initial jobless claims rose 4k to 212k in the week ending February 21, slightly above expectation of 211k. Four-week moving average of initial claims rose 1k to 220k.
Continuing claims fell -31k to 1,833k in the week ending February 14. Four-week moving average of continuing claims rose 3.5k to 1,848k.
Eurozone economic sentiment moderates in February, services drag
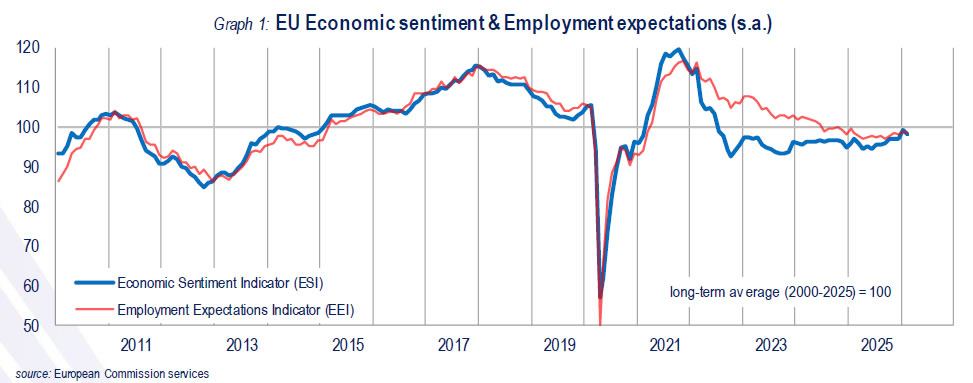
Economic sentiment in Europe softened in February, with the Economic Sentiment Indicator falling by 1.0 point to 98.3 in both the EU and the Eurozone. The Employment Expectations Indicator also declined, slipping to 98.5 in the EU and 97.6 in the Eurozone. Both gauges remain slightly below their long-term average of 100.
The drop in the ESI was driven primarily by a marked deterioration in services confidence, while construction also contributed modestly to the decline. In contrast, sentiment in industry and among consumers was broadly stable, and retail trade confidence continued to improve, suggesting that weakness is not yet broad-based.
Among the largest EU economies, France (-2.8) recorded the sharpest fall in sentiment, followed by Poland (-1.9) and Italy (-0.6). Germany and the Netherlands (-0.2 each) saw only marginal declines, while Spain was broadly unchanged.
ECB’s Lagarde: Rising real incomes to support growth
Speaking before the European Parliament’s Committee on Economic and Monetary Affairs, ECB President Christine Lagarde said the Eurozone economy should find support from rising labor income and resilient employment. Investment in defence, infrastructure and digital transformation is also expected to underpin growth, even as the region faces higher tariffs, a stronger Euro and ongoing global policy volatility.
She pointed out that real wages growth have moved above early-2021 levels, reflecting inflation that has fallen below nominal wage gains. Although wage growth is still elevated, it is gradually moderating and expected to settle near 3% over the medium term.
Lagarde reaffirmed that the ECB sees inflation stabilizing around its 2% target. That assessment supported the decision earlier this month to keep key interest rates unchanged.
Looking ahead, she emphasized that policy will remain data-dependent and assessed meeting by meeting. ""We are not pre-committing to a particular interest rate path," she reiterated.
BoJ's Ueda signals hike still possible in spring
BoJ Governor Kazuo Ueda signaled that a March or April rate hike remains on the table, stating in a Yomiuri interview that the central bank will continue raising interest rates if economic and price projections evolve as expected. "We will hold a policy meeting in March and April, so we would like to reach a decision by scrutinising data available by then," he said.
Additionally, Ueda noted that the BOJ does not necessarily need to wait for the quarterly Tankan survey release on April 1 to act, as it relies on a range of business and economic indicators. He also also rejected suggestions that the BOJ is behind the curve on inflation, arguing that underlying price pressures have yet to fully reach the 2% target.
Markets had earlier pared back expectations for a near-term hike after reports that Prime Minister Sanae Takaichi expressed reservations about further rate increases. Ueda’s remarks appear to have recalibrated those bets, bringing March and April back into active consideration as the BoJ weighs the impact of December’s hike on lending, investment, and consumption.
Takata says BoJ should consider another “gear shift”
BoJ Board member Hajime Takata said in a speech that overseas risks, particularly around tariff policy, had been a key consideration when evaluating the timing of another rate increase. However, he said initial concerns over those external factors "have abated", clearing part of the uncertainty that had previously restrained policy action.
Domestically, Takata emphasized that Japan’s long-standing "the norm of prices not increasing easily has already been dispelled". Medium- to long-term inflation expectations have risen. Price increases now "have a greater tendency to generate second-round effects". He also cautioned that external shocks could produce greater-than-expected price surges.
Looking ahead, Takata highlighted expectations of a fourth consecutive round of wage increases in 2026, driven largely by base pay gains. In that context, he said the BOJ should prepare for another “gear shift” in policy and communicate under the assumption that the 2% price stability target is nearly achieved.
NZ business confidence falls, wage and price expectations rise
New Zealand’s ANZ Bank Business Confidence index eased from 64.1 to 59.2 in February. However, the Own Activity Outlook edged higher from 51.6 to 52.6, suggesting firms remain broadly optimistic about their near-term operating conditions.
Beneath the surface, inflation pressures appear to be building again. The net percentage of firms expecting to raise prices over the next three months fell 4 points to 53%, partially reversing last month’s surge. Yet cost expectations remain elevated, with 79% of firms anticipating higher costs — the highest level since July 2023.
More notably, one-year inflation expectations rose from 2.77% to 2.93%, their highest level since July 2024. Wage expectations climbed above 3% for the first time since April 2024.
ANZ noted that pricing intentions are not consistent with widespread expectations of a steady decline in headline inflation this year. Although inflation is projected to return to the target band in Q1 and the RBNZ has expressed confidence in the disinflation path, the survey highlights ongoing upside risks.
USD/JPY Mid-Day Outlook
Daily Pivots: (S1) 155.54; (P) 156.19; (R1) 157.02; More...
Intraday bias in USD/JPY remains neutral and some more consolidations could be seen below 156.81 temporary top. On the upside, above 156.81 will resume the rally from 152.25 to 157.65 resistance first. Firm break there will target a retest on 159.44. high. On the downside, however, break of 153.90 will bring deeper fall to 152.25 support. Overall, with 38.2% retracement of 139.87 to 159.44 at 151.96 intact, price actions from 159.44 are seen as a corrective pattern. Also, rise from 139.87 is expected to resume through 159.44 at a later stage.
In the bigger picture, outlook is unchanged that corrective pattern from 161.94 (2024 high) should have completed with three waves at 139.87. Larger up trend from 102.58 (2021 low) could be ready to resume through 161.94. This will remain the favored case as long as 55 W EMA (now at 151.93) holds. However, sustained break of 55 W EMA will argue that the pattern from 161.94 is extending with another falling leg.
US initial jobless claims edge higher to 212k, vs exp 211k
US initial jobless claims rose 4k to 212k in the week ending February 21, slightly above expectation of 211k. Four-week moving average of initial claims rose 1k to 220k.
Continuing claims fell -31k to 1,833k in the week ending February 14. Four-week moving average of continuing claims rose 3.5k to 1,848k.
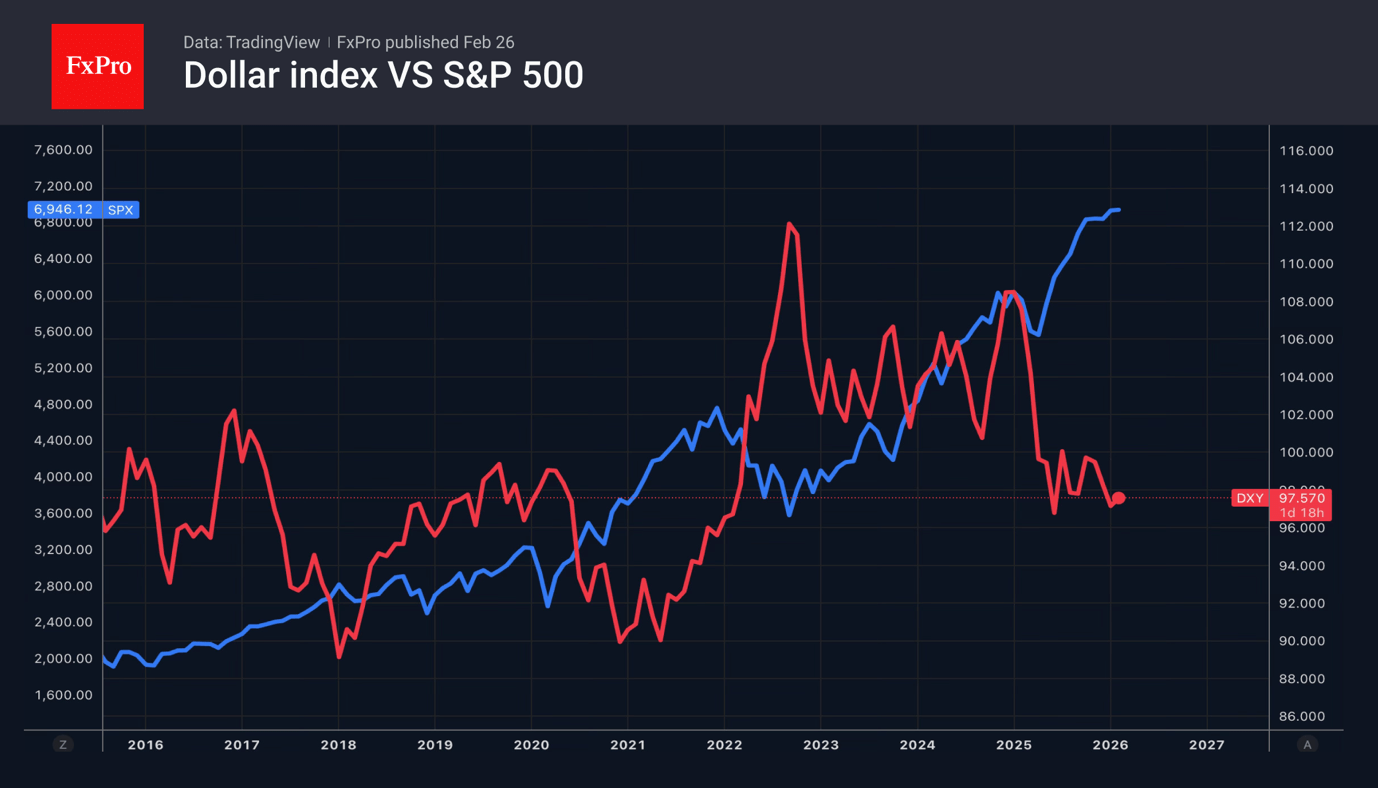
Market’s Upbeat Mood Hindering Dollar
- The S&P 500 rally is putting pressure on the greenback as a safe-haven asset.
- The Labour Party’s defeat in local elections will create problems for the pound.
While the market tries to figure out tariffs, EURUSD is rising thanks to US stock indices and improved global trade. According to HSBC, supply chains have been restructured with a sharp increase in turnover in Asia. At the same time, trade in services, which is not affected by import duties, is growing faster than trade in goods. This dynamic supports the export-oriented economy of the eurozone and contributes to the strengthening of the euro.
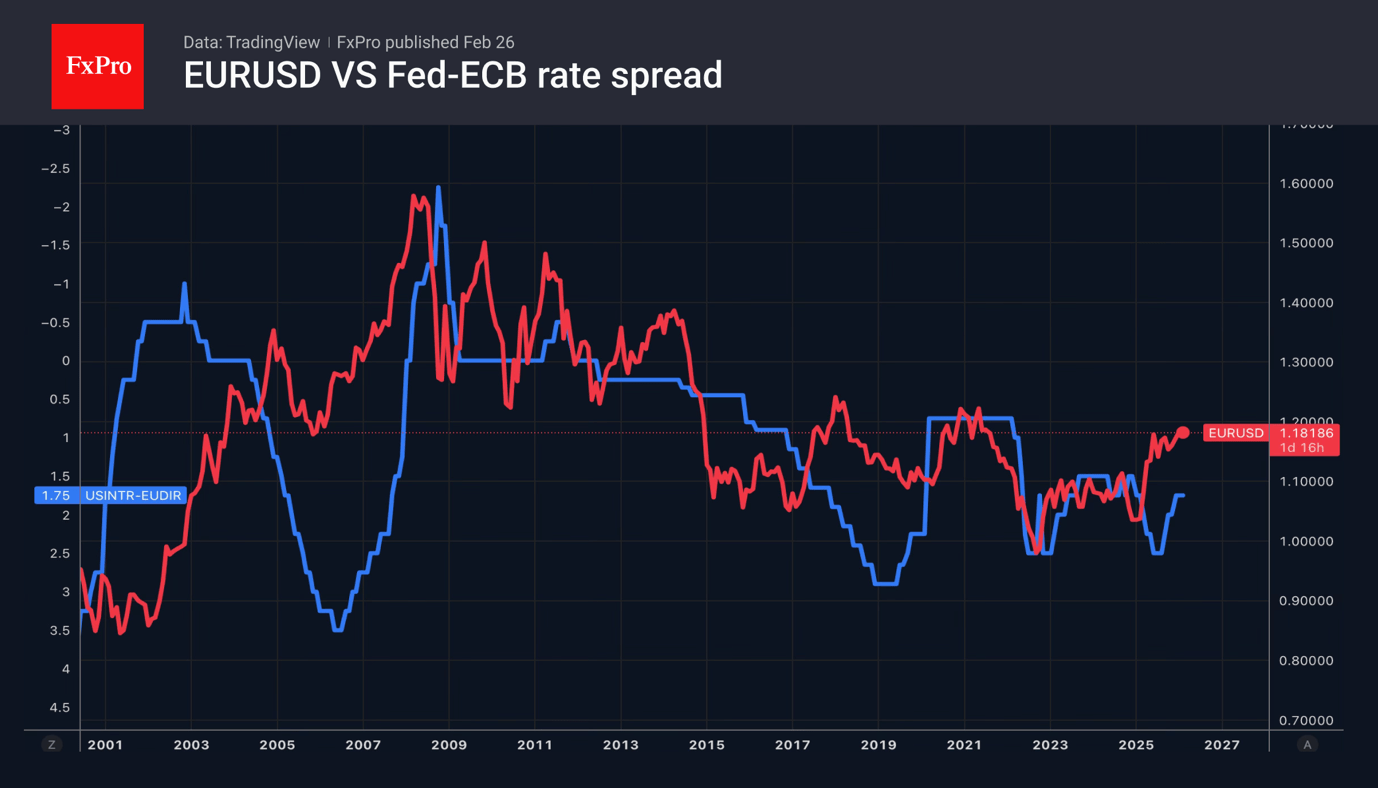
According to 57% of Bloomberg experts, Christine Lagarde will leave her post as head of the ECB earlier than expected. Klaas Knot appears to be the main candidate to replace her. He is a ‘hawk’, which increases the likelihood of a deposit rate hike in 2027. The futures market expects the federal funds rate to decline next year. Divergence in monetary policy will be a powerful driver of the EURUSD rally in the medium- to long-term.
The rise in US stock indices is putting pressure on the US dollar as a safe-haven currency. At the same time, hawkish rhetoric from FOMC officials and the decline in the probability of the Fed easing monetary policy in June to 46% are holding back the bulls’ offensive on EURUSD.
The statement by Board Member Hajime Takata that the Bank of Japan should raise the overnight rate sooner rather than later caused USDJPY buyers to retreat. According to the chief hawk, it is time to add to the rhetoric that the inflation target is almost achieved and that external shocks could accelerate consumer price growth.
However, the government recently approved two doves to the Bank of Japan’s board of governors, so the camp of supporters of higher rates is actively shrinking. This could lead to a prolonged pause in the cycle of monetary policy normalisation and pressure on the yen. The interest rate differential plays into the hands of the bulls on USDJPY.
The growth in global risk appetite has helped the pound recover. Nevertheless, GBPUSD remains under pressure. The Bank of England is moving closer to lowering its repo rate, and Labour’s defeat in local elections will fuel rumours of Keir Starmer’s resignation as Prime Minister. The Polymarket betting market gives a 63% probability that this will happen before the end of 2026.
Eurozone economic sentiment moderates in February, services drag
Economic sentiment in Europe softened in February, with the Economic Sentiment Indicator falling by 1.0 point to 98.3 in both the EU and the Eurozone. The Employment Expectations Indicator also declined, slipping to 98.5 in the EU and 97.6 in the Eurozone. Both gauges remain slightly below their long-term average of 100.
The drop in the ESI was driven primarily by a marked deterioration in services confidence, while construction also contributed modestly to the decline. In contrast, sentiment in industry and among consumers was broadly stable, and retail trade confidence continued to improve, suggesting that weakness is not yet broad-based.
Among the largest EU economies, France (-2.8) recorded the sharpest fall in sentiment, followed by Poland (-1.9) and Italy (-0.6). Germany and the Netherlands (-0.2 each) saw only marginal declines, while Spain was broadly unchanged.
ECB’s Lagarde: Rising real incomes to support growth
Speaking before the European Parliament’s Committee on Economic and Monetary Affairs, ECB President Christine Lagarde said the Eurozone economy should find support from rising labor income and resilient employment. Investment in defence, infrastructure and digital transformation is also expected to underpin growth, even as the region faces higher tariffs, a stronger Euro and ongoing global policy volatility.
She pointed out that real wages growth have moved above early-2021 levels, reflecting inflation that has fallen below nominal wage gains. Although wage growth is still elevated, it is gradually moderating and expected to settle near 3% over the medium term.
Lagarde reaffirmed that the ECB sees inflation stabilizing around its 2% target. That assessment supported the decision earlier this month to keep key interest rates unchanged.
Looking ahead, she emphasized that policy will remain data-dependent and assessed meeting by meeting. ""We are not pre-committing to a particular interest rate path," she reiterated.