

Sample Category Title
Subsidy effect pulls Tokyo core CPI down to 1.8%, but underlying inflation firms
Inflation in Tokyo eased further in February, with core CPI (ex-fresh food) falling to 1.8% yoy from 2.0% yoy. While slightly above market expectations of 1.7% yoy, the reading marks the third straight monthly slowdown and the lowest level since October 2024, slipping back under the BoJ’s 2% target.
The primary driver was a sharp drop in energy prices, which declined -9.2% yoy as the government’s temporary utility subsidies began to take effect. The program has mechanically dampened readings and was broadly expected to weigh on inflation for several months.
Beneath the surface, however, price dynamics remain more persistent. Core-core inflation (excluding fresh food and energy) rose to 2.5% yoy from 2.4% yoy, suggesting domestic demand conditions and wage-driven pricing remain intact. Headline CPI also ticked up modestly from 1.5% yoy to 1.6% yoy.
You Will Comply With the AI
AI can speed up the drudge work and allow humans to redirect effort to higher-value tasks. But if the drudge work is demonstrating compliance with regulation, will the regulators allow this?
- Breathless commentary on the job-destroying effects of AI partly reflects how quickly the technology is changing, making its implications hard to assess. But it also misses important nuances: when assessing the job impacts, it assumes jobs are made up of disconnected tasks.
- Academic research points to better ways to think about the issue. One recent paper suggests that firms will automate tasks where AI can achieve current output quality, and not those where it does not. Worker time is freed up as some tasks are automated, and reallocated to other tasks, increasing the quality of output for these tasks. This raises the quality bar for automating them later, and could make human labour more valuable, not less.
- Some tasks will be ripe for automation, because they require significant effort just to achieve bare-minimum quality. Compliance-related tasks are a good example of this, provided the regulators allow it. The result could be a better-quality product from the perspective of customers. But new issues arise, including compliance issues raised by the technology, and the possibility that regulatory expectations rise as automation makes compliance cheaper.
From breathless essays to suspiciously AI-style social media posts, the (potentially disruptive) effects of AI are front of mind for many people. The disruption narrative has become so much part of the zeitgeist that “software developer who lost his job to AI and now has no health insurance” was the backstory for a patient in a recent episode of Grey’s Anatomy.
One reason for the angst is that things are moving so quickly that the humans are struggling to make sense of things. Reasoning models are only a year and a half old, after all. The capabilities of the leading models leapt ahead in just the past three months. Any intuitions you had about AI’s impact based on what the models could do six months ago are obsolete. Add in the policy and geopolitical chaos of the Trump administration, and it is no wonder that investors throw up their hands and sell.
Aside from its own speed of development, one of the things that make it hard to assess the implications of AI is that people are using a simplistic ‘bag of tasks’ view of work. If too many of your tasks are automated rather than augmented by AI, goes the thinking, then your job is at risk.
A better approach was suggested in a recent paper by two University of Toronto professors, Joshua Gans and Avi Goldfarb. Instead of a bag of disconnected tasks, they model production as a set of tasks with varying quality. The quality of the final output is the product of each task’s quality, that is, multiplying quality across tasks. If any task has zero quality, the whole output has zero quality. (These are known as “O-ring” models of production, after the parts failure that was the proximate cause of the Challenger disaster.)
In this setup, firms will automate tasks that the technology can produce to the required quality and reallocate the human effort to the remaining tasks. Worker time is reallocated rather than ‘saved’ in the form of layoffs, because there is a return to improving the quality of the non-automated tasks. It is this variable quality of tasks and output that the ‘bag of tasks’ literature ignores. A concrete example of this time reallocation effect comes from a recent speech by Fed Governor Chris Waller. He noted that AI-based coding tools reduced time spent on routine tasks. Developers at the Fed can instead focus on enhancing security and quality of the end product. This has also been our experience: faster coding means more time for thinking and writing.
Gans and Goldfarb’s model has some interesting implications beyond the lack of layoffs. Once some tasks are automated, it becomes harder to automate the remaining tasks, because they are now being done to a higher quality than before. This means that automation will not be a smooth process but could happen in fits and starts. It could also make human labour more valuable than before, by focusing it on remaining high-value tasks. The barrier to automating everything might therefore be higher than people realise, and the question of what gets automated when depends on what was automated first.
The O-ring model also allows for some useful extensions that the Gans and Goldfarb paper does not mention (and for which the mathematical workings will be available on request). In the standard O-ring model, zero effort on a task translates to zero quality, but any time spent on a task produces positive quality and thus positive final output. Consider the case where significant effort must be spent on a task to reach even zero quality. An example of this might be the effort involved in achieving and demonstrating compliance with legal or regulatory requirements. Expending positive but less than this minimum threshold effort still results in the zero-quality output disaster of a finding of non-compliance.
If one task involves this fixed-effort ‘compliance tax’ and the others do not, it will be one of the tasks firms seek to automate first, because it frees up much more time to do other things than automating the other tasks would. Again, the ‘bag of tasks’ view misses this possibility.
The issue then becomes: will the regulators permit automation of compliance activities or demonstrating that compliance? Is it enough for an AI to check against a list or rules, or are costly manual sign-offs needed for accountability? Will regulators who are themselves taking a cautious approach to the new technologies be over-cautious? And will automation just shift compliance tasks to other forms, such as managing vendor risk, or ensuring model results are explainable and that the systems do not hallucinate? Another complication is that different regulators could take different stances on this issue.
A further wrinkle arises if effort is required to meet bare compliance, but there is also a ceiling beyond which further effort on the compliance task is fruitless. Think of a five-star or ‘fully compliant’ rating, but no sixth star to shoot for. If the manual effort to comply is large enough, the firm will choose to automate even if that means going from five-star to bare pass, if that raises the quality of other activities enough.
That choice will be most attractive if the over-compliance is insurance rather than an expression of risk appetite. If manual effort has uncertain outcomes, firms will choose to over-comply to avoid occasional non-compliant outcomes. An aspect of this uncertainty, as Westpac has previously highlighted in its submission to the productivity roundtable process, is that regulators in Australia tend not to confirm that what the entity is doing complies, but rather, wait for those moments of non-compliance and enact consequences. Over-compliance is the natural response to this regulatory approach; a more reliable, less-manual process might not need as large a buffer. If automated outcomes are more reliable and certain as well as faster and cheaper, then the firm may rationally choose not to over-comply the way it did when everything was done manually. Firms will need to ask themselves: are they over-complying to ensure reliability of the process, or is it part of the brand and culture that they want to retain?
Regulators might not be pleased to see regulated entities remaining compliant, but no longer five-star. They will need to ask themselves if their assessment criteria emphasise process rather than outcome. On the other hand, once real-time automated data checking becomes possible, periodic manual sampling will seem inadequate. The bar on compliance could inexorably rise as compliance becomes faster and cheaper. The reliability and explainability of the regulated entities’ processes will also matter.
So you probably will comply using the AI, and you will certainly want to, given the payoff of freeing up time for other things. Key questions for Australia’s future technology adoption and productivity growth are: what other issues does it raise, and will the various regulators agree to the change?
Cliff Notes: Capacity is Key
Key insights from the week that was.
The January CPI came in above expectations, prices rising 0.4% in the month and 3.8%yr (WBC 3.6%yr; consensus 3.7%yr). On a seasonally adjusted basis, price growth was a touch firmer at 0.5%. Electricity, garments and footwear were the key supports in the month. A portion of this strength was netted out of the core inflation calculation, however, the trimmed mean gaining 0.3% in the month as expected to be up 3.4%yr. We view the detail of this release as consistent with our existing forecast for the March quarter, which is 0.9%, 3.5%yr for trimmed mean inflation and 1.1%, 3.8%yr for the headline measure.
This week’s investment partials point to some modest downside risks for next week’s Q4 GDP. However, the longer-term view is favourable. Construction activity highlighted the rotation underway from public to private investment. And, inclusive of construction and equipment spending, private CAPEX surprised on the upside, growing 7.8% over the year to December. Underlying the headline CAPEX result, investment in buildings and structures rose robustly in the quarter and had breadth across non-mining industries, but it was offset by a pull-back in spending on data-centre related equipment. Excluding the impact of data-centre CAPEX, non-mining investment in machinery and equipment increased a healthy 3.0% in the quarter. CAPEX plans point to the current growth pace being maintained through the remainder of FY2026 for a 7.6%yr inflation-adjusted gain. The first estimate for FY2027 implies growth will continue beyond June too.
A full preview for next week’s Q4 GDP report will be released later today on Westpac IQ. And, for an in-depth view of Australia’s businesses, refer to the latest Westpac Quarterly Business Snapshot. Meanwhile, Chief Economist Luci Ellis’ focus this week has been AI’s effect on job specification, productivity and labour demand.
In the US, last Friday the Supreme Court struck down US President Donald Trump’s use of the International Emergency Economic Powers Act to institute country-specific tariffs. Whether refunds will be required is still to be determined. But, to shore up future revenue collection, President Trump immediately instituted a 10% global tariff under Section 122 of the 1974 Trade Act and threatened to lift the rate to 15%. Note though, this avenue is only available for up to 150 days without Congressional approval – an immense challenge right before the mid-term elections. The net effect is a temporary marginal increase in the US’ effective tariff rate, but with some countries experiencing a more material increase (or decrease) depending on their starting position. President Trump intends to hold individual nations to agreed deals and industry tariffs remain valid. For some countries though, holding to their agreed deal will put them at a disadvantage. So far, leaders of countries impacted have largely kept quiet, taking time to assess the implications.
Also received late last week, US GDP surprised to the downside in Q4, activity rising 1.4% annualised against a 2.8% expectation. Personal consumption gained 2.4% annualised, however, in line with the historic trend, and non-residential investment maintained a moderate pace of growth, 3.7% annualised. Offsetting was another decline in residential investment, -1.5% annualised, and government consumption falling 5.1% annualised because of the shutdown – Federal Government spending plunged 16.6% annualised. Despite the disappointment, we remain of the view that the US’ underlying pulse is consistent with momentum at or above trend through 2026, fuelled by a tight labour market and robust nominal wage gains. However, we remain mindful of the downside risks posed by cost-of-living pressures – nominal personal spending increased by 0.4% in December, but real spending lifted just 0.1%.
Over in Japan, Prime Minister Takaichi appointed two new members to the Bank of Japan’s policy board, Ayano Sato and Toichiro Asada. Both are considered to be dovish but replace members who have exercised caution on further rate increases, seeing the Board become only marginally more dovish. In a speech this week, member Hajime Takata did not comment on the new appointments but did note the BoJ can step in in times of excessive bond market volatility. We hold the view that while there may be volatility in the short term, fundamentals point to the 10-year bond yield falling to 2.0% over time. On monetary policy, Takata said little on the policy outlook, noting only that the Board is not on a pre-set path and highlighting the importance of the currency to inflation.
Silver (XAG/USD) Down 3% Large Range Formation Building?
Silver broke higher in the past week, but failed to materialize a real breakout above the $92 highs established in early February.
Despite early risk-off price action, the precious metal pulled back from the resistance level.
With the latest news of a bilateral deal on the nuclear issue potentially close, according to the Iranian Foreign Minister, the risk-off premium built in throughout the morning is somewhat easing. It would be tough to make a case for a fundamental rally in the metal. It apparently wasn't the final round of US-Iran talks, with the next round expected in Vienna on Monday.
We are concluding a rough month for metals, but they still maintain a solid outlook, having bounced off their early lows. Tomorrow's close will be crucial.
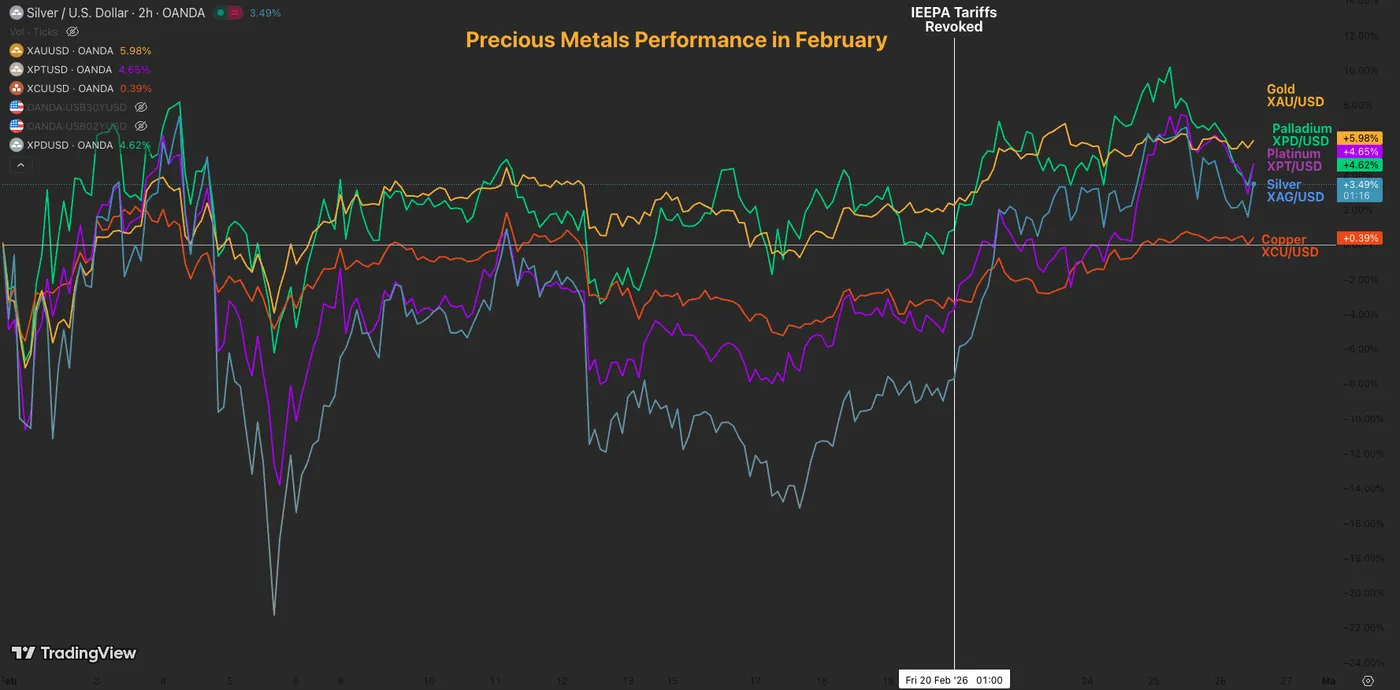
Metals performance in February – Source: TradingView
Still, bulls could find hope in the Chinese commodities Market pricing for the grey metal holding around $100 (Settled around $97 today).
In case you haven't read our recent piece on the Paper vs Physical spread, go check it out!
The idea is that a $10 to $15 spread is within the norm, so nothing too shocking there also. It remains something to keep an eye on, particularly if physical demand takes a turn for the worse – no signs of this for now.
As fundamental uncertainty prevails, let's check whether technicals help us assess whether there is indeed a direction to lean on or if range-bound conditions are actually taking over.
FYI, March isn't the best seasonal month for Metals, but we are in unprecedented times. It could be wise to keep that in the back of your mind!
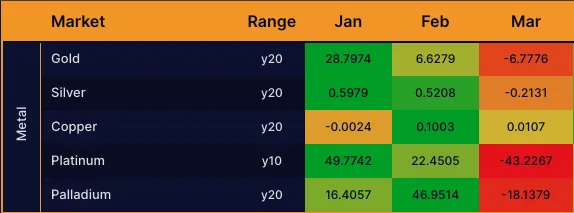
Metals seasonals through March – Source: Market-Bulls.com
Let's dive into a Silver multi-timeframe analysis to identify the current course of action for the precious Commodity. Let's get right into it.
Silver (XAG/USD) Multi-timeframe Technical Analysis
Daily Chart
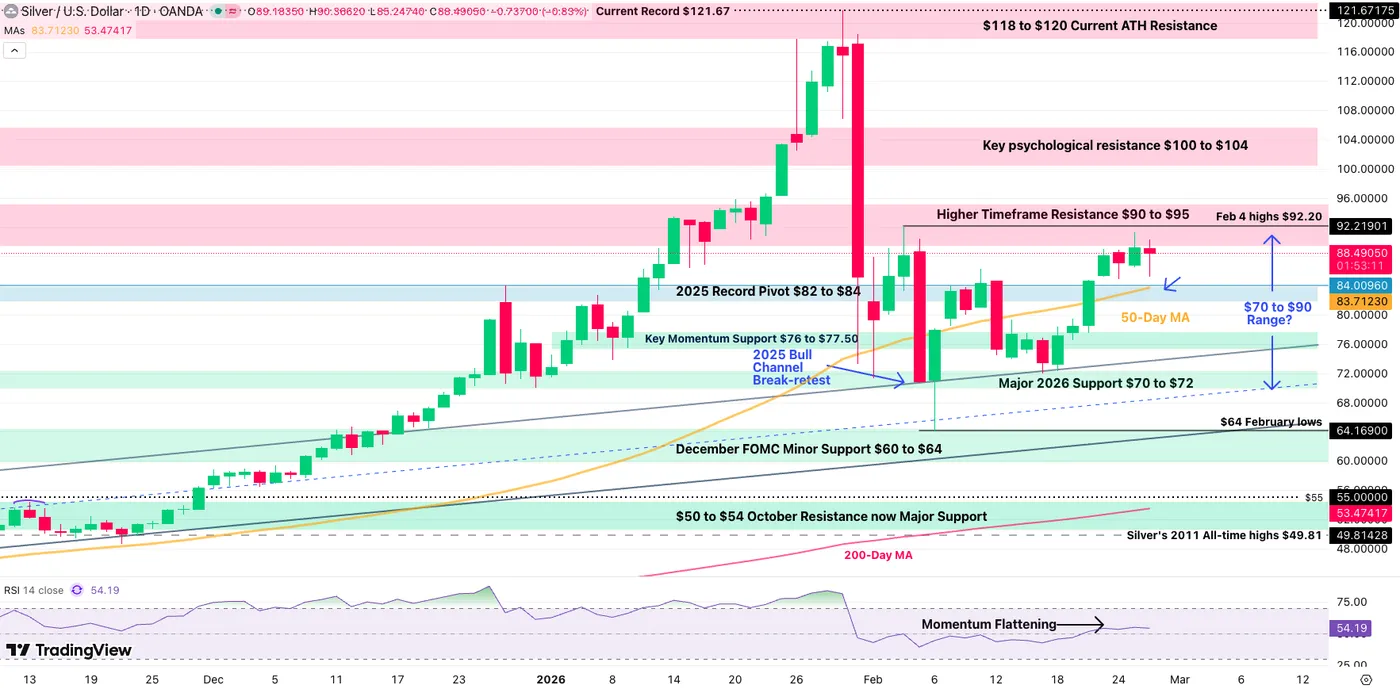
Silver Daily Chart, February 26, 2026 – Source: TradingView
Silver brought some high hopes after bouncing on its 2025 upward channel in a break-retest fashion, pointing to immediate upside.
But the reality is that bulls could not form a push above the Feb 4 highs around $92. Overall, the $90-$92 area will have to be breached to relaunch hopes to even reach $100.
Still, as long as the price action remains above the $82 - $84 Pivot, consolidation towards a breakout is still a favorable scenario for upside in the commodity – The flattening Daily RSI also points in that direction.
The 50-Day Moving Average is acting as key support at the significant $84 level, so keep a very close eye on whether prices hold above or below this. Let's take a closer look.
4H Chart and Technical Levels
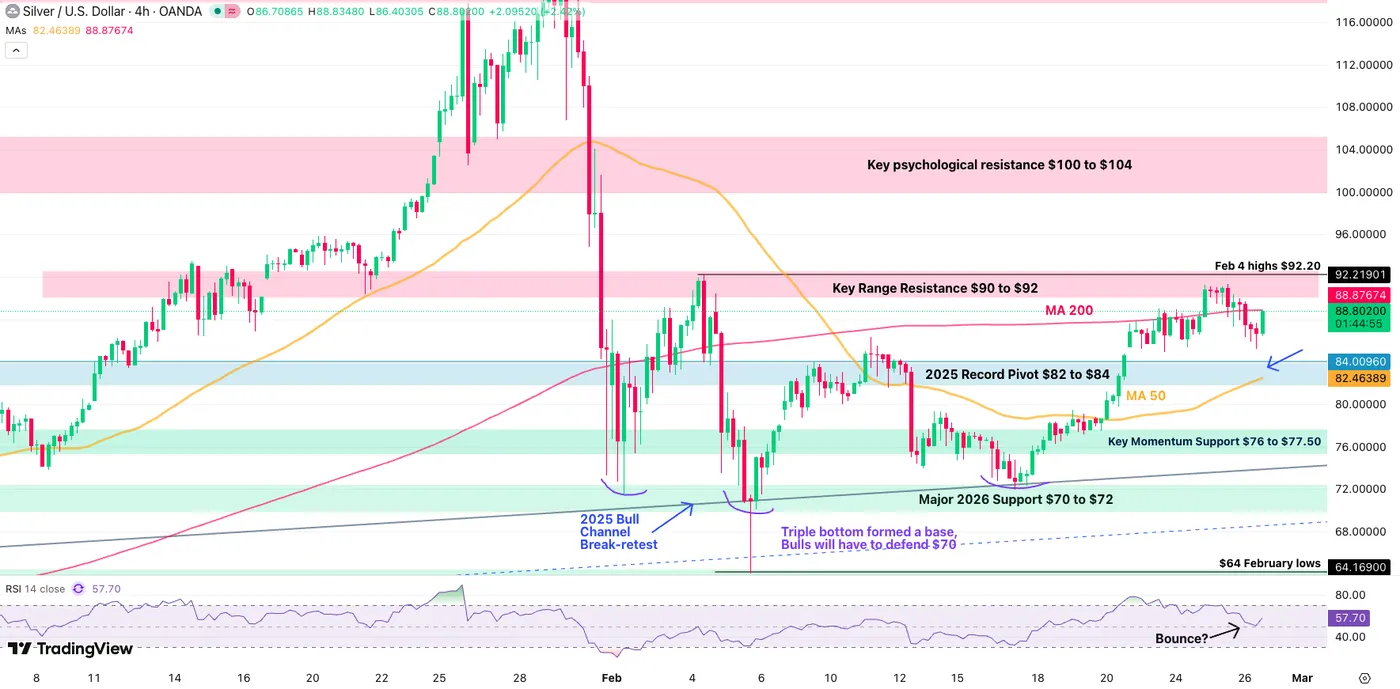
Silver 4H Chart, February 26, 2026 – Source: TradingView
Bulls are attempting a rebound in the immediate action but will have to face the 4H 200-period MA, acting as resistance for intraday action ($88.90).
A break above $92 will once again be necessary for a full breakout. Failing to do so hints at a retest of $84.
Levels to watch for Silver (XAG) trading:
Resistance Levels:
- 4H 200-MA $88.90
- Range highs $90 to $92
- Higher Timeframe Major Resistance $90 to $95
- Key psychological resistance $100 to $104
Support Levels:
Key Pivot $82 to $84
- intraday support $76 to $77.50
- Major 2026 Range Support $70 to $72
- December FOMC Minor Support $60 to $64 (Feb Lows)
- $50 to $54 Major Support
- October FOMC bottom $46.00 to $47.00
1H Chart
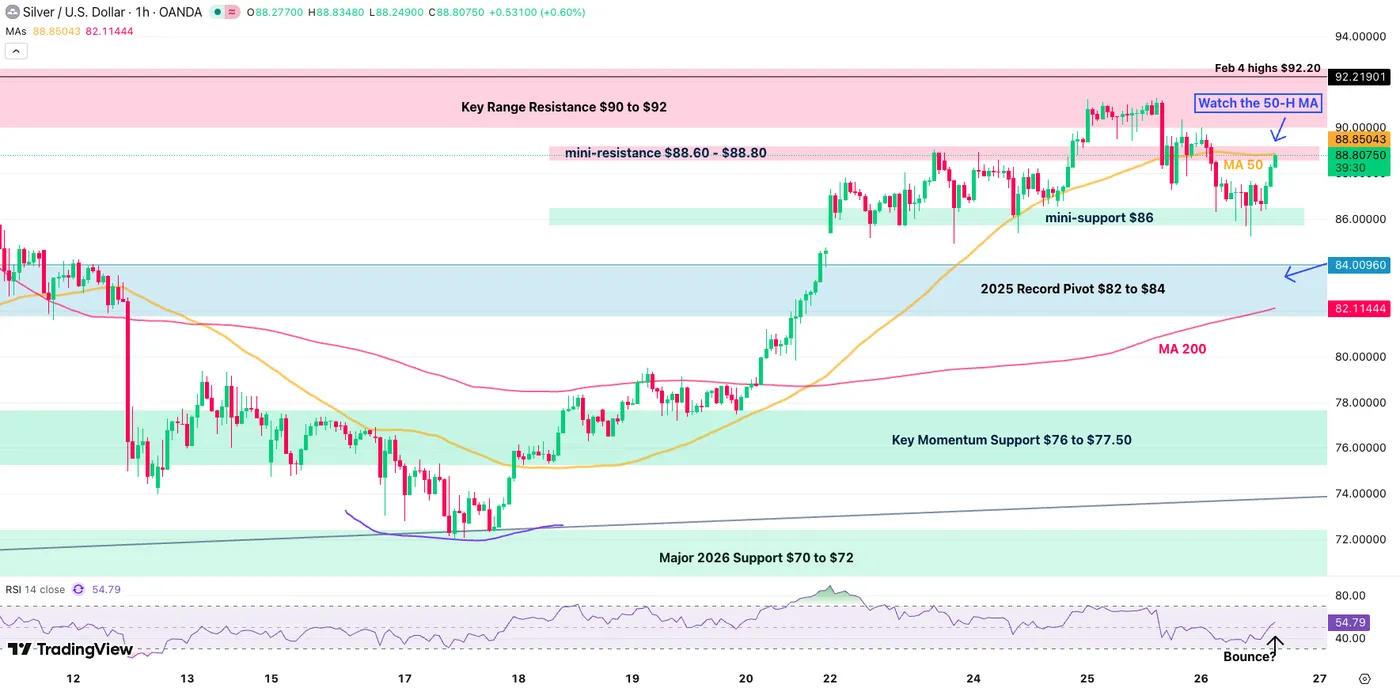
Silver 1H Chart, February 26, 2026 – Source: TradingView
Bulls are taking the lead on the shorter timeframes, attempting to tackle the 50H MA/4H 200 ($88.80) in the current bounce.
A mini-range is actually forming for consolidation traders:
- A 88.60 to $88.80 intraday resistance looks solid
- Breaking above hints at a quick test of the $92 resistance
- Any close above this would point to a $100.00 retest
- Breaking above hints at a quick test of the $92 resistance
- On the support side, look at $86.00 to $86.60
Safe Trades!
US-Iran Talks Advance: Iranian FM Confirms Progress on Nuclear and Sanctions Issues, Oil Prices Steady
- Iranian FM confirms "good progress" was made on both nuclear and sanctions issues during the latest round of US-Iran talks in Switzerland.
- Officials are returning to their capitals for consultations, with technical expert talks scheduled for next week in Vienna.
- Prices briefly spiked on rumors the talks had failed over US demands (stop enrichment, hand over uranium), but quickly dropped most gains after news of "significant progress."
The US and Iran have made a lot of progress in their latest talks, mediator Oman said on Thursday.
The goal of these meetings is to settle long-term concerns over Iran’s nuclear program and to prevent the US from launching new military strikes. This is happening at a tense time, as the US has been significantly increasing its military presence in the Middle East.
On Thursday, the two sides met in Switzerland for two separate sessions (one in the morning and one in the afternoon). However, they didn't speak directly; instead, officials from Oman acted as go-betweens, passing messages back and forth between:
- Iran’s side: Foreign Minister Abbas Araqchi.
- The U.S. side: Envoys Steve Witkoff and Jared Kushner.
Before the talks ended, a high-ranking Iranian official told Reuters that a basic deal is possible but only if the US stops mixing nuclear arguments with other, unrelated disagreements.
We finally heard from the Iranian Foreign Minister Abbas Araqchi a short while ago who stated “Today was one of the best, most serious & longest rounds of negotiations. We made good progress & seriously engaged with elements of a deal regarding both #nuclear & sanctions issues. We are close to an understanding on some issues, though differences remain on others.”
The developments have also been having a massive impact on oil prices as well as haven demand as it is another layer of uncertainty for market participants to consider.
What happens next?
- Consultations: Officials from both countries are heading back to their capitals to discuss the progress.
- Future Meetings: Formal negotiations will start again soon.
- Technical Talks: Experts are scheduled to meet in Vienna next week to work on the specific details.
Omani Foreign Minister Sayyid Badr Albusaidi shared the update on X (formerly Twitter) after the most recent round of talks in Switzerland ended.
Overall risk sentiment does not appear to have been affected that much with AI still the dominant theme especially for Equity markets.
Why did oil prices jump then fall?
When it comes to the Oil market, one which has been affected by the US military buildup in the Middle East and prices were largely flat after some whipsaw price action earlier in the day.
Prices actually spiked by more than a dollar earlier in the day. This happened because reports suggested the talks had hit a wall. Specifically, the U.S. was reportedly demanding two things that Iran didn't like:
- That Iran stop all uranium enrichment.
- That Iran hand over all its highly enriched uranium to the U.S.
However, once Oman announced that "significant progress" was actually being made, prices dropped back down and lost most of those gains.
Market participants are laser-focused on these talks. Here is the basic rules they are likely following right now:
If talks fail: Traders worry about war or supply problems in the Middle East, which makes oil more expensive.
If talks succeed: The risk of conflict goes down, which causes a sell-off and lowers prices.
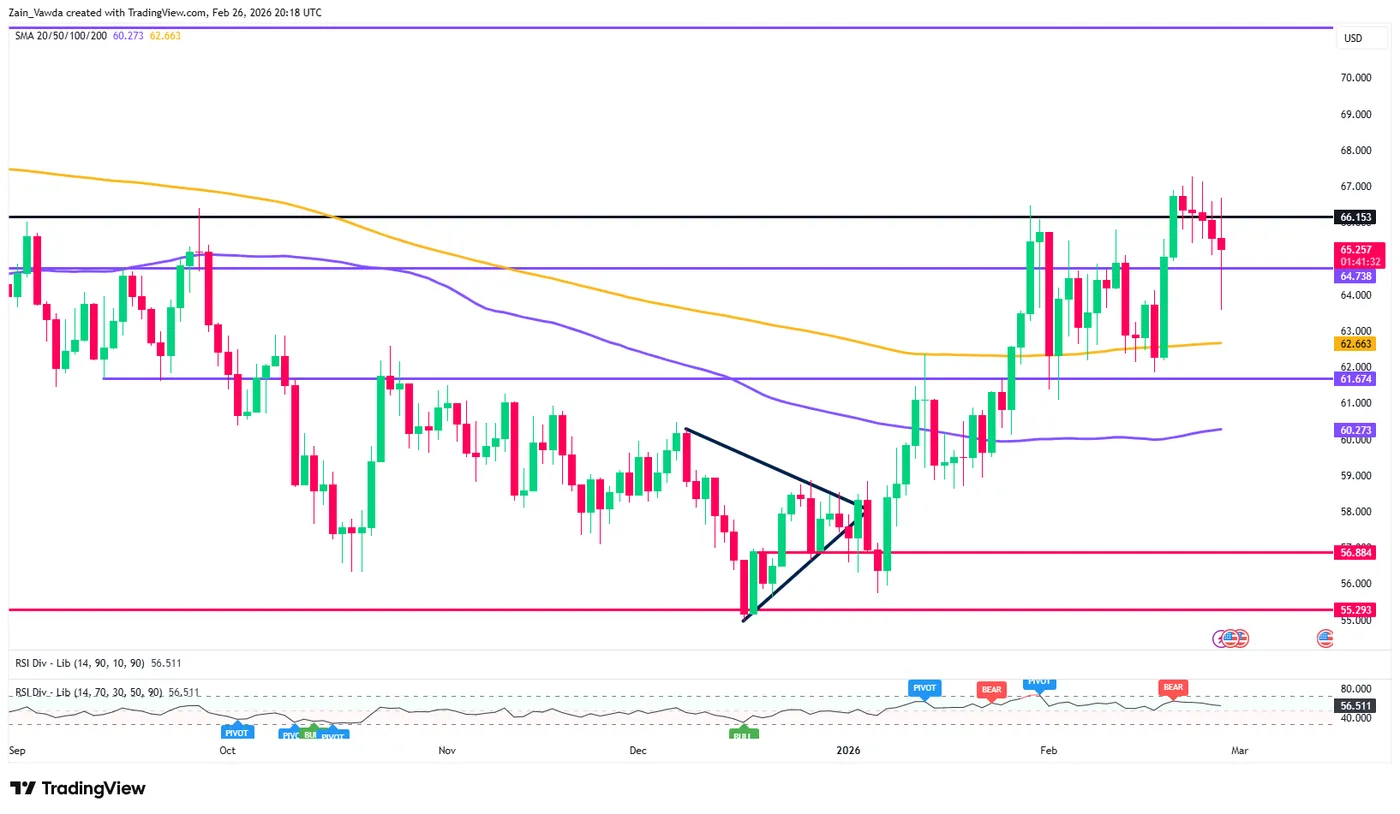
For now though, key support rests at the 62.66 handle (200-day MA) before the 61.67 and the 100-day MA 60.27 come into focus.
A move higher from here in Oil prices faces a test at the 66.15 handle before the 67.00 handle comes into play.
WTI Crude Oil Daily Chart, February 26, 2026
Source:Tradingview
GBPAUD Wave Analysis
GBPAUD: ⬇️ Sell
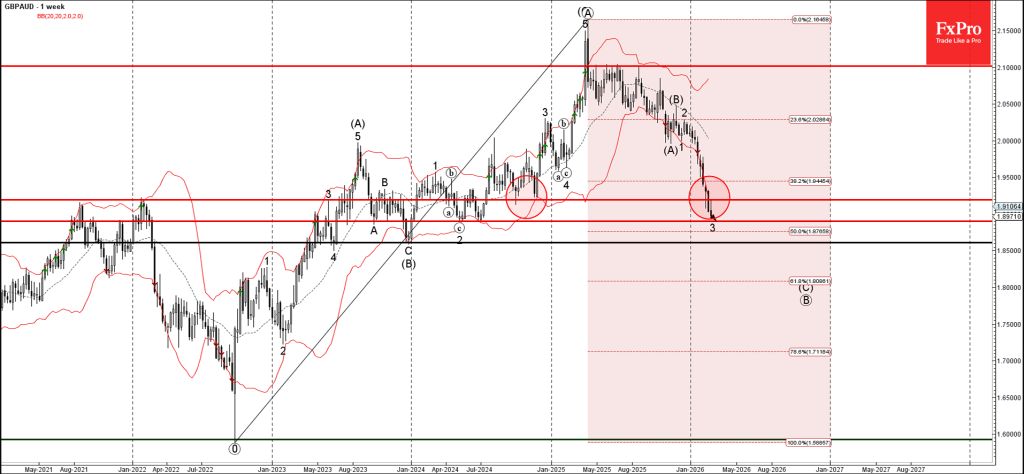
- GBPAUD broke support zone
- Likely to fall to support level 1.8900
GBPAUD currency pair under the bearish pressure after the price broke the support zone between the support level 1.91950 (former strong support from 2024) and the 38.2% Fibonacci correction of the upward impulse from July.
The breakout of this support zone accelerated the active impulse wave 3 of the intermediate impulse wave (C) from August.
GBPAUD cryptocurrency can then be expected to fall to the next support level 1.8900, double bottom from 2024 and the target for the completion of wave 3.
FTSE 100 Wave Analysis
FTSE 100: ⬆️ Buy
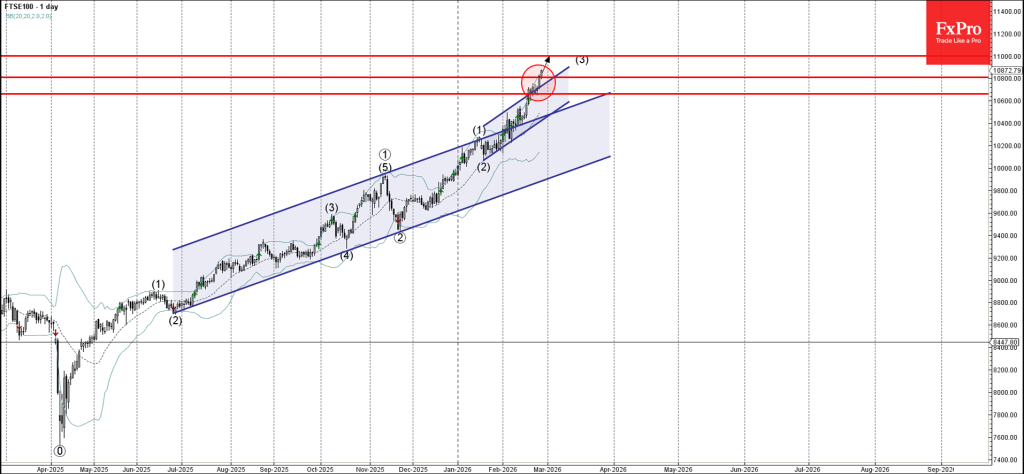
- FTSE 100 broke resistance level 10800.00
- Likely to rise to resistance level 11000.00
FTSE 100 index under the bullish pressure after the price broke above the key resistance level 10800.00 intersecting with the resistance trendline of the daily up channel from December.
The breakout of the resistance level 10800.00 accelerated the active intermediate impulse wave (3) from the middle of January.
Given the clear daily uptrend, FTSE 100 index can then be expected to rise to the next resistance level 11000.00, the target for the completion of the active impulse wave (3).
Eco Data 2/27/26
| GMT | Ccy | Events | Act | Cons | Prev | Rev |
|---|---|---|---|---|---|---|
| 23:30 | JPY | Tokyo CPI Y/Y Feb | 1.60% | 1.50% | ||
| 23:30 | JPY | Tokyo CPI Core Y/Y Feb | 1.80% | 1.70% | 2.00% | |
| 23:30 | JPY | Tokyo CPI Core-Core Y/Y Feb | 2.50% | 2.40% | ||
| 23:50 | JPY | Industrial Production M/M Jan P | 2.20% | 5.50% | -0.10% | |
| 23:50 | JPY | Retail Trade Y/Y Jan | 1.80% | 0.20% | -0.90% | |
| 00:01 | GBP | GfK Consumer Confidence Feb | -19 | -15 | -16 | |
| 00:30 | AUD | Private Sector Credit M/M Jan | 0.50% | 0.10% | 0.80% | |
| 05:00 | JPY | Housing Starts Y/Y Jan | -0.40% | -2.00% | 1.30% | |
| 07:00 | EUR | Germany Import Price M/M Jan | 1.10% | 0.60% | -0.10% | |
| 07:45 | EUR | France GDP Q/Q Q4 | 0.20% | 0.20% | 0.20% | |
| 08:00 | CHF | GDP Q/Q Q4 | 0.10% | 0.20% | -0.50% | -0.40% |
| 08:00 | CHF | KOF Economic Barometer Feb | 104.2 | 103.1 | 102.5 | 103.3 |
| 08:55 | EUR | Germany Unemployment Change Jan | 1K | 3K | 0K | 1K |
| 08:55 | EUR | Germany Unemployment Rate Jan | 6.30% | 6.30% | 6.30% | |
| 13:00 | EUR | Germany CPI M/M Feb P | 0.20% | 0.50% | 0.10% | |
| 13:00 | EUR | Germany CPI Y/Y Feb P | 1.90% | 2.00% | 2.10% | |
| 13:30 | CAD | GDP M/M Dec | 0.20% | 0.10% | 0.00% | |
| 13:30 | USD | PPI M/M Jan | 0.50% | 0.30% | 0.50% | |
| 13:30 | USD | PPI Y/Y Jan | 2.90% | 2.60% | 3.00% | |
| 13:30 | USD | PPI Core M/M Jan | 0.80% | 0.30% | 0.70% | |
| 13:30 | USD | PPI Core Y/Y Jan | 3.60% | 3.00% | 3.30% | |
| 14:45 | USD | Chicago PMI Feb | 57.7 | 52.6 | 54 |
| 23:30 | JPY |
| Tokyo CPI Y/Y Feb | |
| Actual | 1.60% |
| Consensus | |
| Previous | 1.50% |
| 23:30 | JPY |
| Tokyo CPI Core Y/Y Feb | |
| Actual | 1.80% |
| Consensus | 1.70% |
| Previous | 2.00% |
| 23:30 | JPY |
| Tokyo CPI Core-Core Y/Y Feb | |
| Actual | 2.50% |
| Consensus | |
| Previous | 2.40% |
| 23:50 | JPY |
| Industrial Production M/M Jan P | |
| Actual | 2.20% |
| Consensus | 5.50% |
| Previous | -0.10% |
| 23:50 | JPY |
| Retail Trade Y/Y Jan | |
| Actual | 1.80% |
| Consensus | 0.20% |
| Previous | -0.90% |
| 00:01 | GBP |
| GfK Consumer Confidence Feb | |
| Actual | -19 |
| Consensus | -15 |
| Previous | -16 |
| 00:30 | AUD |
| Private Sector Credit M/M Jan | |
| Actual | 0.50% |
| Consensus | 0.10% |
| Previous | 0.80% |
| 05:00 | JPY |
| Housing Starts Y/Y Jan | |
| Actual | -0.40% |
| Consensus | -2.00% |
| Previous | 1.30% |
| 07:00 | EUR |
| Germany Import Price M/M Jan | |
| Actual | 1.10% |
| Consensus | 0.60% |
| Previous | -0.10% |
| 07:45 | EUR |
| France GDP Q/Q Q4 | |
| Actual | 0.20% |
| Consensus | 0.20% |
| Previous | 0.20% |
| 08:00 | CHF |
| GDP Q/Q Q4 | |
| Actual | 0.10% |
| Consensus | 0.20% |
| Previous | -0.50% |
| Revised | -0.40% |
| 08:00 | CHF |
| KOF Economic Barometer Feb | |
| Actual | 104.2 |
| Consensus | 103.1 |
| Previous | 102.5 |
| Revised | 103.3 |
| 08:55 | EUR |
| Germany Unemployment Change Jan | |
| Actual | 1K |
| Consensus | 3K |
| Previous | 0K |
| Revised | 1K |
| 08:55 | EUR |
| Germany Unemployment Rate Jan | |
| Actual | 6.30% |
| Consensus | 6.30% |
| Previous | 6.30% |
| 13:00 | EUR |
| Germany CPI M/M Feb P | |
| Actual | 0.20% |
| Consensus | 0.50% |
| Previous | 0.10% |
| 13:00 | EUR |
| Germany CPI Y/Y Feb P | |
| Actual | 1.90% |
| Consensus | 2.00% |
| Previous | 2.10% |
| 13:30 | CAD |
| GDP M/M Dec | |
| Actual | 0.20% |
| Consensus | 0.10% |
| Previous | 0.00% |
| 13:30 | USD |
| PPI M/M Jan | |
| Actual | 0.50% |
| Consensus | 0.30% |
| Previous | 0.50% |
| 13:30 | USD |
| PPI Y/Y Jan | |
| Actual | 2.90% |
| Consensus | 2.60% |
| Previous | 3.00% |
| 13:30 | USD |
| PPI Core M/M Jan | |
| Actual | 0.80% |
| Consensus | 0.30% |
| Previous | 0.70% |
| 13:30 | USD |
| PPI Core Y/Y Jan | |
| Actual | 3.60% |
| Consensus | 3.00% |
| Previous | 3.30% |
| 14:45 | USD |
| Chicago PMI Feb | |
| Actual | 57.7 |
| Consensus | 52.6 |
| Previous | 54 |
Dollar Attempts Breakout Amid US-Iran Diplomatic Exchanges – Dollar Index (DXY) Outlook
- The US Dollar has been holding strong amid tariff chaos and (supposedly) advancing talks in Geneva with Iran – More on this coming soon.
- FX Markets have been consolidating ahead of key geopolitics and are awaiting to take on a direction.
- Dollar Index Technical Analysis ahead of Non-Farm Payrolls.
The US Dollar really went on a run last week after having broken out of its early 2026 downward trend.
Markets have been looking for clarity, and clarity they could not find. Geopolitics seems to be advancing with the ongoing diplomatic exchanges in Geneva, which began in the mid-Swiss afternoon and should resume soon after a 3-hour break.
Except for a quick awakening in yesterday's session (and the Japanese Yen, often going onto its own adventures as of late), Forex Markets have remained desperately muted in the past weeks of action, with most Major pairs holding a 1,000 pip range – and that's being generous!
As uncertainty reigns, traders can find ranges to play around with tight stops, to remain active and see even more advantage in taking quick trades while waiting for bigger opportunities.
Even the Aussie Dollar, which sent another beat on its CPI earlier this week, couldn't find the momentum to extend its lead.
Everyone is looking at the same currency:
- The US Dollar. What will happen to it, and what will be the outcomes of the US-Iran talks?
- It seems that a breakout could be on the way with the Dollar bouncing right as I conclude this piece.
- Markets will learn more soon, which should lead to significant breakouts across the board.
We’ll explore a few scenarios for upcoming breakouts in an in-depth technical analysis of DXY.
Dollar Index (DXY) Multi-Timeframe Analysis
Daily Chart
Dollar Index (DXY) Daily Chart. February 26, 2026 – Source: TradingView
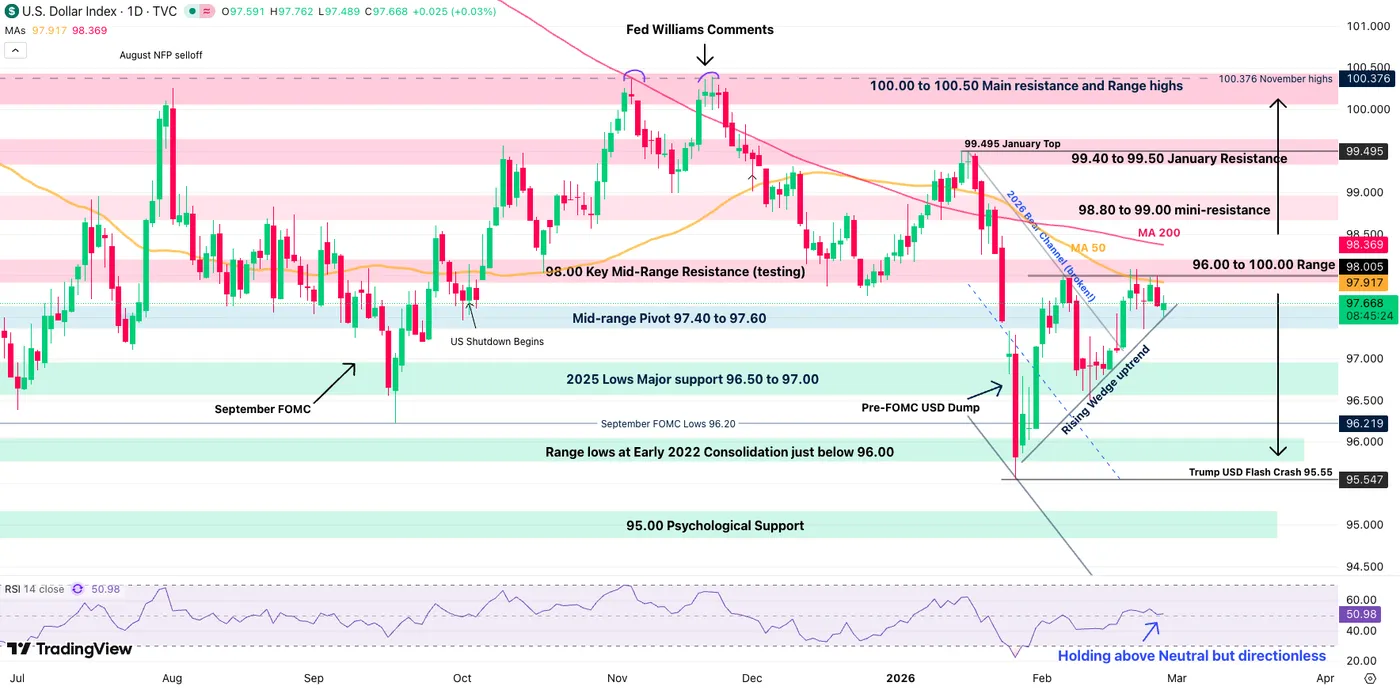
The US Dollar has once again confirmed that its rangebound conditions precede above all trends and narratives in its latest February rebound.
It is now holding an upward trendline towards the mid-range resistance (98.00) which has been rejecting a few times.
It is still early to confirm, but remaining above its Mid-term Pivot (97.40) with an RSI above neutral adds further chances of an upside breakout – Look for a break above 98.00.
- The breakout will be contingent on heightened Middle East tensions remaining elevated.
- Breaking the upward trendline (immediate support at 97.47) would allow for a correction lower.
- To confirm a downside reversal, wait for a close below the 97.40.
- A turn lower from here could lead to a later downside breakout in the Dollar Index – A small probability scenario for now.
- To confirm a downside reversal, wait for a close below the 97.40.
4H Chart and Technical Levels
Dollar Index (DXY) 4H Chart. February 26, 2026 – Source: TradingView
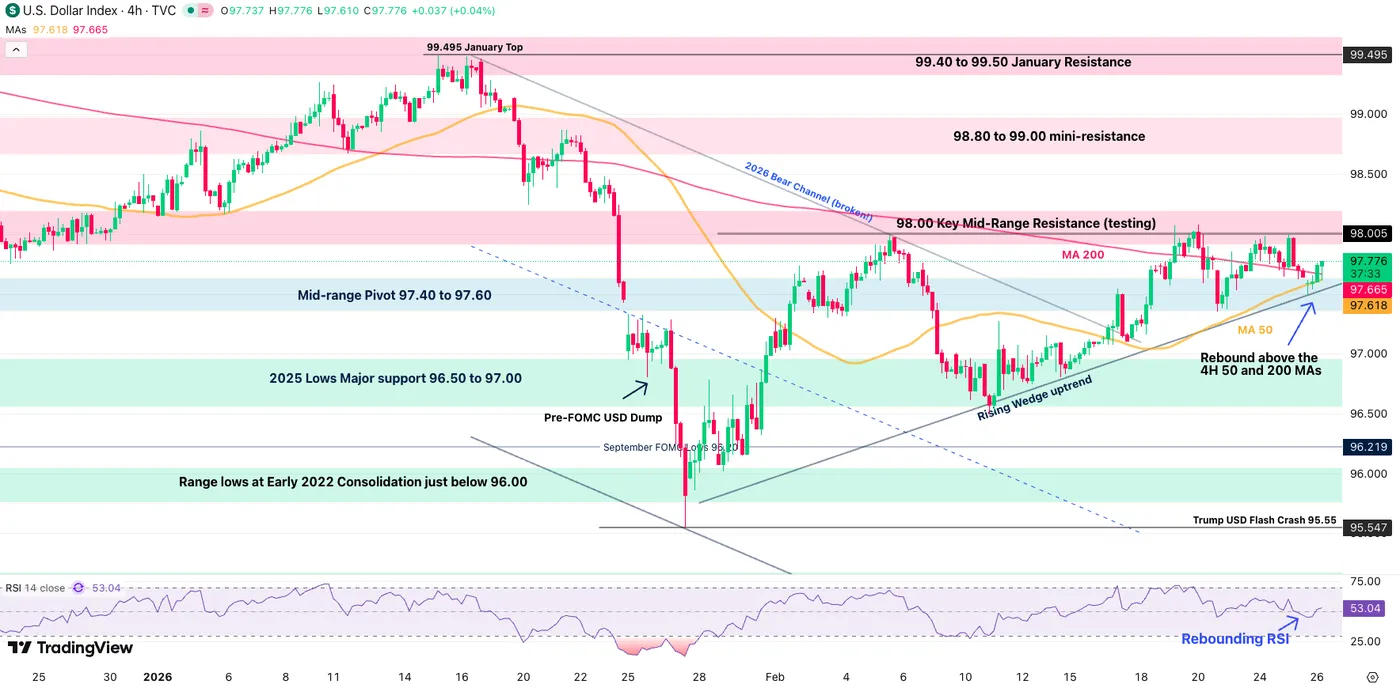
The Dollar is bouncing back above its 4H 50 and 200-period Moving averages, prompting an immediate control from the bulls.
If the lead extends, expect the 98.00 key resistance to break amid multiple tests within an Rising Wedge (bullish) formation.
- In that event, look for trades expressing this view in other FX pairs (GBP/USD, NZD/USD, EUR/USD?)
Levels to place on your DXY charts:
Resistance Levels
- 98.00 Key Resistance (Immediate test)
- Mini-resistance 98.80 to 99.00 (next resistance)
- 99.40 to 99.50 January Resistance
- 100.376 November highs
Support Levels
- 4H 50 and 200-period MA 97.60
- Upward trendline 97.47
- 2025 Lows Major support 96.50 to 97.00 (mini-range lows, 4H 50-MA)
- Early 2022 Consolidation just below 96.00
- Trump USD Flash Crash 95.55
- 95.00 Main psychologic support
1H Chart
Dollar Index (DXY) 1H Chart. February 26, 2026 – Source: TradingView
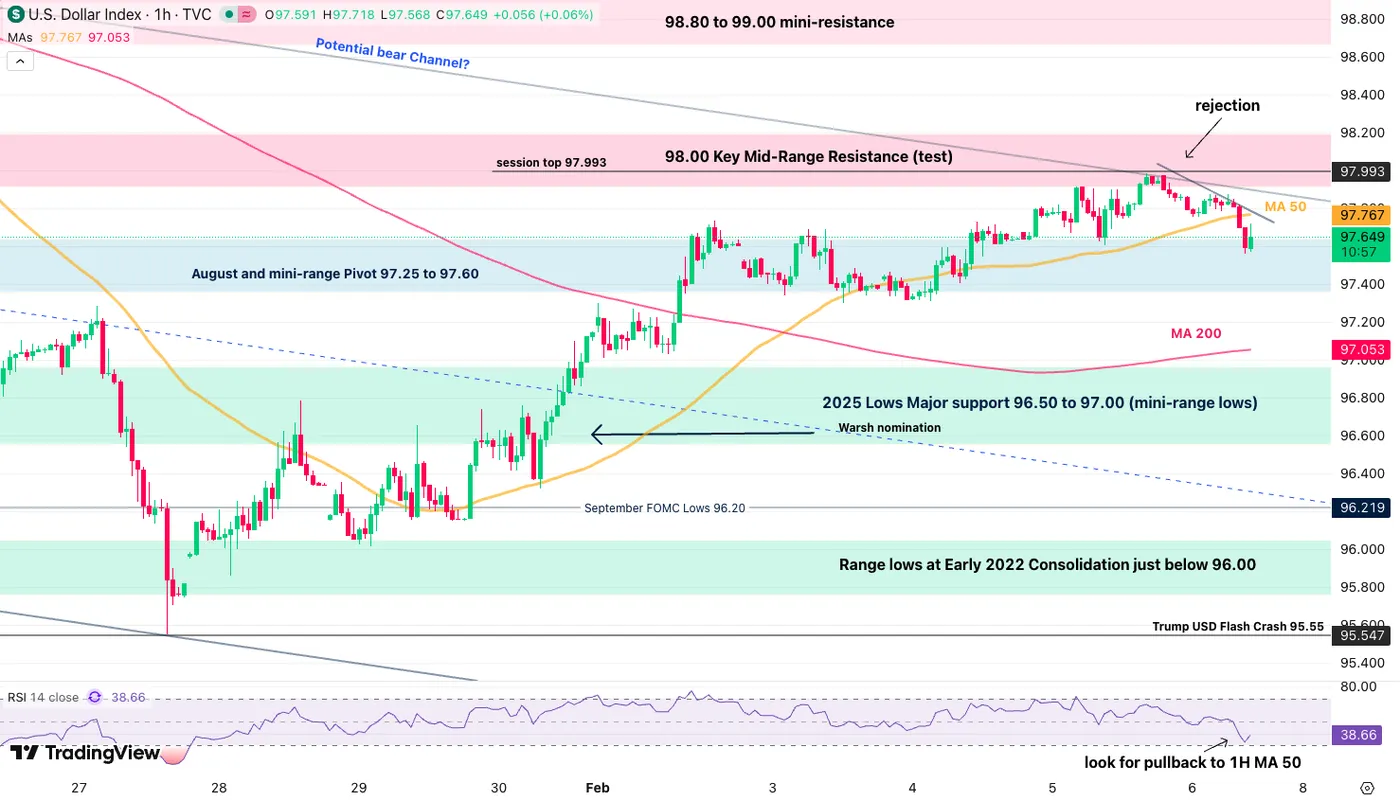
The US Dollar is currently extending higher and will soon be facing the test of its resistance.
Traders would want to confirm a break above 98.00 in today's session to avoid an inevitable continued consolidation.
- 98.80 - 99.00 will be the next resistance
Safe Trades!
Changing the Game: International Implications of Recent Tariff Developments
Summary
- The Supreme Court ruling on International Emergency Economic Powers Act (IEEPA) tariffs provides limited relief for the rest of the world, with weighted average tariff rates modestly lower. This is consistent with our baseline view of steady (but uncertain) global growth, rather than a material downside shock.
- The binding constraint now comes from Section 122’s flat surcharge (10% as implemented, with 15% still under consideration), applied uniformly across countries.
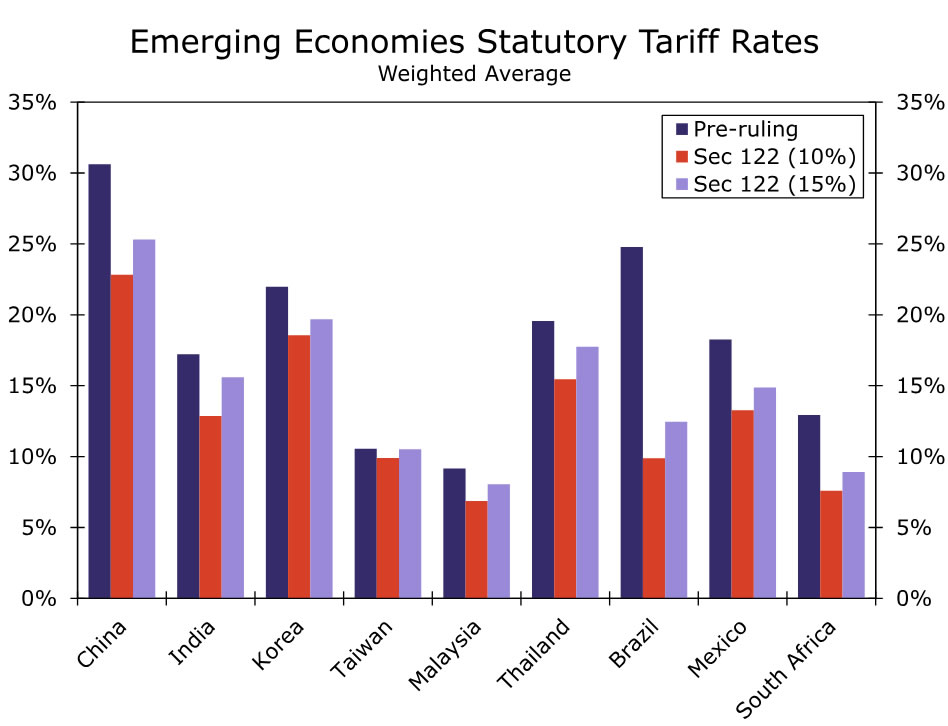
- This results in clear relative winners and losers versus the pre-Supreme Court ruling landscape. Under a 15% Section 122 regime, tariff rates fall the most for China, India, Brazil and South Africa, while they rise for the UK, EU, Australia and Japan.
- The ruling also creates an unprecedented legal vacuum for the 19 countries that struck trade deals with the US in recent months. Deal rates lack an enforceable legal mechanism, having been implemented exclusively through IEEPA authority.
- In practice, this sets up a classic prisoner’s dilemma. While countries could challenge or renege, fear of retaliation via Section 301/232 investigations alongside non‑trade leverage in defense, technology and diplomacy, will likely deter overt confrontation. Slow‑walking of commitments appears more likely than outright withdrawal. Section 338 tariffs remain a wild card, though the legal bar for deployment appears high. On net, trade deal momentum with the US is likely to slow materially in 2026.
Key takeaways
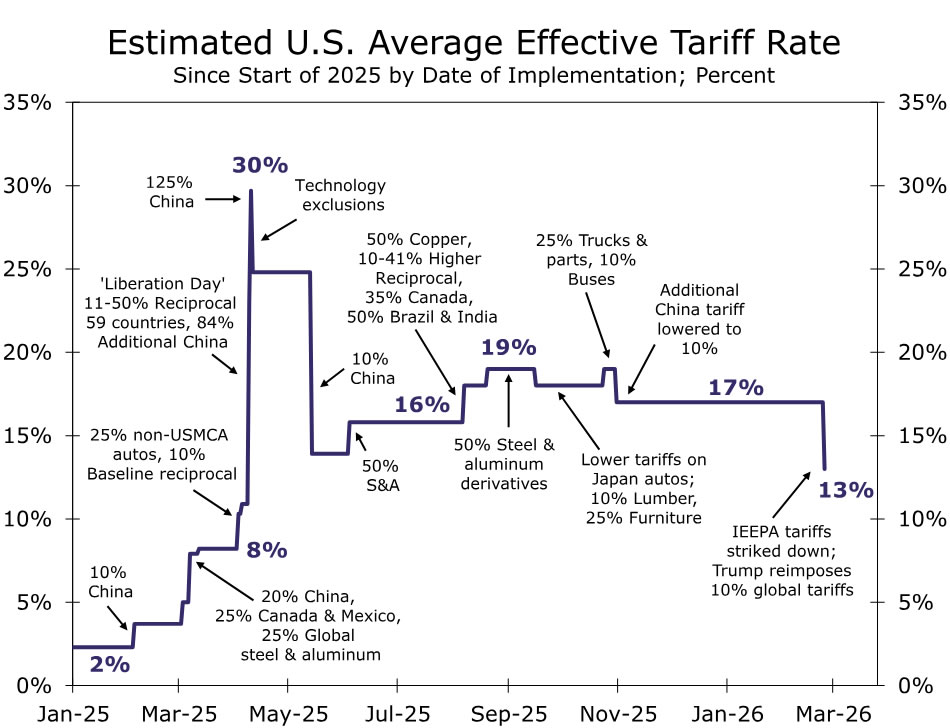
The U.S. weighted average tariffs rate declined to 13% from 17% following the Supreme Court’s February 20 ruling striking down IEEPA tariffs and the administration’s imposition of 10% Section 122 tariffs on February 24 (Figure 1). If the proposed 15% Section 122 surcharge is finalized, weighted average tariffs would rise to around 15%, still modestly below prior levels. This limited relief supports our view of steady global growth amid elevated policy uncertainty and rising idiosyncratic risks (see International Economic Outlook: February 2026).
Section 122 of the Trade Act of 1974, now serving as the interim replacement, has a critical structural limitation: it must be applied on a non‑discriminatory basis. While it authorizes a temporary import surcharge to address balance‑of‑payments concerns, it does not allow country‑specific differentiation. As a result, the administration cannot legally impose a 10% rate on one country and 15% on another under Section 122 alone. For now, U.S. Customs and Border Protection (CBP) has implemented the original 10% rate, while the administration works toward finalizing the increase to 15%. The surcharge stacks on top of Most Favored Nation (MFN) duties and existing section 301 tariffs, while fully replacing IEEPA‑based rates.
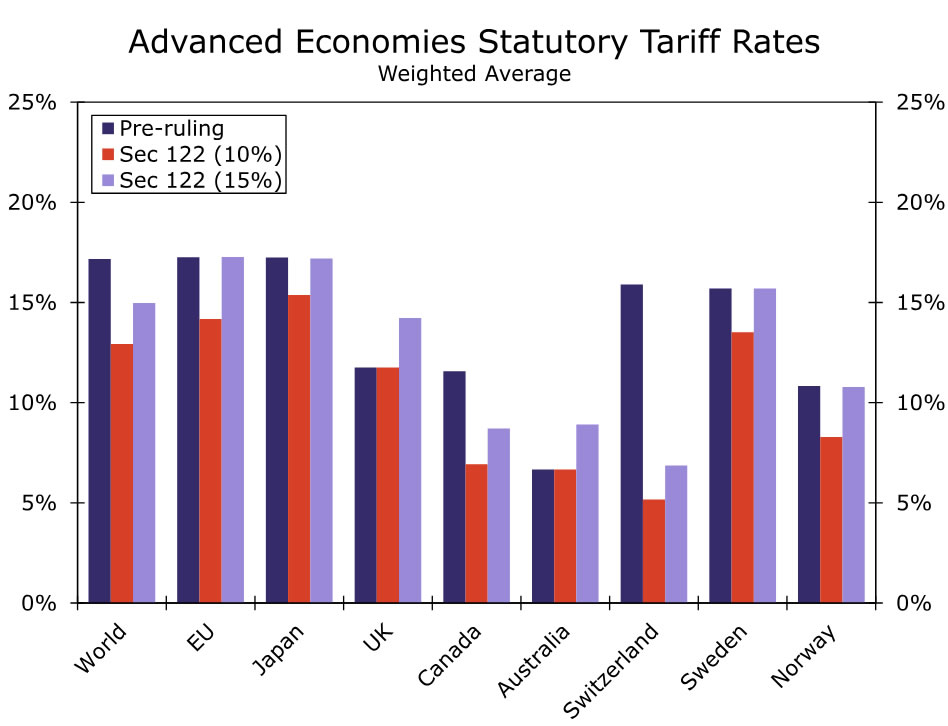
This produces meaningful cross‑country dispersion relative to prior tariff levels. Figure 2 and Figure 3 compare current and planned statutory tariffs with those prevailing pre‑ruling for major advanced and emerging economies, applying existing exemptions and (unstacked) sector specific tariffs. Under a 10% Section 122 regime, tariff rates decline for most trading partners with the United Kingdom and Australia as notable exceptions with unchanged rates. Under a 15% regime, tariff relief is largest for China, India, Brazil and South Africa versus pre-ruling levels, while tariff burdens rise for the UK, Australia, EU and Japan.
The Supreme Court decision creates a unique and unresolved legal situation for the 19 countries that finalized trade deals in recent months. All bilateral agreements since 2025 such as those undertaken by the EU (July), UK (May), Japan (September), South Korea (November), Indonesia (July), Taiwan, India and others, were implemented via executive orders with tariff rates set using IEEPA. The Court’s 6‑3 ruling made clear that IEEPA does not authorize tariffs, voiding the sole enforcement mechanism underpinning these agreements. The deals themselves were executive agreements, not Congress‑ratified treaties, leaving them without a clear legal foundation.
Section 122 authority expires on July 24, 2026, unless extended by Congress—an outcome we see as unlikely given bipartisan opposition and heading into the November Midterm elections. In the interim, the administration is likely to rely more heavily on accelerated Section 301 investigations, which offer the most robust path toward restoring country‑specific tariff authority and face no statutory rate cap. These are likely to be complemented by ongoing and prospective Section 232 investigations across sectors such as semiconductors, pharmaceuticals, drones and other strategic industries. Section 338 tariffs under the Tariff Act of 1930, which authorizes duties of up to 50%, remain a theoretical option, but their non‑use thus far suggests a higher legal and political threshold.
A strategic game is now unfolding that likely implies slower deal-making in 2026. Section 122 appears to function as a bridge while the administration reconstructs a legally durable tariff regime via 301/232 authority. Countries that negotiated deals face a sharp asymmetry: concessions (investment pledges, market access, export‑control alignment) were real and in many cases already delivered, while agreed tariff ceilings have been legally nullified. We see responses falling into three broad buckets:
- Wait and see (EU, UK): The EU has frozen ratification of its July agreement that had achieved a 15% "inclusive" deal rate rather the potential 15% Section 122 tariffs "adding" to 2-4% MFN rates. The European Parliament’s trade committee has postponed a vote pending “full clarity” from Washington. EU leverage remains significant with $600bn in pledged US‑directed investment and zero tariffs on US industrial goods. A breach of deal ceilings would allow the EU to withdraw concessions and reimpose retaliatory tariffs. The UK has adopted a similar posture, though with less confrontational rhetoric. Figure 2 shows the UK's gap between the threatened 15% tariffs and the 10% deal rate is the widest among peers.
- Signal commitment and seek protection (Japan, Korea, Mexico, Canada): Japan and Korea have also raised concerns that their agreements set 15% as an all‑in ceiling, compared to the Section 122 surcharge. Japan’s Trade Minister Akazawa has explicitly flagged the discrepancy, yet Japan has reiterated its intention to proceed with its $550bn investment commitment, including a recently announced $36bn critical minerals package. Korea has likewise indicated it will honor its deal. Separately, we expect Mexico and Canada to continue to push for USMCA compliance as a means of reducing the impact of announced tariffs. Ultimately, this ups the ante for ongoing discussions of USMCA extension that need to be completed by July 1, 2026.
- Slow‑walk compliance and delay engagement (China, India, Brazil, South Africa): With IEEPA leverage removed, US coercive power has weakened materially. These countries were subject to the highest IEEPA rates and are the primary beneficiaries under Section 122. We expect slow compliance under existing understandings and a deliberate delay in deeper deal‑making as the administration works to re‑establish its tariff authority. The lower tariff rates imply modest improvement in near-term sentiment even as the medium-term uncertainties about the economic relationship with the US linger.