Sample Category Title
GBP/USD Mid-Day Outlook
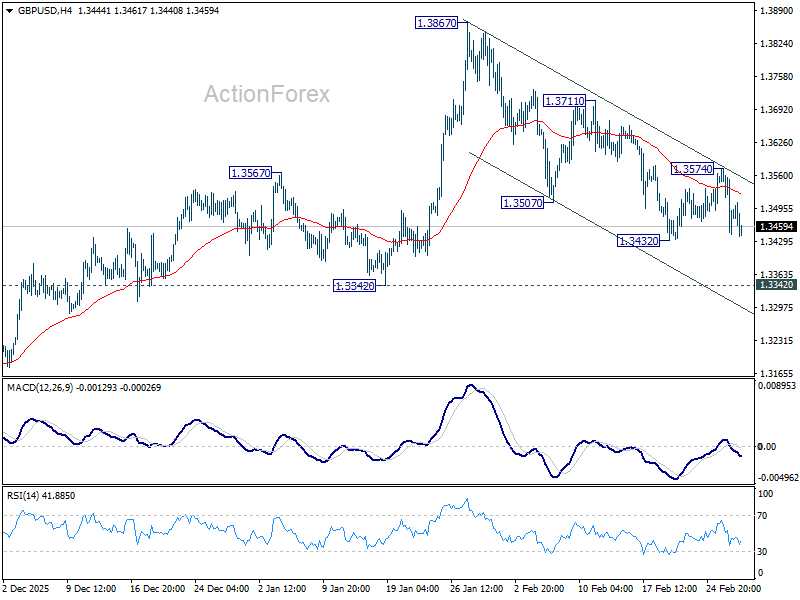
Daily Pivots: (S1) 1.3426; (P) 1.3501; (R1) 1.3556; More...
GBP/USD is still holding above 1.3432 support and intraday bias remains neutral for the moment. On the downside, below 1.3432 will resume the fall from 1.3867 to 1.3342 support. Firm break there should confirm that it's already correcting the whole rise from 1.2099. However, break of 1.3574 resistance will argue that the decline has completed as a near term correction, and turn bias back to the upside for retesting 1.3867.
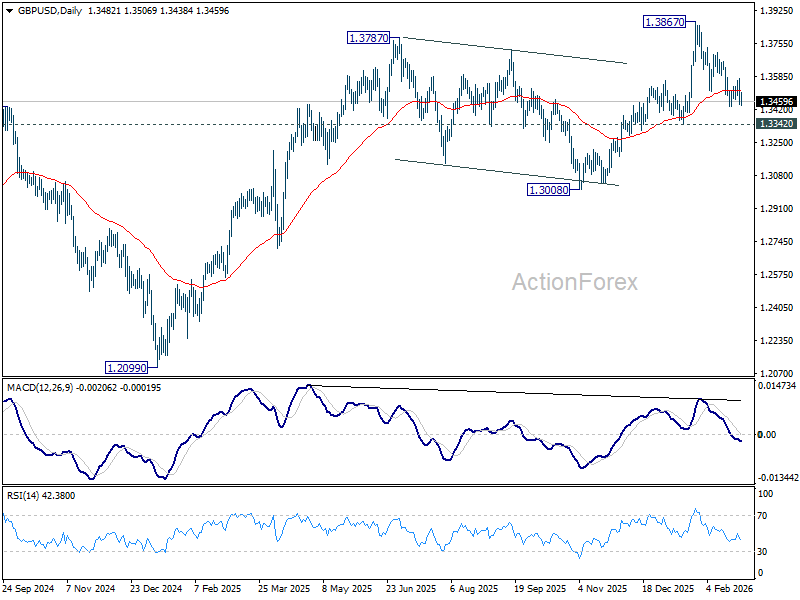
In the bigger picture, as long as 1.3008 support holds, rise from 1.3051 (2022 low) should still be in progress for 1.4284 key resistance (2021 high). Decisive break there will add to the case of long term bullish trend reversal. However, firm break of 1.3008 will raise the chance of medium term bearish reversal and target 1.2099 support next.
Sticky US PPI Sour Risk Mood; Sterling Hit by UK Political Blow
Stronger-than-expected US PPI data has unsettled financial markets, shifting sentiment toward a more defensive footing. The persistence of upstream inflation pressures reinforces the view that the Fed will remain cautious and resist calls for rapid rate cuts. Although US President Donald Trump and senior White House officials have continued to advocate for lower rates, the data argue for restraint. Inflation at the producer level suggests cost pressures from tariffs have not fully dissipated, making premature easing a risk.
Equity markets reacted swiftly. DOW futures slid more than -500 points after the release, signaling a weaker open. The move reflects renewed anxiety that monetary policy may stay restrictive for longer than previously hoped. At the same time, Treasury markets rallied. 10-year yield fell below the 4% psychological level on safe-haven flows, signaling that bond investors are increasingly concerned about growth risks even as inflation remains elevated. Gold and Silver rallied strongly alongside falling yields, reflecting demand for protection against both macro uncertainty and policy volatility.
For the Dollar, the picture is mixed. On one hand, risk-off sentiment should be supportive. On the other, falling yields weigh on rate differentials. As a result, Dollar gains remain tentative, with the opposing forces largely offsetting each other.
Elsewhere, Sterling remains under broad-based pressure for a different reason. The Green Party delivered a landmark victory in the Gorton and Denton by-election, taking a seat long considered safe for Labour. The outcome represents a significant political setback for Prime Minister Keir Starmer. The defeat intensifies scrutiny over Starmer’s leadership and could complicate the government’s fiscal and economic agenda.
Yen has staged a mild recovery, aided by comments from Japan’s Finance Minister Satsuki Katayama. She emphasized that authorities are closely monitoring currency developments and signaled urgency over recent weakness. Still, verbal intervention can only go so far without concrete policy action. Markets remain cautious, and follow-through buying has been limited.
For the week, Yen remains the worst performer despite today’s bounce. Sterling and Kiwi follow behind. Swiss Franc stands out as the strongest currency, with Aussie and Euro also firm. Dollar and Loonie are positioned mid-table.
In Europe, at the time of writing, FTSE is up 0.38%. DAX is down -0.10%. CAC is down -0.43%. UK 10-year yield is down -0.03 at 4.246. Germany 10-year yield is down -0.017 at 2.682. Earlier in Asia, Nikkei rose 0.16%. Hong Kong HSI rose 0.95%. China Shanghai SSE rose 0.39%. Singapore Strait Times rose 0.62%. Japan 10-year JGB yield fell -0.045 to 2.112.
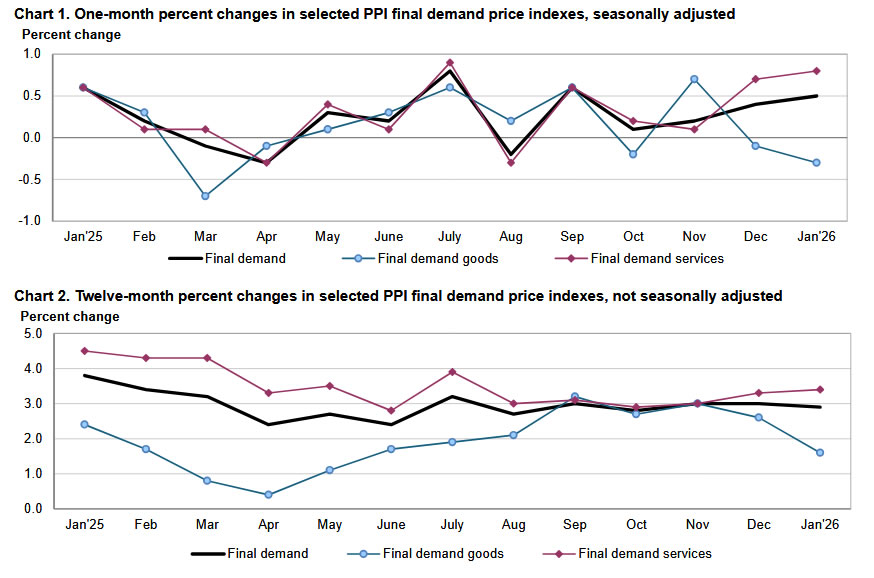
US PPI rises 0.5% mom in January as services drive monthly jump
US producer prices rose more than expected in January, with headline PPI climbing 0.5% mom against forecasts of 0.3%. The increase was largely driven by a sharp 0.8% gain in final demand services, while prices for final demand goods declined -0.3%.
On an annual basis, PPI eased slightly from 3.0% yoy to 2.9% yoy, but above expectations of 2.6%. The moderation in the yearly rate does little to offset the firm monthly momentum, particularly as underlying measures continue to trend higher.
Core PPI excluding foods, energy, and trade services rose 0.3% mom, marking the ninth consecutive monthly increase. Over the past 12 months, this core gauge advanced 3.4%, suggesting persistent pipeline price pressures.
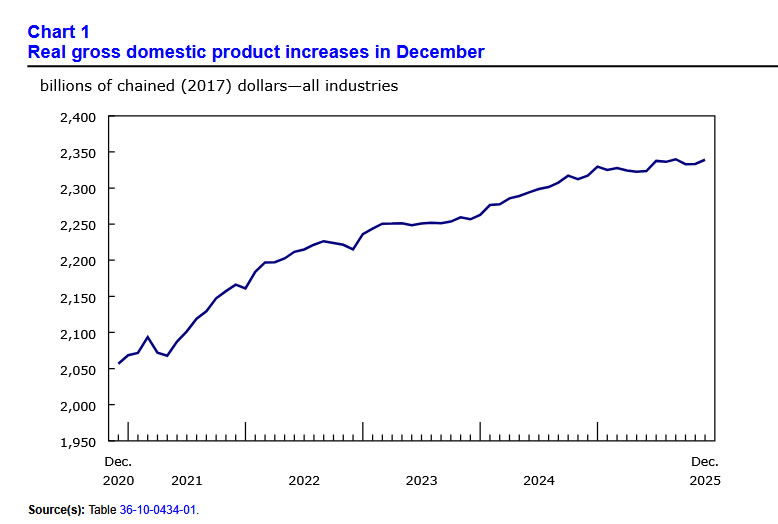
Canada GDP beats in December with 0.2% mom growth, but fragile start to 2026,
Canada’s economy closed 2025 on a slightly firmer note, with GDP rising 0.2% mom in December, above expectations of 0.1%. The expansion was driven by gains in both services-producing and goods-producing industries, suggesting a modest rebound in activity toward year-end.
Services industries led the monthly increase, rising 0.2%, supported by wholesale trade, the public sector, and transportation and warehousing. Meanwhile, goods-producing sectors also expanded 0.2%, partially reversing back-to-back declines in October and November, with manufacturing and utilities contributing to the recovery. In total, 11 of 20 industrial sectors recorded growth in December.
Advance estimates suggest real GDP was essentially unchanged in January, pointing to a fragile start to 2026.
The quarterly picture was less encouraging. GDP by industry edged down -0.1% in Q4 following a solid 0.6% expansion in Q3. Manufacturing was the main drag, contracting -1.5% in the quarter—its third decline of 2025 and fourth in the past five quarters—highlighting persistent weakness in the sector.
Swiss GDP returns to modest 0.1% qoq growth, domestic demand stabilizes Q4
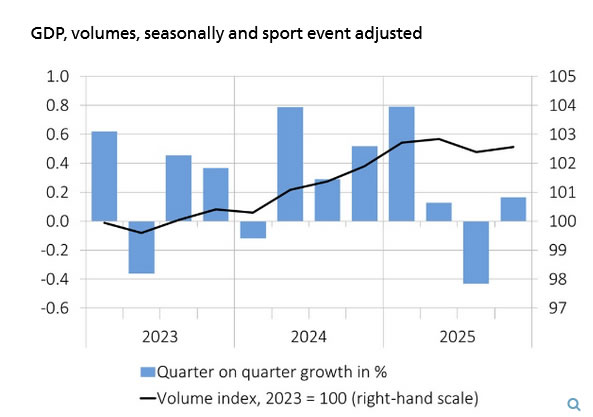
Switzerland’s economy returned to modest growth in Q4, with GDP expanding 0.1% qoq. While slightly below expectations of 0.2%, the reading marks a rebound from the -0.4% contraction recorded in Q3. According to the State Secretariat for Economic Affairs, performance varied across sectors, with domestic demand providing the main source of support.
The chemical and pharmaceutical industry, a key pillar of the Swiss economy, grew 1.9% after a sharp decline in the previous quarter, aided by pickup in exports. However, the rest of manufacturing contracted by -1.3% amid subdued sales and weaker export performance. Overall, industrial value added stagnated, though goods exports edged up 0.6% following two quarters of decline.
Domestic final demand rose 0.5% and helped stabilize the broader economy. Private consumption expanded 0.4%, while construction investment increased 1.0% on stronger building activity. Retail activity surged 2.0%, supporting a 1.7% rise in trade value added.
Swiss KOF barometer strengthens to 104.2, demand outlook improves
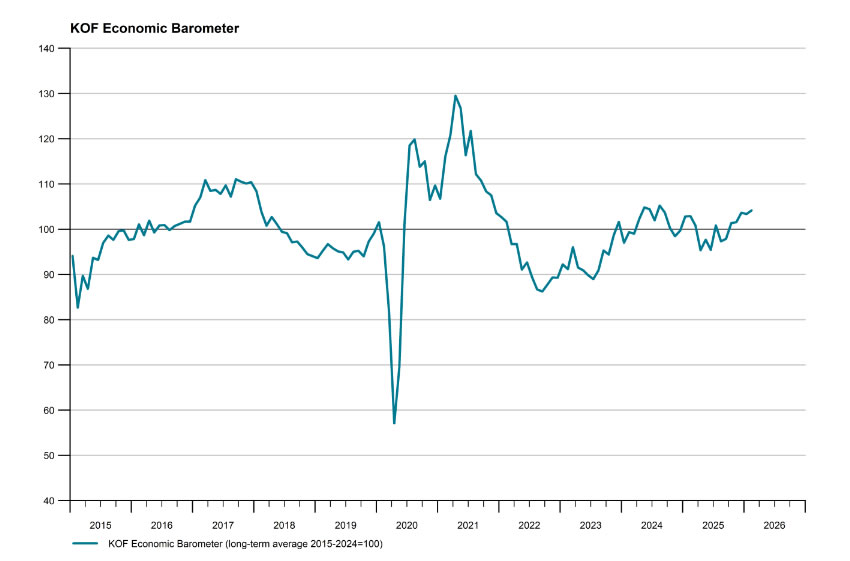
Switzerland’s economic outlook brightened in February as the KOF Economic Barometer rose from 103.3 to 104.2, beating expectations of 103.1. The increase resumes the upward trend seen in recent months after a brief dip in January and leaves the gauge comfortably above its medium-term average of 100.
According to KOF, the improvement reinforces a positive outlook for the Swiss economy, with strength concentrated on the demand side. Indicator bundles linked to consumption and foreign demand both point to favorable momentum.
However, the production side presents a more "mixed" picture. While some sectors remain stable, manufacturing is experiencing a setback, signaling that industrial momentum has yet to fully align with the broader demand recovery.
Subsidy effect pulls Tokyo core CPI down to 1.8%, but underlying inflation firms
Inflation in Tokyo eased further in February, with core CPI (ex-fresh food) falling to 1.8% yoy from 2.0% yoy. While slightly above market expectations of 1.7% yoy, the reading marks the third straight monthly slowdown and the lowest level since October 2024, slipping back under the BoJ’s 2% target.
The primary driver was a sharp drop in energy prices, which declined -9.2% yoy as the government’s temporary utility subsidies began to take effect. The program has mechanically dampened readings and was broadly expected to weigh on inflation for several months.
Beneath the surface, however, price dynamics remain more persistent. Core-core inflation (excluding fresh food and energy) rose to 2.5% yoy from 2.4% yoy, suggesting domestic demand conditions and wage-driven pricing remain intact. Headline CPI also ticked up modestly from 1.5% yoy to 1.6% yoy.
Japan's industrial production rose 2.2% mom on auto strength, but forward signals soft
Japan’s industrial production rose 2.2% mom in January, marking the first increase in three months, though falling well short of expectations for a 5.5%. .
Production expanded in 13 of 15 sectors, with automakers posting a notable 9.1% gain amid solid demand for passenger vehicles both domestically and overseas. However, weakness persisted in production machinery, where output declined on softer demand for semiconductor-manufacturing equipment.
The Ministry of Economy, Trade and Industry maintained its assessment that industrial production “fluctuates indecisively”. Officials noted that companies remain wary of US tariff policy developments and the Chinese growth outlook, even if no direct impact was evident in the latest data.
Looking ahead, manufacturers expect output to dip -0.5% in February and -2.6% in March.
In contrast, retail sales surprised to the upside, rising 1.8% yoy against expectations of just 0.2%.
GBP/USD Mid-Day Outlook
Daily Pivots: (S1) 1.3426; (P) 1.3501; (R1) 1.3556; More...
GBP/USD is still holding above 1.3432 support and intraday bias remains neutral for the moment. On the downside, below 1.3432 will resume the fall from 1.3867 to 1.3342 support. Firm break there should confirm that it's already correcting the whole rise from 1.2099. However, break of 1.3574 resistance will argue that the decline has completed as a near term correction, and turn bias back to the upside for retesting 1.3867.
In the bigger picture, as long as 1.3008 support holds, rise from 1.3051 (2022 low) should still be in progress for 1.4284 key resistance (2021 high). Decisive break there will add to the case of long term bullish trend reversal. However, firm break of 1.3008 will raise the chance of medium term bearish reversal and target 1.2099 support next.
US PPI rises 0.5% mom in January as services drive monthly jump
US producer prices rose more than expected in January, with headline PPI climbing 0.5% mom against forecasts of 0.3%. The increase was largely driven by a sharp 0.8% gain in final demand services, while prices for final demand goods declined -0.3%.
On an annual basis, PPI eased slightly from 3.0% yoy to 2.9% yoy, but above expectations of 2.6%. The moderation in the yearly rate does little to offset the firm monthly momentum, particularly as underlying measures continue to trend higher.
Core PPI excluding foods, energy, and trade services rose 0.3% mom, marking the ninth consecutive monthly increase. Over the past 12 months, this core gauge advanced 3.4%, suggesting persistent pipeline price pressures.
Canada GDP beats in December with 0.2% mom growth, but fragile start to 2026,
Canada’s economy closed 2025 on a slightly firmer note, with GDP rising 0.2% mom in December, above expectations of 0.1%. The expansion was driven by gains in both services-producing and goods-producing industries, suggesting a modest rebound in activity toward year-end.
Services industries led the monthly increase, rising 0.2%, supported by wholesale trade, the public sector, and transportation and warehousing. Meanwhile, goods-producing sectors also expanded 0.2%, partially reversing back-to-back declines in October and November, with manufacturing and utilities contributing to the recovery. In total, 11 of 20 industrial sectors recorded growth in December.
Advance estimates suggest real GDP was essentially unchanged in January, pointing to a fragile start to 2026.
The quarterly picture was less encouraging. GDP by industry edged down -0.1% in Q4 following a solid 0.6% expansion in Q3. Manufacturing was the main drag, contracting -1.5% in the quarter—its third decline of 2025 and fourth in the past five quarters—highlighting persistent weakness in the sector.
Crypto Stuck in a Narrow Consolidation Range
Market Overview
Crypto market capitalisation has fallen back to $2.3 trillion, remaining at Thursday’s low. The upward momentum gained at the beginning of the week has not developed further, with traders preferring to sell as prices rise.
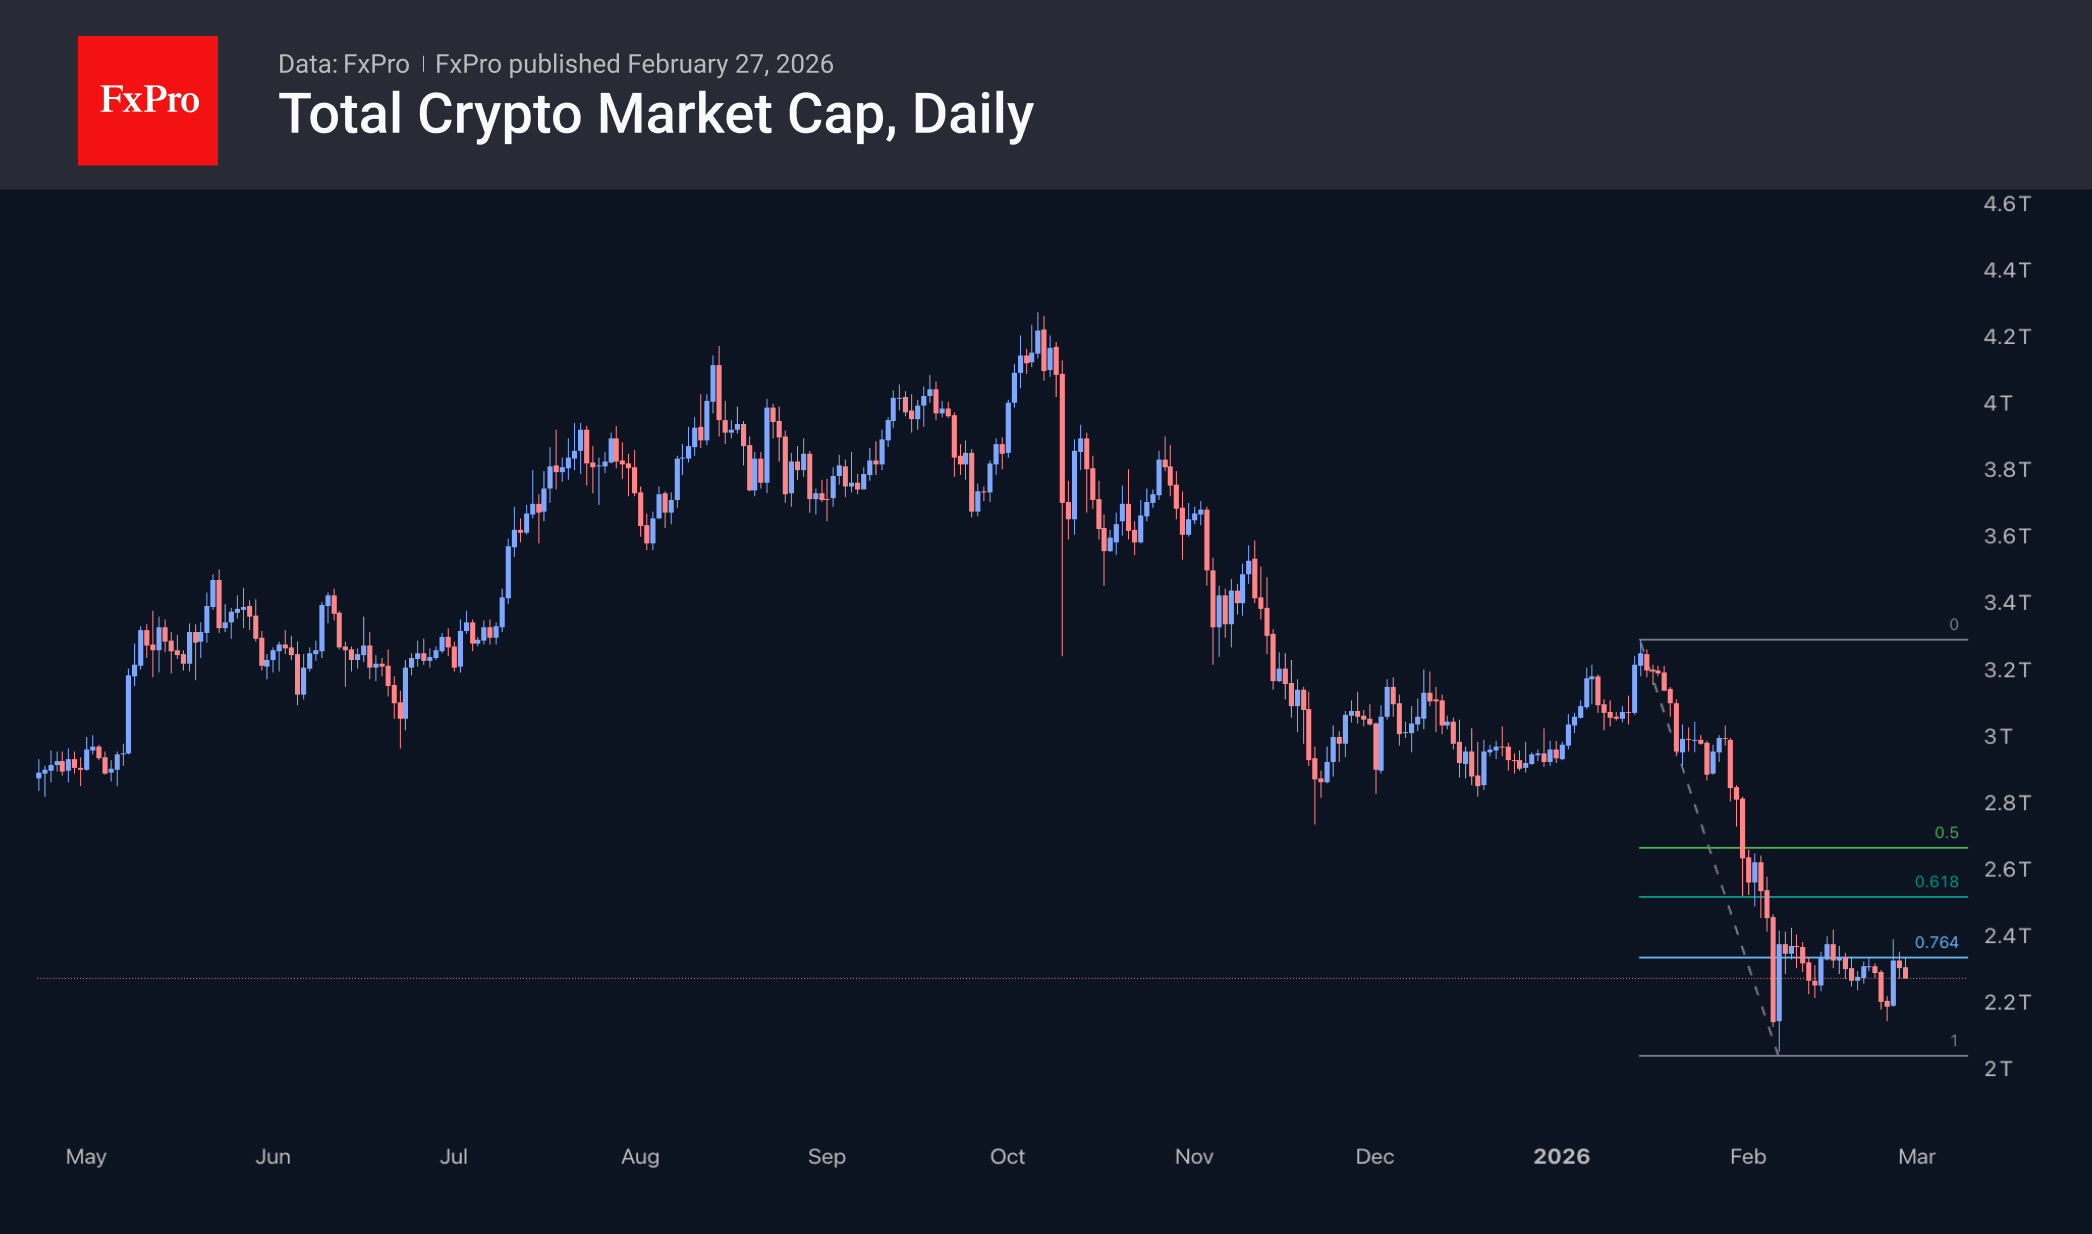
Over the past three weeks, the market has mainly traded within the $2.20–2.40 trillion range. Local resistance roughly coincides with a 23.6% recovery from the decline between the mid-January highs and the early February lows. Such narrow consolidation is often seen in strong bear markets.
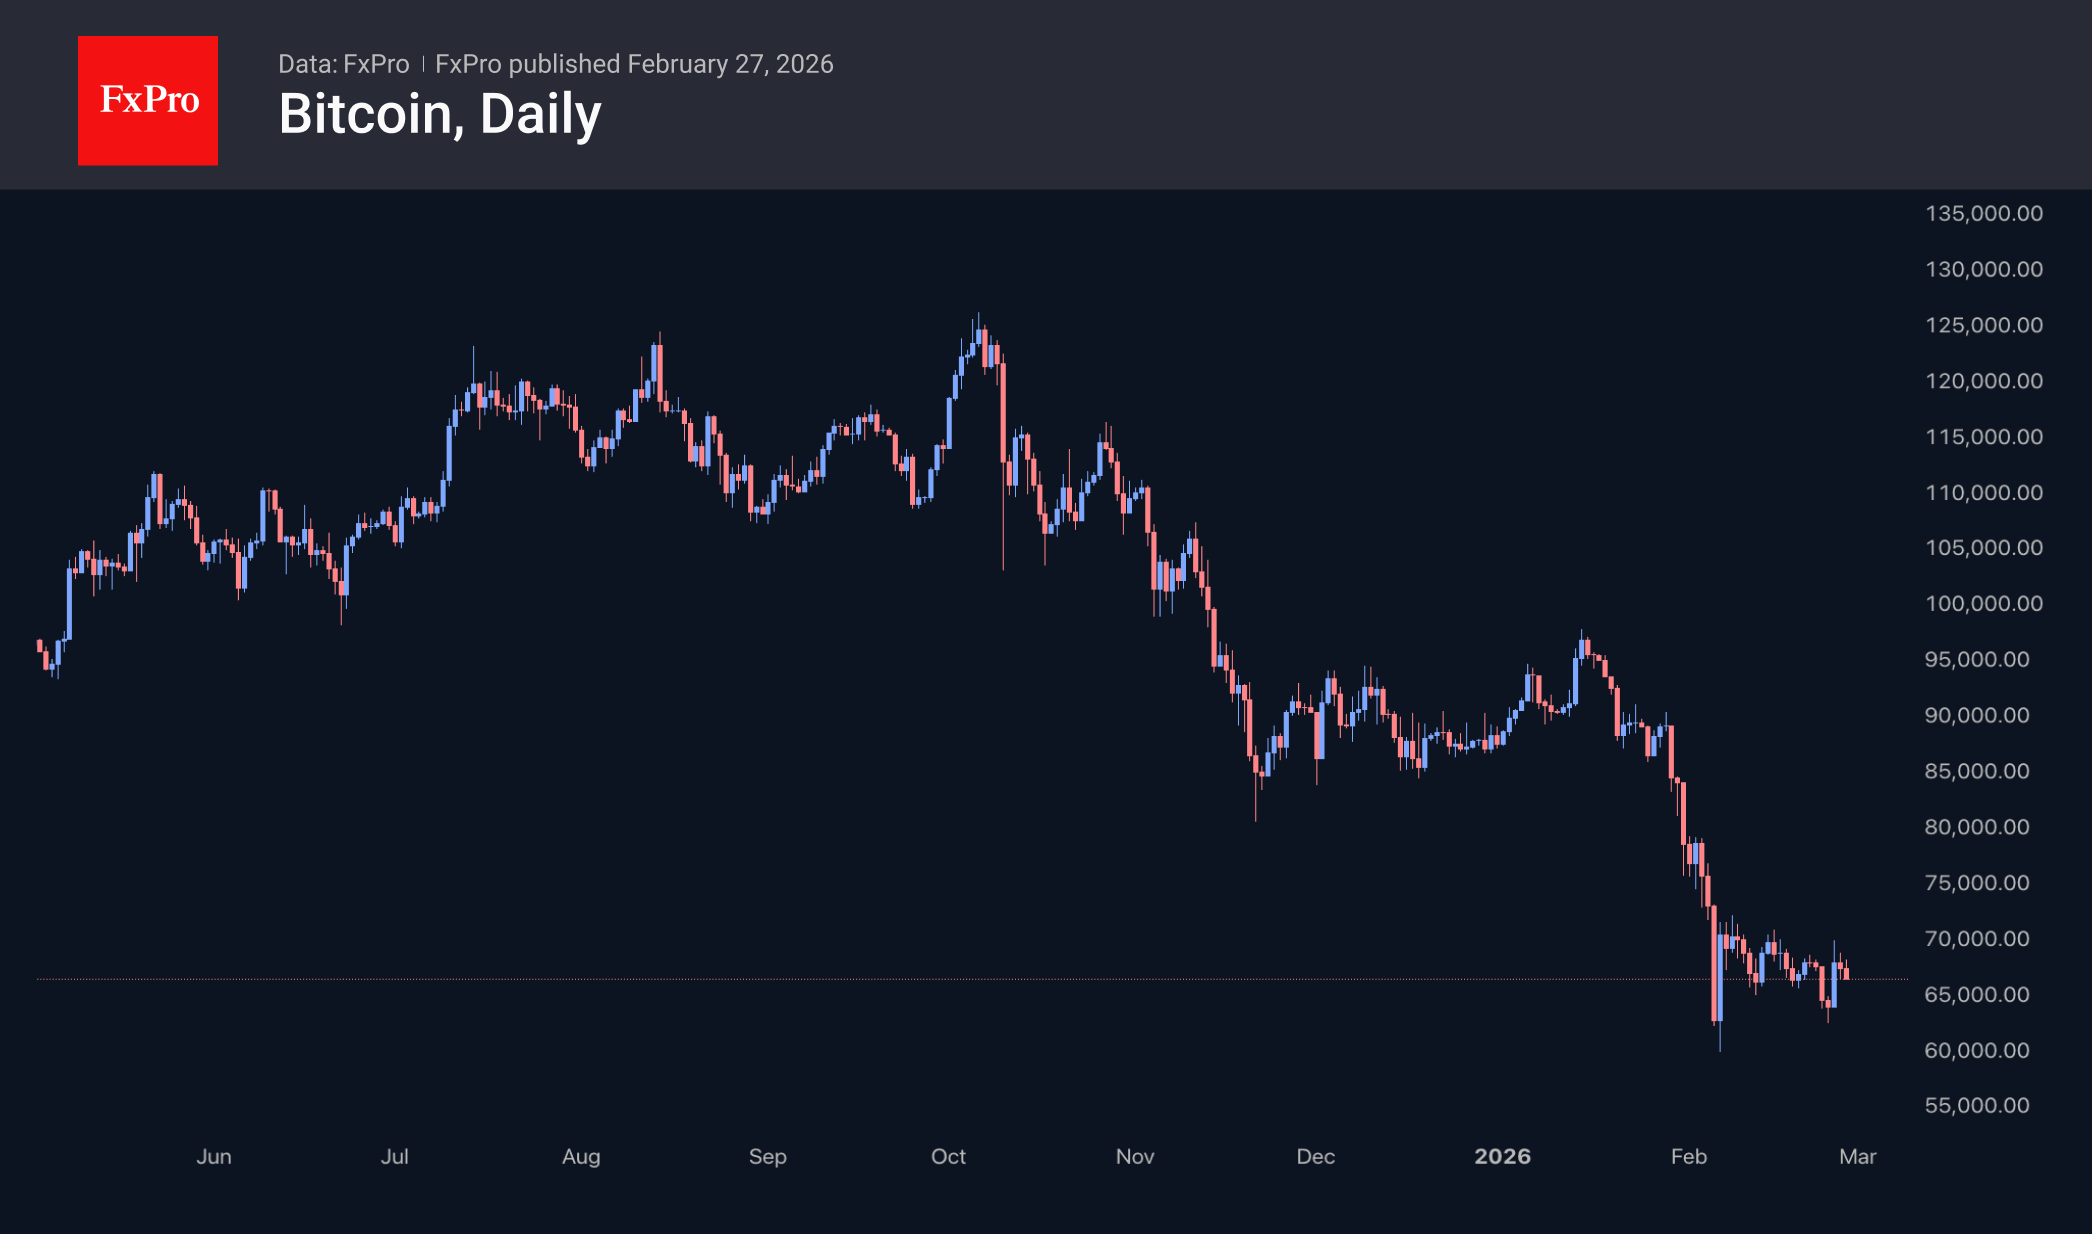
Bitcoin has fallen back below $67,000, failing to build on its gains as it comes under pressure alongside tech giants on Wall Street. While the first cryptocurrency remains well above the lows it rebounded from on Tuesday, it is slowly sliding down and has given up almost half of that rebound.
News Background
The value of USDT stablecoin reserves held by exchanges has fallen from $60 billion to $51.1 billion over the past two months. CryptoQuant warns that a drop below $50 billion will trigger a massive sell-off in the crypto market.
Meanwhile, Wikipedia co-founder Jimmy Wales has suggested that the price of the first cryptocurrency will collapse to $10,000 by the middle of the century. In his opinion, Bitcoin has completely failed as a store of value.
Strategy shares topped the list of large US companies by short position volume. The market doubts the reliability of the company’s Bitcoin strategy, under which the firm issued shares and attracted debt financing to purchase cryptocurrency.
Ethereum developers have presented a plan for seven hard forks between now and 2029. Updates are expected every six months. So far, only two of these have been named: ‘Glamsterdam’ and ‘Hegota’. These will be implemented this year.
Large Ethereum holders have started selling the cryptocurrency at a loss. The DAT company ETHZilla has officially abandoned its ETH accumulation strategy and changed its name. The firm has decided to focus on tokenised assets (RWA).
The DAT company GD Culture Group (GDC) is set to sell some of its Bitcoin reserves to fund a share buyback programme. Last September, the firm acquired 7,500 BTC, placing it 15th among public companies in terms of Bitcoin reserves.
The total volume of loans on the DeFi platform Aave has exceeded $1 trillion. This makes it the first project in the decentralised finance industry to reach this significant milestone.
USD/JPY Declines, but the Overall Outlook for the Yen Remains Hazy
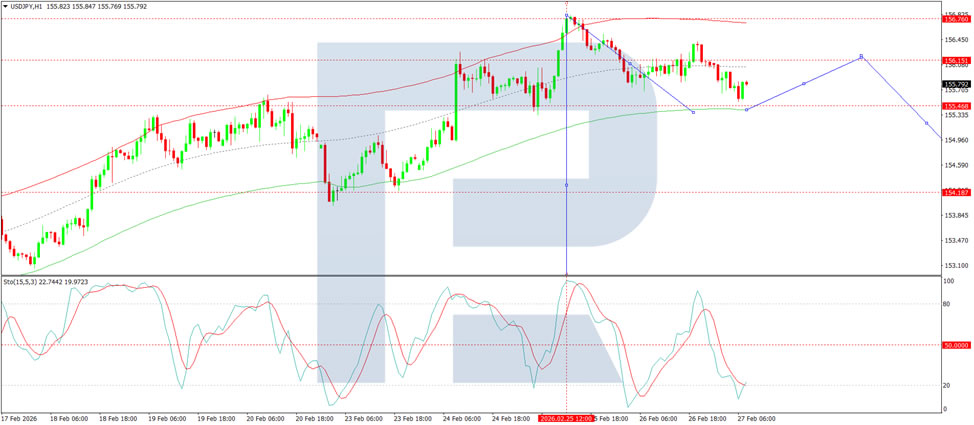
USD/JPY is trading lower at 155.79 on Friday. Meanwhile, the yen remains under pressure at the end of the week. It is on track to record a second consecutive weekly decline amid ongoing uncertainty surrounding Bank of Japan (BoJ) policy.
This week, the Japanese government nominated two academics known for favouring loose monetary policy to the BoJ board. Prime Minister Sanae Takaichi, following a meeting with BoJ Governor Kazuo Ueda, expressed concerns about the possibility of further interest rate hikes.
In contrast, board member Hajime Takata, who holds a more hawkish stance, has called for additional policy tightening. He also indicated that the bank's price stability target is nearly achieved.
Governor Ueda himself noted that the BoJ will carefully assess incoming economic data at its March and April meetings, leaving the door open to a potential short-term rate hike.
Economic statistics are also influencing market expectations. Inflation in Tokyo has slowed to its lowest level in over a year, partly due to government subsidies for utilities. This has reinforced expectations that the central bank may refrain from tightening policy in the near term.
Technical Analysis
On the H4 chart, USD/JPY is forming a consolidation range around the 156.15 level. A decline towards 155.50 is expected today, after which a corrective move back towards 156.15 may follow. A breakout above this range could open the way to further gains towards 157.50. Conversely, a break below the range would signal a continuation of the downward move, initially towards 154.18, with scope to extend towards 151.82. Technically, this bearish scenario is supported by the MACD indicator, whose signal line remains above zero but is pointing firmly lower.
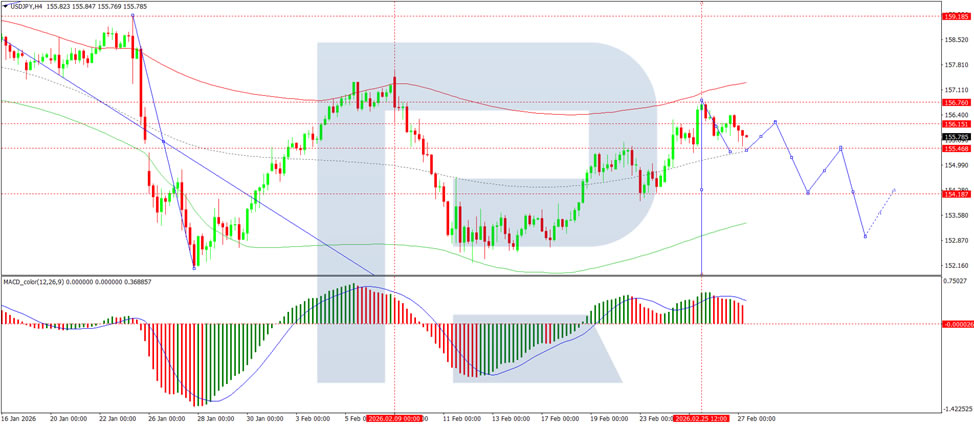
On the H1 chart, the pair has broken below the 156.15 level and is forming a downward wave towards 155.40. A subsequent correction back to 156.15 cannot be ruled out. This short-term bearish bias is confirmed by the Stochastic oscillator, with its signal line below 50 and pointing lower.
Conclusion
USD/JPY is declining amid persistent uncertainty regarding the Bank of Japan's next policy move. Market expectations are being pulled between hawkish signals from some board members and more cautious communication from the leadership, reinforced by softer Tokyo inflation data. Technical analysis suggests scope for further short-term downside, although a corrective bounce remains possible.
WTI Oil Pulls Back from Its 2026 High
As the XTI/USD chart shows, the price of a barrel:
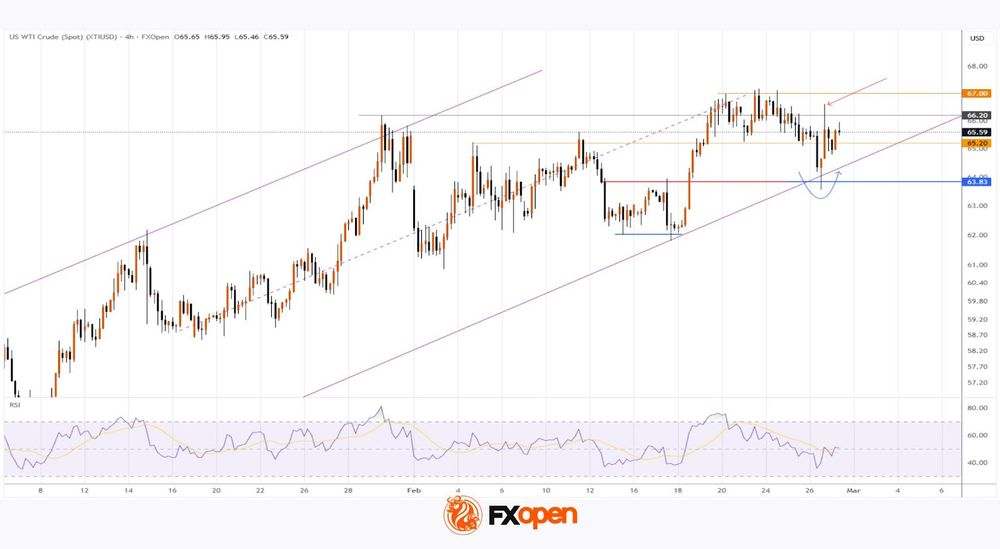
- → set fresh 2026 highs above $67 earlier this week;
- → but yesterday posted a sharp reversal lower (as indicated by the blue arrow).
The spike in volatility was driven by conflicting reports from Geneva, where talks between the United States and Iran were taking place:
- → some sources suggested negotiations had reached an impasse, as Washington insists on a complete halt to uranium enrichment;
- → meanwhile, according to Omani mediators, progress has been made and another round of talks is scheduled for next week.
Technical Analysis of the XTI/USD Chart
When analysing the oil price chart on the morning of 19 February, we suggested that:
- → the market could soon set a new high for the year (which materialised, with a series of highs formed between 19 and 23 February);
- → the 65.20 level would act as support (confirmed on 23 February).
Today’s chart indicates growing bearish pressure, reflected in the following:
- → WTI struggled to hold above its yearly highs, forming signs of potential bull traps;
- → yesterday’s candle (marked with a red arrow) shows a pronounced upper wick.
At the same time, bulls clearly defended the former resistance level at $63.73. The lower boundary of the ascending trajectory that has defined WTI price movements in 2026 also supports the bullish case.
It is worth noting that an OPEC+ meeting is scheduled for the weekend. According to media reports, analysts expect an increase in output from April, which could heighten concerns about oversupply — particularly after US crude inventories rose on Wednesday. As a result, Monday’s trading may open with elevated volatility.
Start trading commodity CFDs with tight spreads (additional fees may apply). Open your trading account now or learn more about trading commodity CFDs with FXOpen.
This article represents the opinion of the Companies operating under the FXOpen brand only. It is not to be construed as an offer, solicitation, or recommendation with respect to products and services provided by the Companies operating under the FXOpen brand, nor is it to be considered financial advice.
Swiss KOF barometer strengthens to 104.2, demand outlook improves
Switzerland’s economic outlook brightened in February as the KOF Economic Barometer rose from 103.3 to 104.2, beating expectations of 103.1. The increase resumes the upward trend seen in recent months after a brief dip in January and leaves the gauge comfortably above its medium-term average of 100.
According to KOF, the improvement reinforces a positive outlook for the Swiss economy, with strength concentrated on the demand side. Indicator bundles linked to consumption and foreign demand both point to favorable momentum.
However, the production side presents a more "mixed" picture. While some sectors remain stable, manufacturing is experiencing a setback, signaling that industrial momentum has yet to fully align with the broader demand recovery.
Swiss GDP returns to modest 0.1% qoq growth, domestic demand stabilizes Q4
Switzerland’s economy returned to modest growth in Q1, with GDP expanding 0.1% qoq. While slightly below expectations of 0.2%, the reading marks a rebound from the -0.4% contraction recorded in Q3. According to the State Secretariat for Economic Affairs, performance varied across sectors, with domestic demand providing the main source of support.
The chemical and pharmaceutical industry, a key pillar of the Swiss economy, grew 1.9% after a sharp decline in the previous quarter, aided by pickup in exports. However, the rest of manufacturing contracted by -1.3% amid subdued sales and weaker export performance. Overall, industrial value added stagnated, though goods exports edged up 0.6% following two quarters of decline.
Domestic final demand rose 0.5% and helped stabilize the broader economy. Private consumption expanded 0.4%, while construction investment increased 1.0% on stronger building activity. Retail activity surged 2.0%, supporting a 1.7% rise in trade value added.
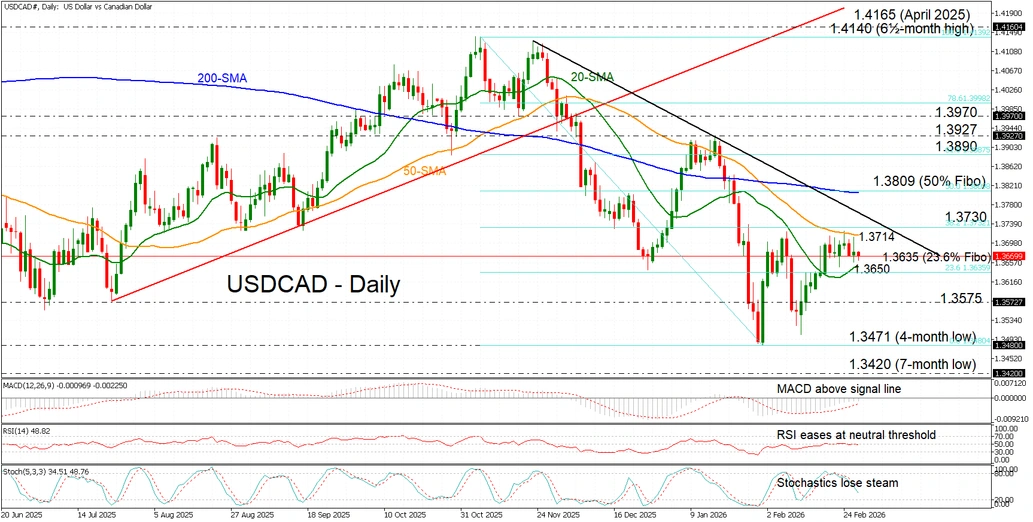
USD/CAD Range Trades Below 1.3700 Ahead of Key Data
- USDCAD drifts sideways between the 20- and 50-day SMAs.
- Momentum indicators reflect a wait‑and‑see stance.
USDCAD continues to consolidate within the tight 1.3650-1.3710 range defined by the 20‑ and 50‑day simple moving averages (SMAs), trading near 1.3670. The pair sits at a technical inflection point as markets await key releases from both economies – US PPI and Canadian GDP – which could help shift directional bias. Oil price dynamics also remain important, with supply concerns potentially limiting upside for the pair.
The momentum indicators reinforce the indecisive tone – the RSI is flatlining around the neutral 50 level, the MACD is edging slightly higher from negative territory, and the stochastics are losing momentum near the midline, collectively mirroring the lack of clear direction.
A decisive break above the 50‑day SMA at 1.3714 and the 38.2% Fibonacci retracement of the November-January decline at 1.3730, where the short-term downtrend also intersects, could tilt the bias to the upside. Such a move would open the door toward the 200‑day SMA near the 50% Fibonacci level at 1.3809, which currently forms a death‑cross structure with the 50‑day SMA.
Conversely, initial support lies at the 20‑day SMA at 1.3650, positioned just above the 23.6% Fibonacci level at 1.3638. Below that, support extends to 1.3575 and the four‑month low near 1.3471 recorded earlier this month.
Overall, USDCAD remains range‑bound, with the rebound from four‑month lows stalling and the broader downtrend intact as markets await key catalysts to set direction.