Sample Category Title
Dollar Caught a Break Thanks to Yield Support and Risk-off Setting
Markets
“All” it took for US investors to digest Friday’s strong payrolls was a weekend of time, another eye-opening WSJ article and a strong US non-manufacturing ISM. Recall that the initial post-payrolls move (higher yields, stronger dollar, weaker stocks) was surprisingly undone by last week’s US closing bell. The trading week yesterday still started with some positive Asian vibes related to looser Chinese Covid-moves, but morphed to a very neutral setting in Europe and eventually a risk-off climate in the US. The WSJ emphasized that the biggest Fed policy mistake would be letting its guard down when it comes to inflation, with next week’s “dot plot” likely to show a policy rate peak of 5.25% compared with 4.75% in September and 5% discounted by money markets. Shifting from 75 bps rate hikes to 50 bps increments means that policy rates will stay at their peak for longer, unlike the 50 bps of rate cuts priced in by the end of 2023. The November US services ISM unexpectedly bounced from 54.4 to 56.5 (vs 53.5 expected). The Holiday Season clearly left its mark. Details showed a significant rise in business activity, from 55.7 to 64.7. New orders grew at a similar pace (56 from 56.5), but export orders contracted much faster (38.4 from 47.7). Employment switched sides again from the neutral 50, rising from 49.1 to 51.5 with price pressure still alleviated (70 from 70.7). Fed Chair Powell last week noted that core services may be the most important category for understanding the future evolution of core inflation. Supplier deliveries slowed further with the ISM noting increased capacity and shorter lead times which resulted in a continued improvement in supply chain and logistics performance.
US Treasuries finally made their U-turn, significantly underperforming German Bunds. US yields rose by 3.7 bps (30-yr) to 14.1 bps (3-yr) with the curve turning more inverse. Technically, the US 10-yr yield bounced off 3.5% support (previous cycle high back in June). Changes on the German curve varied between -1 bp (30-yr) and +2 bps (5-yr). The German 10-yr yield bounced off the October low at 1.77%. US stock markets started on the backfoot and continued losing ground throughout the session to eventually lose 1.5% (Dow) to 2% (Nasdaq). The dollar caught a break thanks to the yield support and the risk-off setting, with EUR/USD closing at 1.0491 from an 1.0532 open and after almost touching 1.06 early in the session. The trade-weighted greenback recovered from an intraday low just north of 104 to currently 105.45. USD/JPY rose from 134 to 137 with rising (real) rates beating risk sentiment. EUR/GBP moved away from 0.8569/67 support in a technical move, to currently meet the 0.86 big figure. Today’s eco calendar only contains US trade data. Chinese stocks take the upper hand again this morning on the back of further loosening of Covid-restrictions, but weren’t the best guideline for Europe/US of late. A slightly more hawkish Australian central bank (see below) could be more sign of the times.
News Headlines
The Reserve bank of Australia raised its policy rate by 25 bps to 3.1%, as expected, bringing the cumulative amount of tightening to 3.0% since the start of the cycle in May. The central bank expects to increase interest rates further over the period ahead, but said it is not on a pre-set course. Inflation at 6.9% in October is still too high and is forecast to peak around 8% over the December quarter, but is expected to decline next year. The economy continues to grow solidly, but growth is expected to slow to about 1.5% in 2023 and 2024. At 3.4% the unemployment rate is at the lowest since 1974. However, with quite some tightening already done, the RBA indicates that monetary policy operates with a lag and that the effect of interest rate increases is yet to be felt. The path to achieving the needed decline in inflation and achieving a soft landing for the economy remains a narrow one. The 2-y Australian government bond yield rose 9 bps (to 3.07%). The Aussie dollar this morning gains modestly (AUD/USD 0.6735), but is unable to reverse yesterday’s USD driven decline.
Bloomberg cites sources that the EU and the US are weighing a new approach to implement their climate agenda by raising new tariffs on Chinese steel and aluminum as part of a plan to reduce carbon emission and overcapacity in the sector. However, according the report an agreement is unlikely before late next year.
Elliott Wave View: USDCHF Completing 5 Waves Impulse
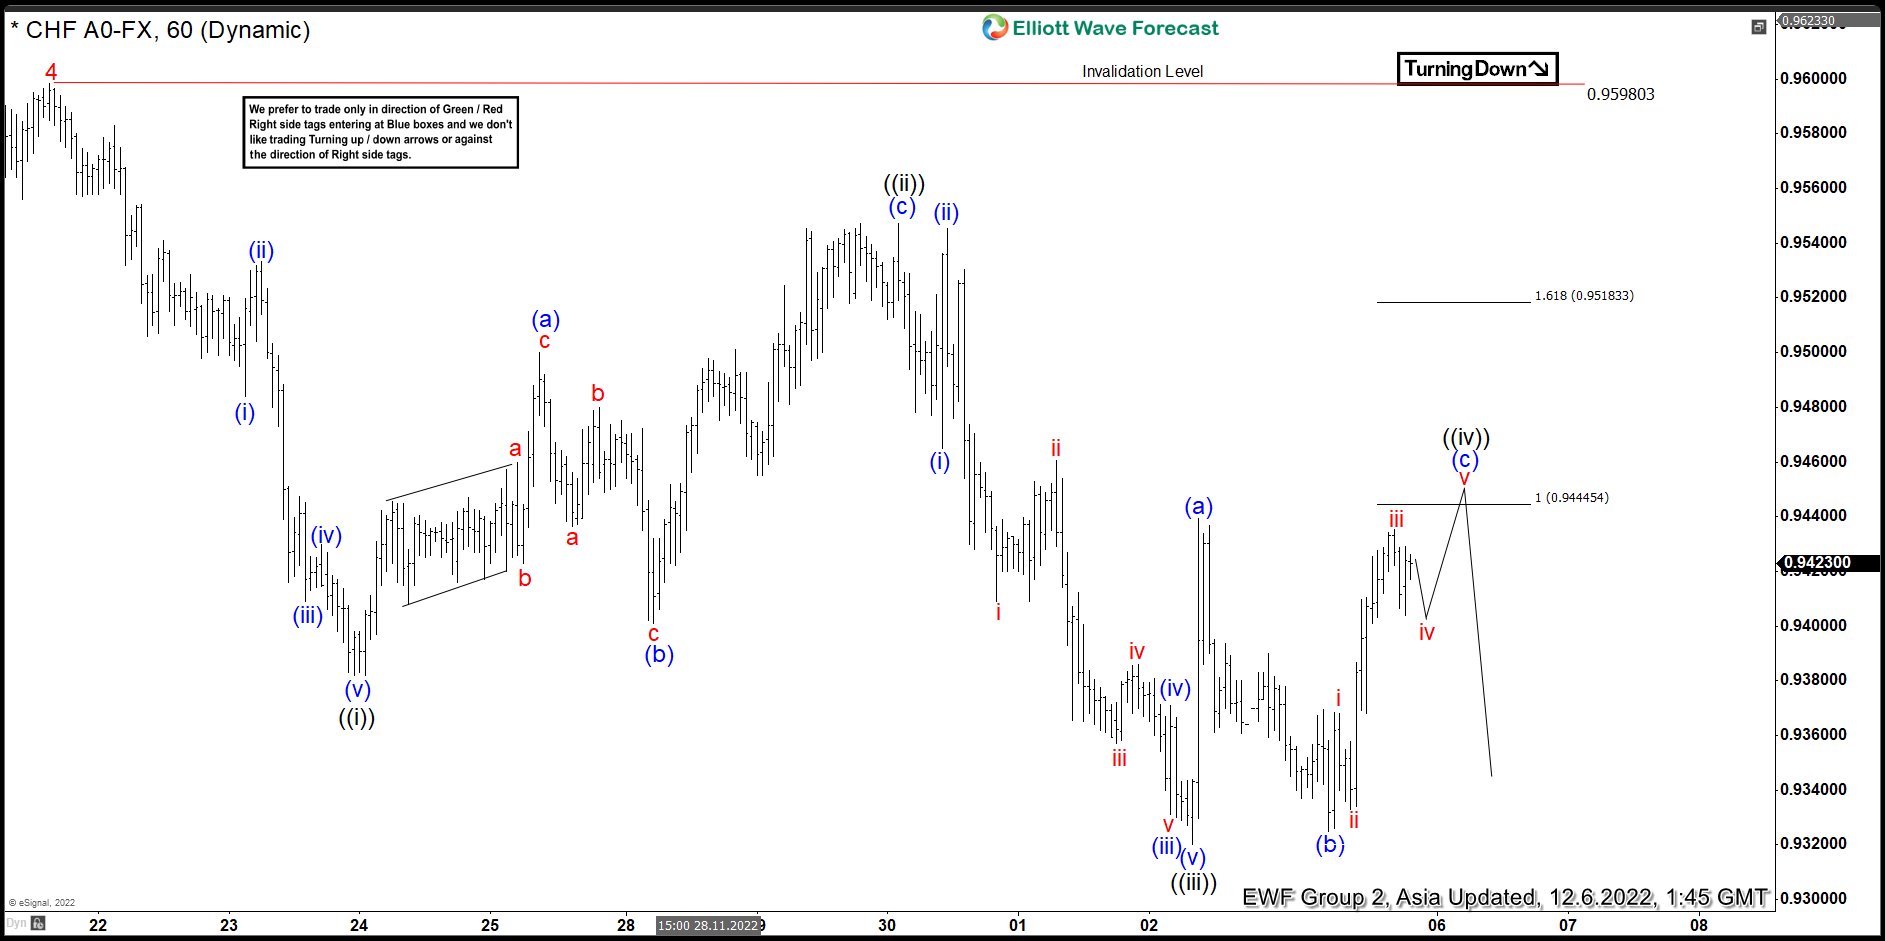
Short term Elliott Wave View in $USDCHF suggests that the decline from 10.21.2022 high is in progress as 5 waves impulse Elliott Wave structure. Down from 10.21.2022 high, wave 1 ended at 0.9841 and rally in wave 2 ended at 1.0147. Pair then resumed lower in wave 3 towards 0.935 and rally in wave 4 ended at 0.9598.
Wave 5 lower is in progress with internal subdivision as an impulse in lesser degree. Down from wave 4, wave (i) ended at 0.9484 and rally in wave (ii) ended at 0.9533. Pair resumed lower in wave (iii) towards 0.9409, wave (iv) ended at 0.943, and wave (v) of ((i)) ended at 0.938. USDCHF then corrected in wave ((ii)) which ended at 0.9547. Pair resumed lower in wave ((iii)) with subdivision as another impulse. Down from wave ((ii)), wave (i) ended at 0.9465 and wave (ii) ended at 0.954. Pair then resumed lower in wave (iii) towards 0.933, wave (iv) ended at 0.937, and wave (v) of ((iii)) ended at 0.932. Wave ((iv)) is in progress as a zigzag where wave (a) ended at 0.944 and pullback in wave (b) ended at 0.9325. Expect wave (c) of ((iv)) to complete at 0.944 – 0.952 area before pair resumes lower.
USDCHF 60 Minutes Elliott Wave Chart
https://www.youtube.com/watch?v=6KaL7u8Vg9U
RBA Board Raises the Cash Rate by 0.25%
Contrary to widespread expectations RBA Board retains strong tightening bias.
The Reserve Bank Board lifted the cash rate by 0.25%. While that decision was strongly promoted by Westpac there was real uncertainty in markets with only around an 80% probability attached to it.
Markets were even more convinced that the Governor would soften his guidance with a weaker tightening bias.
In the event the Governor maintained the guidance he has used in the last two meetings , “The Board expects to increase rates further in the period ahead, but is not on a pre-set course.”
Options that were considered by some market participants included, “might increase”; “is willing to increase”; “will consider increasing”.
The use of the additional qualifier “but not on a pre-set course” seems neutral by allowing full flexibility in the context of a clear strong tightening bias and, in my view, does not weaken that bias.
From Westpac’s perspective those options would have been a misplaced strategy given that the next meeting is not until February 6 and the Board now has ample time to assess the cumulative impact of the rate increases from the perspective of household spending; the housing market; employment; inflation (December quarter CPI prints on January 25); the global economy; and private sector measures of wage inflation, (the next official ABS Wage Price Index does not print until February 15).
Over that two month period there will be at least two more previous increases in mortgage rates that will be passed on to households.
As usual there were few changes to the November Statement in the December Statement.
One that stood out was the Governor finally emphasising the dangers associated with high inflation.
In November he noted that “Price stability is a prerequisite for a strong economy and a sustained period of full employment” .
In December he has strengthened that theme. “High inflation damages our economy and makes life more difficult for people”.
Perhaps the October and November Statements were justifying decisions to move by only 25 basis points so the arguments about the economic damage from high inflation were downplayed in favour of the key point regarding the lags from monetary policy.
From our perspective it is encouraging that the Governor has emphasised his awareness of the dangers of entrenched inflation – consistent with the views of other central banks such as the Federal Reserve.
That point was further emphasised where he notes that “The Board’s priority is to establish low inflation and return inflation to the 2-3% range over time. ”That point emphasises that the Board’s objective around inflation is for sustained low inflation.
Further on inflation , he did recognise the monthly inflation report by noting that annual inflation was 6.9% ( as reported for October) but was prepared to confirm the Bank’s view that inflation would reach 8% by year’s end.
Given that the October report only covers 43% of the components by value then it was reasonable that the Governor may have delayed recognising the result until further information was available.
The sharp lift in private sector wages growth in the September quarter may also have impacted the Board’s thinking.
The Governor notes that “ wages growth has continued to pick up “ but unlike in November excludes the qualification that “ remains lower than in many other advanced economies.”
Given the strong wages (including yesterday’s report for the September quarter)and employment reports since the last Board meeting it is surprising that the Governor did not repeat the sentiment from the November Statement that “people are finding jobs, gaining more hours of work and receiving higher wages.”
Conclusion
The Board has correctly maintained a strong tightening bias while emphasising the uncertainties in the outlook.
There is a stronger recognition of the dangers around high inflation than we have seen in previous Statements when 25 basis point moves needed to be justified.
Westpac expects that the inflation report for the December quarter will signal the need for further tightening and the Board will act on its tightening bias with a 25 basis point increase in February.
Beyond February we expect further increases in March, in response to the December Wages Report, and May to achieve the clearly stated objective of “Board’s priority is to re-establish low inflation.”
We are surprised that market pricing still includes some likelihood of rate hikes in the second half of 2023. Our forecast of 1% growth in 2023, partly contingent on our view on the Bank’s tightening cycle and the difficulties in wringing inflation out of the system, implies that the economic slowdown will be particularly intense in the second half precluding the need to tighten further.
The risk, which seems lessened following today’s decision and statement would be that insufficient policy tightening allows elevated inflationary expectations to become embedded in the Australian psyche.
Fed Hawks Are, Of Course, Back
Stocks fell and the US dollar strengthened on Monday.
One of the reasons that could have triggered the move was a stronger-than-expected ISM services read in the US, which came in above expectations, and hinted that the economic activity, at least in the US services sector continues growing, and growing un-ideally faster-than-expected despite the Federal Reserve’s (Fed) efforts to cool it down.
So, the economic data may have fueled the Fed hawks yesterday, although I just want to note that another data, which is PMI services remained comfortably in the contraction zone at around 46.
But the fact that the S&P500 was flirting with critical yearly resistance may have played a bigger role in yesterday’s selloff.
The S&P500 shortly traded above the year-to-date bearish channel top last week without a solid reason to do so. The pricing in the markets barely reflects the scenario that the US rates will go above the 5% mark. Therefore, a downside correction was necessary to reflect the reality of the Fed game.
Some people say that it’s because the market sees the Fed’s bluff. But at the end of the day, if Fed’s bluff of tighter policy doesn’t do the job, then the Fed will have to do the job itself.
In the short run, the S&P500 may have seen a top near 4100 and could opt for a further downside correction, with the first bearish target set at 3956, the minor 23.6% Fibonacci retracement on the latest rally, then to around 3870, the major 38.2% retracement level and which should distinguish between a short-term bearish reversal, and the continuation of the latest bear market rally.
Looking at the FX, the Aussie was slightly better bid after the Reserve Bank of Australia (RBA) raised its rates by another 25bp today, and took the rates to levels last seen a decade ago.
Elsewhere, the US dollar strengthened as a result of the hawkish Fed rectification. The dollar index first eased to a fresh low since June, then rebounded. It has way to recover above its 200-DMA, which hints that some majors, including EURUSD and Cable could return below their 200-DMA as well.
Yet, even if we see rebounds in the US dollar, the medium to long term direction of the dollar will likely be the south in the coming months.
The currency markets are not like the equity markets, or the cryptocurrency markets. The valuation of one currency cannot go to the moon, forever. Therefore, it is possible we will see the EURUSD recover to 1.10 and Cable to 1.30 within the next 3 to 6 months.
Even the Japanese yen, which has been the black sheep of the year, is expected to do much better in the coming months.
Analysts at Barclays and Nomura expect the yen to rally more than 7% next year - which is not a big deal if you think that the US dollar gained up to 30% against the yen since the beginning of this year.
Vontobel sees the yen’s fair value below the 100 level against the US dollar, which, on the other hand, is a bit stretched as the dollar-yen hasn’t seen that level since 2016, and it was a short visit. The last time the dollar-yen was really below 100 is before 2013.
What’s more realistic is, we see the dollar-yen trend slowly lower. In the short-run, resistance at 140 should keep the pair within the bearish trend with the next downside target set at 130.
Strong US Data Stokes ‘Rate Fears’ and Curbs Risk Appetite
Market movers today
Today, Germany releases factory orders for October where consensus expects a stabilisation after two consecutive months of steep contraction.
The regional network survey is out from Norway. The September edition pointed to a fairly significant slowdown ahead with firms expecting profitability to deteriorate over the coming year. There has been a number of indications since that things are set to get even worse, and hence, we expect a further deterioration in the growth outlook in the Q4 survey.
Overnight, we will get trade data from China.
The 60 second overview
US ISM service: The market was taken by surprise when the US ISM service indicator unexpectedly rose in November to 56.5 from 54.4 in October. Markets had expected a drop to 53.5. Hence, despite the weaker ISM for manufacturing and the higher rates the US service sector continues to grow probably fuelled by the steady growth in US employment. In respect of details we notice that the price-paid index remained elevated at 70 despite lower oil prices in November. It suggests that inflation is entrenched and slow to dissipate. The stronger than expected ISM service report came after the strong labour market report on Friday and add pressure on Fed ahead of the important December FOMC meeting next week. That said, markets are firm in pricing 'just' 50bp hike given the 'promise' from Fed chair Powell to hike in smaller steps. But markets added to rate hike expectations in 2023.
Sour market sentiment and yields surge: The strong ISM service and the strong labour market report on Friday added to 'rate fears' in financial markets and the monetary policy sensitive 3y US treasury yield jumped 14bp during the session. 10Y yields rose 8.5bp and the curve 2s10s and 5s10s flattened further. The recent move higher in US yields fits well with our view in Yield Outlook, 29 November, where we argued for higher yields and rates on a 3M horizon after the recent drop. The 'rate fears' also weighed on especially US equity markets and global commodity markets with Brent oil down USD 5 per barrel to USD 83 per barrel. The USD also performed and EUR/USD is once again below 1.05 this morning.
Australia: The Reserve Bank of Australia hiked its cash rate by 25bp overnight. While the move was broadly expected by consensus, markets had priced in a small probability of RBA pausing already now, and AUD FX gained following the decision. RBA continues to hawkishly expect further rate hikes next year, but it did not specify the exact pace or timing. Market prices in cumulative 50 more basis points by next summer and around 40% probability of a pause in the next February meeting. Looking ahead, we think the reopening in China and the uptick in Australia's commodity export prices could provide AUD some relative support against other cyclical currencies, even if we expect AUD/USD to decline modestly amid tightening financial conditions and broad USD strength. We remain long AUD and USD vs. SEK as part of our FX Top Trades 2023, 2 December.
Equities were sharply lower on Monday. Risk-off with all sectors lower, and value cyclicals (energy, consumer discretionary, financials) underperforming. VIX rose again to 21 from 19, just like the end of all other bear market rallies in 2022. S&P -1.8%, Nasdaq -1.9%, small caps underperforming -2.8% and Dow -1.4%.
FI: European spreads tightened to German Bunds in a relatively uneventful session. The little volatility should also be seen in the light of the big central bank week awaiting markets next week. Markets are positioning for a 50bp rate hike.
FX: USD, EUR and CHF rose vis-à-vis NOK, JPY, AUD and NZD yesterday. USD found support in strong US service data, which led to a drop in EUR/USD from close to 1.06 and down below 1.05.
Credit: Credit markets followed equities into risk-off mode on Monday. Itrax main widened 1.6bp to close at 89.2bp, while Itrax X-over widened 8.1bp to close at 451.6bp. Primary market activity was also relatively muted.
Nordic macro
Sweden: The financial stability council meets at 09.00 CET to discuss the current situation with members of the government, Riksbank, FSA and the Debt Office present. At 09.30 CET Riksbank's Floden talks about financial stability and the stare of the Nordic real estate market at a Moody's conference.
Technical Outlook and Review
USD/JPY:
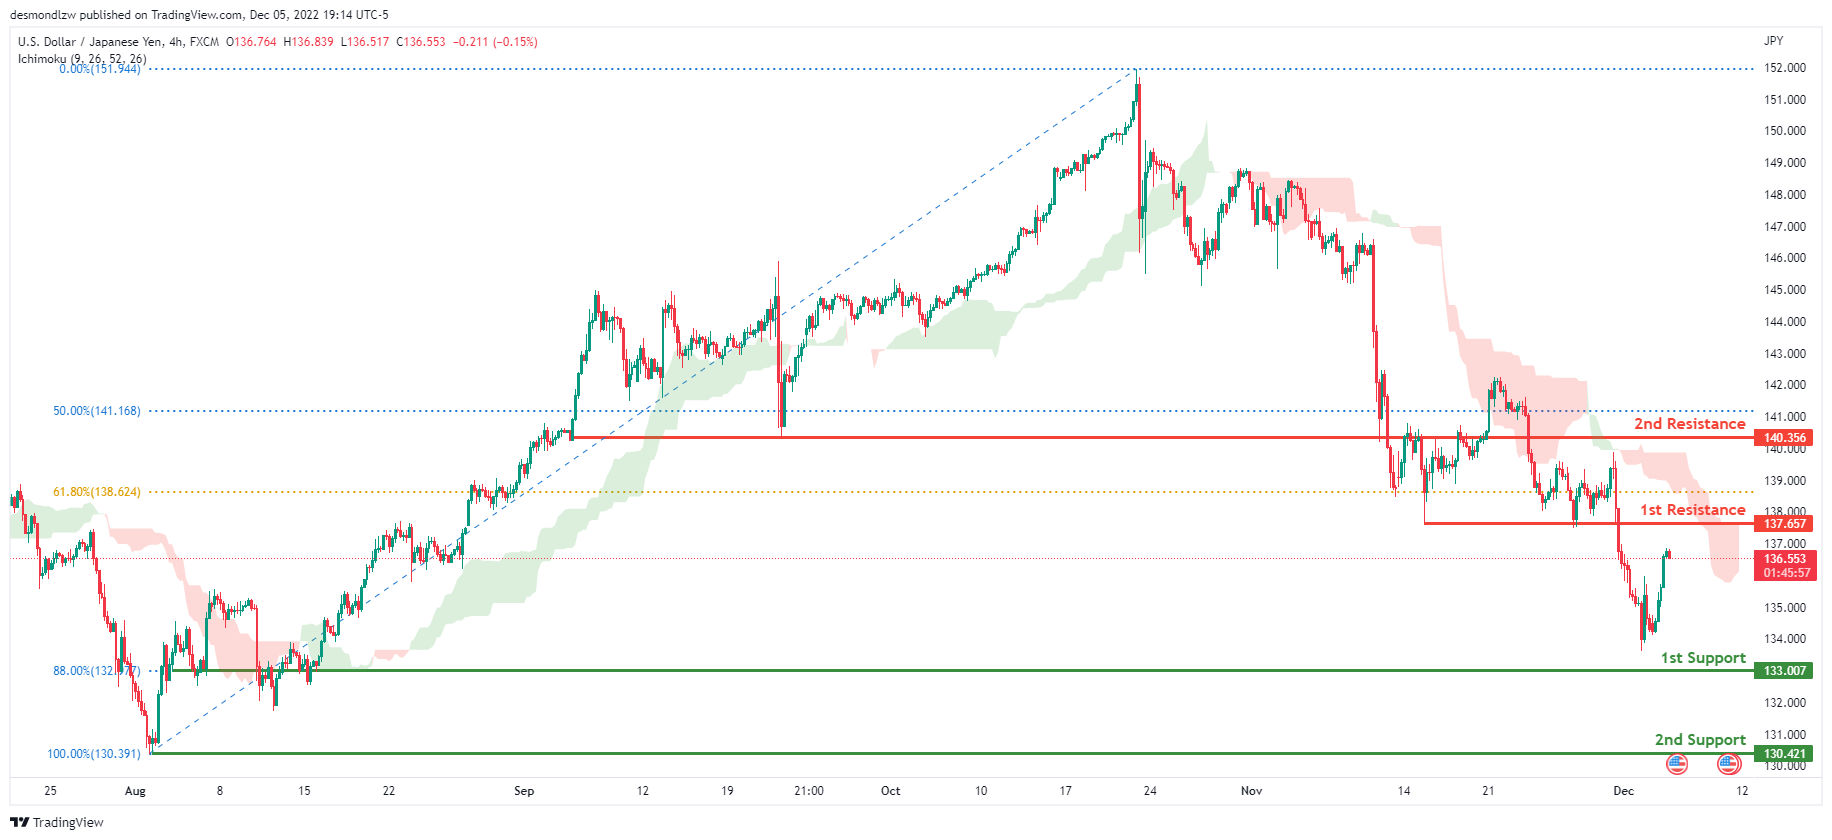
The current general bias for USDJPY on the H4 chart is bearish. To add confluence to this, the price is under the Ichimoku cloud which indicates a bearish market. If the bearish momentum continues, expect USDJPY to continue heading towards the 1st support at 133.007 where the 88% Fibonacci line is. In an alternative scenario, price could head back up to retest the 1st resistance line at 137.657, where the 61.8% Fibonacci line and previous low are located.
Areas of consideration:
- H4 time frame, 1st resistance at 137.657
- H4 time frame, 1st support at 133.007
DXY:
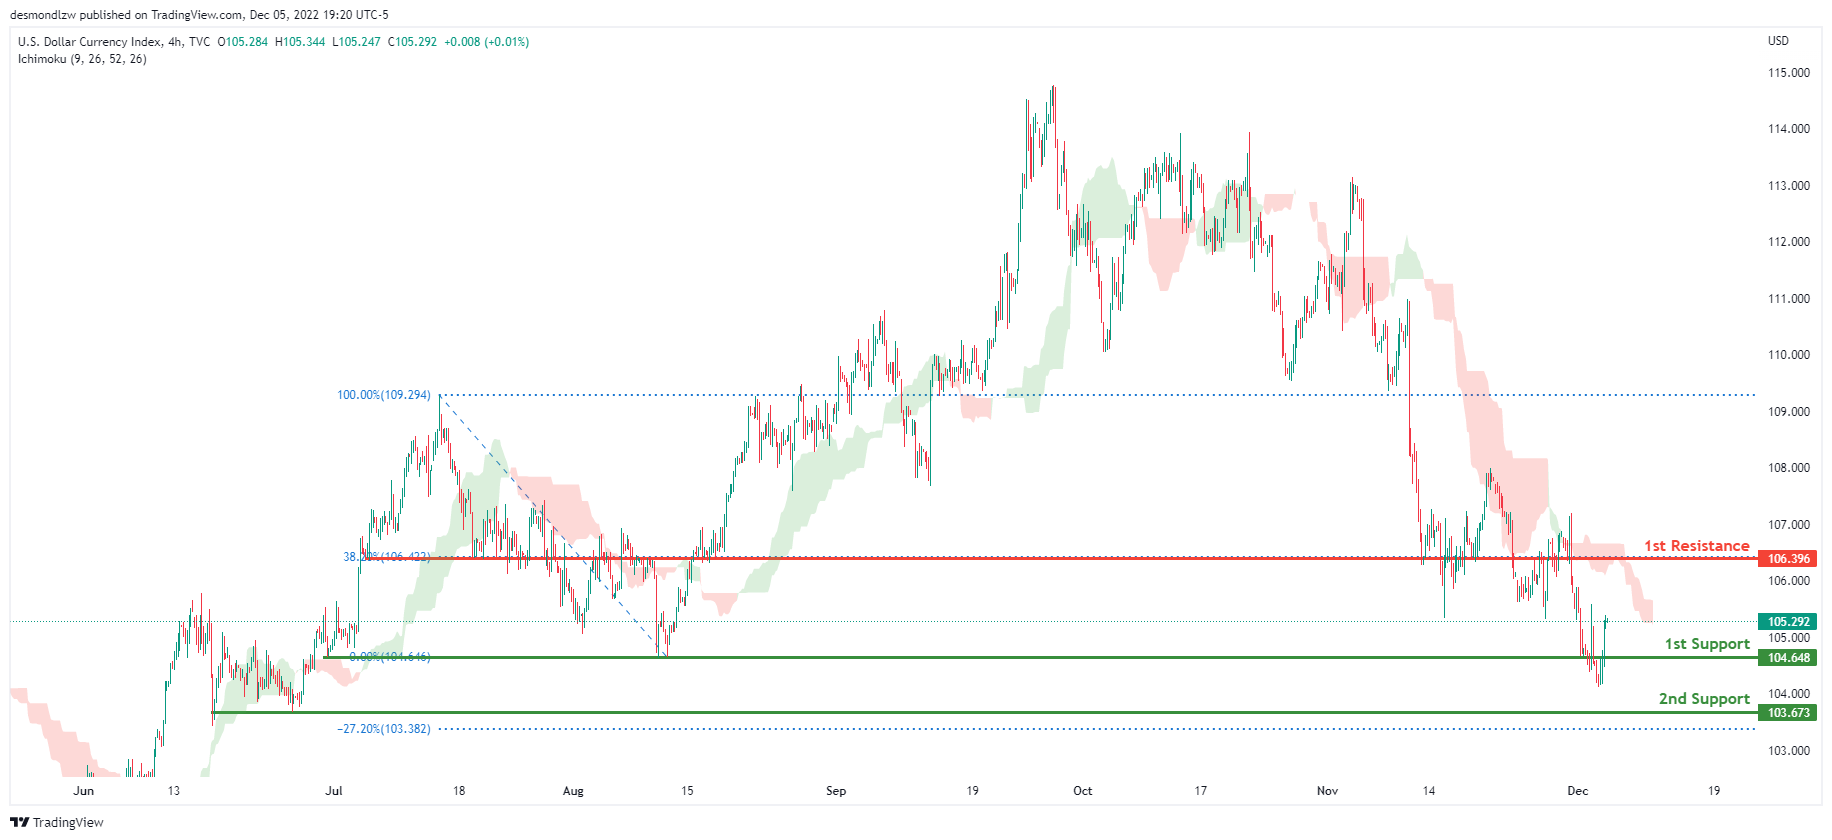
On the H4 chart, the overall bias for DXY is bearish. To add confluence to this, the price is crossing below the Ichimoku cloud which indicates a bearish market. If this bearish momentum continues, expect the price to continue heading towards the 1st support line at 104.648, where the previous swing low is. In an alternative scenario, price could head back up and retest the 1st resistance line resistance at 106.396, where the 38.2% Fibonacci line is.
Areas of consideration:
- H4 time frame, 1st resistance at 106.396
- H4 time frame, 1st support at 104.648
EUR/USD:
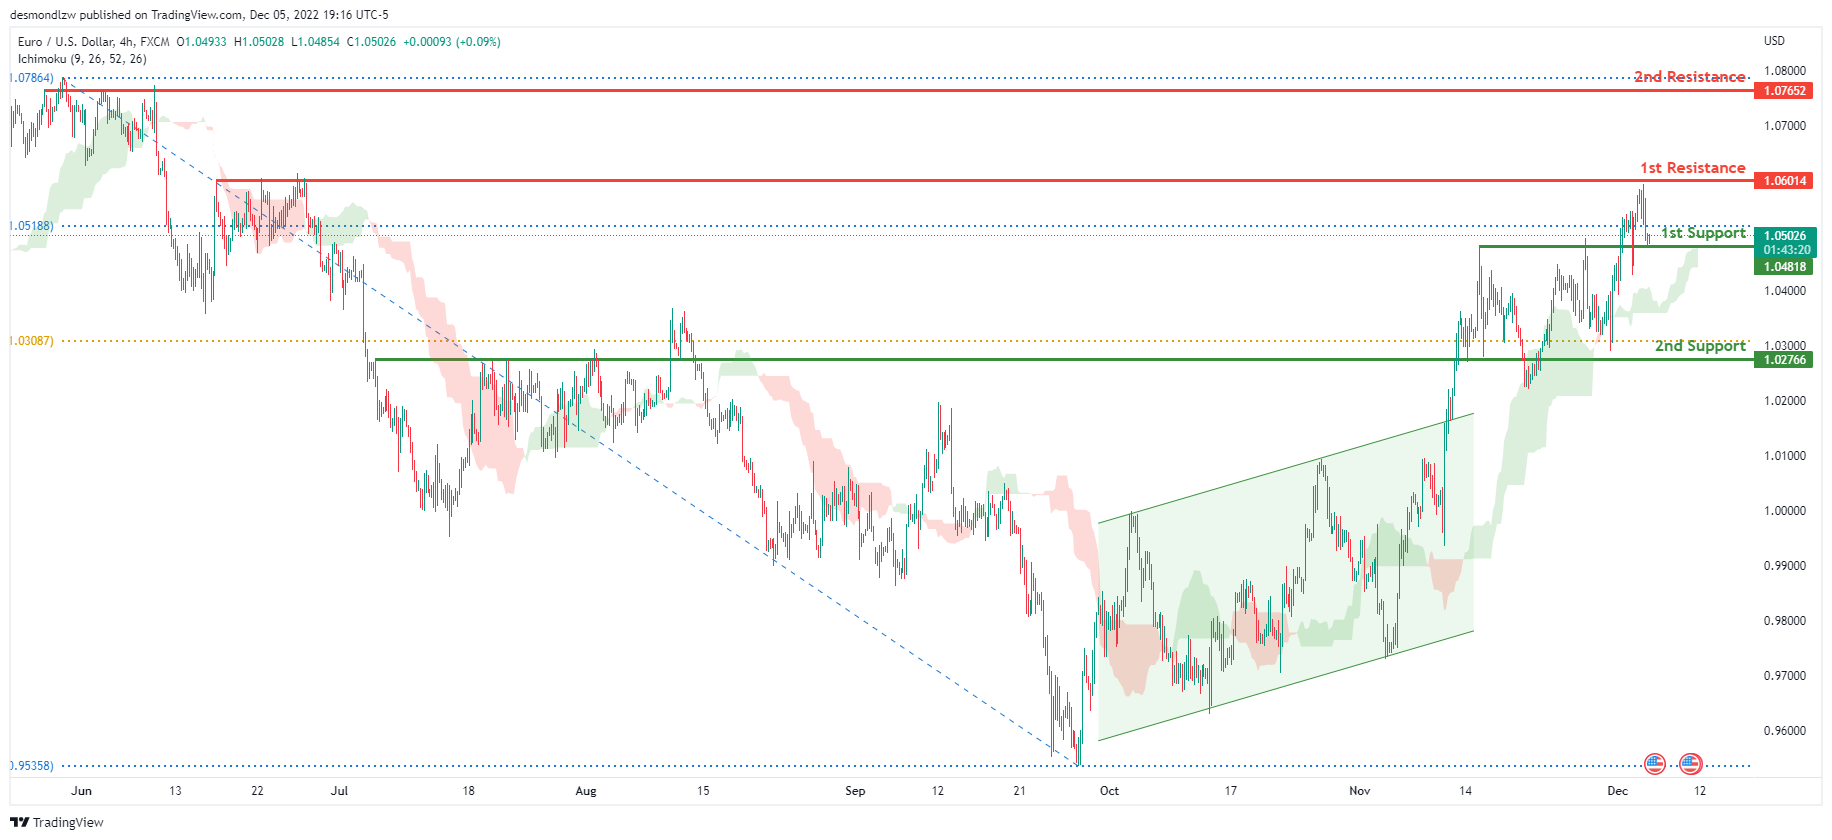
Looking at the H4 chart, my overall bias for EURUSD is bullish due to the current price being above the Ichimoku cloud, indicating a bullish market. To add confluence to this bias, price has also broken above the ascending bullish channel. If this bullish momentum continues, expect the price to possibly head towards the 1st resistance at 1.06014, where the previous swing high and 78.6% Fibonacci line are located. In an alternate scenario, price could possibly head back down to break the 1st support level at 1.04818, where the previous high and 78.6% Fibonacci line are located before heading towards the 2nd support at 1.02766 where the 61.8% Fibonacci line is.
Areas of consideration :
- H4 1st resistance at 1.06014
- H4 1st support at 1.04818
- H4 2nd support at 1.02766
GBP/USD:
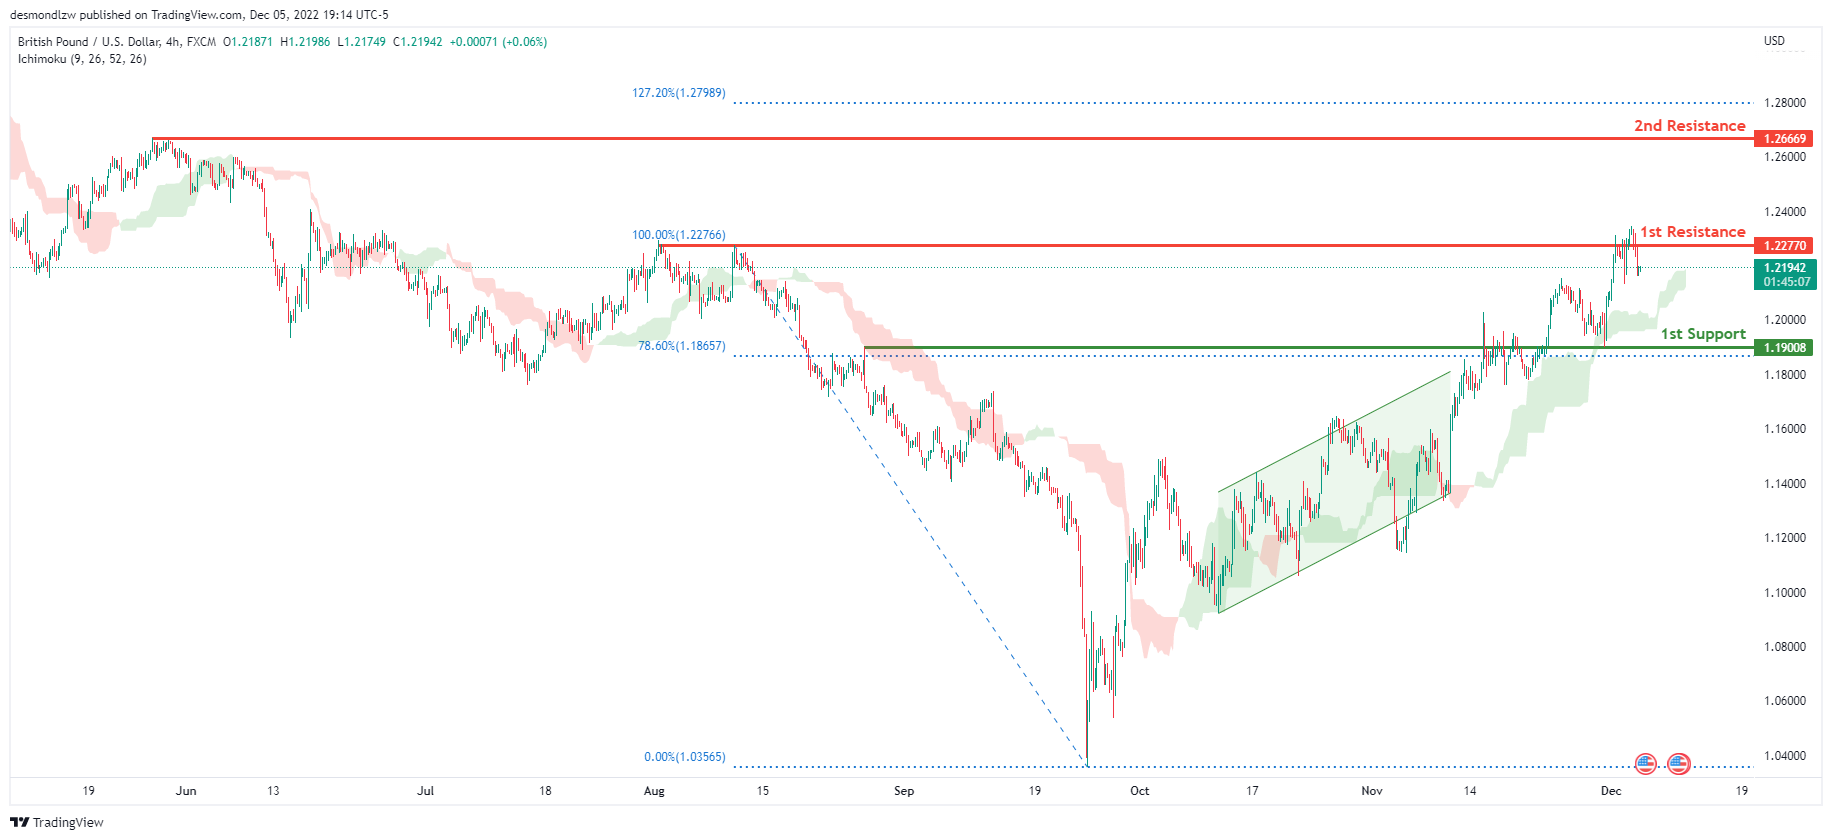
Looking at the H4 chart, my overall bias for GBPUSD is bullish due to the current price being above the Ichimoku cloud, indicating a bullish market. Expecting price to head back up to retest the 1st resistance line at 1.22770, where the previous high is. In an alternative scenario, price could possibly head back down towards the 1st support at 1.19008, where the 78.6% Fibonacci line is.
Areas of consideration:
- H4 1st resistance at 1.22770
- H4 1st support at 1.19008
USD/CHF:
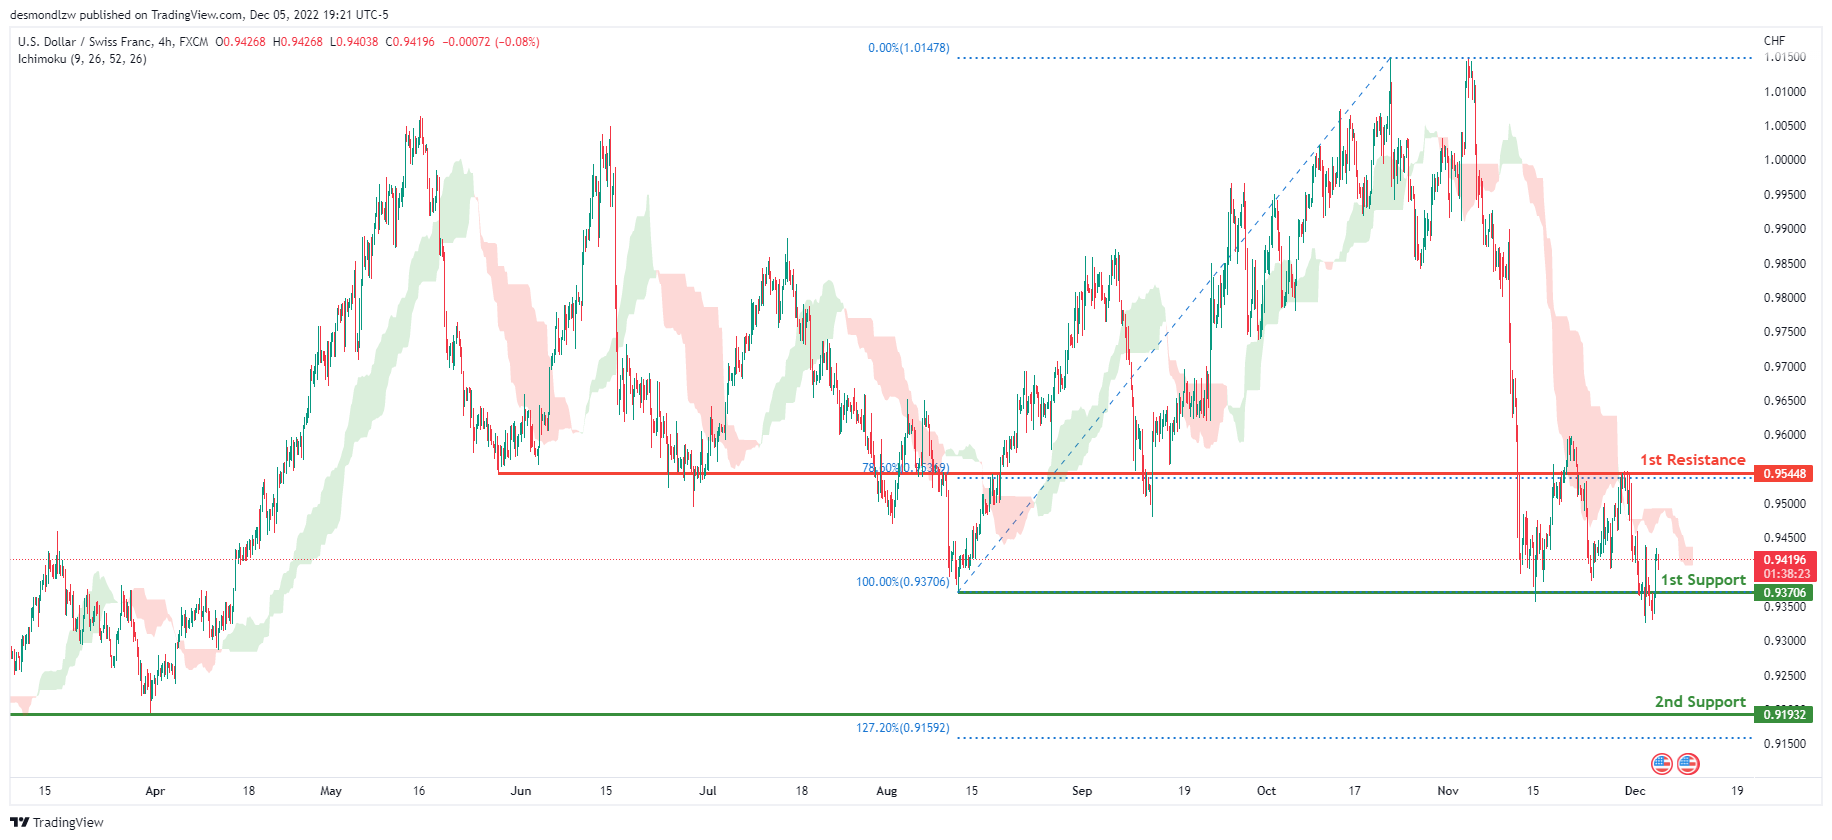
The overall bias for USDCHF on the H4 chart is bearish. In addition, the price is below the Ichimoku cloud, indicating a bearish market. If the current bearish trend continues, expect the price to head back down towards the 1st support line at 0.93706, where the previous swing low is . In an alternative scenario, price could possibly head up towards the 1st resistance at 0.95448, where the 78.6% Fibonacci line is.
Areas of consideration
- H4 1st support at 0.93706
- H4 1st resistance at 0.95448
XAU/USD (GOLD):
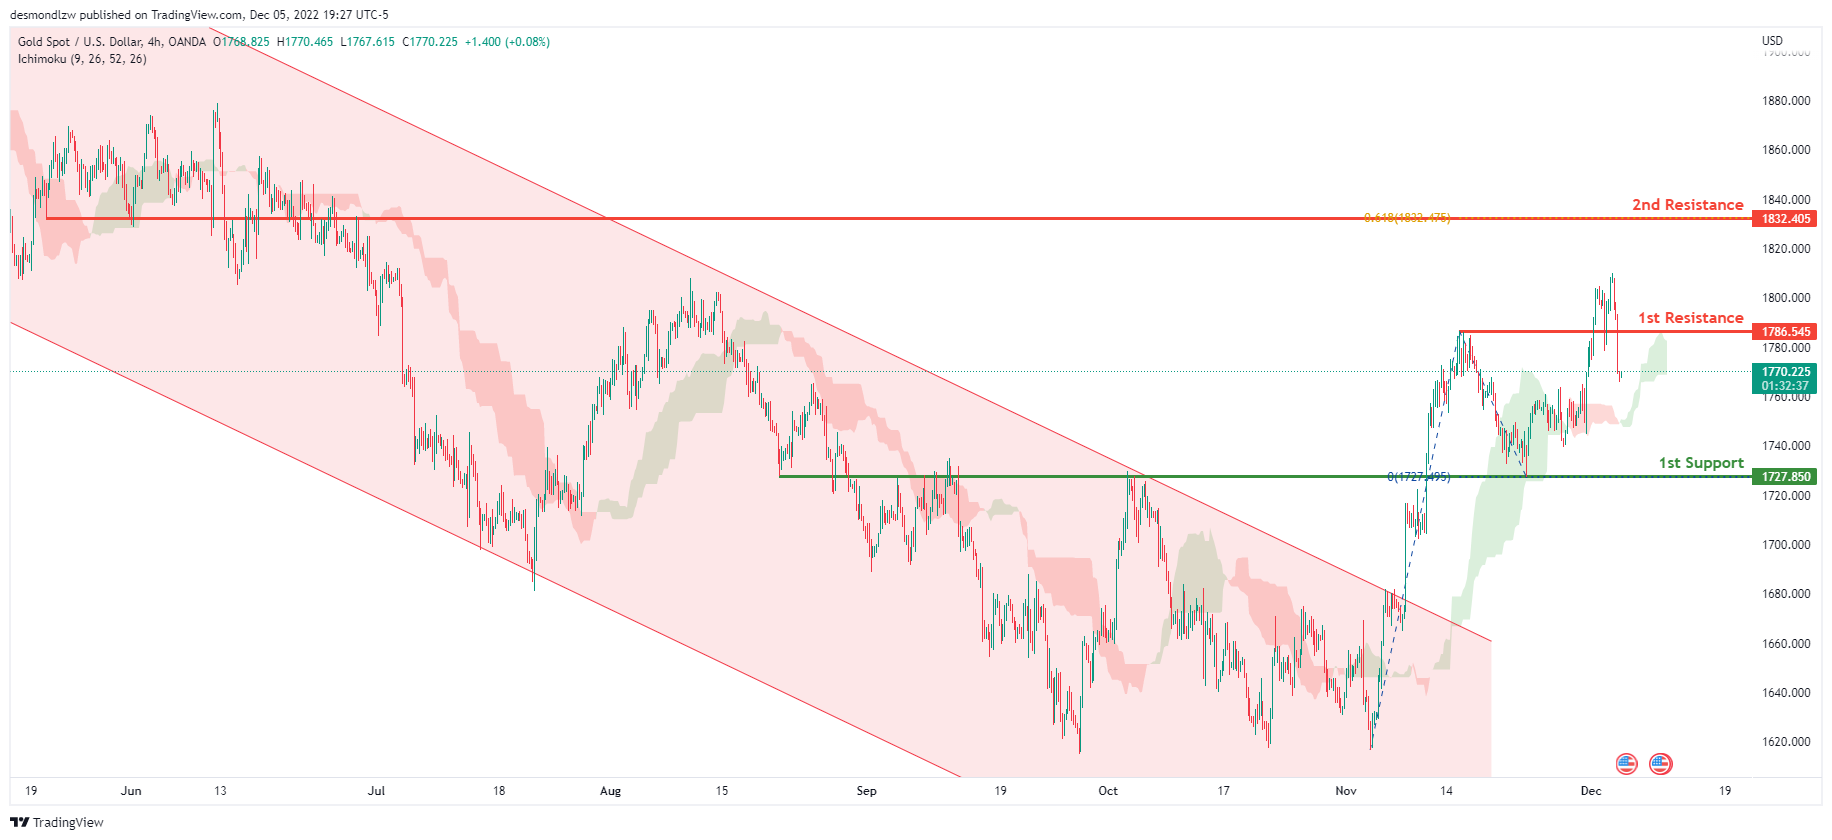
Looking at the H4 chart, my overall bias for XAUUSD is bullish due to the current price crossing above the Ichimoku cloud, indicating a bullish market. If this bullish momentum continues, expect the price to possibly continue heading towards the 1st resistance at 1786.545, where the previous swing high is located. In an alternate scenario, price could possibly head back down towards the 1st support level at 1727.850, where the previous swing low is located.
Areas of consideration:
- H4 time frame, 1st resistance at 1786.545
- H4 time frame, 1st support at 1727.850
AUD/USD:
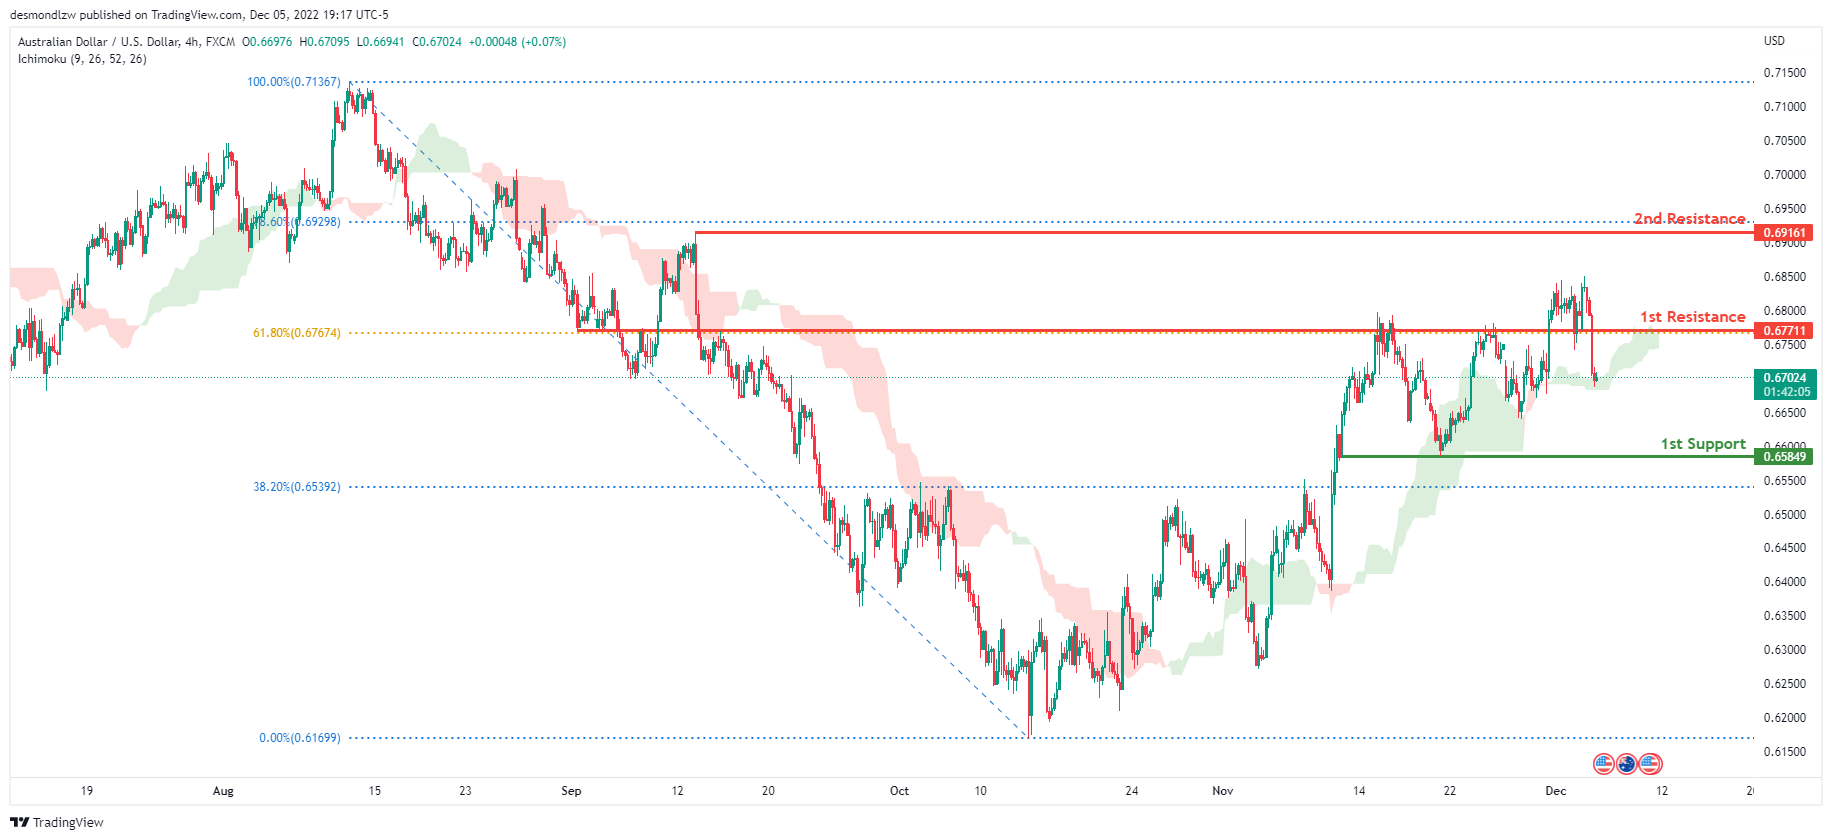
Looking at the H4 chart, my overall bias for AUDUSD is bearish due to the current price crossing below the Ichimoku cloud, indicating a bearish market. If this bearish momentum continues, expect price to head towards the 1st support at 0.65849, where the 38.2% Fibonacci line and previous swing low is. In an alternative scenario, price could possibly head back up to retest the 1st resistance line at 0.67711, where the 61.8% Fibonacci line is.
Areas of consideration
- H4, 1st resistance at 0.67711
- H4, 1st support at 0.65849
NZD/USD:
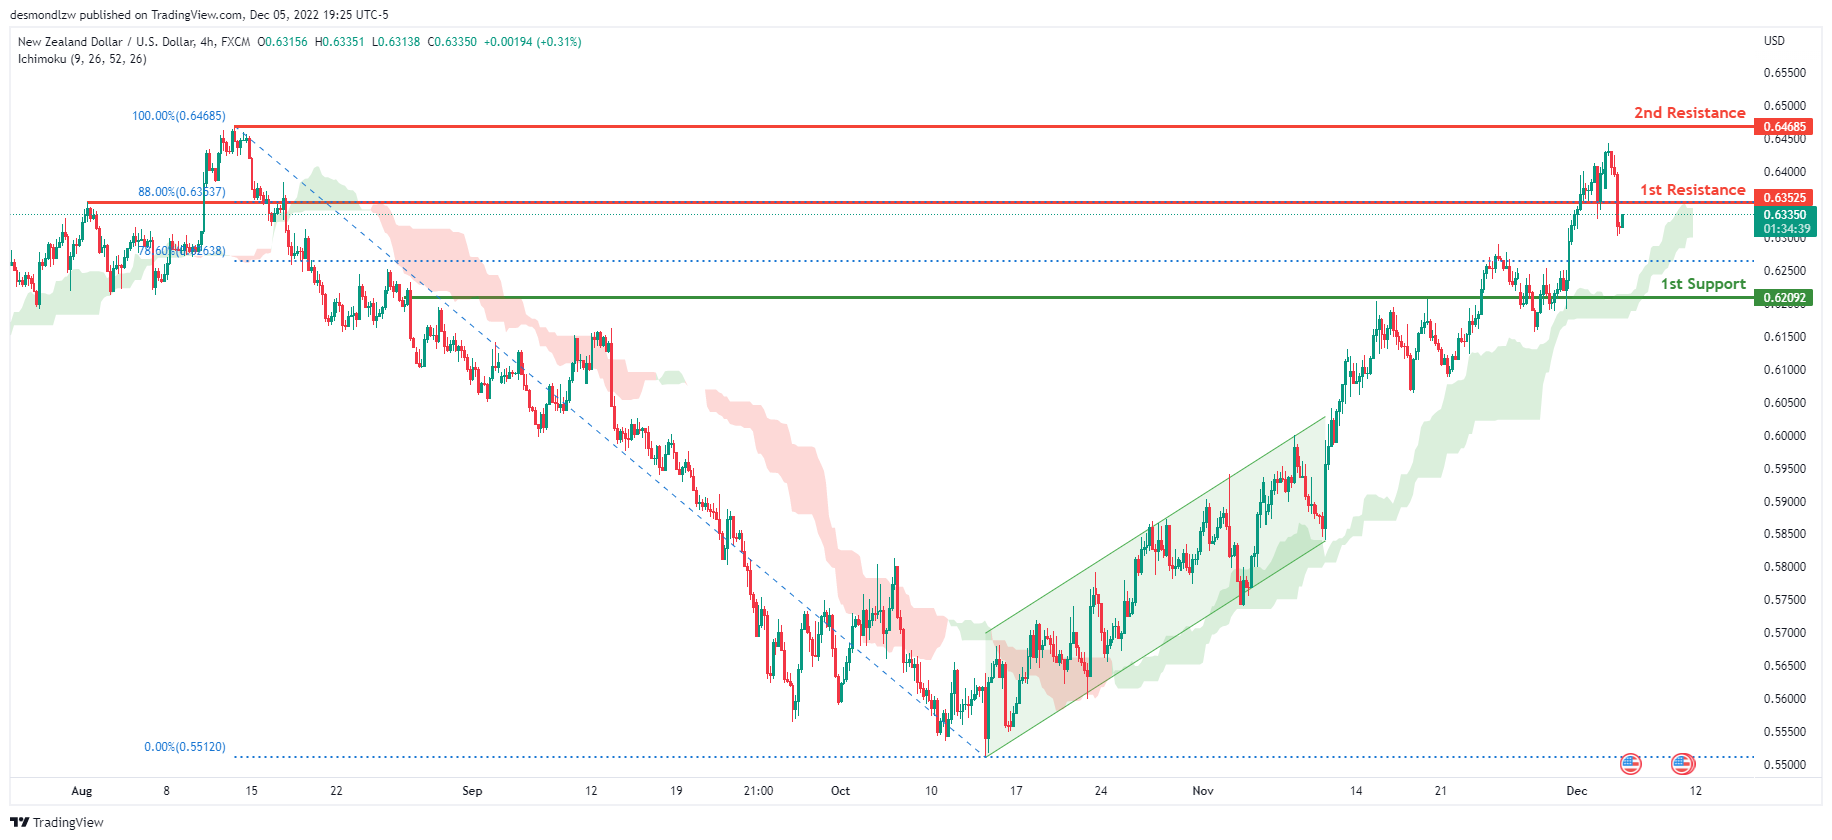
Looking at the H4 chart, my overall bias for NZDUSD is bullish due to the current price being above the Ichimoku cloud, indicating a bullish market.
To add confluence to this bias, price has broken out of the ascending channel. If this bullish momentum continues, expect the price to head back up to retest the 1st resistance line at 0.63525, where the 88% Fibonacci line is. Alternatively, the price may head back down towards the 1st support at 0.62092, where the previous high and 78.6% Fibonacci line are.
Areas of consideration:
- H4 time frame, 1st resistance at 0.63525
- H4 time frame, 1st support at 0.62092
USD/CAD:
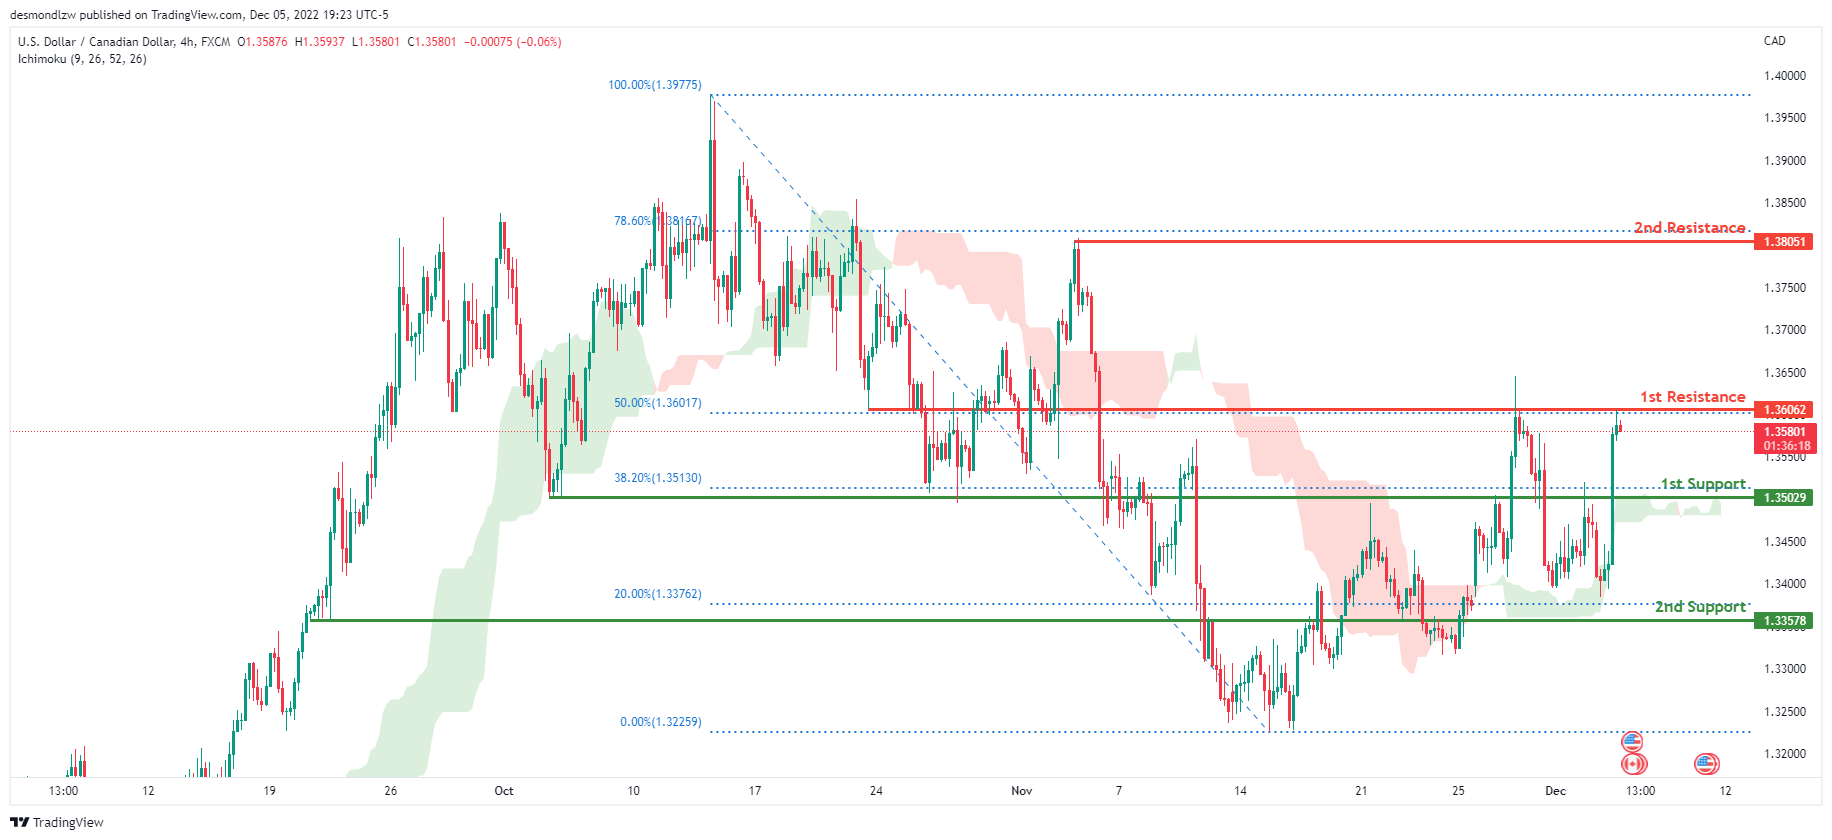
On the H4 chart, the overall bias for USDCAD is bullish. To add confluence to this, the price is above the Ichimoku cloud which indicates a bullish market. If this bullish momentum continues, expect the price to break the 1st resistance line at 1.36062 where the 50% Fibonacci line is before heading towards the 2nd resistance at 1.38051, where the previous swing high is. In an alternative scenario, price could head back down to retest the 1st support at 1.35029, where the 38.2% Fibonacci line is.
Areas of consideration:
- H4 time frame, 1st resistance at 1.36062
- H4 time frame, 2nd resistance at 1.38051
- H4 time frame, 1st support at 1.35029
OIL:
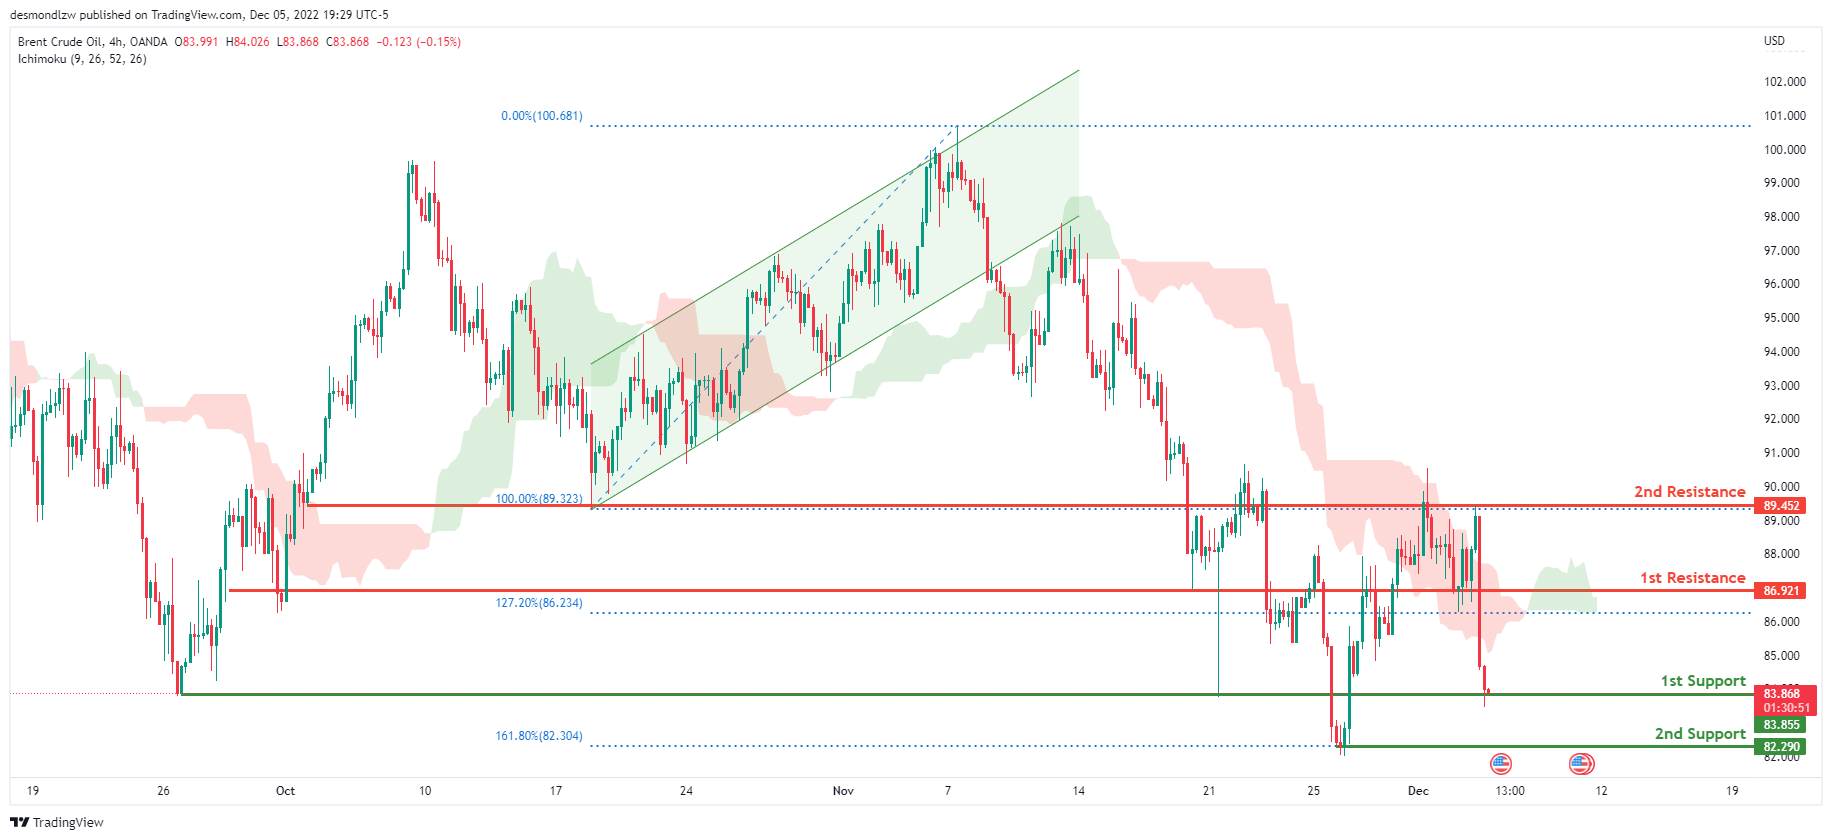
Looking at the H4 chart, my overall bias for BCOUSD is bearish due to the current price being below the Ichimoku cloud, indicating a bearish market. If this bearish momentum continues, expect price to possibly break the 1st support at 83.855, where the previous swing low is before heading towards the 2nd support at 82.290, where the previous swing low and 161.8% Fibonacci expansion line are. In an alternate scenario, price could possibly head up towards the 1st resistance line at 86.921, where the 127.2% Fibonacci extension line is located.
Areas of consideration:
- H4 time frame, 1st resistance at 86.921
- H4 time frame, 1st support at 83.855
- H4 time frame, 2nd support at 82.290
Dow Jones Industrial Average:
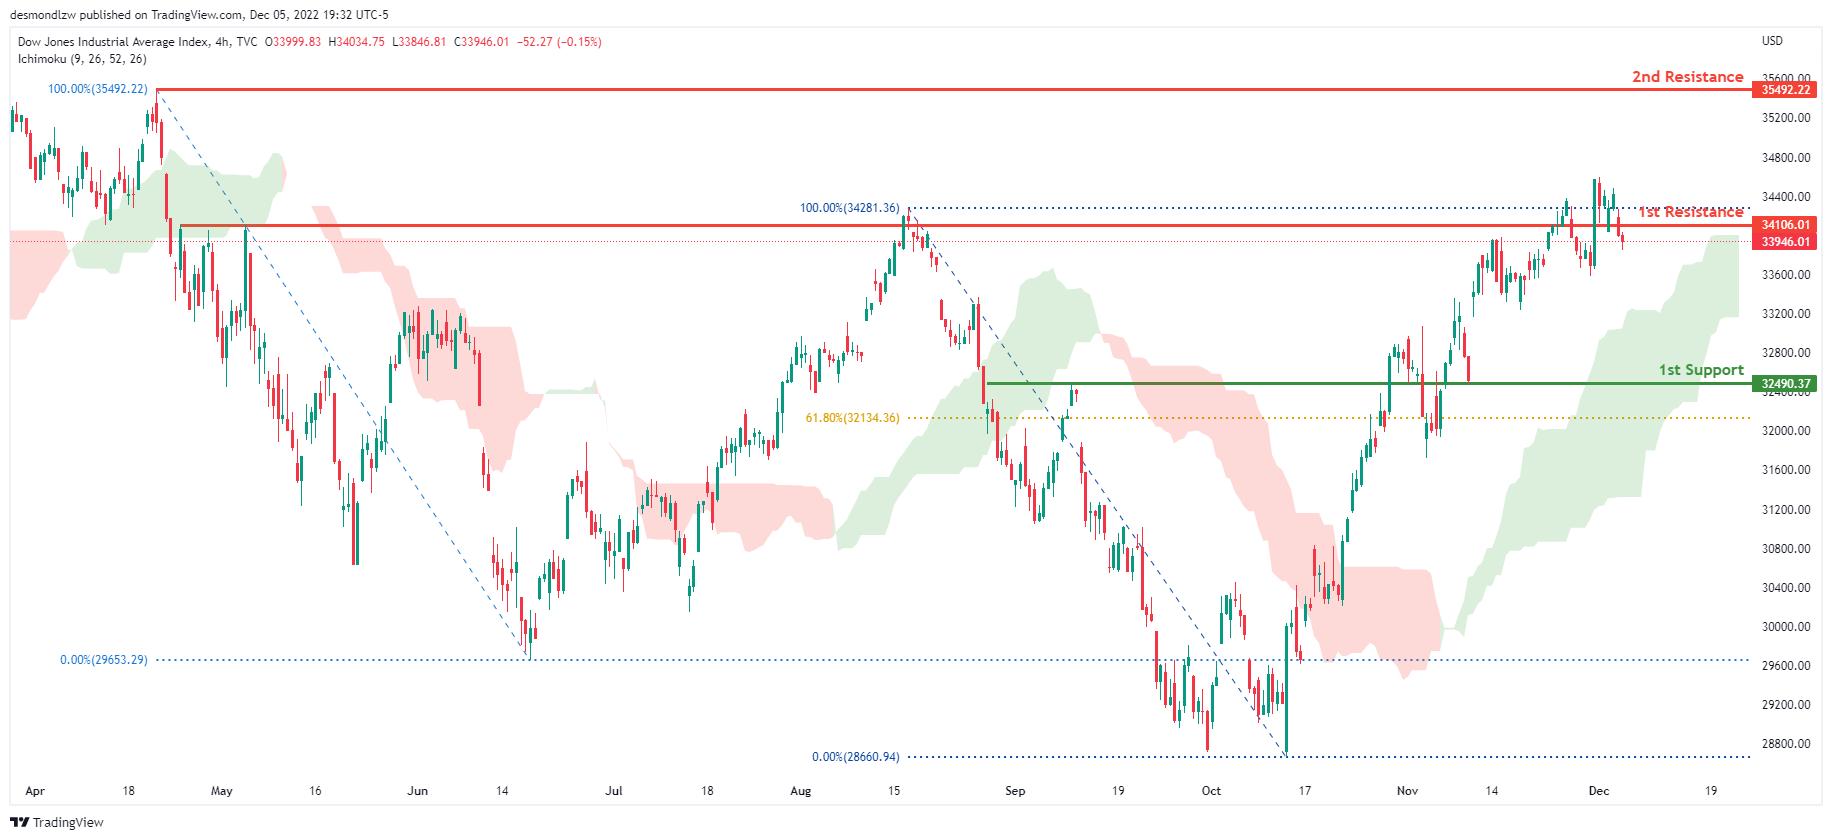
On the H4 chart, the overall bias for DJI is bullish. To add confluence to this, the price is above the Ichimoku cloud which indicates a bullish market. If this bullish momentum continues, expect the price to continue heading towards the 1st resistance line at 34106.01, where the previous swing high is. In an alternative scenario, price could head back down towards the 1st support at 32490.37, where the 61.8% Fibonacci line is.
Areas of consideration:
- H4 time frame, 1st support at 32490.37
- H4 time frame, 1st Resistance at 34106.01
DAX:
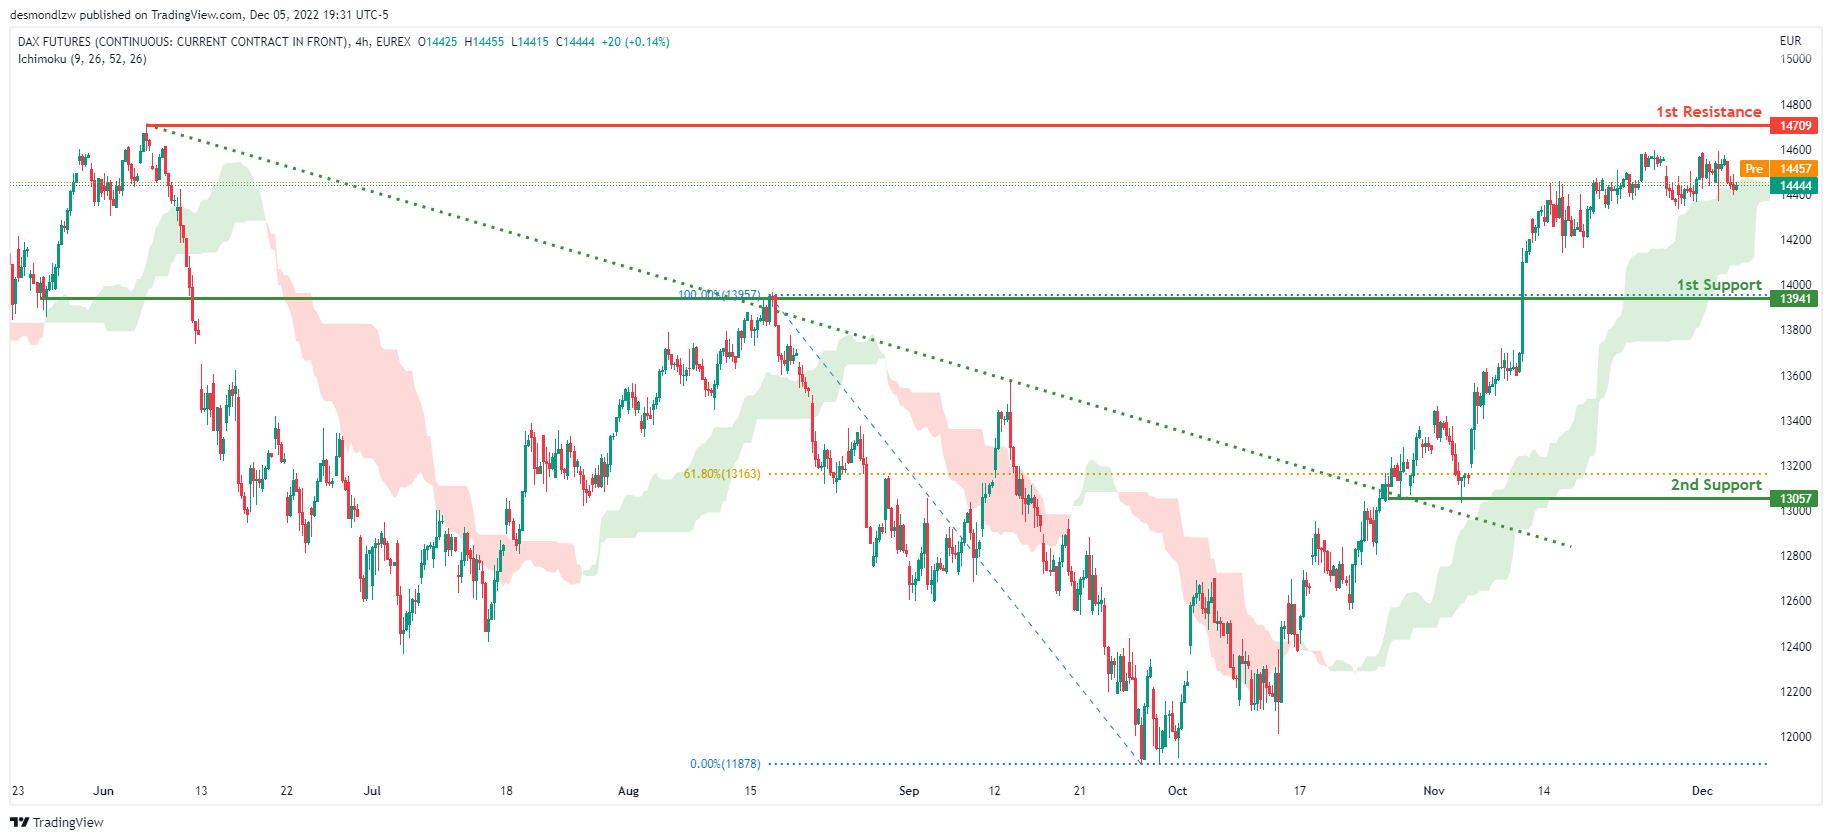
The H4 chart shows a bullish bias, with price breaking through the descending trendline and rising above the Ichimoku cloud. Price is expected to maintain its bullish momentum and rise to the first resistance level at 14709, where the previous swing high is located. Alternatively, the price could fall to the first support level at 13941, where the previous swing high was.
Areas of consideration:
- H4 time frame, 1st resistance is at 14709
- H4 time frame, 1st support is at 13941
ETHUSD:
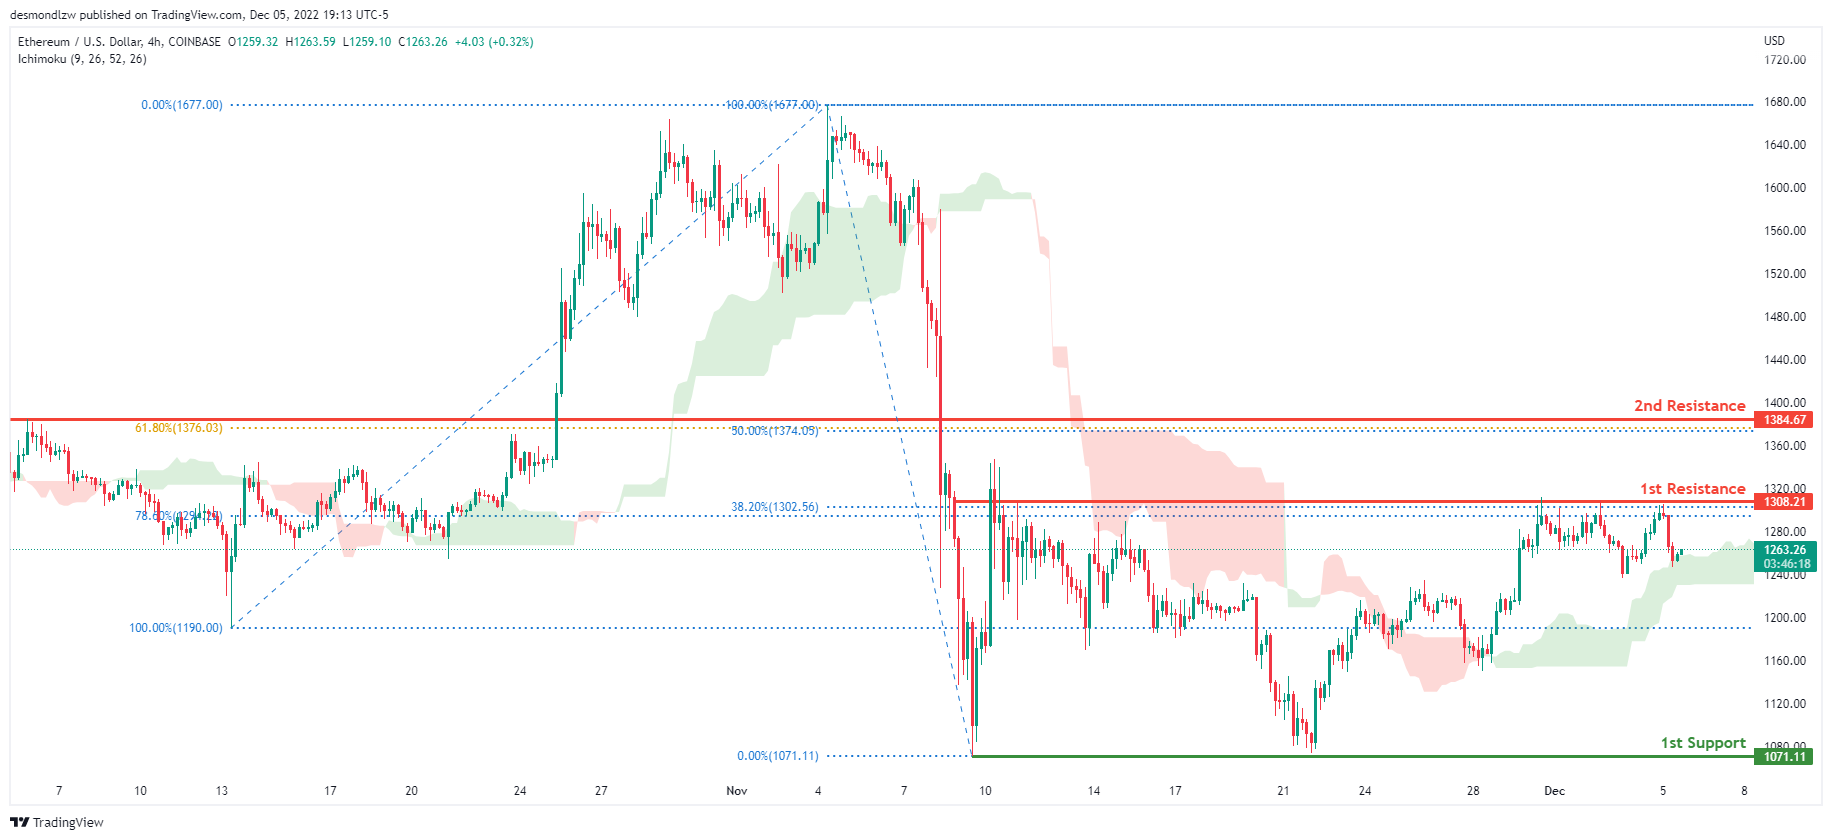
On the H4 chart, the overall bias for ETHUSD is bearish. However, the price is now above the Ichimoku cloud which might indicate a short-term shift to a bullish market. Expecting price to possibly break the 1st resistance at 1308.21, where the 38.2% and 78.6% Fibonacci lines are before heading towards the 2nd resistance line at 1384.67, where the 50% and 61.8% Fibonacci lines are. In an alternative scenario, price could possibly head back down towards the 1st support at 1071.11, where the previous swing low is.
Areas of consideration:
- H4 time frame, 1st resistance of 1308.21
- H4 time frame, 2nd resistance of 1384.67
- H4 time frame, 1st support at 1071.11
BTCUSD:
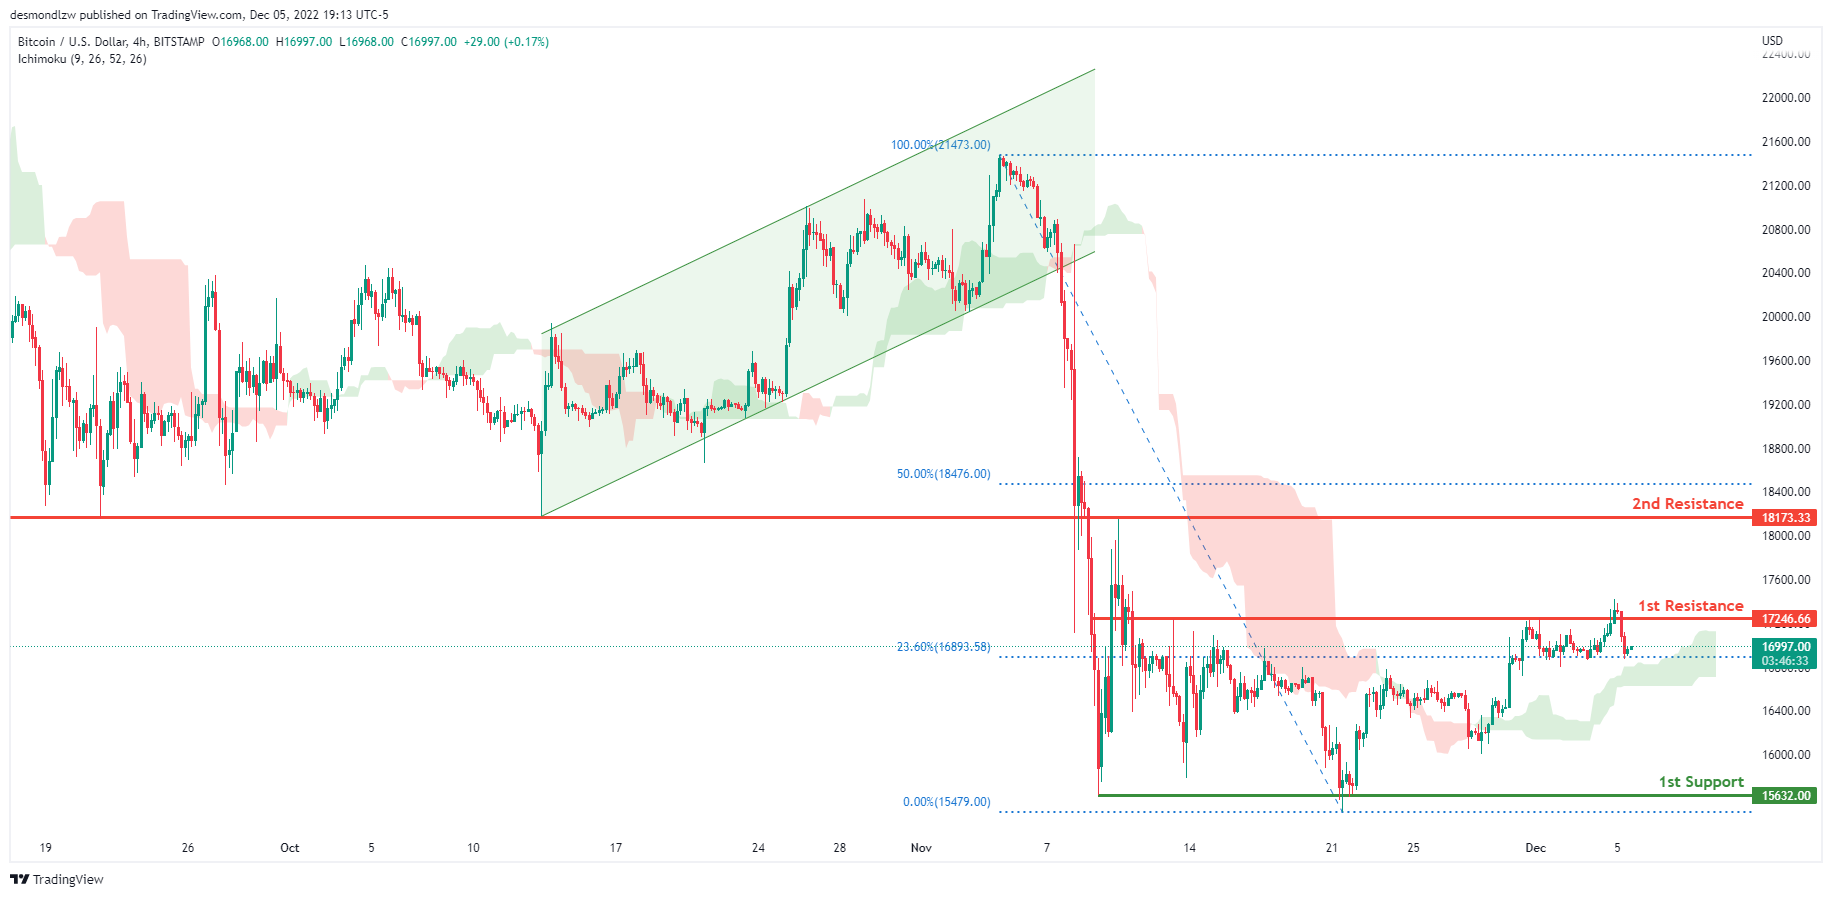
On the H4 chart, the overall bias for BTCUSD is bearish. However, the price is now above the Ichimoku cloud which might indicate a short-term shift to a bullish market. Expecting price to possibly break the 1st resistance at 17246.66, where the 23.6% Fibonacci line is before heading towards the 2nd resistance line at 18173.33, where the previous swing low is and 50% Fibonacci line are. In an alternative scenario, price could possibly head back down towards the 1st support at 15632.00, where the previous swing low is.
Areas of consideration:
- H4 time frame, 1st resistance 17246.66
- H4 time frame, 2nd resistance 18173.33
- H4 time frame, 1st support at 15632.00
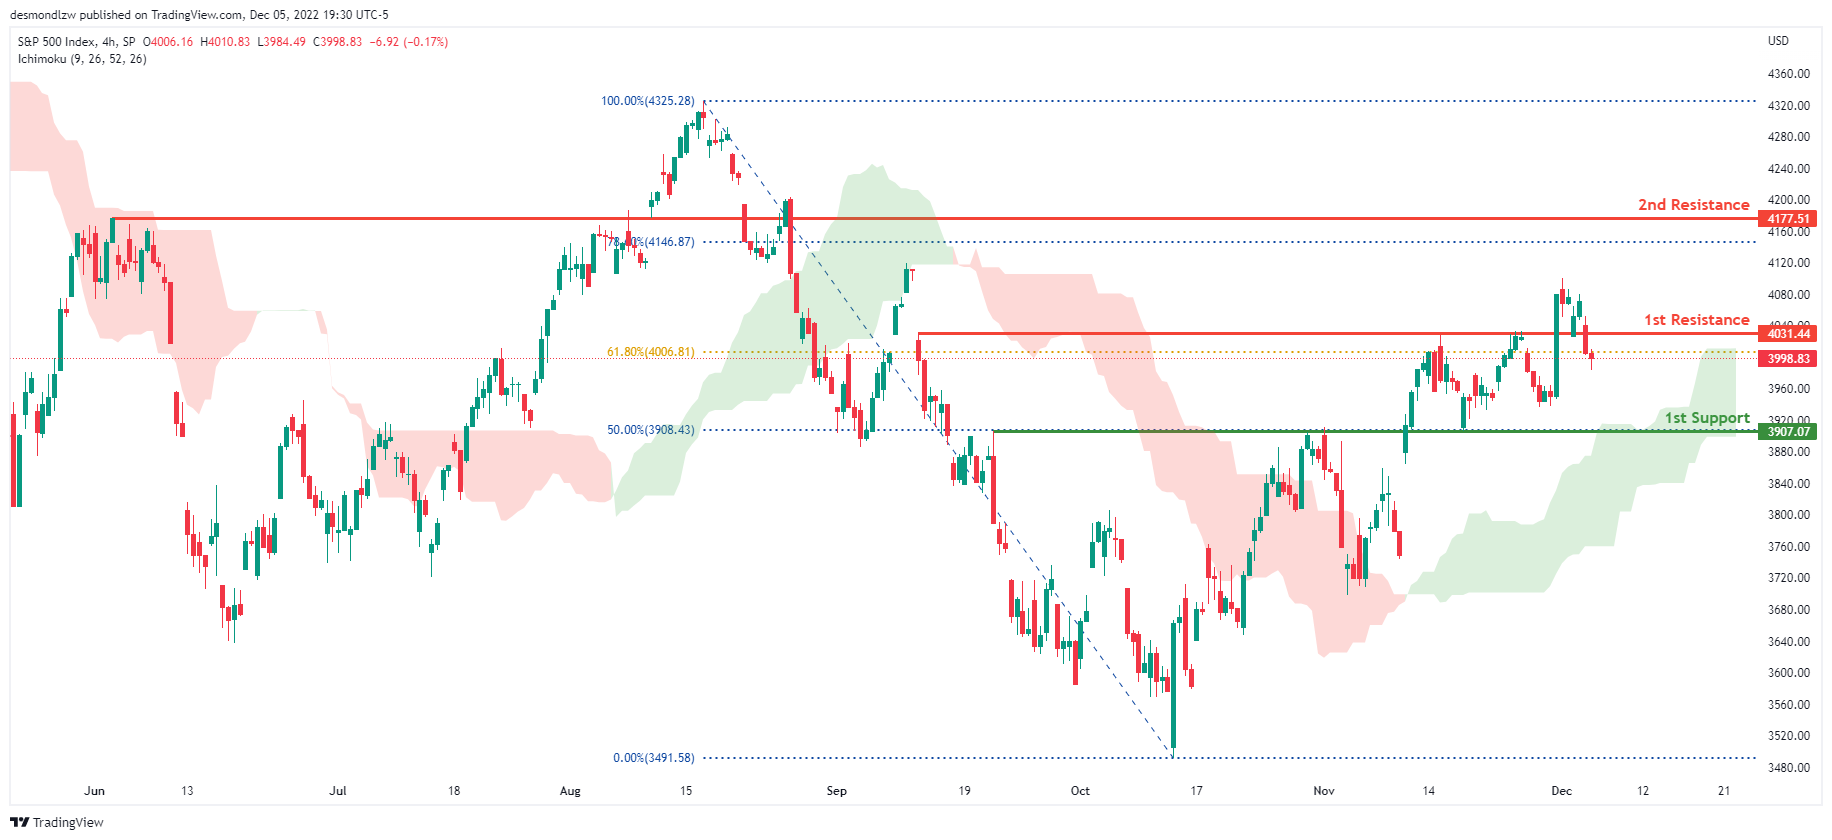
S&P 500:
The overall bias for the S&500 on the H4 chart is bullish, with prices above the Ichimoku cloud. If the bullish momentum continues, the expected price to head towards the 1st resistance line is at 4031.44, where the 61.8% Fibonacci line is located. In an alternate scenario, price could return to the 1st support line at 3907.07, where the 50% Fibonacci line is located.
Areas of consideration:
- H4 time frame, 1st support at 3907.07
- H4 time frame, 1st resistance at 4031.44
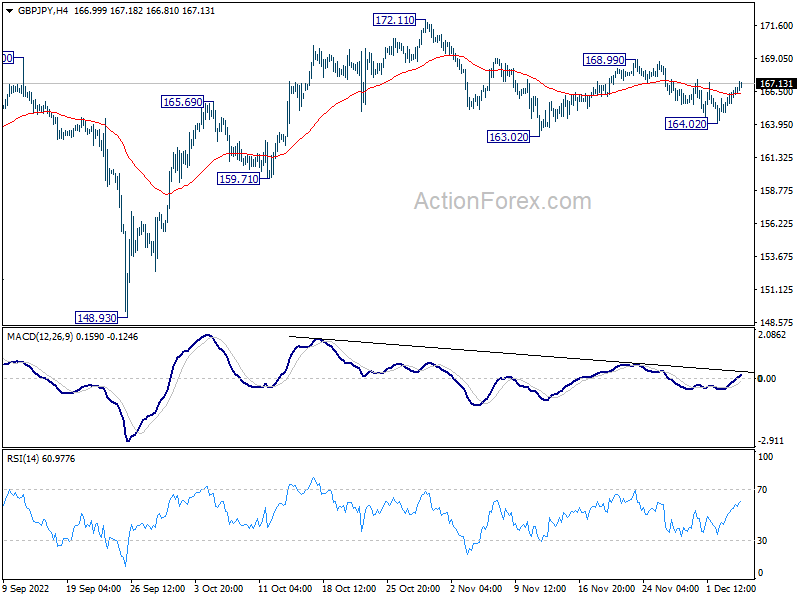
GBP/JPY Daily Outlook
Daily Pivots: (S1) 165.52; (P) 166.16; (R1) 167.42; More...
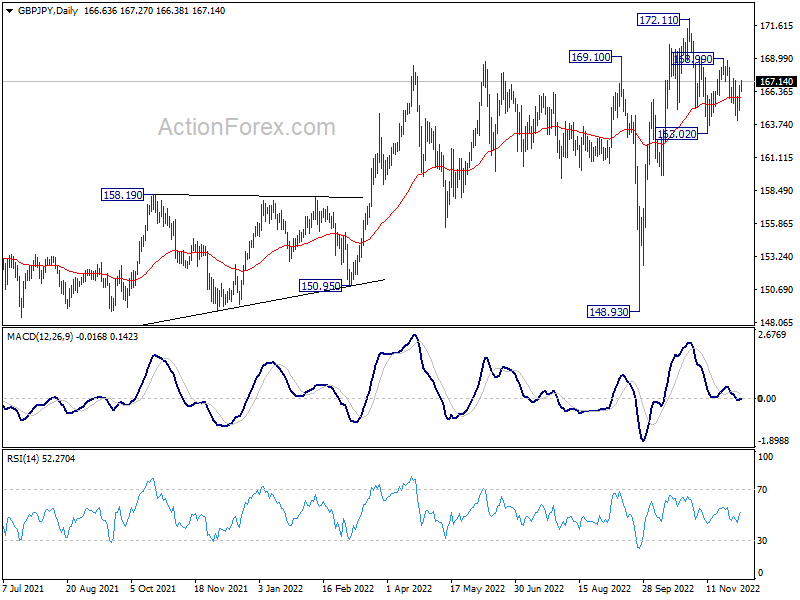
Intraday bias in GBP/JPY remains neutral for the moment. On the downside, break of 164.02 should resume the whole fall from 172.11 through 163.02 support. Nevertheless, on the upside, break of 168.99 resistance will bring stronger rebound to retest 172.11 high instead.
In the bigger picture, medium term upside momentum has been diminishing as seen in bearish divergence condition in weekly MACD. Sustained break of 55 week EMA (now at 160.66) will argue that it's already correcting whole up trend from 123.94 (2020 low). Nevertheless, before that, such up trend could still extend through 172.11 high.
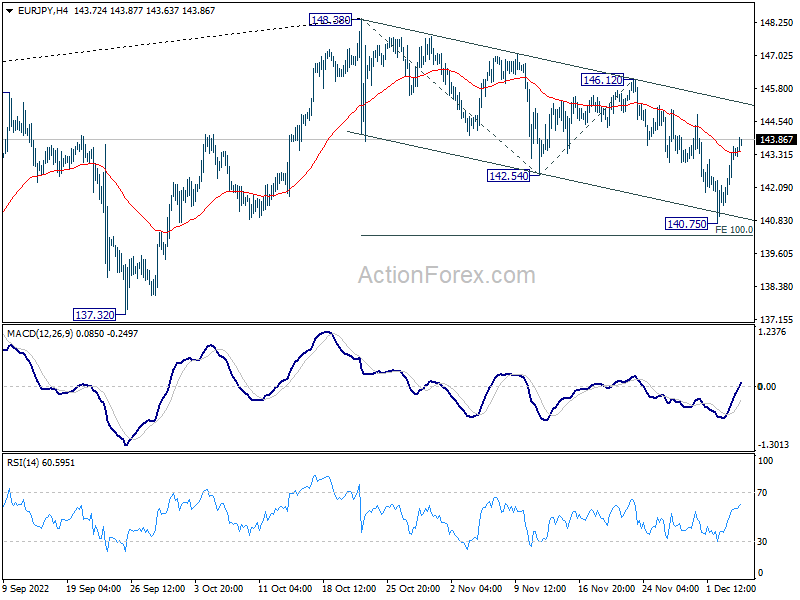
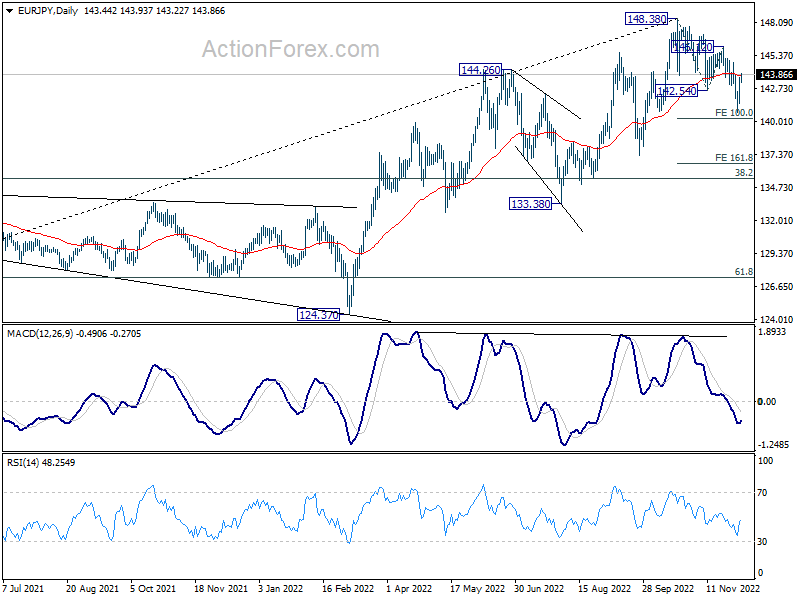
EUR/JPY Daily Outlook
Daily Pivots: (S1) 142.18; (P) 142.90; (R1) 144.25; More....
Intraday bias in EUR/JPY remains neutral for the moment. Further decline could be seen as long as 146.12 resistance holds. Break of 140.75 will resume the fall from 148.38 to 100% projection of 148.38 to 142.54 from 146.12 at 140.28. Firm break there could prompt downside acceleration to 161.8% projection at 136.67 next.
In the bigger picture, considering bearish divergence condition in weekly MACD, 148.38 could be a medium term top already. Fall from there is probably correcting whole up trend from 114.42 (2020 low). Deeper decline would be seen to 55 week EMA (now at 137.37), or further to 38.2% retracement of 114.42 to 148.38 at 135.40 before completion.
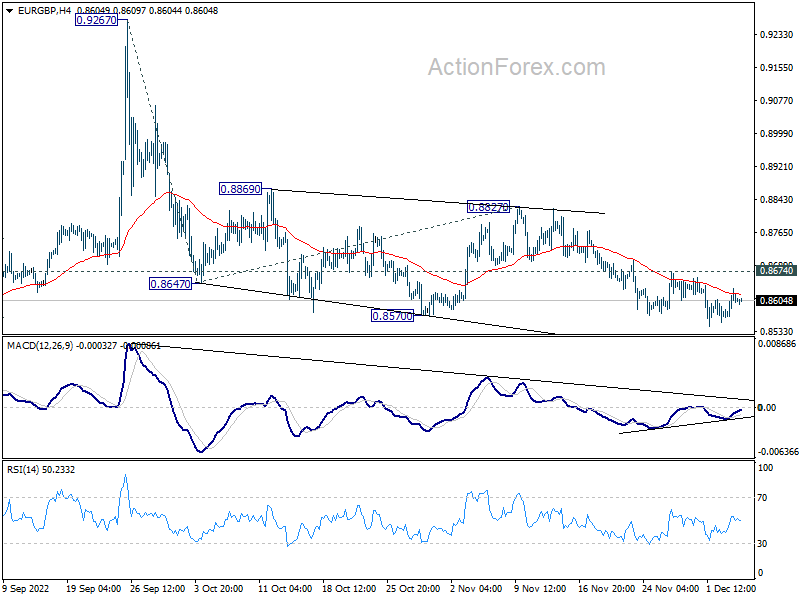
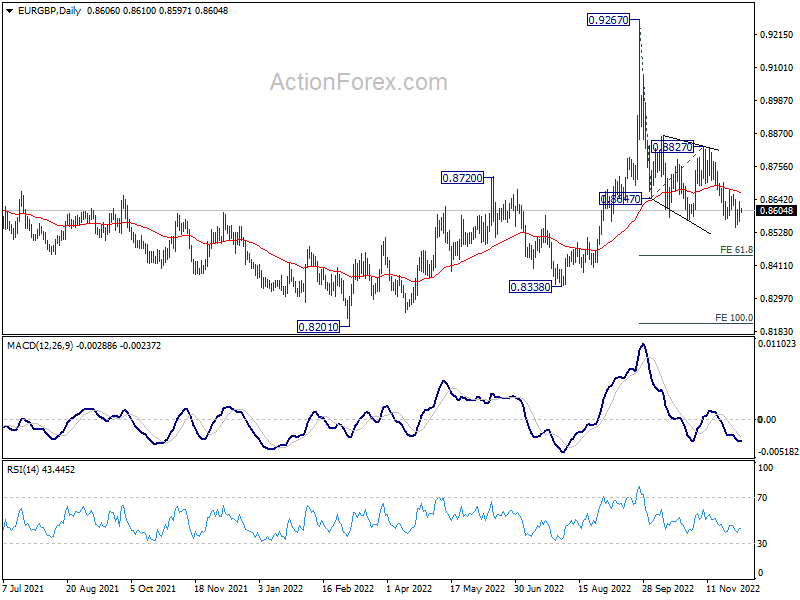
EUR/GBP Daily Outlook
Daily Pivots: (S1) 0.8570; (P) 0.8603; (R1) 0.8638; More...
EUR/GBP is losing some downside momentum but further decline is still in favor with 0.8674 resistance intact. Current fall from 0.9267 should target 61.8% projection of 0.9267 to 0.8647 from 0.8827 at 0.8444 next. On the upside, above 0.8674 minor resistance will indicate short term bottoming, and bring stronger rebound back to 0.8827 instead.
In the bigger picture, current development suggests that fall from 0.9267 is a down leg inside long term range pattern. Deeper fall could be seen towards 0.8201/8338 support zone. But strong support should be seen there to bring reversal. Nevertheless, firm break of 0.8827 resistance will turn favor to the case that such decline is merely a correction in the up trend from 0.8201. That is, further rally would be seen at a later stage through 0.9267.
EUR/AUD Daily Outlook
Daily Pivots: (S1) 1.5511; (P) 1.5595; (R1) 1.5751; More...
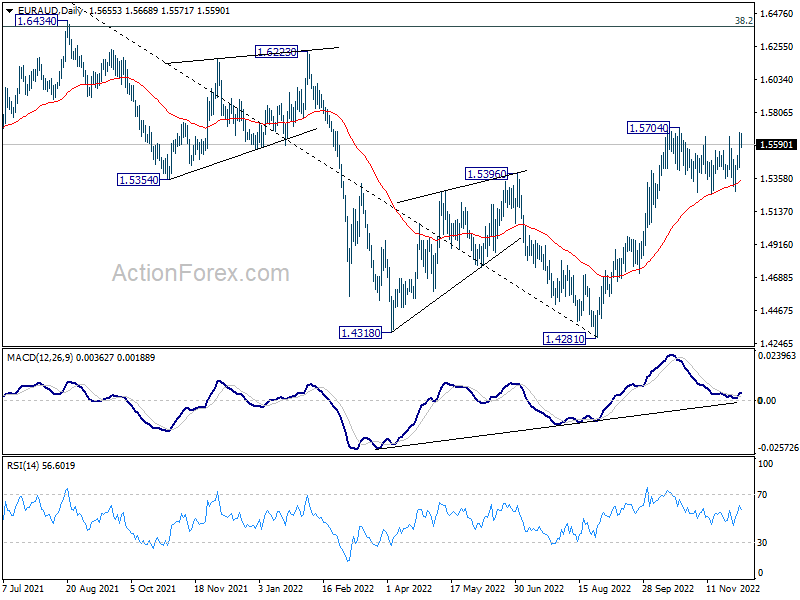
No change in EUR/AUD's outlook as it's still bounded in sideway consolidation from 1.5704 and intraday bias remains neutral. In case of another fall, downside should be contained by 55 day EMA (now at 1.5332) to bring rebound. On the upside, decisive break of 1.5704 will resume larger rise from 1.4281. However, sustained trading below 55 day EMA will bring deeper correction towards 1.4965 resistance turned support.
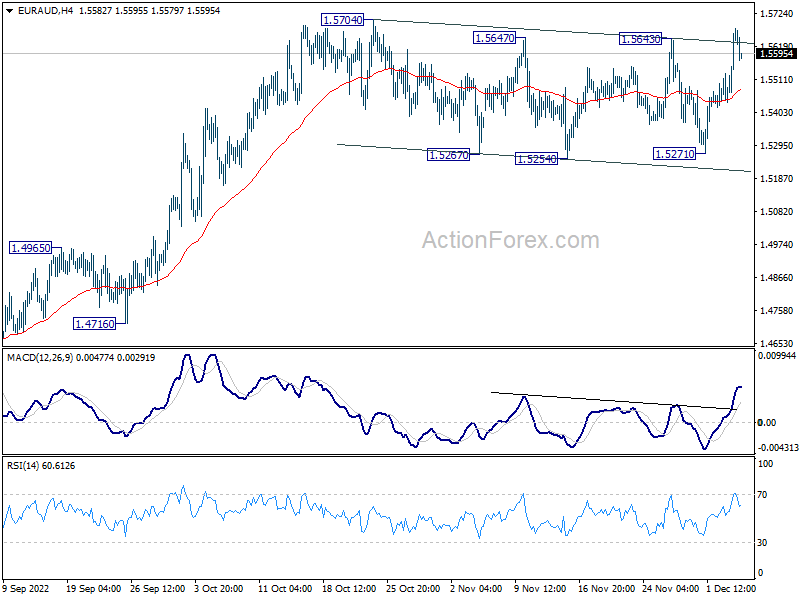
In the bigger picture, a medium term bottom should be in place at 1.4281, on bullish convergence condition in daily MACD. Further rise would be seen back to 1.6434 key resistance next. Break of 1.4965 resistance turned support is needed to indicate reversal. Otherwise, further rally will remain in favor.