Sample Category Title
USDCAD Curbs Exponential Growth; Support at 1.3600
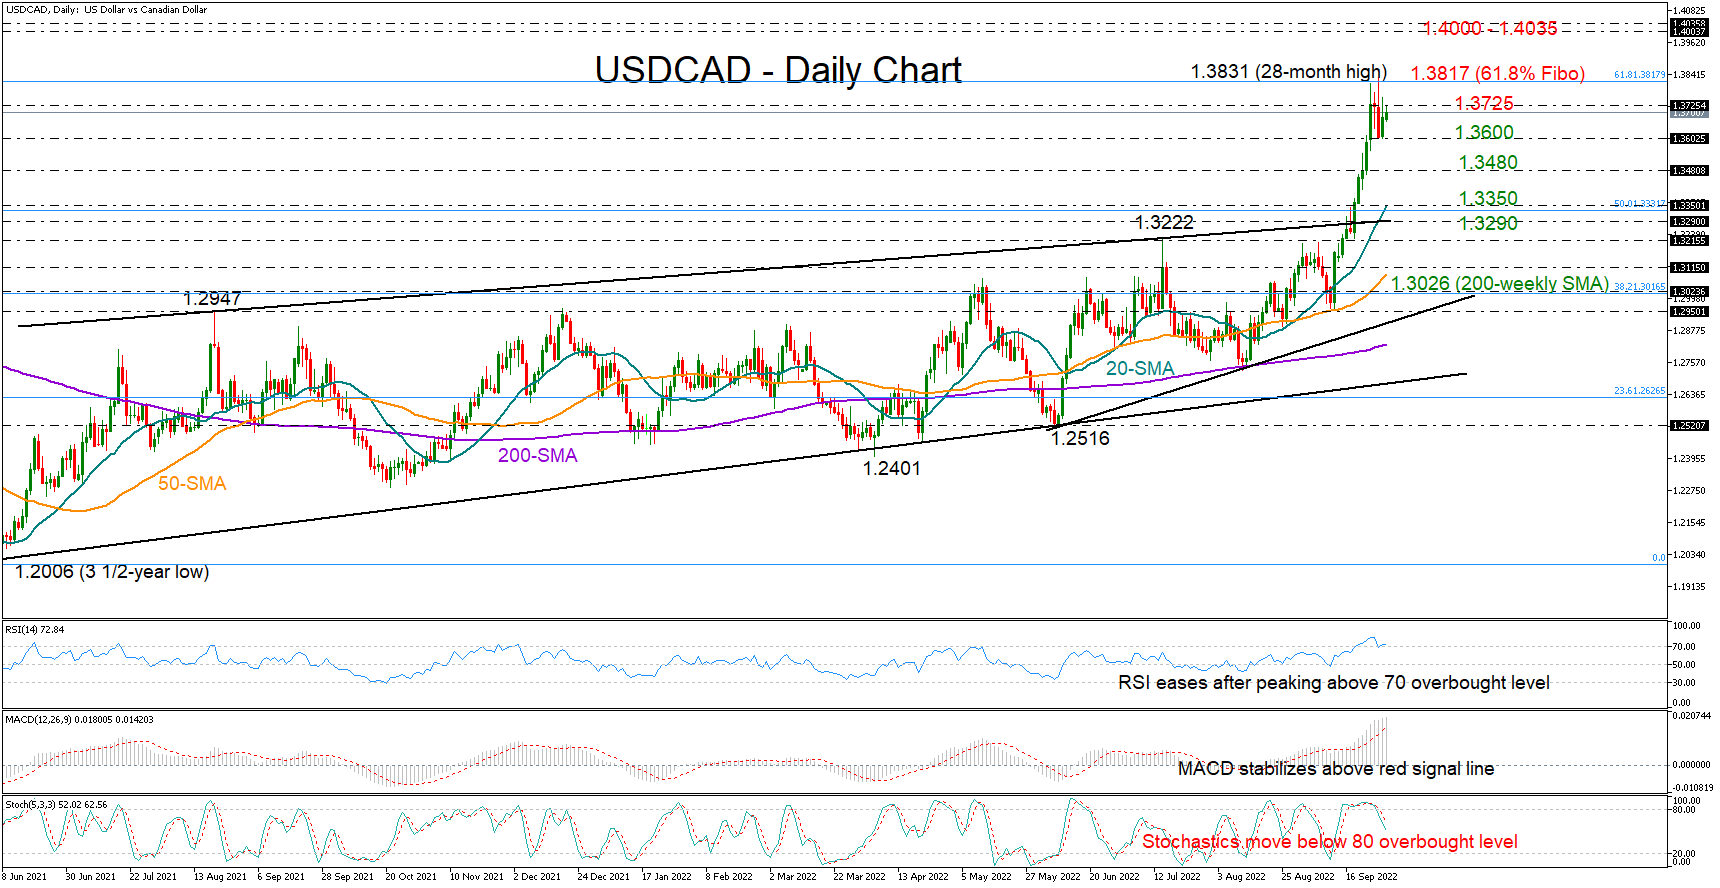
USDCAD switched to consolidation after its exponential advance above a bullish channel topped at 1.3831. Of note, the area coincides with the 61.8% Fibonacci retracement of the March 2020 – June 2021 downtrend.
Encouragingly, the 1.3600 region helped the market to retain some weekly gains, but with the RSI and the stochastics hovering in overbought waters, it’s questionable how far the rally could still go. Nevertheless, with the indicators remaining elevated within the bullish territory, there might be some room for further improvement before the next bearish wave starts.
Should the pair propel buying interest above the key resistance area of 1.3725–1.3831, the rally could pick up steam towards the 1.4000–1.4035 region taken from March-May 2020. Breaching that wall too, the next barricade could pop up around 1.4140.
Alternatively, a downside reversal may retest the support of 1.3600. If that proves easy to break this time, the sell-off may continue towards the 1.3500 round level. Moving lower, the 20-day simple moving average (SMA) at 1.3347 will attempt to keep the broad outlook positive above the channel.
In brief, USDCAD is preserving a bullish outlook in the short- and long-term picture, though with the price trading within overbought territory, fears that the uptrend has peaked may keep weighing on market sentiment.
US Oil: Price Adjustment Completed, Expect Formation of a Minor Zigzag
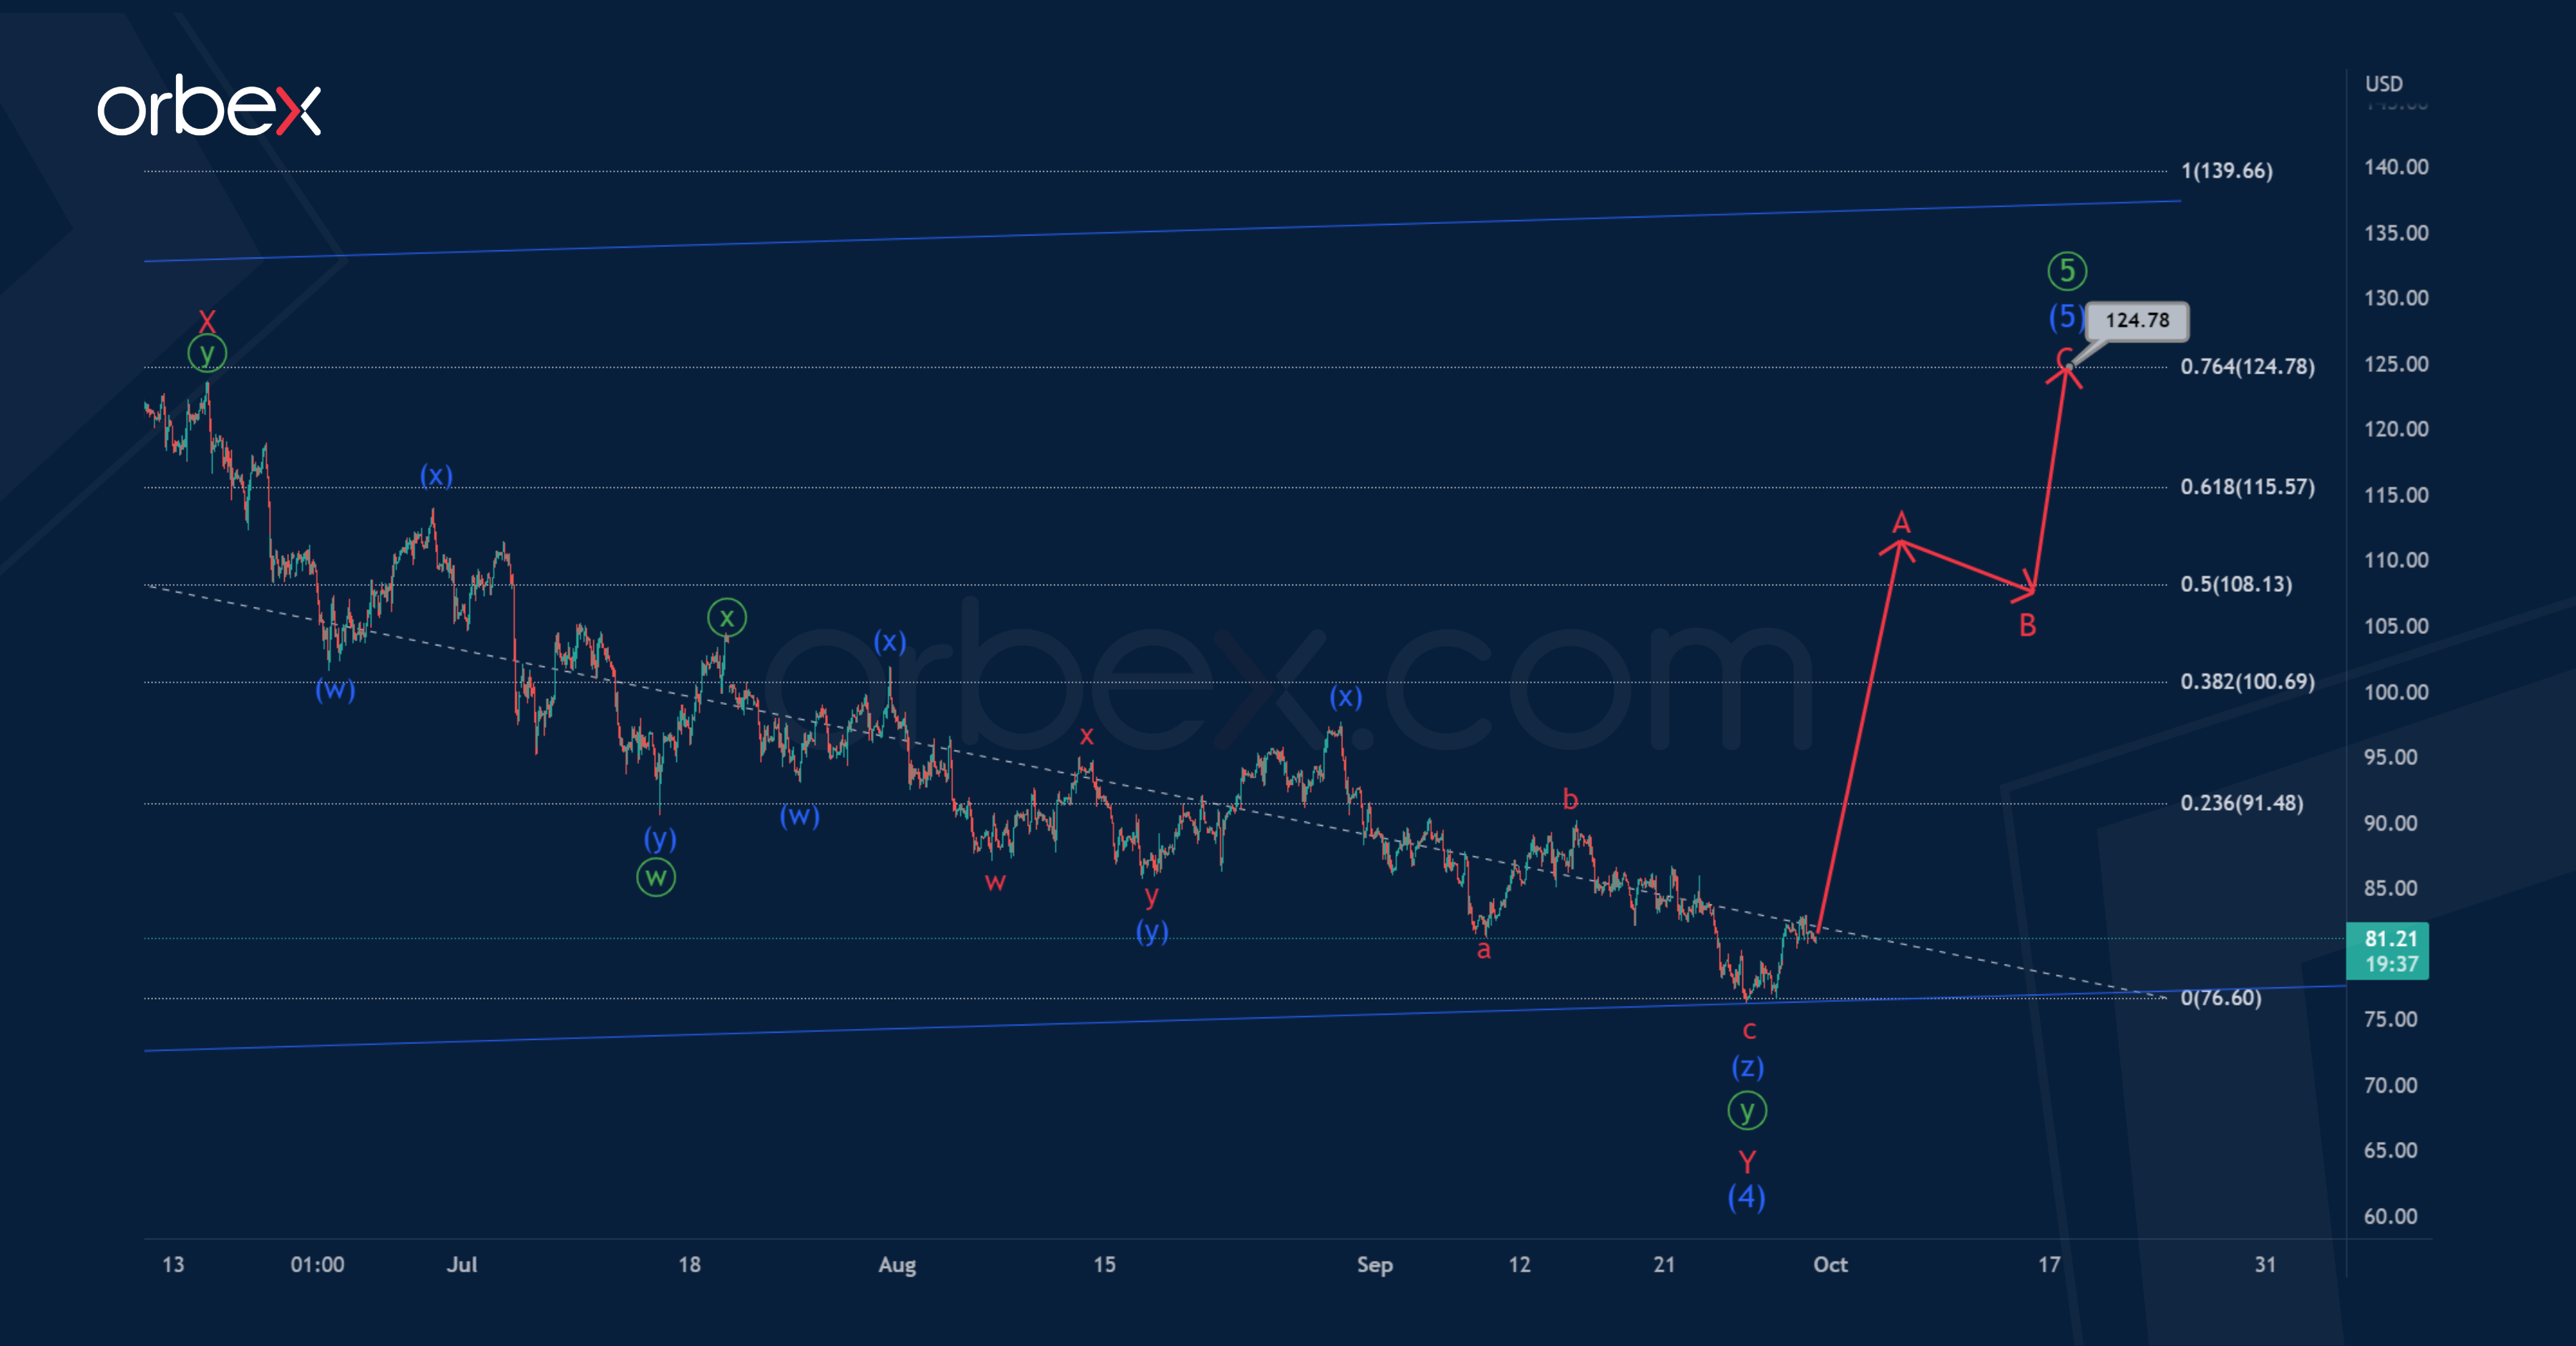
USOIL on the 1H time-frame shows the marking of the final primary wave ⑤, which takes the form of an intermediate ending diagonal. We see the second half.
An intermediate correction (4) in the form of a minor double zigzag may have been completed recently.
Thus, now we see that the price could start to rise in the intermediate wave (5). It is assumed that the intermediate wave (5) will take the form of a standard 3-wave zigzag A-B-C
The end of the specified construction is possible near 124.78. At that level, wave (5) will be at the 76.4% Fibonacci extension of impulse (3).
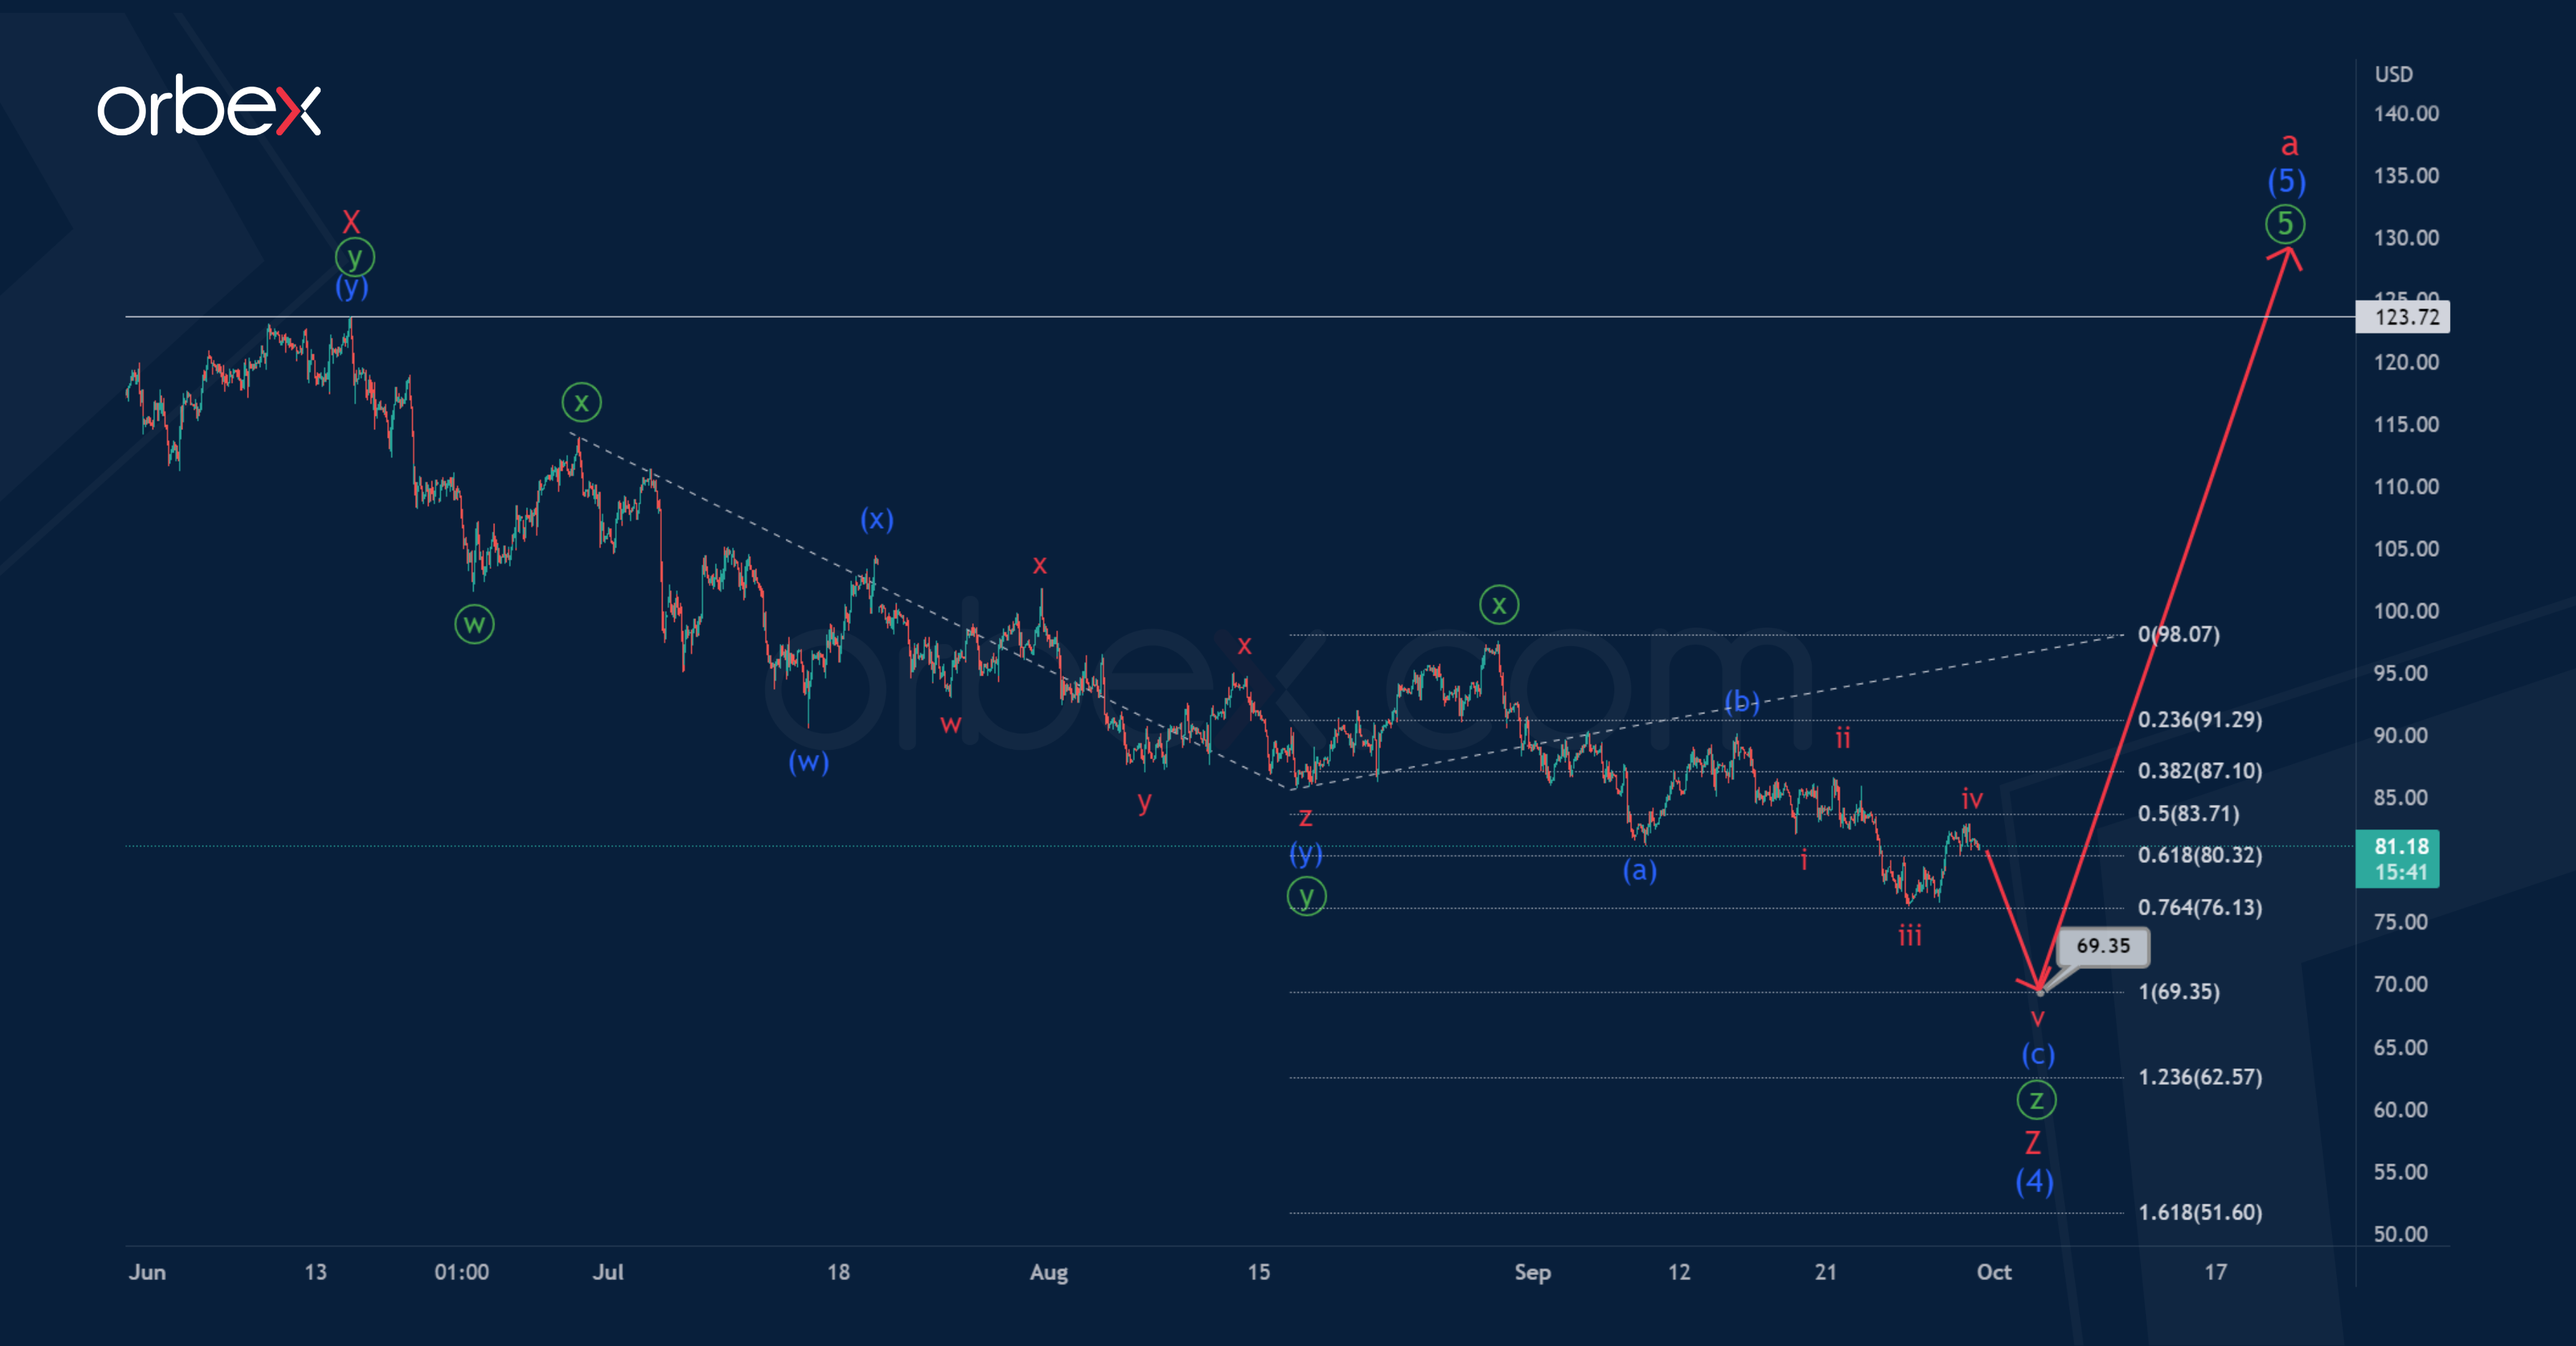
Alternatively, the construction of an intermediate correction (4) can be continued. It may have the form of a triple zigzag W-X-Y-X-Z.
The minor sub-waves W-X-Y-X can be completed. Thus, in the near future, the downward movement is expected to continue in the final actionary sub-wave Z, which can be completed in the form of a minute triple zigzag ⓦ-ⓧ-ⓨ-ⓧ-ⓩ.
The oil price may fall to 69.35. At that level, minute waves ⓨ and ⓩ will be equal.
After reaching this level, the market is expected to grow above the maximum – 123.72.
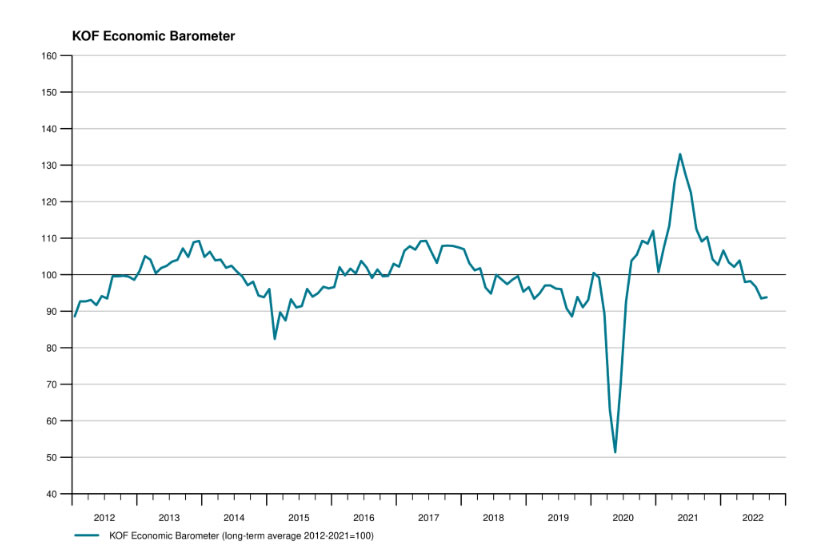
Swiss KOF edged up to 93.8, still augurs a cooling of economy
Swiss KOF Economic Barometer rose slightly from 93.5 to 93.8 in September, better than expectation of of 86.2. yet, the reading remains below its long-term average, "augurs a cooling of the Swiss economy for the end of 2022."
The slight increase is "primarily attributable to bundles of indicators from the manufacturing and other services sectors". On the other hand, "indicators from the finance and insurance sector and for foreign demand are sending negative signals."
GBP/JPY Daily Outlook
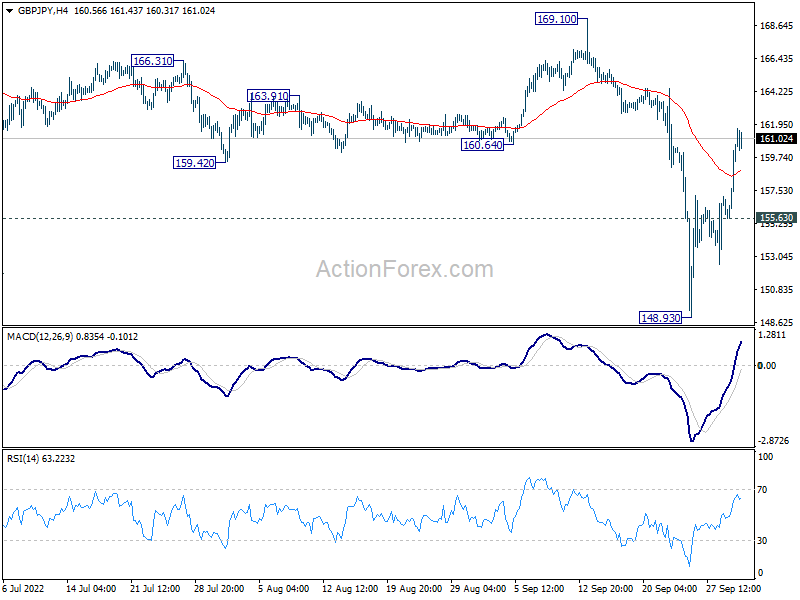
Daily Pivots: (S1) 157.21; (P) 158.83; (R1) 162.04; More...
GBP/JPY's rebound form 148.93 extended higher and the break of 160.64 support turned resistance argues that fall form 169.10 is totally completed. Intraday bias is back on the upside for 169.10 next. On the downside, nevertheless, below 155.63 will turn bias back to the downside for retesting 148.93 low instead.
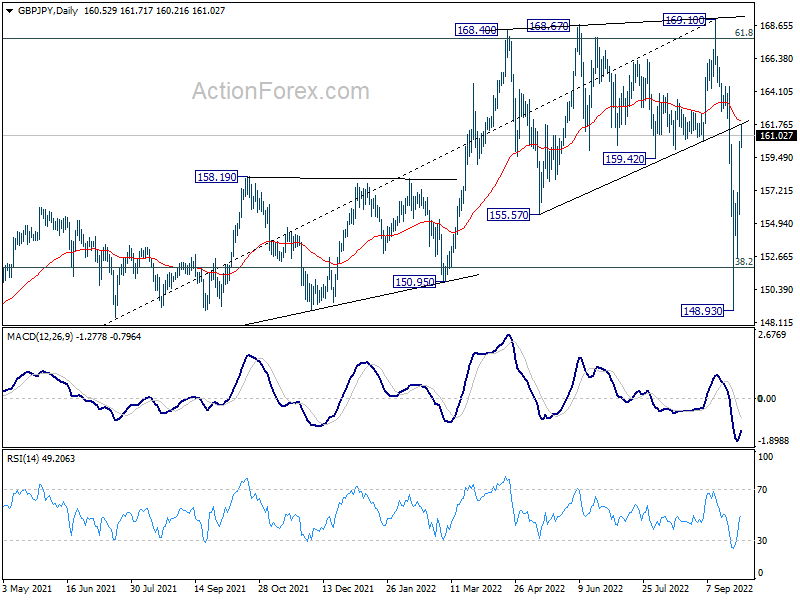
In the bigger picture, rise from 123.94 (2020 low) has completed at 169.10. 38.2% retracement of 123.94 to 169.10 at 151.84 is already met, and there could be some support from there for rebound. But risk will now stay on the downside as long as 169.10 resistance holds. Sustained trading below 151.84 will target 61.8% retracement at 141.19.
EUR/JPY Daily Outlook
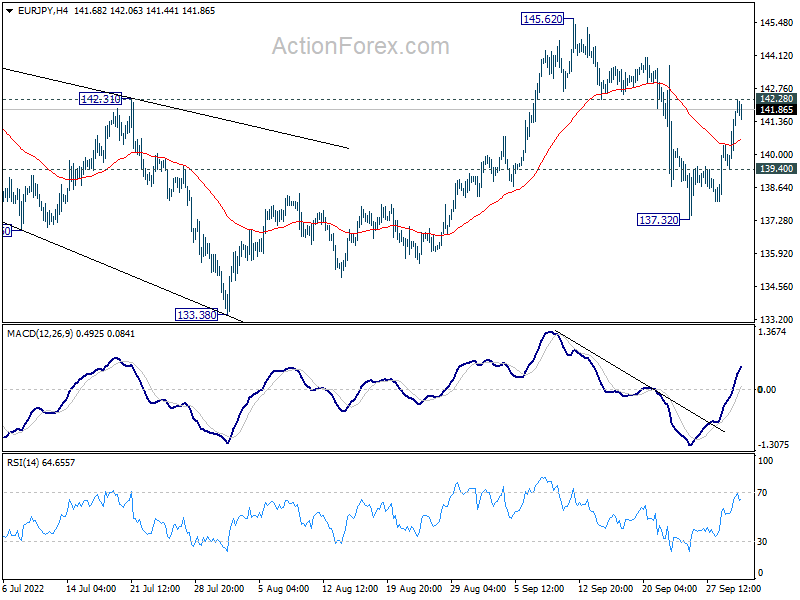
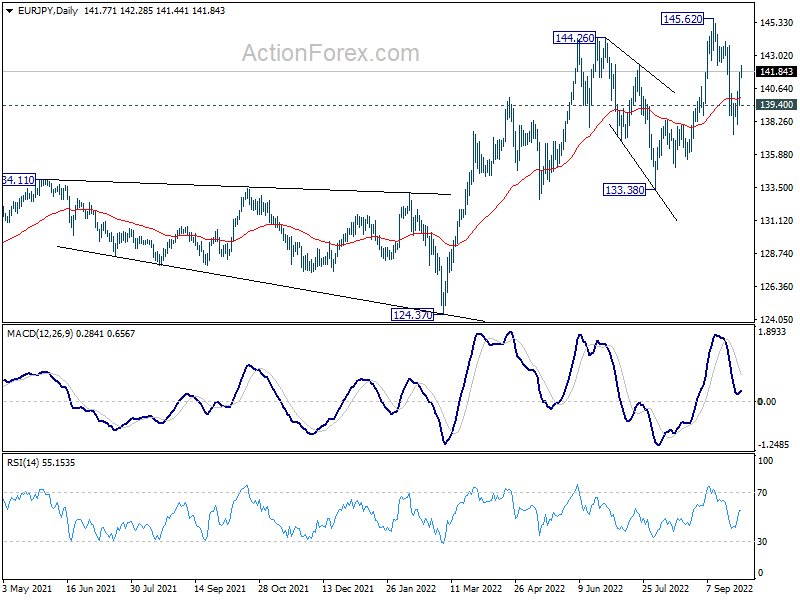
Daily Pivots: (S1) 140.16; (P) 140.94; (R1) 142.46; More....
EUR/JPY's rebound from 137.32 extends higher and focus is immediately on 142.29 resistance. Firm break there will indicate that the pull back from 145.62 has completed, and bring stronger rally to retest this high. On the downside, though, break of 139.40 minor support will turn bias back to the downside, to resume the fall from 145.62 through 137.32 support.
In the bigger picture, as long as 133.38 support holds, the up trend from 114.42 (2020 low) could still extend through 145.62 high. In that case, next target 149.76 (2015 high). However, sustained break of 133.38 will be a sign of medium term bearish reversal and bring deeper fall to 124.37 support first.
EUR/GBP Daily Outlook
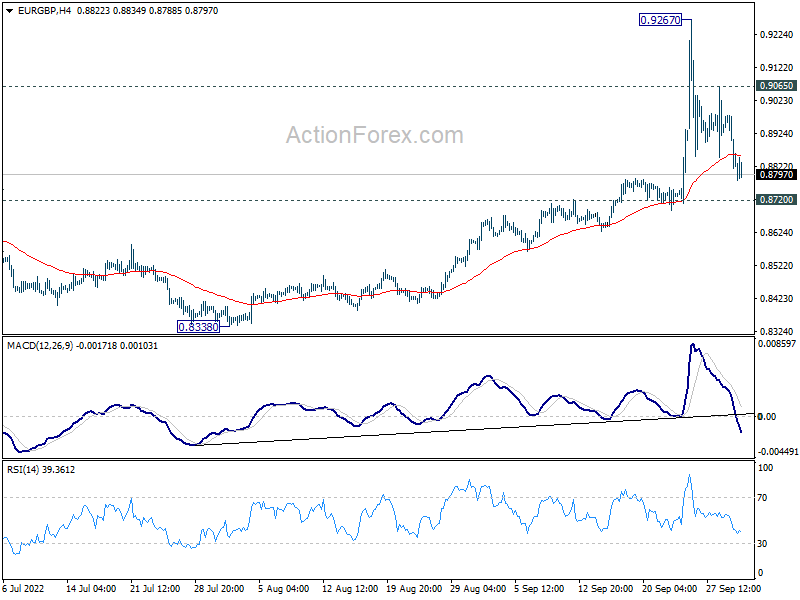
Daily Pivots: (S1) 0.8774; (P) 0.8877; (R1) 0.8934; More...
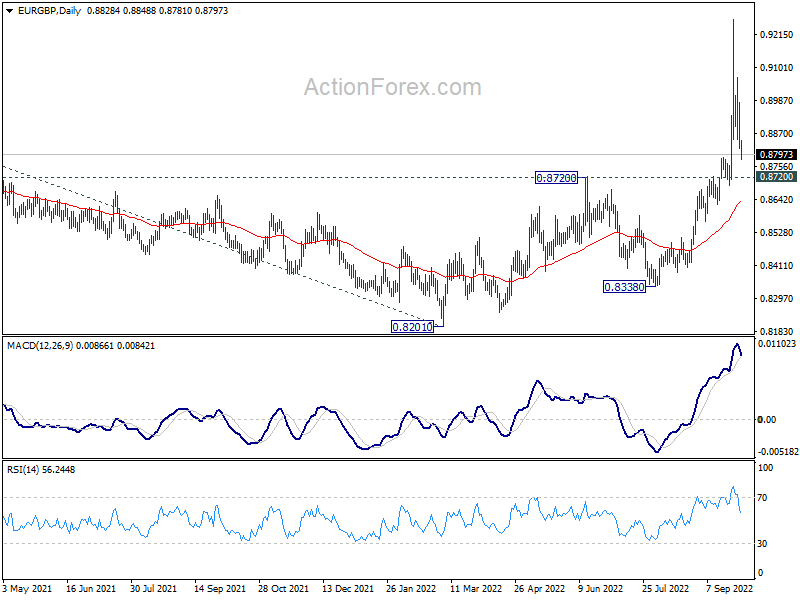
EUR/GBP's pull back from 0.9267 extends lower but stays above 0.8720 resistance turned support. Intraday bias remains neutral first. On the upside, above 0.9065 will turn bias back to the upside for 0.9267. Firm break there will resume larger rally to 0.9499 long term resistance. However, break of 0.8270 support will mix up the near term outlook.
In the bigger picture, rise from 0.8201 is in progress targeting 0.9499 (2020 high) next. Based on current momentum, such rally should be resuming the up trend from 0.6935 (2015 low). Firm break of 0.9499 will target 61.8% projection of 0.6935 to 0.9499 from 0.8201 at 0.9786, which is close to 0.9799 (2008 high). This will now remain the favored case as long as 0.8720 resistance turned support holds.
EUR/AUD Daily Outlook
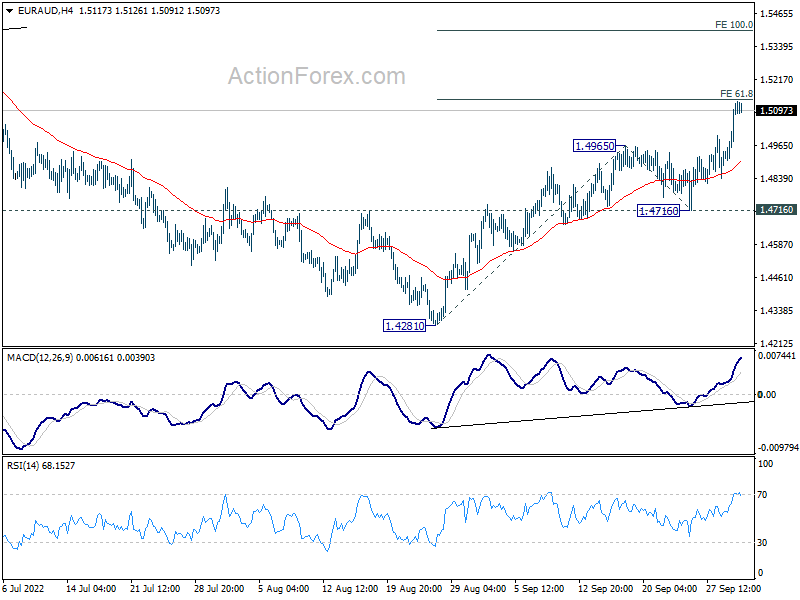
Daily Pivots: (S1) 1.4962; (P) 1.5045; (R1) 1.5180; More...
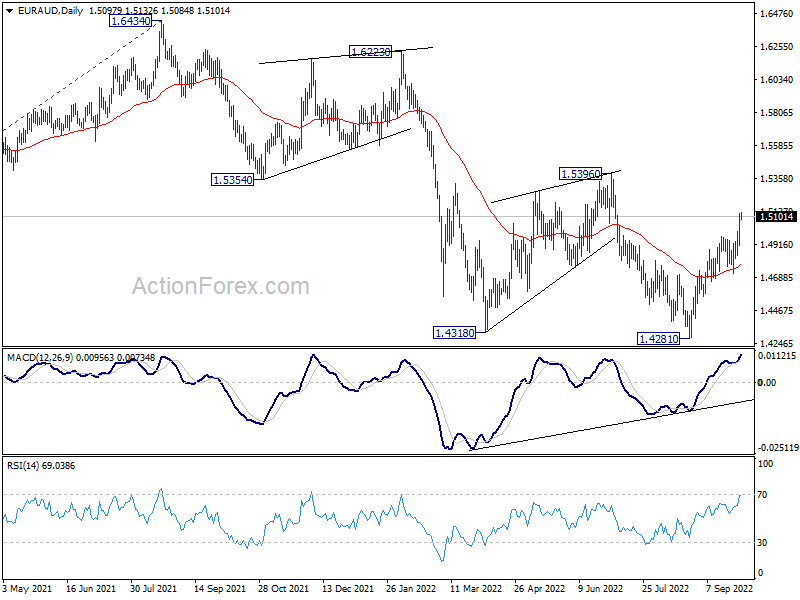
EUR/AUD's rally from 1.4281 is extending and intraday bias stays on the upside. Firm break of 61.8% projection of 1.4281 to 1.4965 from 1.4716 at 1.5139 will target 100% projection at 1.5400, which is close to 1.5396 key resistance. On the downside, break of 1.4716 support is needed to indicate completion of the rebound. Otherwise, further rise will remain in favor in case of retreat.
In the bigger picture, down trend from 1.9799 is still in progress. Break of 1.4318 low will target 61.8% projection of 1.9799 to 1.5250 from 1.6434 at 1.3623, which is close to 1.3624 long term support (2017 low). This will remain the favored case now as long as 1.5396 resistance holds.
EUR/CHF Daily Outlook
Daily Pivots: (S1) 0.9494; (P) 0.9543; (R1) 0.9617; More....
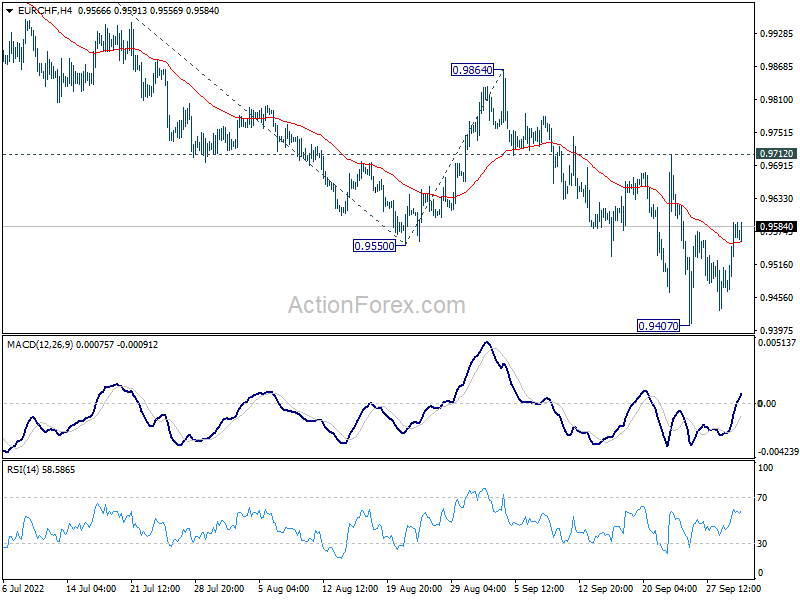
EUR/CHF's recovery from 0.9407 extends higher but stays well below 0.9712 resistance. Intraday bias stays neutral and outlook remains bearish. Break of 0.9407 will resume larger down trend. Next target is 61.8% projection of 1.0512 to 0.9550 from 0.9864 at 0.9269.
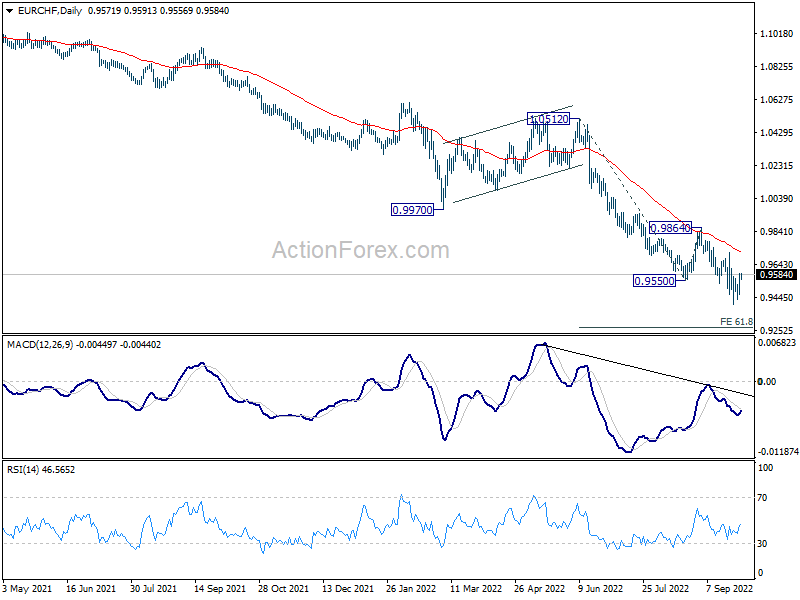
In the bigger picture, long term down trend from 1.2004 (2018 high) is still in progress. Next target is 138.2% projection of 1.2004 to 1.0505 to 1.1149 at 0.9033. On the upside, break of 0.9864 resistance is needed to be the first sign of medium term bottoming. Otherwise, outlook will stay bearish in case of strong rebound.
The Pound Has Probably Bottomed Out
While some berated the UK government for collapsing the Pound on the government’s plans to cut taxes, others were buying the British currency. The Pound’s movement on Friday and Monday looks like a classic capitulation, often a precursor of a reversal.
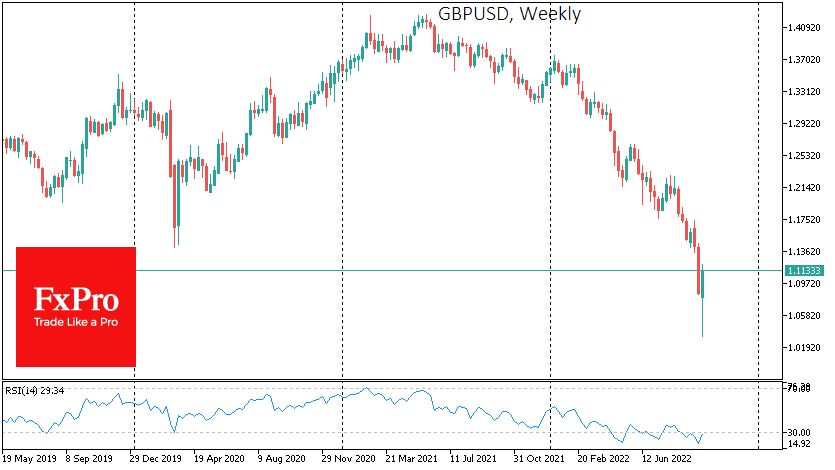
GBPUSD is adding for the third day, reaching 1.11 and nearly 7.5% above the historical low set on Monday.
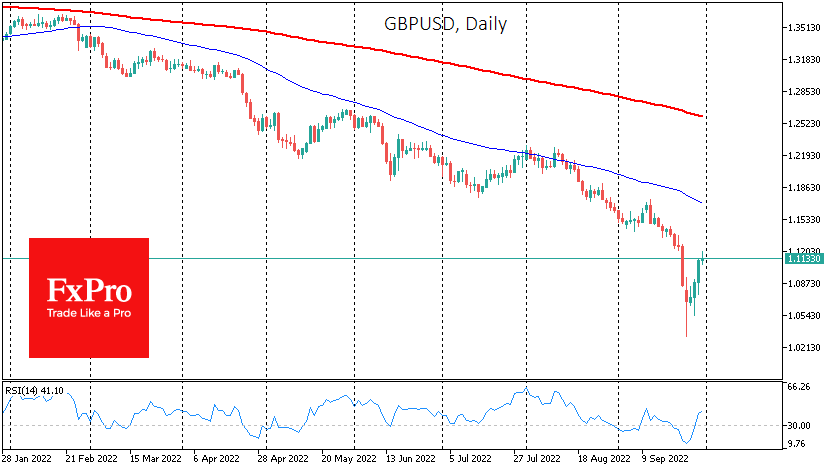
Despite an extensive sell-off in the UK debt markets, the Pound has been adding. This is reminiscent of the case of the negative oil price in April 2020, after which there was no more bad news to push the price down further.
In less than a week, the Bank of England has made a complete U-turn from plans to sell assets off the balance sheet to an intention to buy them. In theory, this news should have put pressure on the Pound as it increases its market supply. In practice, stabilising the far end of the yield curve appeared to have created at least one sector in the UK market where investors could park their assets.
The US and IMF have openly criticised the UK government for plans to cut taxes and cover the short-term budget deficit through new borrowing. Interestingly, the passage of Trump’s tax reforms has been characterised, among other things, by the start of the dollar’s rise, which has added around 30% in less than five years.
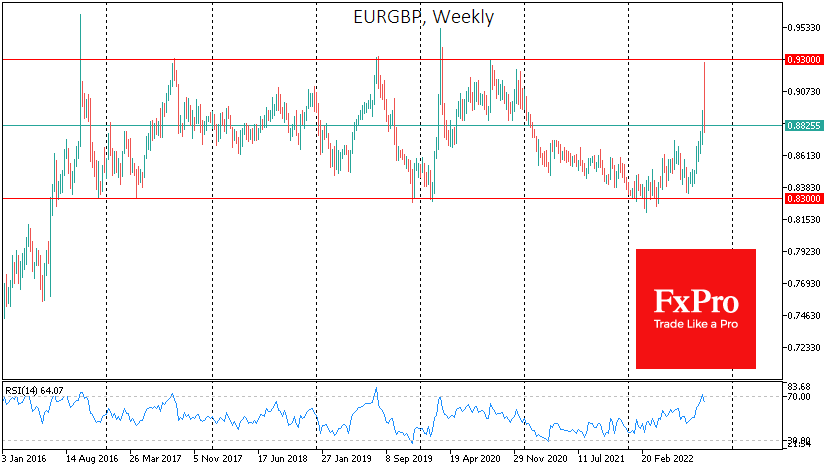
It is also interesting to watch the dynamics of the Pound against the euro. Since 2016, EURGBP has been trading in a range of 0.83-0.93. The 18-month move from the upper to the lower bound through February marked a threefold faster climb. However, this touching of the upper boundary has now been followed by another (and even faster) pullback downwards.
Bank of England policy has become quite unorthodox, actively pushing up interest rates at the short end of the curve and down at the far end. The return to balance sheet asset purchases by the Bank of England is hardly justifiable as a capitulation, and we may see this dual policy intensify further. It is realistic that the Bank of England will be more active in raising the bank rate and short-term bond yields in the coming months but will continue or even intensify its buying of 20–30-year securities on the balance sheet.
Such a policy would increase the attractiveness of the Pound on money markets by making it more “competitive” against the dollar while keeping long-term credit available. At the same time, tax cuts could support interest in investing in the UK.
Nasdaq 100 Breaks Critical Support
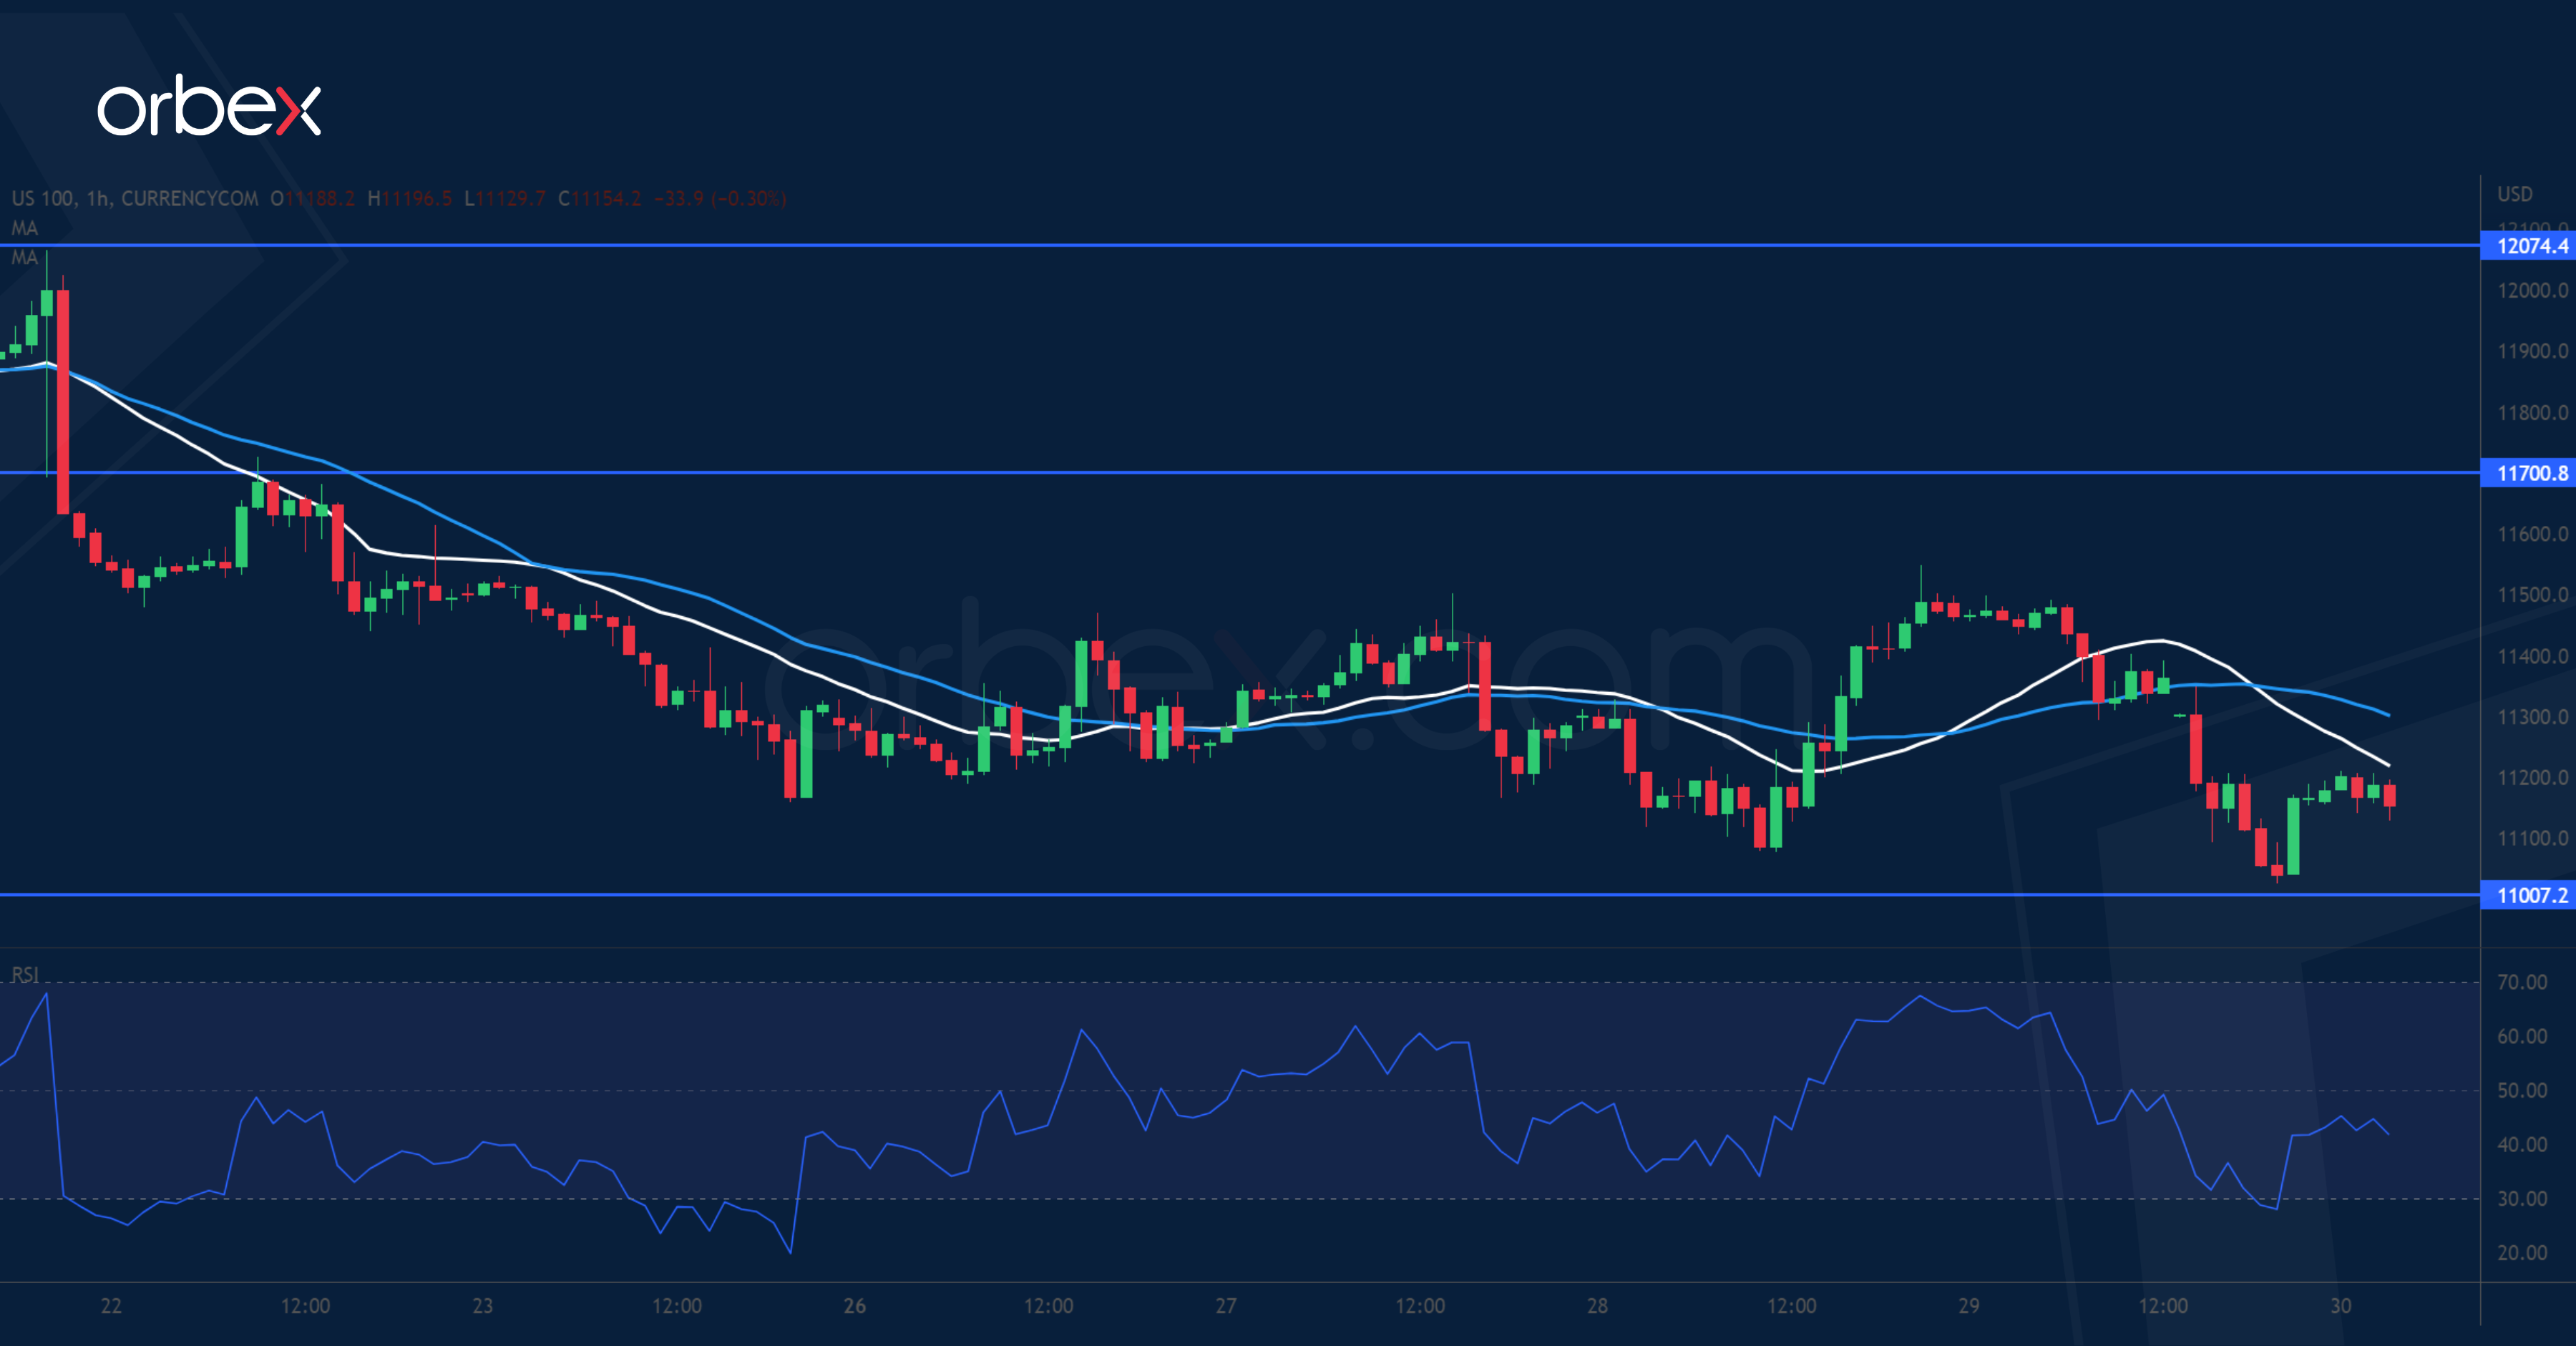
The Nasdaq 100 slips as a resilient labour market supports the Fed's aggressive hikes. A breach below June’s low at 11100 could send the index deeper into bearish territory. The price is testing November 2020’s low at 11000 but the psychological level of 10000 might be at stake. 11700 is the first hurdle ahead and the top of the previously failed rebound at 12070 a key level before short-term sentiment could turn around. The latter also coincides with the 30-day moving average where strong selling pressure could be expected.