Sample Category Title
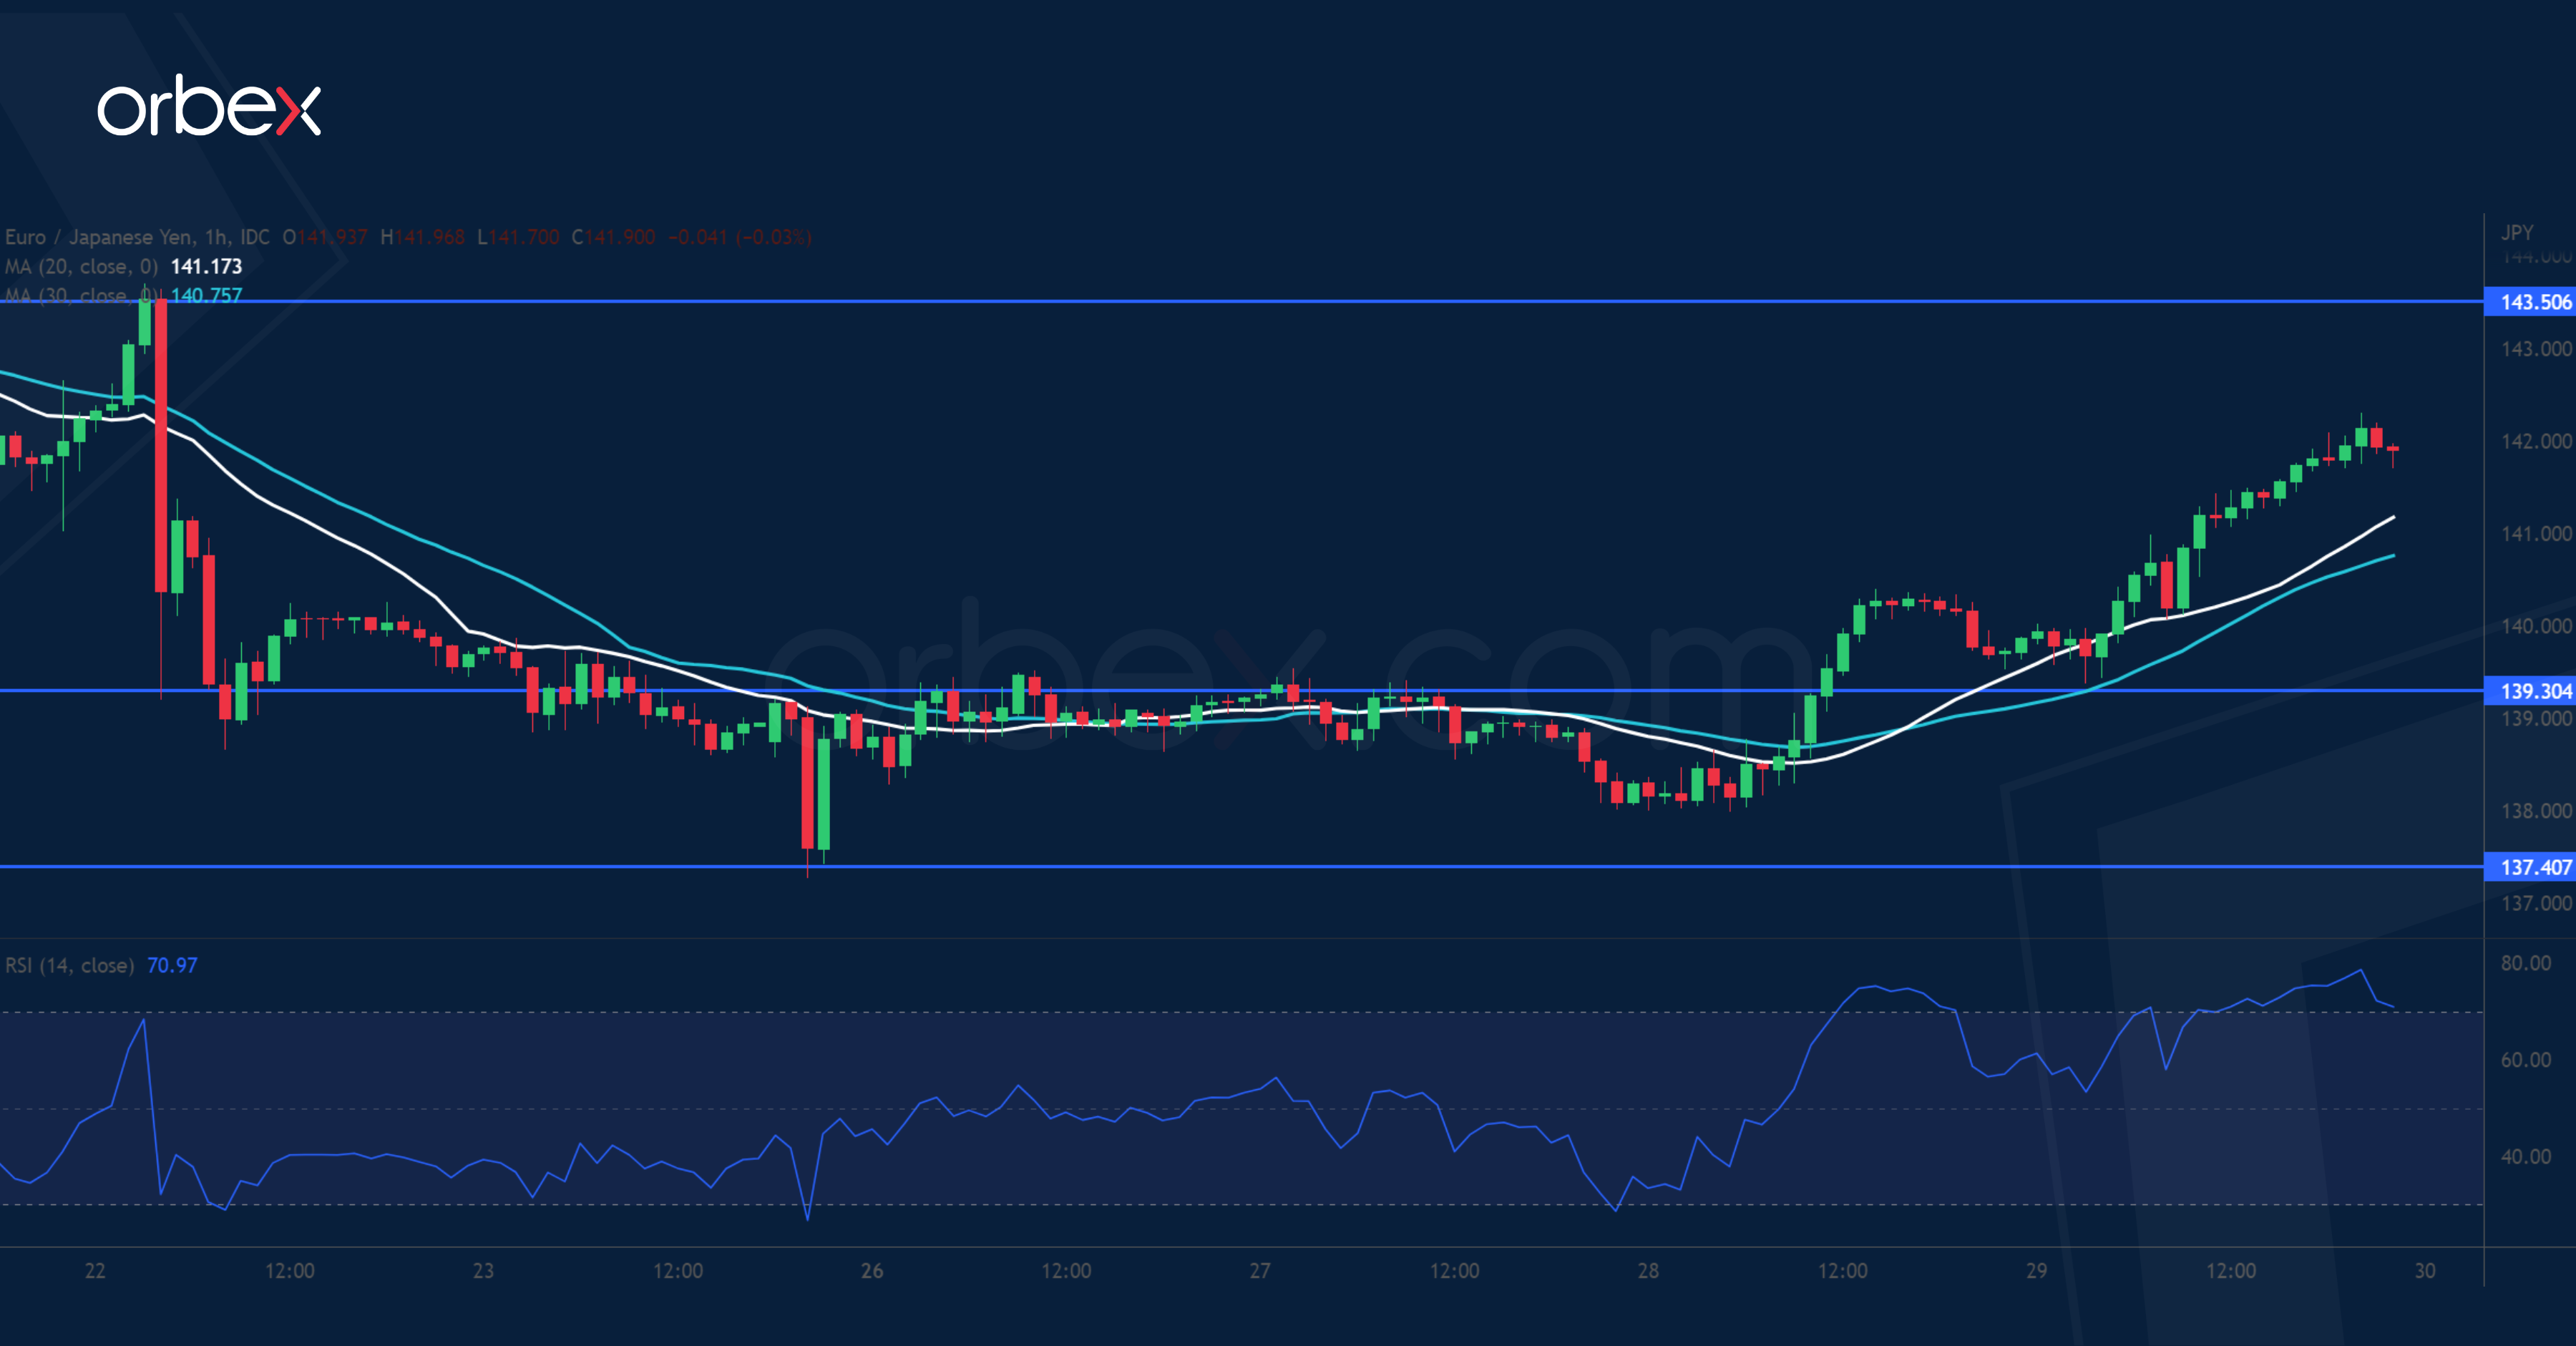
EUR/JPY Bounces off Support
The euro climbed as German inflation shot up in September. The current correction has found support at the base (137.40) of a bullish breakout in late August. This may help the six-month long rally to stay valid. A rise above the psychological level of 140.00 has prompted some sellers to cover their bets, opening the door for a recovery to 143.50. Its breach may put the euro back on track and resume the rally above 144.00. As the RSI ventures into the overbought zone, 139.30 is the closest support in case of a pullback.
USD/CHF Seeks Support
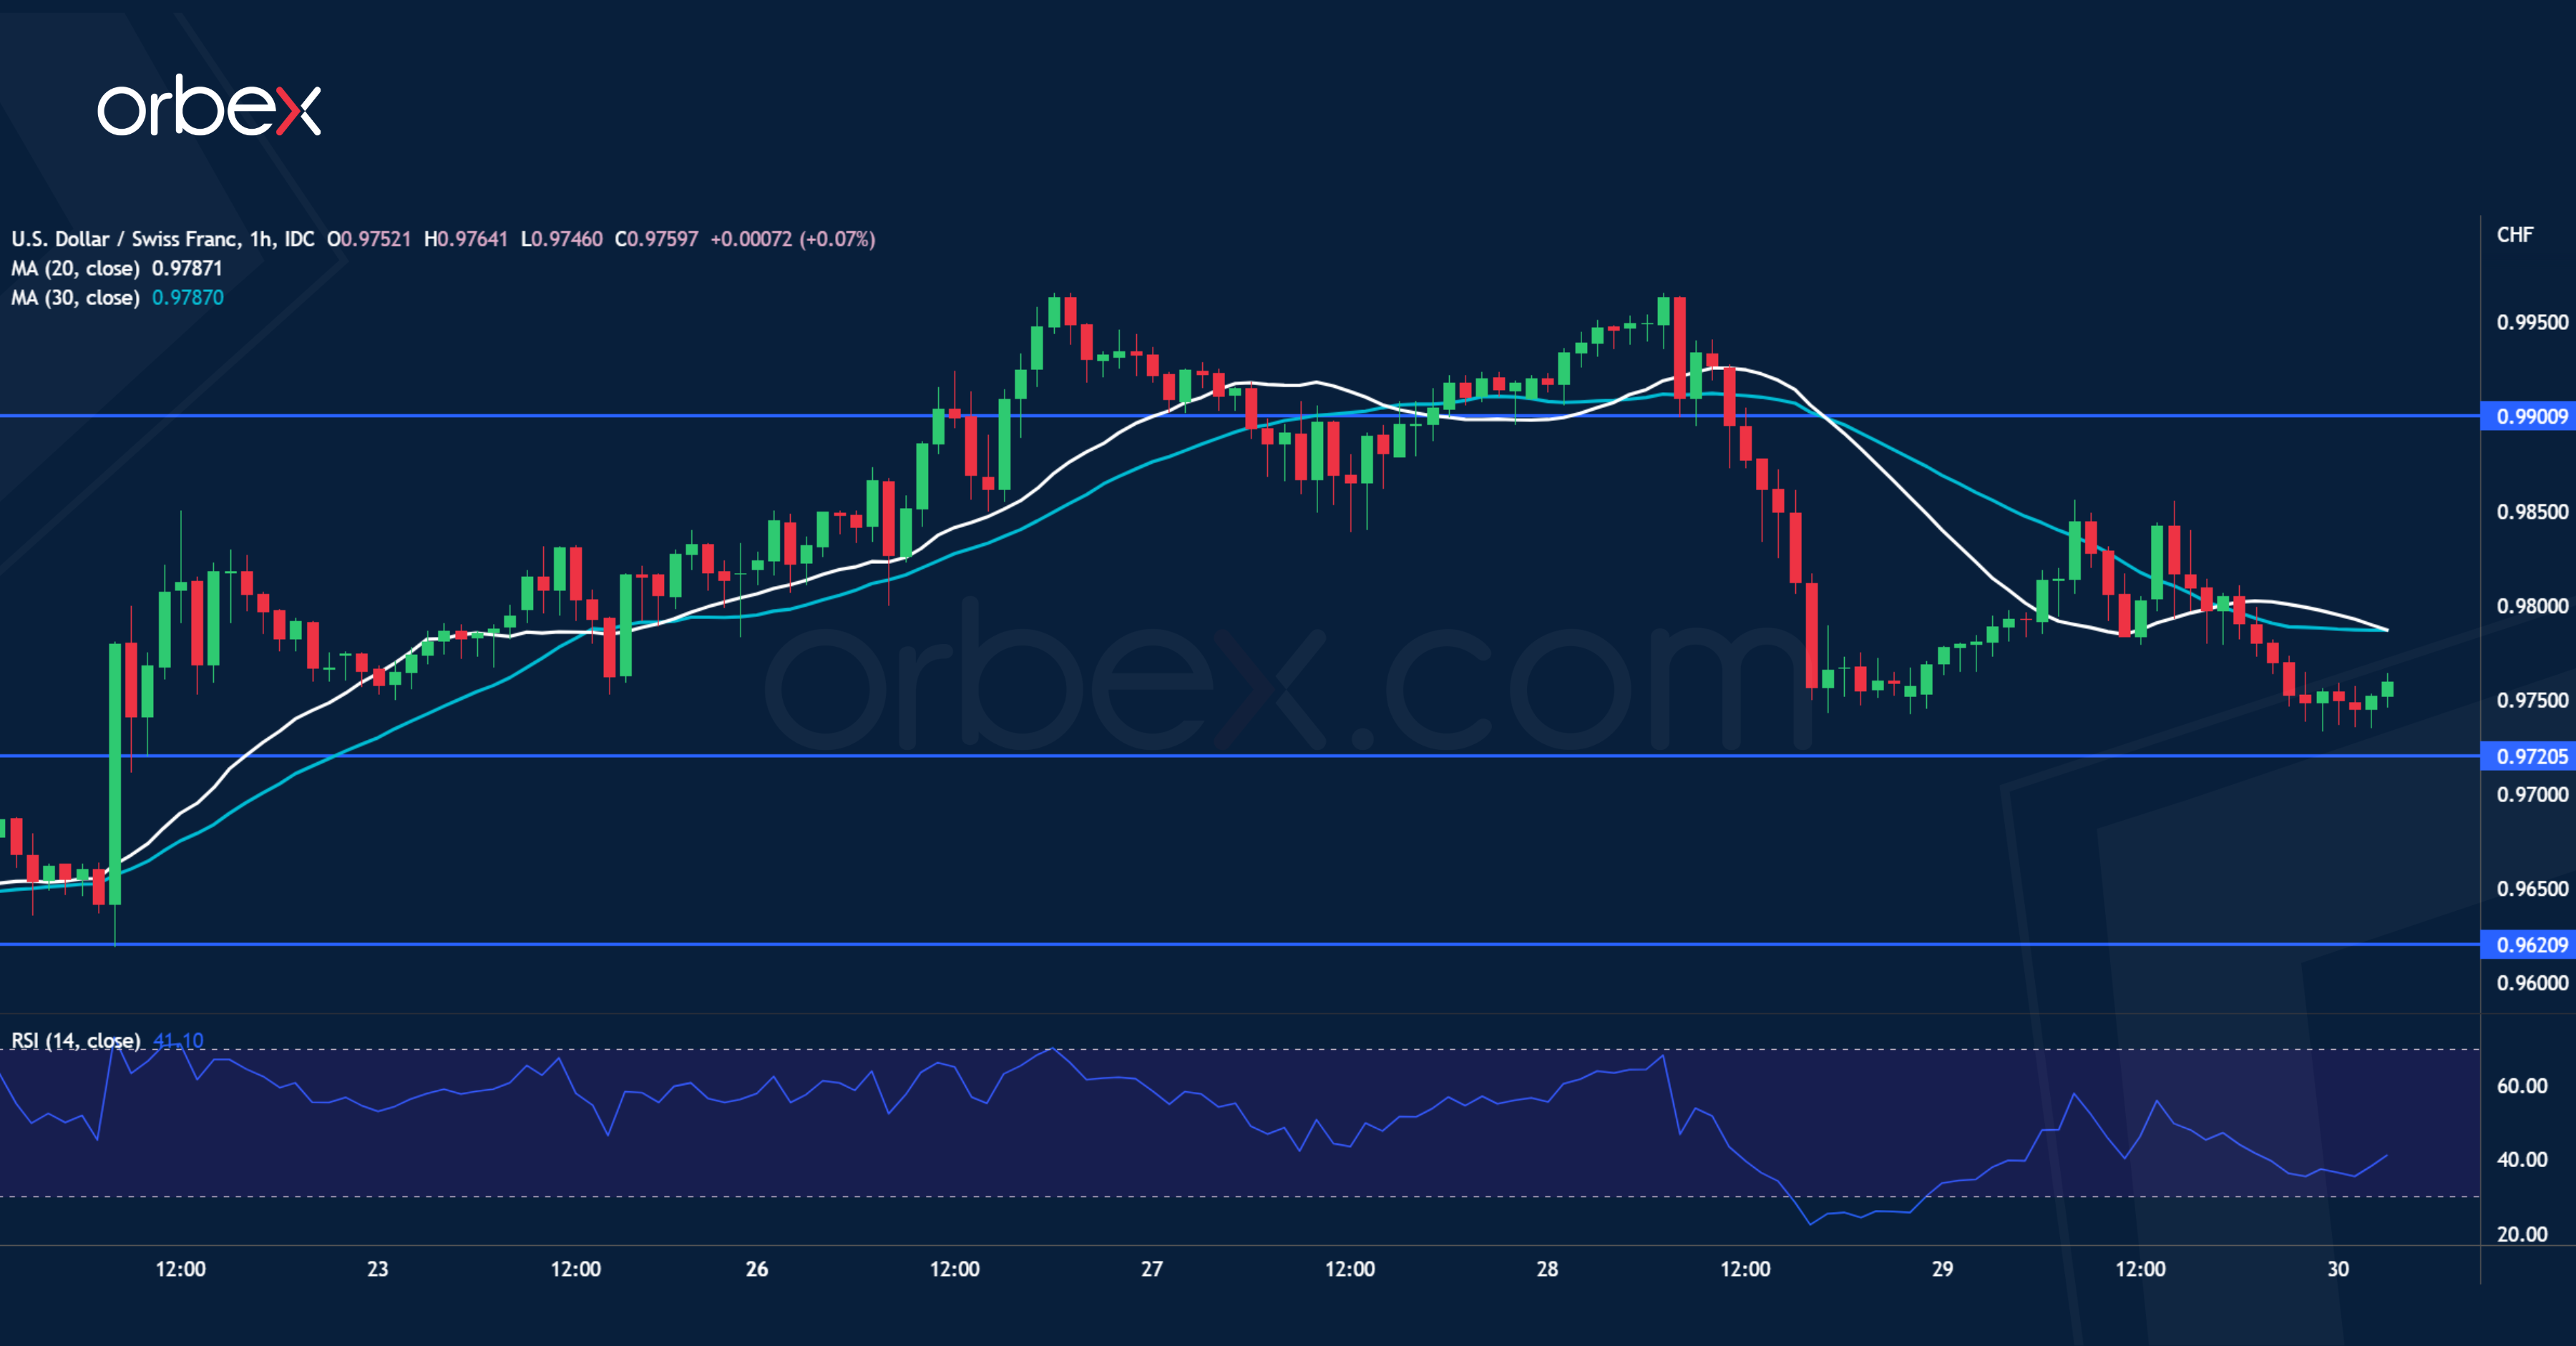
The US dollar falls as GDP shows a 0.6% contraction last quarter. The pair is consolidating its gains after it rose above the double top at 0.9880. A slide below 0.9850 triggered profit-taking. Medium-term sentiment remains intact though and 0.9720 is the next level to gauge follow-up interest. The bulls may need to accumulate before they could take on 0.9900 and another double top (1.0040) on the daily chart. A close above this major ceiling would release the last bit of selling pressure and extend the rally towards 1.2300.
The Global Sell-off Continues
Market movers today
Today's key data release will be the Euro Area September Flash HICP, where yesterday's upside surprise in the German figures has likely tilted the risks towards a larger-than-expected uptick, read more below. From the US, August Private Consumption Expenditures are due for release, data released earlier points towards modest but still positive growth in real consumption.
Today, Russia is expected to announce annexation of the four regions in Eastern Ukraine following the staged referendums over the past week - a move which has been widely condemned by western leaders. Focus remains on whether Russia aims to use even harsher methods to defend the controlled areas, as Ukraine has continued to reclaim control of areas in the northern part of the Donetsk region.
On the central bank front, ECB's Schnabel as well as Fed's Barkin, Brainard and Williams will be on the wires today.
The 60 second overview
The global sell-off in the financial markets continued in Asia this morning given the higher interest rates and the increased prospect of a global economic recession on the back of the turmoil in Europe. There is rising pressure on the UK government to change the fiscal package and looking at a recent poll, Labour has an historical high lead of 33% in the poll against the government. So far there has been no change to credit rating or outlook to UK government bonds, but Moody's has warned the UK government that it would be credit negative if they go ahead with large unfunded tax cuts.
The Federal Reserve continues to be very hawkish despite the looming recession in the US economy. Fed's Mester stated yesterday that a recession would stop the Federal Reserve from hiking rates. Fed's Daly stated that they should avoid a deep recession.
Today, we will get the Eurozone inflation flash print and after the surprise in the German inflation data there will be plenty of speculation regarding the high inflation and response from ECB given the speech later today from ECB.
German inflation surprised on the upside and rose from 7.9% to 10.0% in September, the highest level since December 1951. Although the inflation jump was largely due to the expiry of energy relief measures introduced in June, underlying inflation pressures are also still building, despite the weakening demand environment. An ongoing steep rise in food price inflation provides a cautionary tale that a normalisation in commodity prices remains a necessary, but not sufficient condition to get consumer prices down. We doubt that we have seen the inflation peak, as the latest increase in energy commodity prices has yet to pass through to consumers. If anything it will be up to governments to limit inflation pressures in the near-term. Yesterday the German government announced another EUR 200bn aid package (5.5% in % of GDP), financed through new borrowing and channelled through the Economic Stabilisation Fund (WSF), to cap gas and electricity prices. However, we doubt that it will be enough to prevent the German economy falling into recession in H2 22.
German ASW-spreads tightened modestly on the back of the new plan even though the funding is expected be done by the Economic Stabilisation Fund (ESF). Germany has previously done something similar after the financial crisis, where it bailed out HypoVereinsbank and WestLB through FMS Wertmanagement and EEA. Here the government debt jumped almost 10% from 73% to 82% of GDP. Currently, the debt is at 69% of GDP.
Equities: The positive blip in equities on the back of BoE Wednesday was not long lasting and equities back on their heels yesterday. As expressed by the VIX north of 30 and MOVE around 150, uncertainty is elevated and currently fuels from so many angles. Massive monetary tightening, crisis management QE, war, energy crisis, utility crisis, recession risk and financial stability risk, just to mention some of the hottest topics that all have been market driving with the last two weeks. We typically spending 90% of the time discussing marginal changes in macro data and being nitty gritty data. However, right now, even some tier 1 macro data are being disregarded by investors because there are so many other challenges to try to understand. Rising uncertainty is never good for equities. In US, Dow -1.5%, S&P 500 -2.1%, Nasdaq -2.8% and Russell 2000 -2.45%. The only sector in green was energy but besides that investors are still running for shelter in Min Vol, quality, defensives with health care and consumer staples being the two go to sectors in the current turmoil. The Asian market was a victim of Europe and Wall Street. Hence, it was no surprise to see them lower this morning. Marginally positive story to see South Korea showing a minor gain at times of writing. US and European futures a tad lower this morning.
FI: It was again a very volatile day in the global bond markets. The 10Y German govt yield traded between 2.20% and 2.30% before ending at 2.20%. A similar trading pattern was seen in 10Y Treasuries, which traded between 3.75% to 3.95%. Hence, the volatility remains in the market given the uncertainty about the terminal rate, QT, fiscal stimulus packages as well as the poor market liquidity.
FX: In a rare occasion, GBP and EUR both outperformed the rest of G10 currencies yesterday. EUR/USD touched 0.98 and EUR/GBP slipped below 0.89 again. Aside, USD/JPY still trades close to the 145 level that prompted FX intervention last week.
Credit: As risk sentiment was under pressure yet again, credit spreads resumed their widening trend with iTraxx Main wider by 3bp to 138bp and Crossover by 12bp to 662bp.
Nordic macro
The tight labour market is obviously an important factor in Norges Bank's aggressive policy rate signals, and NB is unlikely to change course until the labour market cools. Today's unemployment data for September could therefore be crucial, and we anticipate a slight increase in the jobless rate to 1.7% (seasonally adjusted). This is due to a clear slowdown in economic growth causing demand for labour to soften somewhat, albeit from high levels. If proven right, this will be exactly in line with NB's estimate from the latest MPR.
Bailey Could Become a National Hero, or a Disaster
It was a terribly ugly day across the equity and bond markets yesterday.
But despite the financial calamity, Porsche had a successful IPO and secured the valuation it was looking for, even though the shares ended flat the first day of trading on the back of an overall morose investor mood.
Then, the Americans took over a red session from the Europeans, and they kept selling as the Federal Reserve (Fed) officials continued their hawkish talk on how they will continue rising the interest rates in the US despite the massive financial crisis.
Cleveland Fed head Loretta Mester joined her colleagues in the idea of fast tightening yesterday while a couple of other FOMC members including Lael Brainard and John Williams are due to speak today to further batter the global financial markets.
The US yields have eased along with the UK yields on the back of the BoE intervention the day before, but are again pushing higher, with the 2-year yield consolidating around 4.20%, and the 10-year yield, around 3.80%.
Due today, investors will focus on the US income, spending, but more importantly the PCE data. The world is praying for a sufficiently soft PCE to cool down the selling pressure on bonds and equities.
The S&P500 plunged another 2% yesterday and wiped out the summer gains entirely. The same is true for Nasdaq. Nothing is left from the summer rally in the US stocks.
Apple downgraded
Apple dived more than 6% and closed the session almost 5% lower yesterday, after Bank of America downgraded the stock on worries of weaker consumer demand.
This is a big deal, because big banks downgrading Apple is quite a rare event!
The BoFA analyst cut his PT from $185 to $160 on the back of ‘material negative revisions driven by weaker consumer demand’. They said that services already slowdown, and that they expect products to follow.
The report came out a day after Apple, itself, took a step back from its plan to produce more iPhones this year, compared to last years, as the Chinese demand for the new iPhone14 fell 11% in the first three days compared to last year. And Chinese stand for 1 out of 5 iPhone buyers. As a result, BoFA expects the iPhone14 cycle to be weaker, and the fact that people will buy more expensive Pro model won’t make up for the revenue loss of selling less iPhones overall.
Elsewhere, Facebook’s Meta joined the others in announcing job cuts.
But **unfortunately** for the Fed, the US jobless claims came below 200’000 last week. There are not enough people losing their jobs to stop the financial bleeding in the world.
The dollar down
One interesting thing about yesterday’s price action was that... the US dollar sharply eased despite the hawkish messages thrown to our faces by the pitiless Fed members.
Some believe that the Bank of England (BoE) intervention may have played a role in the softening dollar, others think that the fact that the European Central Bank (ECB) gets more aggressive helps taming the dollar rally. But some others point that yesterday’s dollar selloff could simply have to do with the Chinese selling dollars to buy the yuan to tackle the relentless appreciation in the US dollar.
Bailey could become a national hero, or a disaster
The British pound recovered above the 1.11 mark against the US dollar yesterday. Could the pound rebound sustainably, or is this just a fake alert?
I genuinely believe that sterling could recover sustainably if the BoE plays a good game. The BoE has a very hard task now: it must deal with the globally higher inflation – which requires a tight monetary policy, and it must deal with Liz Truss - and her spending that the market doesn’t want to finance - which requires the BoE buying bonds.
But because the BoE can’t afford to loosen the monetary conditions – due to high inflation -, the BoE’s bond buying will lead to steeper rate hikes in the UK to compensate the surprise QE.
Investors now expect 125-150bp hike at the BoE’s next meeting. And Bailey has no choice but to deliver, if he wants to gain investors’ confidence – that the government lost big time.
So, at the end of this process, either Andrew Bailey – who has been quite unpopular so far – will be a national hero, by keeping the UK sovereigns above water, gaining control over inflation and stabilizing sterling, or it will be a disaster for the UK.
Technical Outlook and Review
USD/JPY:
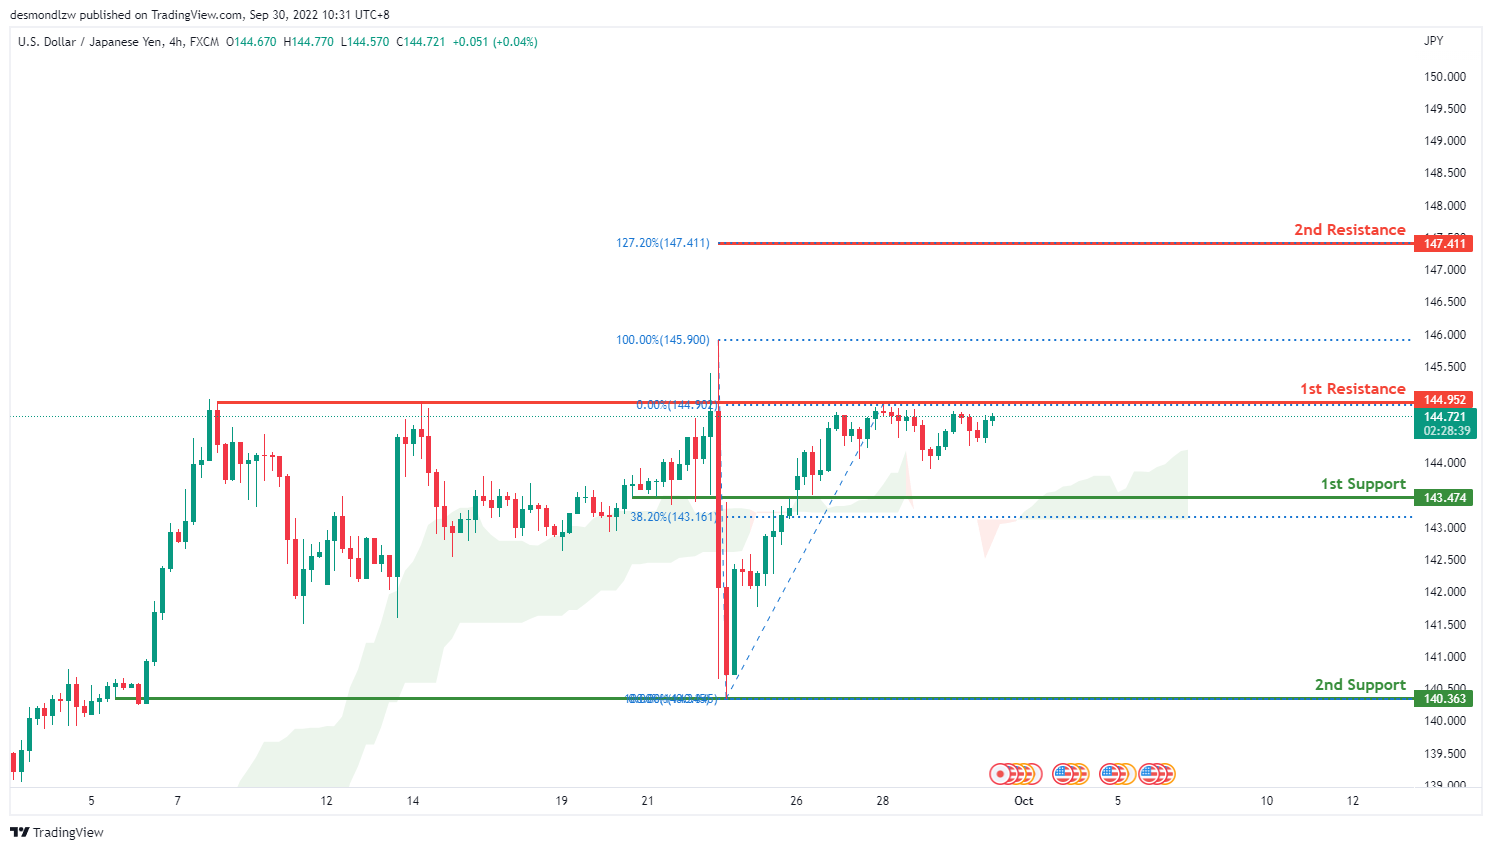
On the H4 chart, price has broken through the first support level at 143.474, where the 38.2% Fibonacci line is located. Price is currently consolidating near 144.952, the 0% Fibonacci line. Expect price to reflect back down from the first resistance level and towards the first support level. Price could also break through the first resistance and head towards the second resistance at 147.411 where the 127.2% Fibonacci expansion extension line is.
Areas of consideration:
- H4 time frame, 1st resistance at 144.952
- H4 time frame, 1st support at 143.474
DXY:
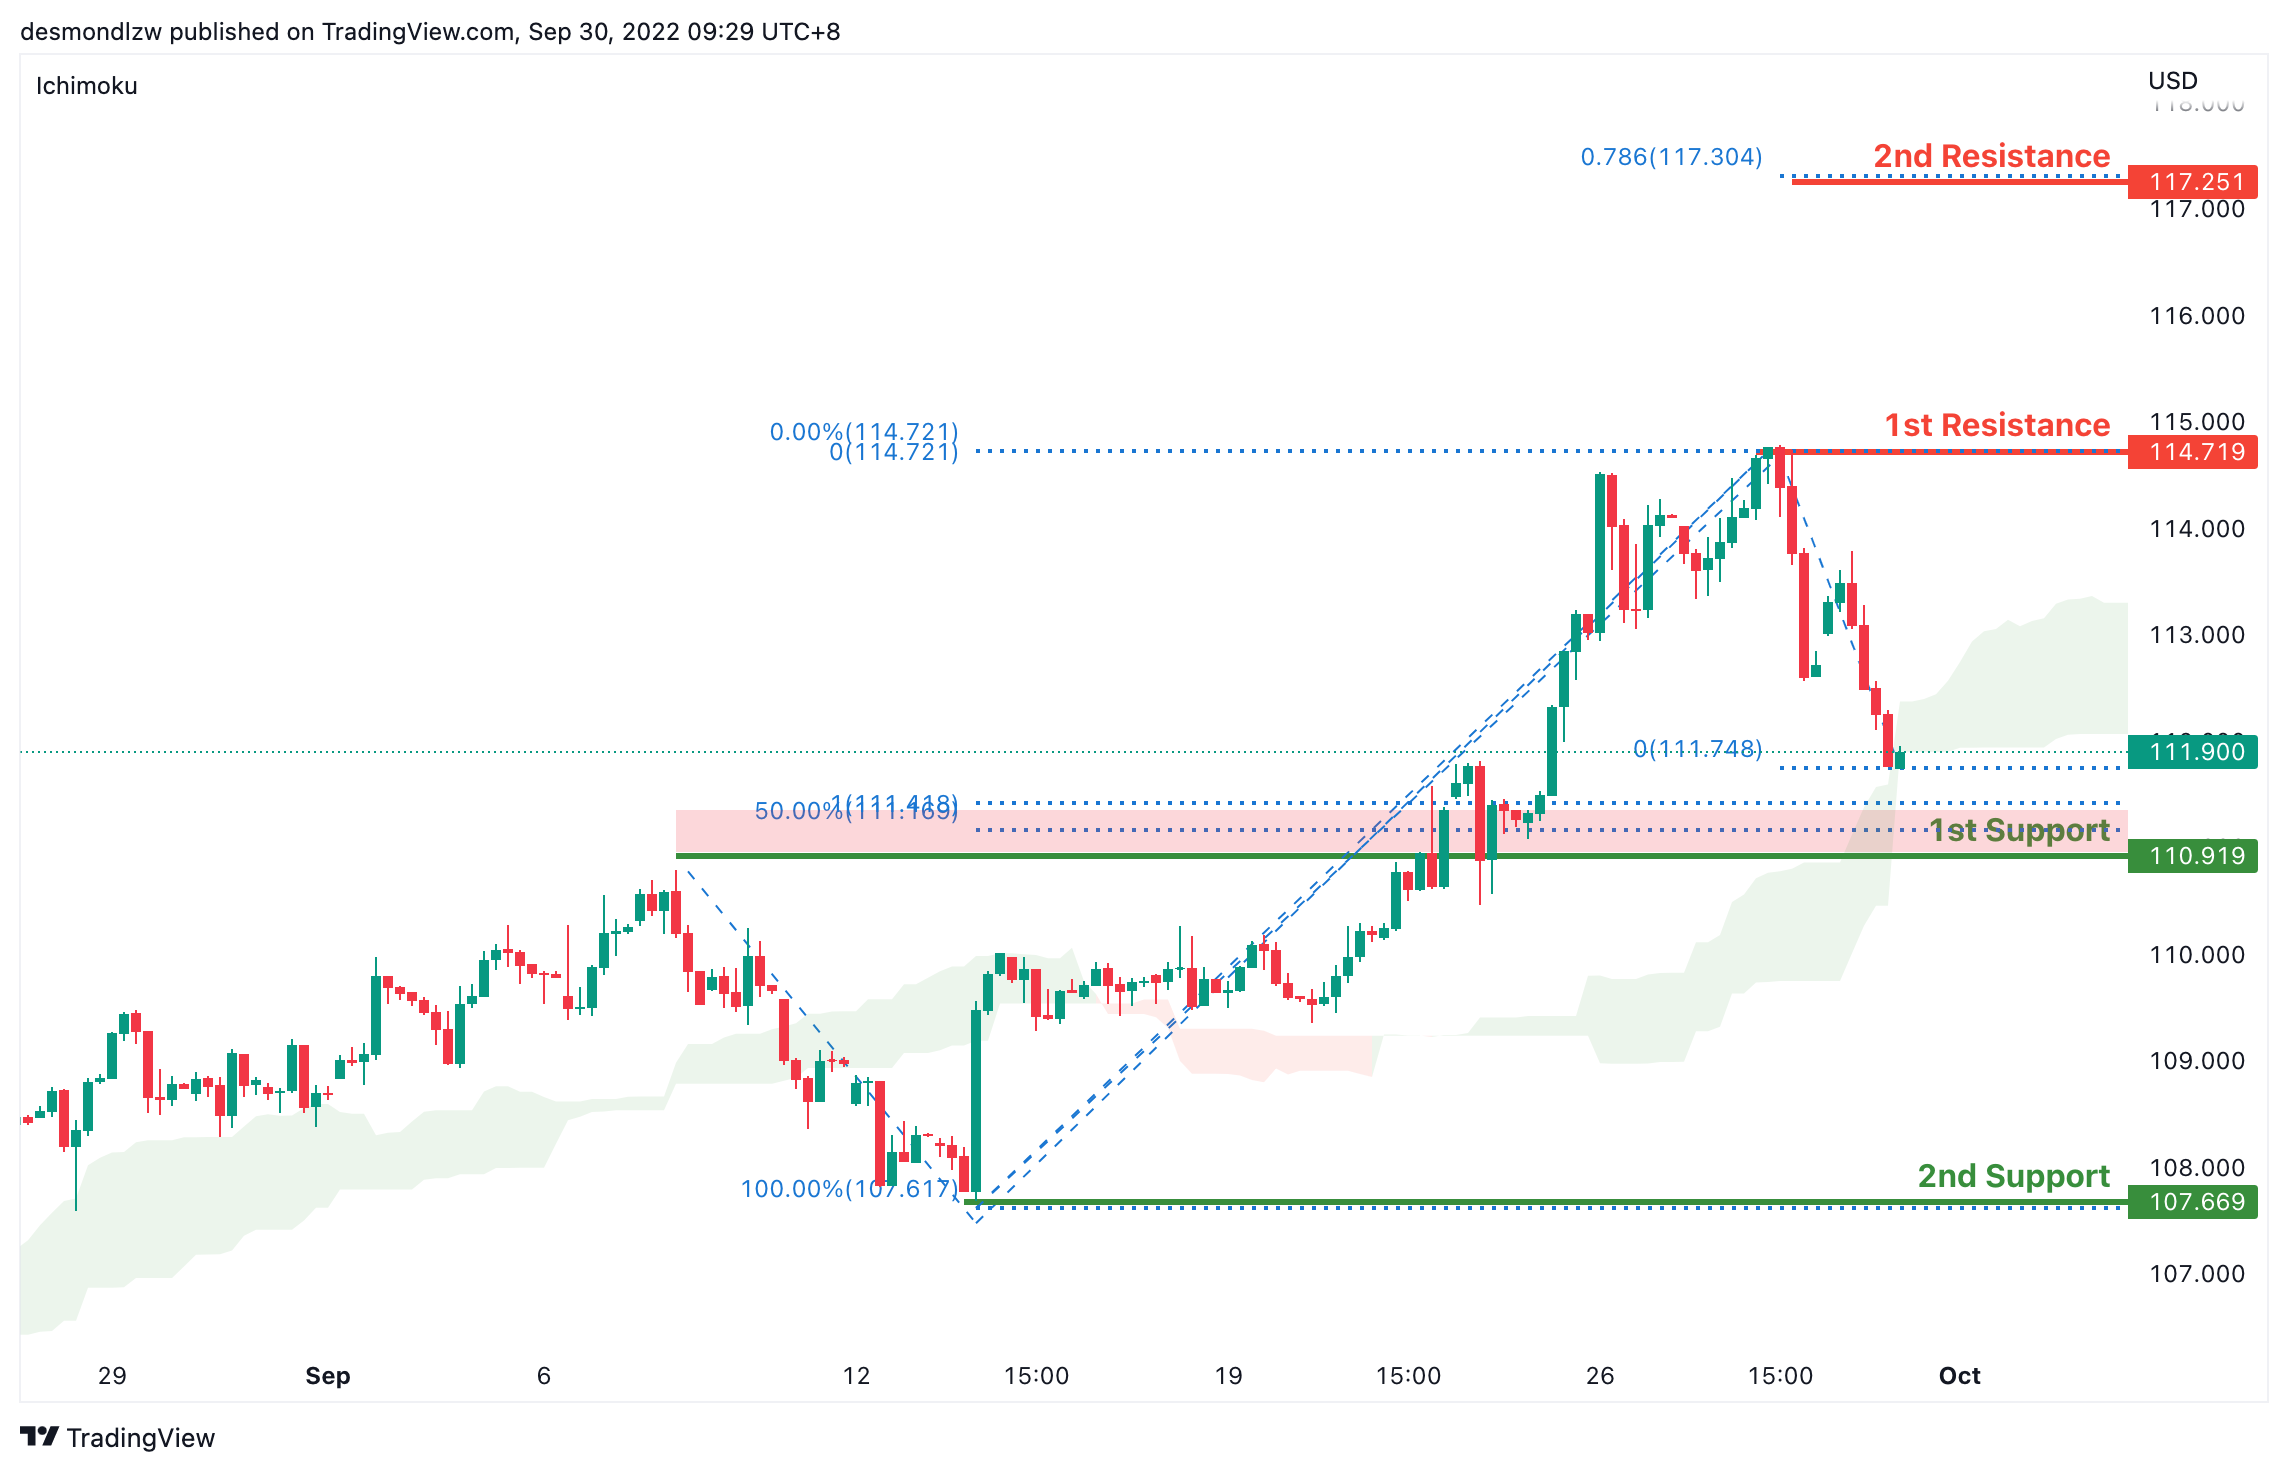
On the H4, price has broken the ichimoku and has pulled back slightly forming a double top- we are bearish bias. Price has rejected the first resistance and pulled back to test the first support at 110.919 where the 50% retracement and 100% projection sits. If price breaks this support it should test the second support at 107.669 where the previous swing low sits. Alternatively price could test the first resistance again at 114.719 levels where the previous swing high sits and if it breaks this level, price might test the second resistance at 116.507 where the 78.6% projection sits.
Areas of consideration:
- H4 time frame, 1st resistance at 114.719
- H4 time frame, 1st support at 110.919
EUR/USD:
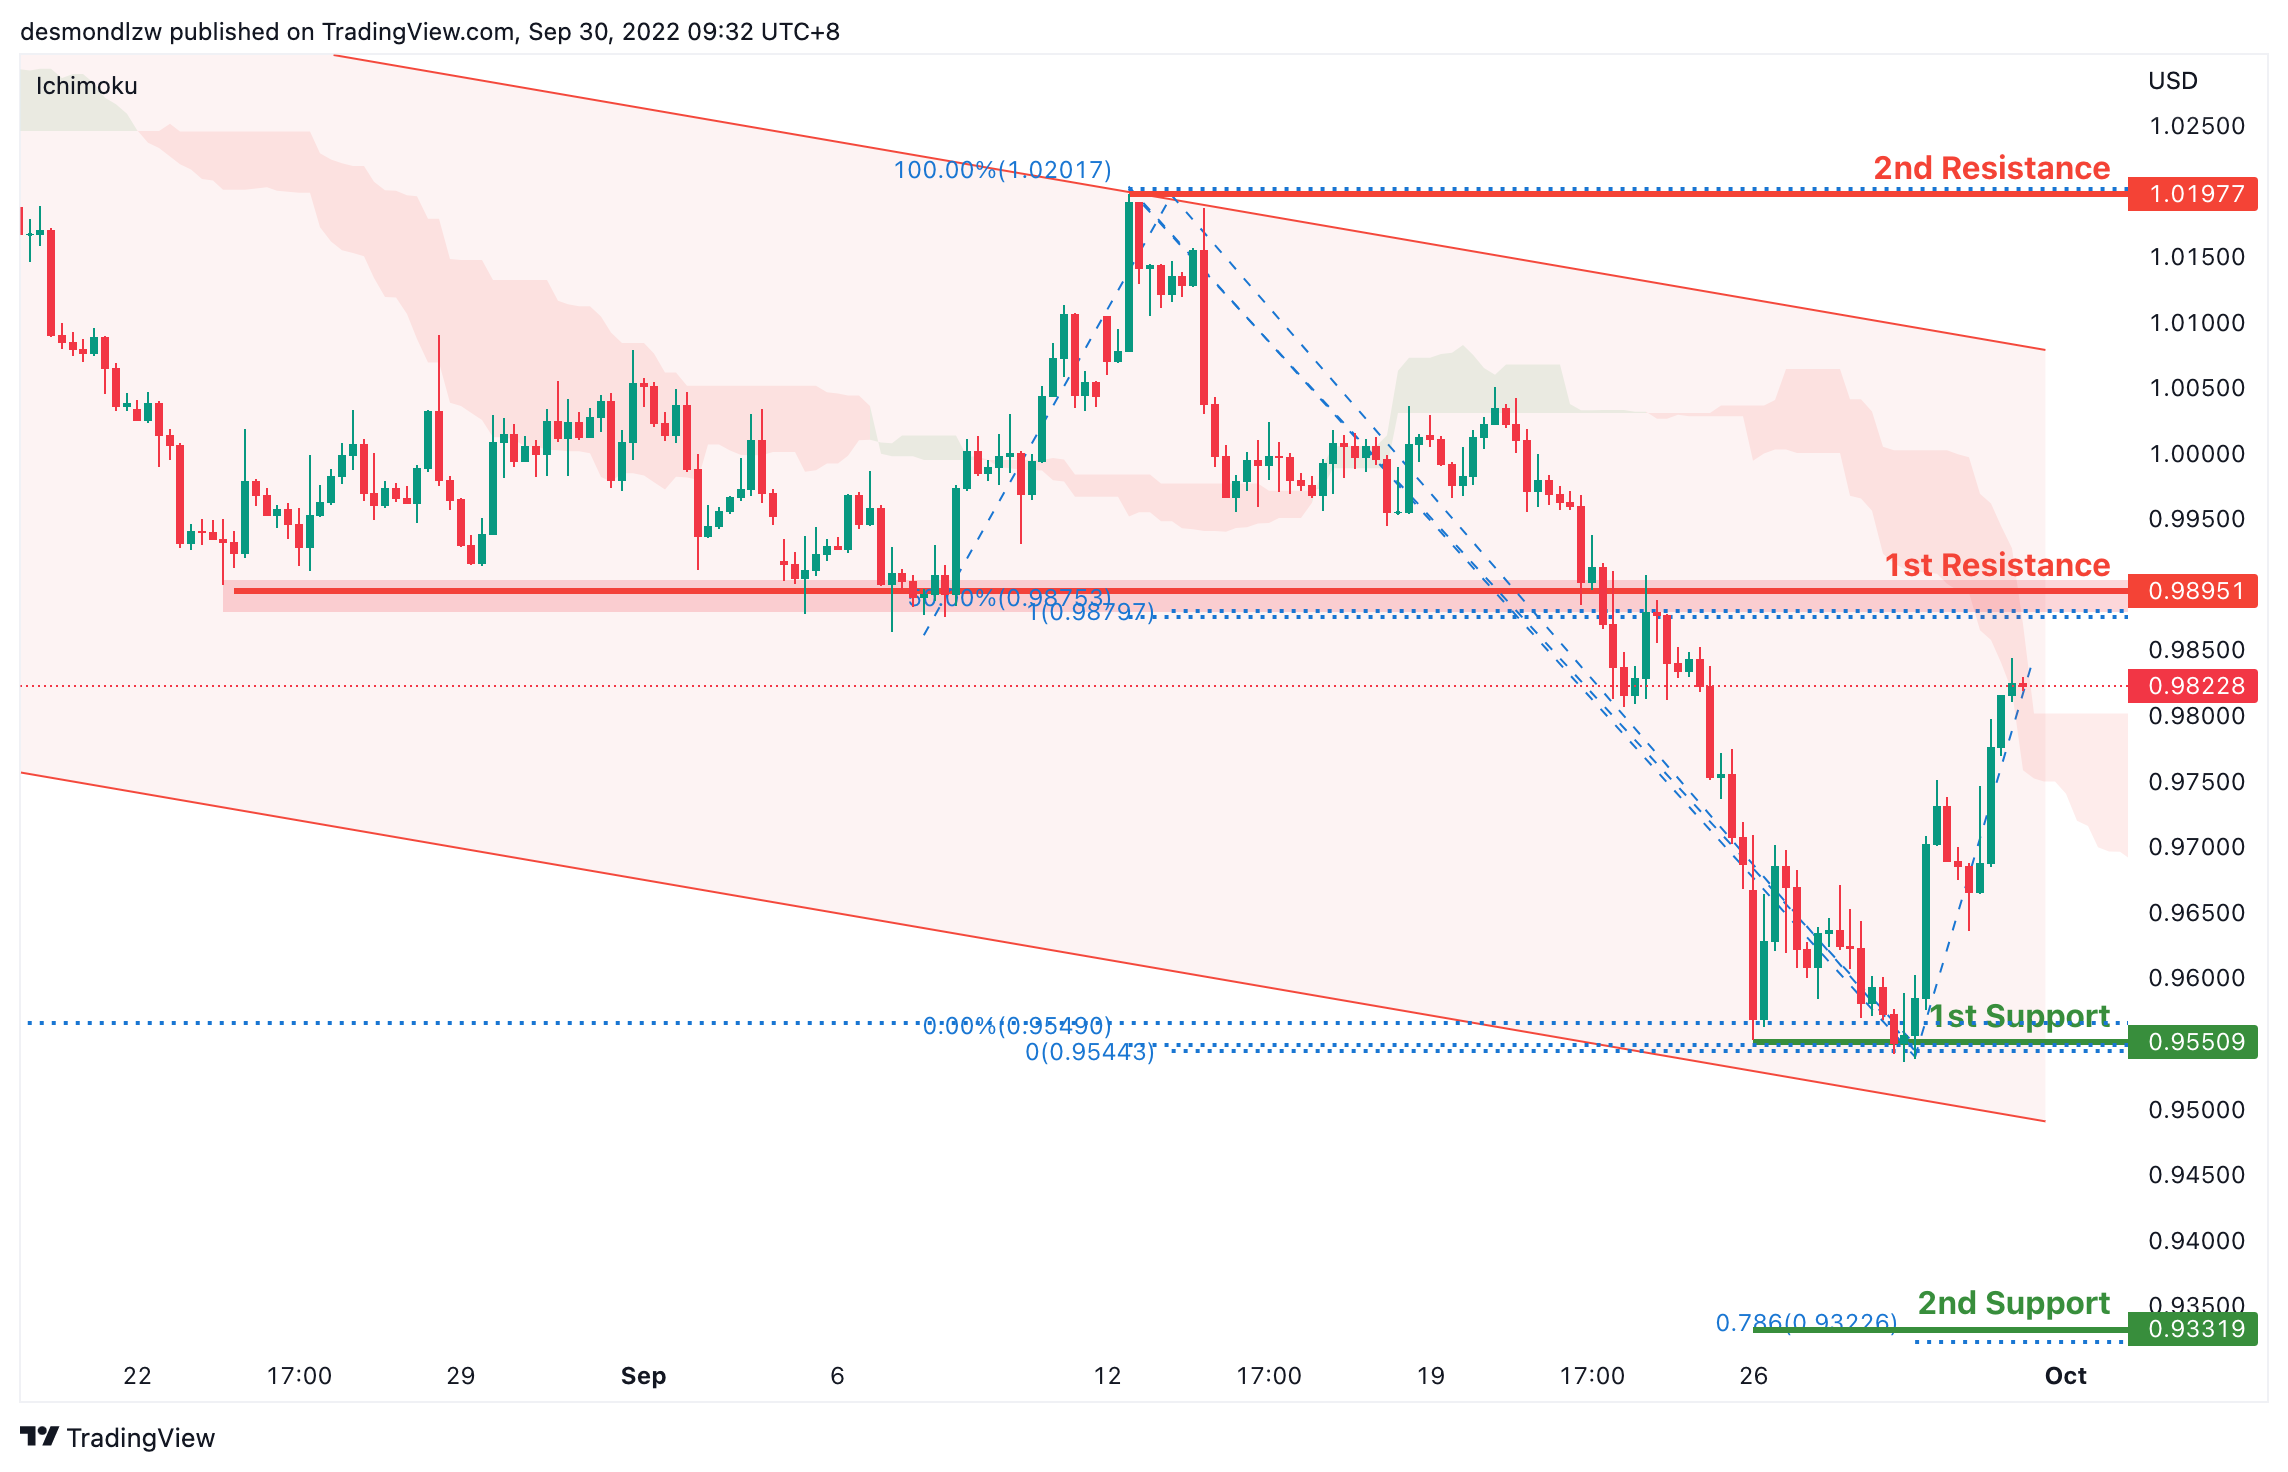
On the H4, price is moving within the channel but in an ascending manner- we are slightly bullish biased. Price has bounced off the first support and is moving toward the first resistance at 0.9895 where the 100% projection and 50% retracement sits. If price breaks this level, it will test the second resistance at 1.0197 where the previous swing high sits. Alternatively, the overall bearish momentum should bring price back to test the first support at 0.9550 where the previous swing low and 161.8% extension sits. If it breaks this level, we have a strong bearish confirmation to bring price down to 0.9331 where the 78.6% projection sits
Areas of consideration :
- H4 1st resistance at 0.9895
- H4 1st support at 0.9550
GBP/USD:
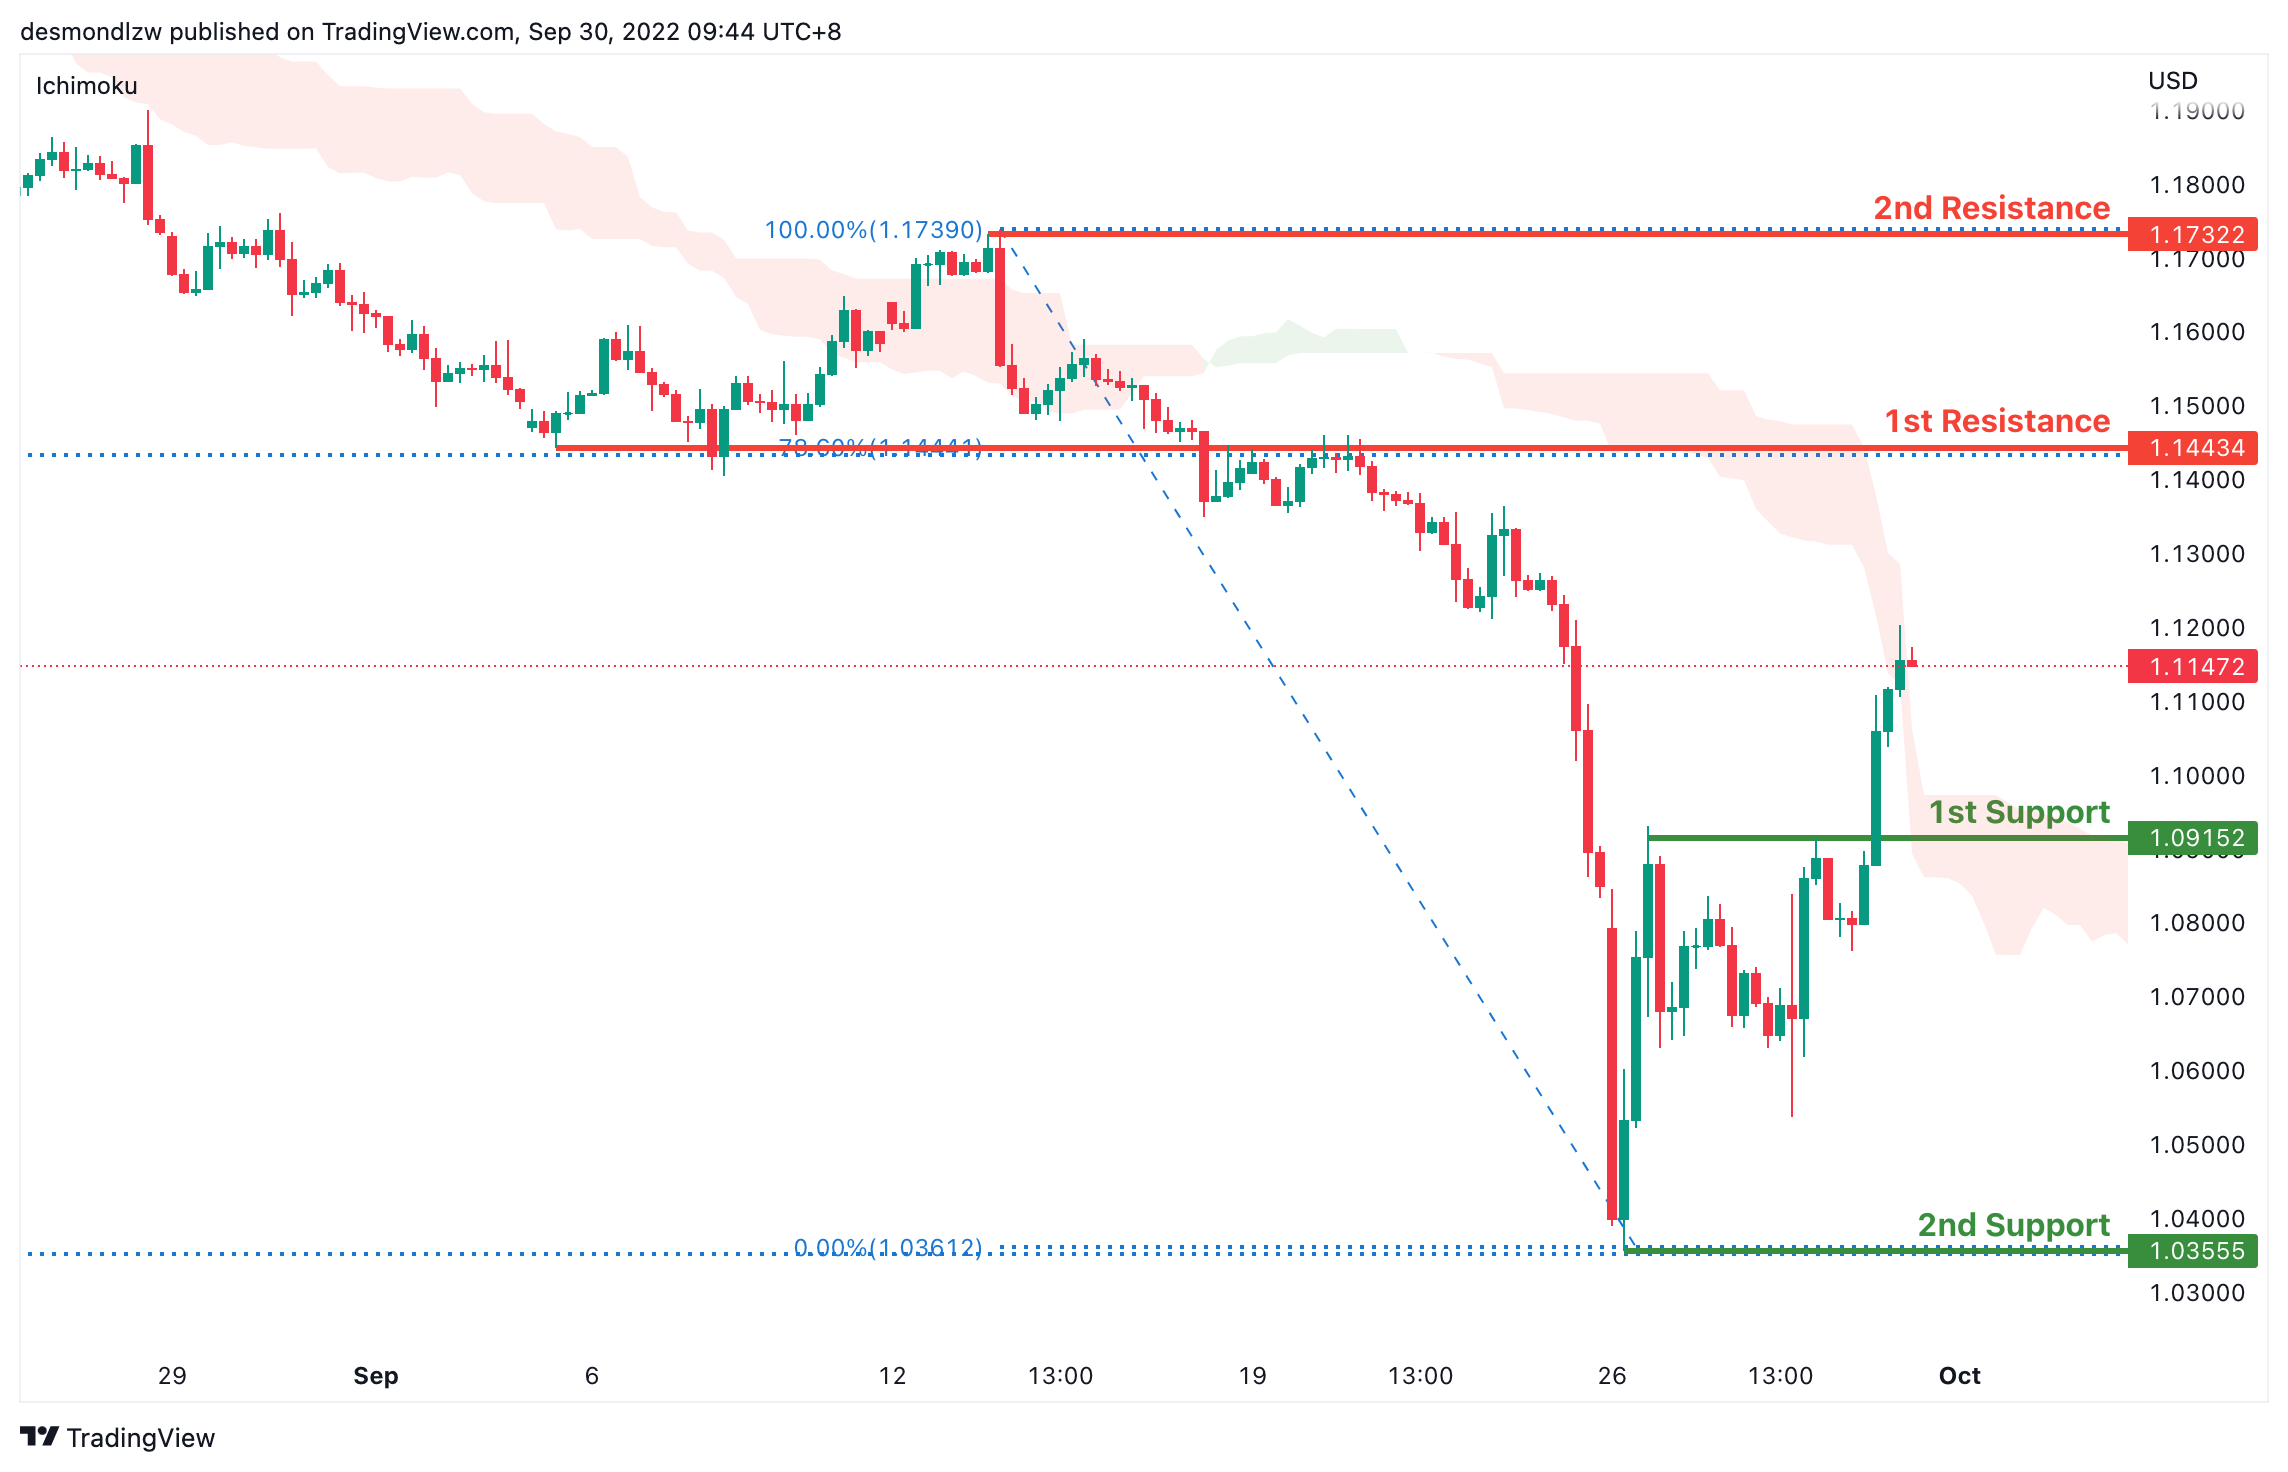
On the H4 time frame, prices have bounced off the support level and are moving in an ascending manner, we are slightly bullish. Price is moving toward the first resistance at 1.1443 where the 78.6% retracement and overlap support sits. If it breaks this level, its bullish momentum will bring price to second resistance at 1.7322 where the previous swing high sits. Alternatively, price could pull back to test the first support at 1.0915 where the 38.2% retracement sits then the second resistance at 1.0355 where the previous swing low and 138.2% extension sits
Areas of consideration:
- H4 1st resistance at 1.1443
- H4 1st support at 1.0915
USD/CHF:
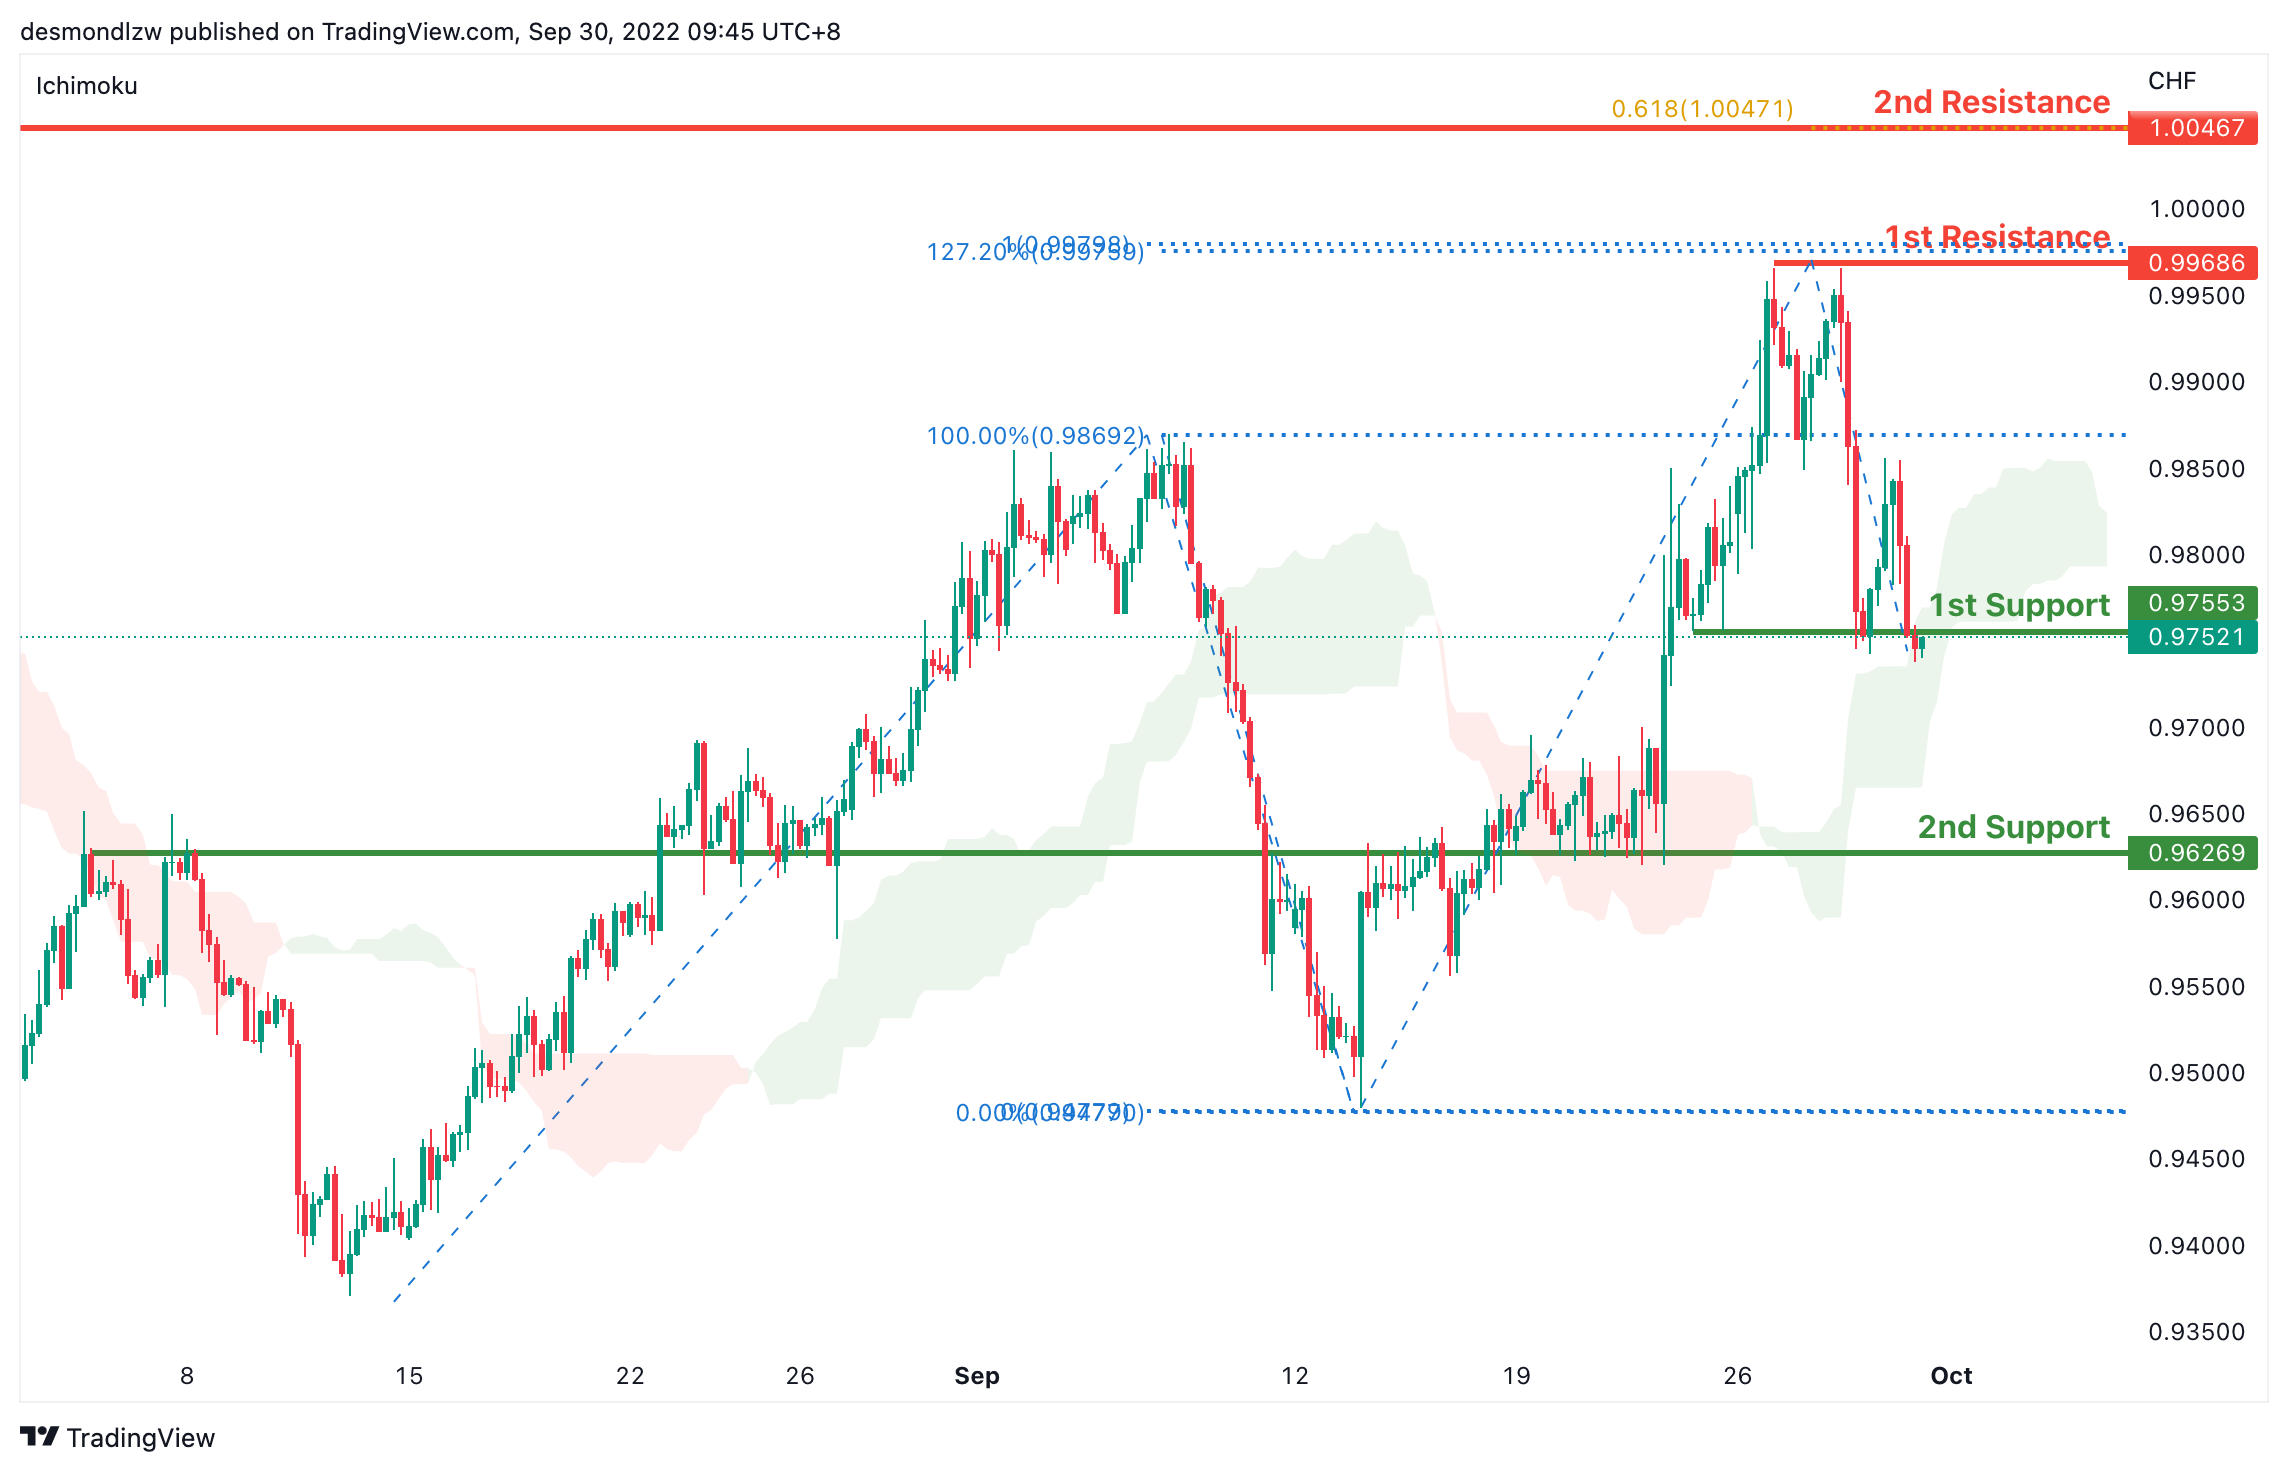
On the H4, prices have broken the ichimoku and in a descending manner hence we are bearish biased. Price is testing at the first support of 0.9755, if it breaks this level, we have a bearish confirmation to bring price further down to the second support at 0.9626 where the key overlap support sits. Alternatively, price could pull back to test the first resistance at 0.9968 where the 100% projection,127.2% extension and swing high sits. If bullish momentum continues, it should bring price to the second resistance at 1.0046 where the 61.8% projection and previous swing high sits.
Areas of consideration
- H4 1st support at 0.9755
- H4 1st resistance at 0.9968
XAU/USD (GOLD):
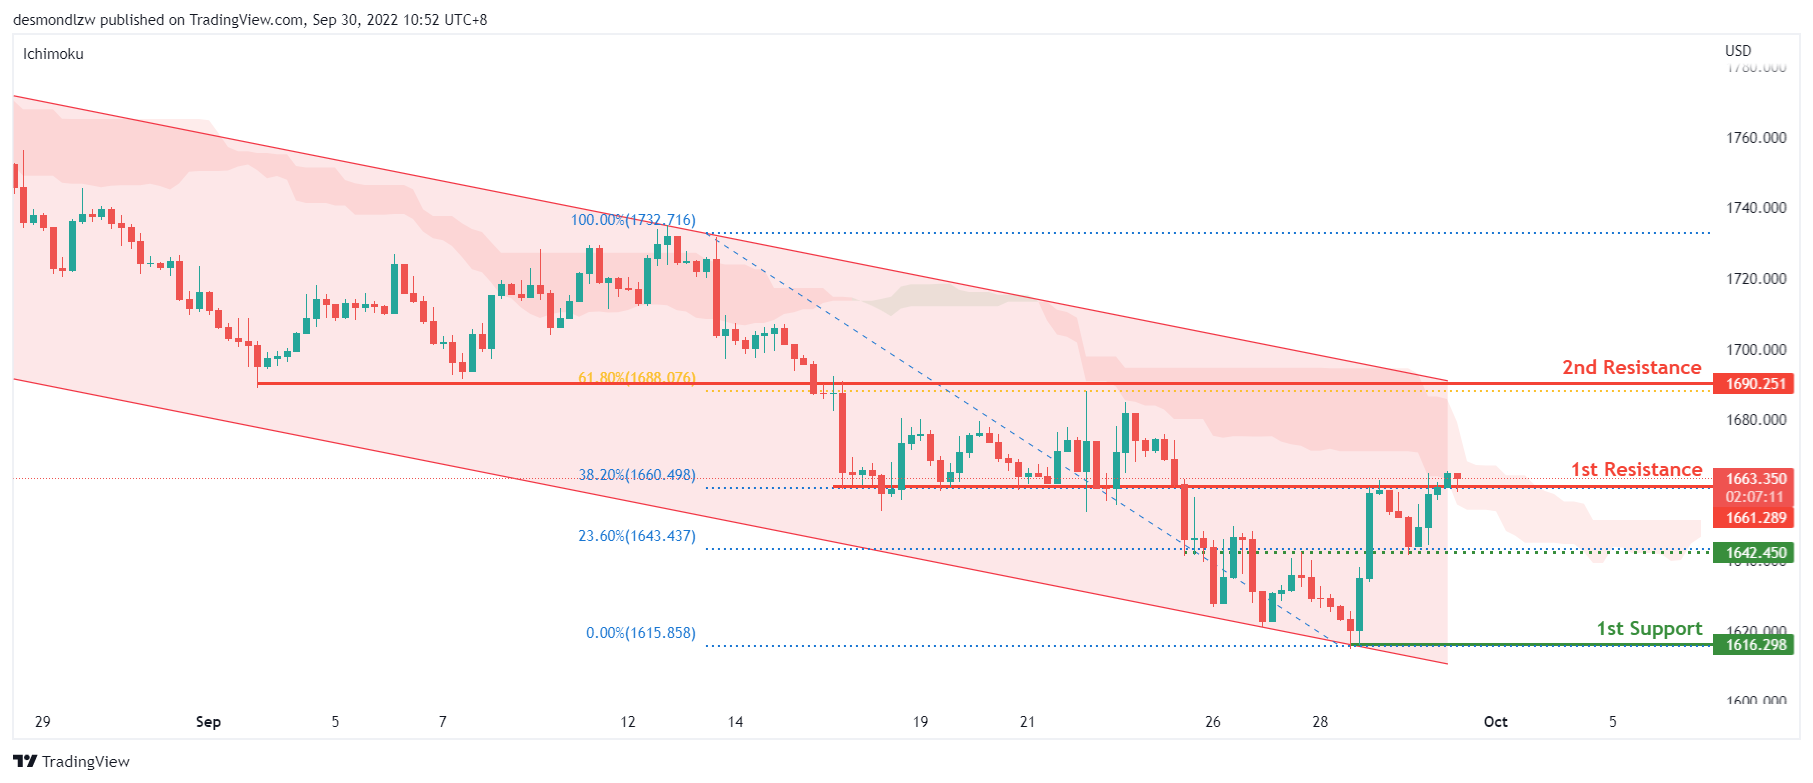
On the H4, price is retracing from the 1st support of 1616 and within the bearish channel. However, price has moved into the ichimoku cloud which leads to a slight bullish bias that price may continue trading higher towards the 2nd resistance level of 1690 which is in line with the 61.80% fibonacci retracement level. Alternatively, price could trade lower to test the top of the 1st support level of 1616, which a risk level at 1642 which is in line with the 23.60% fibonacci retracement level.
Areas of consideration:
- H4 time frame, 1st resistance at 1663
- H4 time frame, 2nd resistance at 1690
- H4 time frame, 1st support at 1616
AUD/USD:
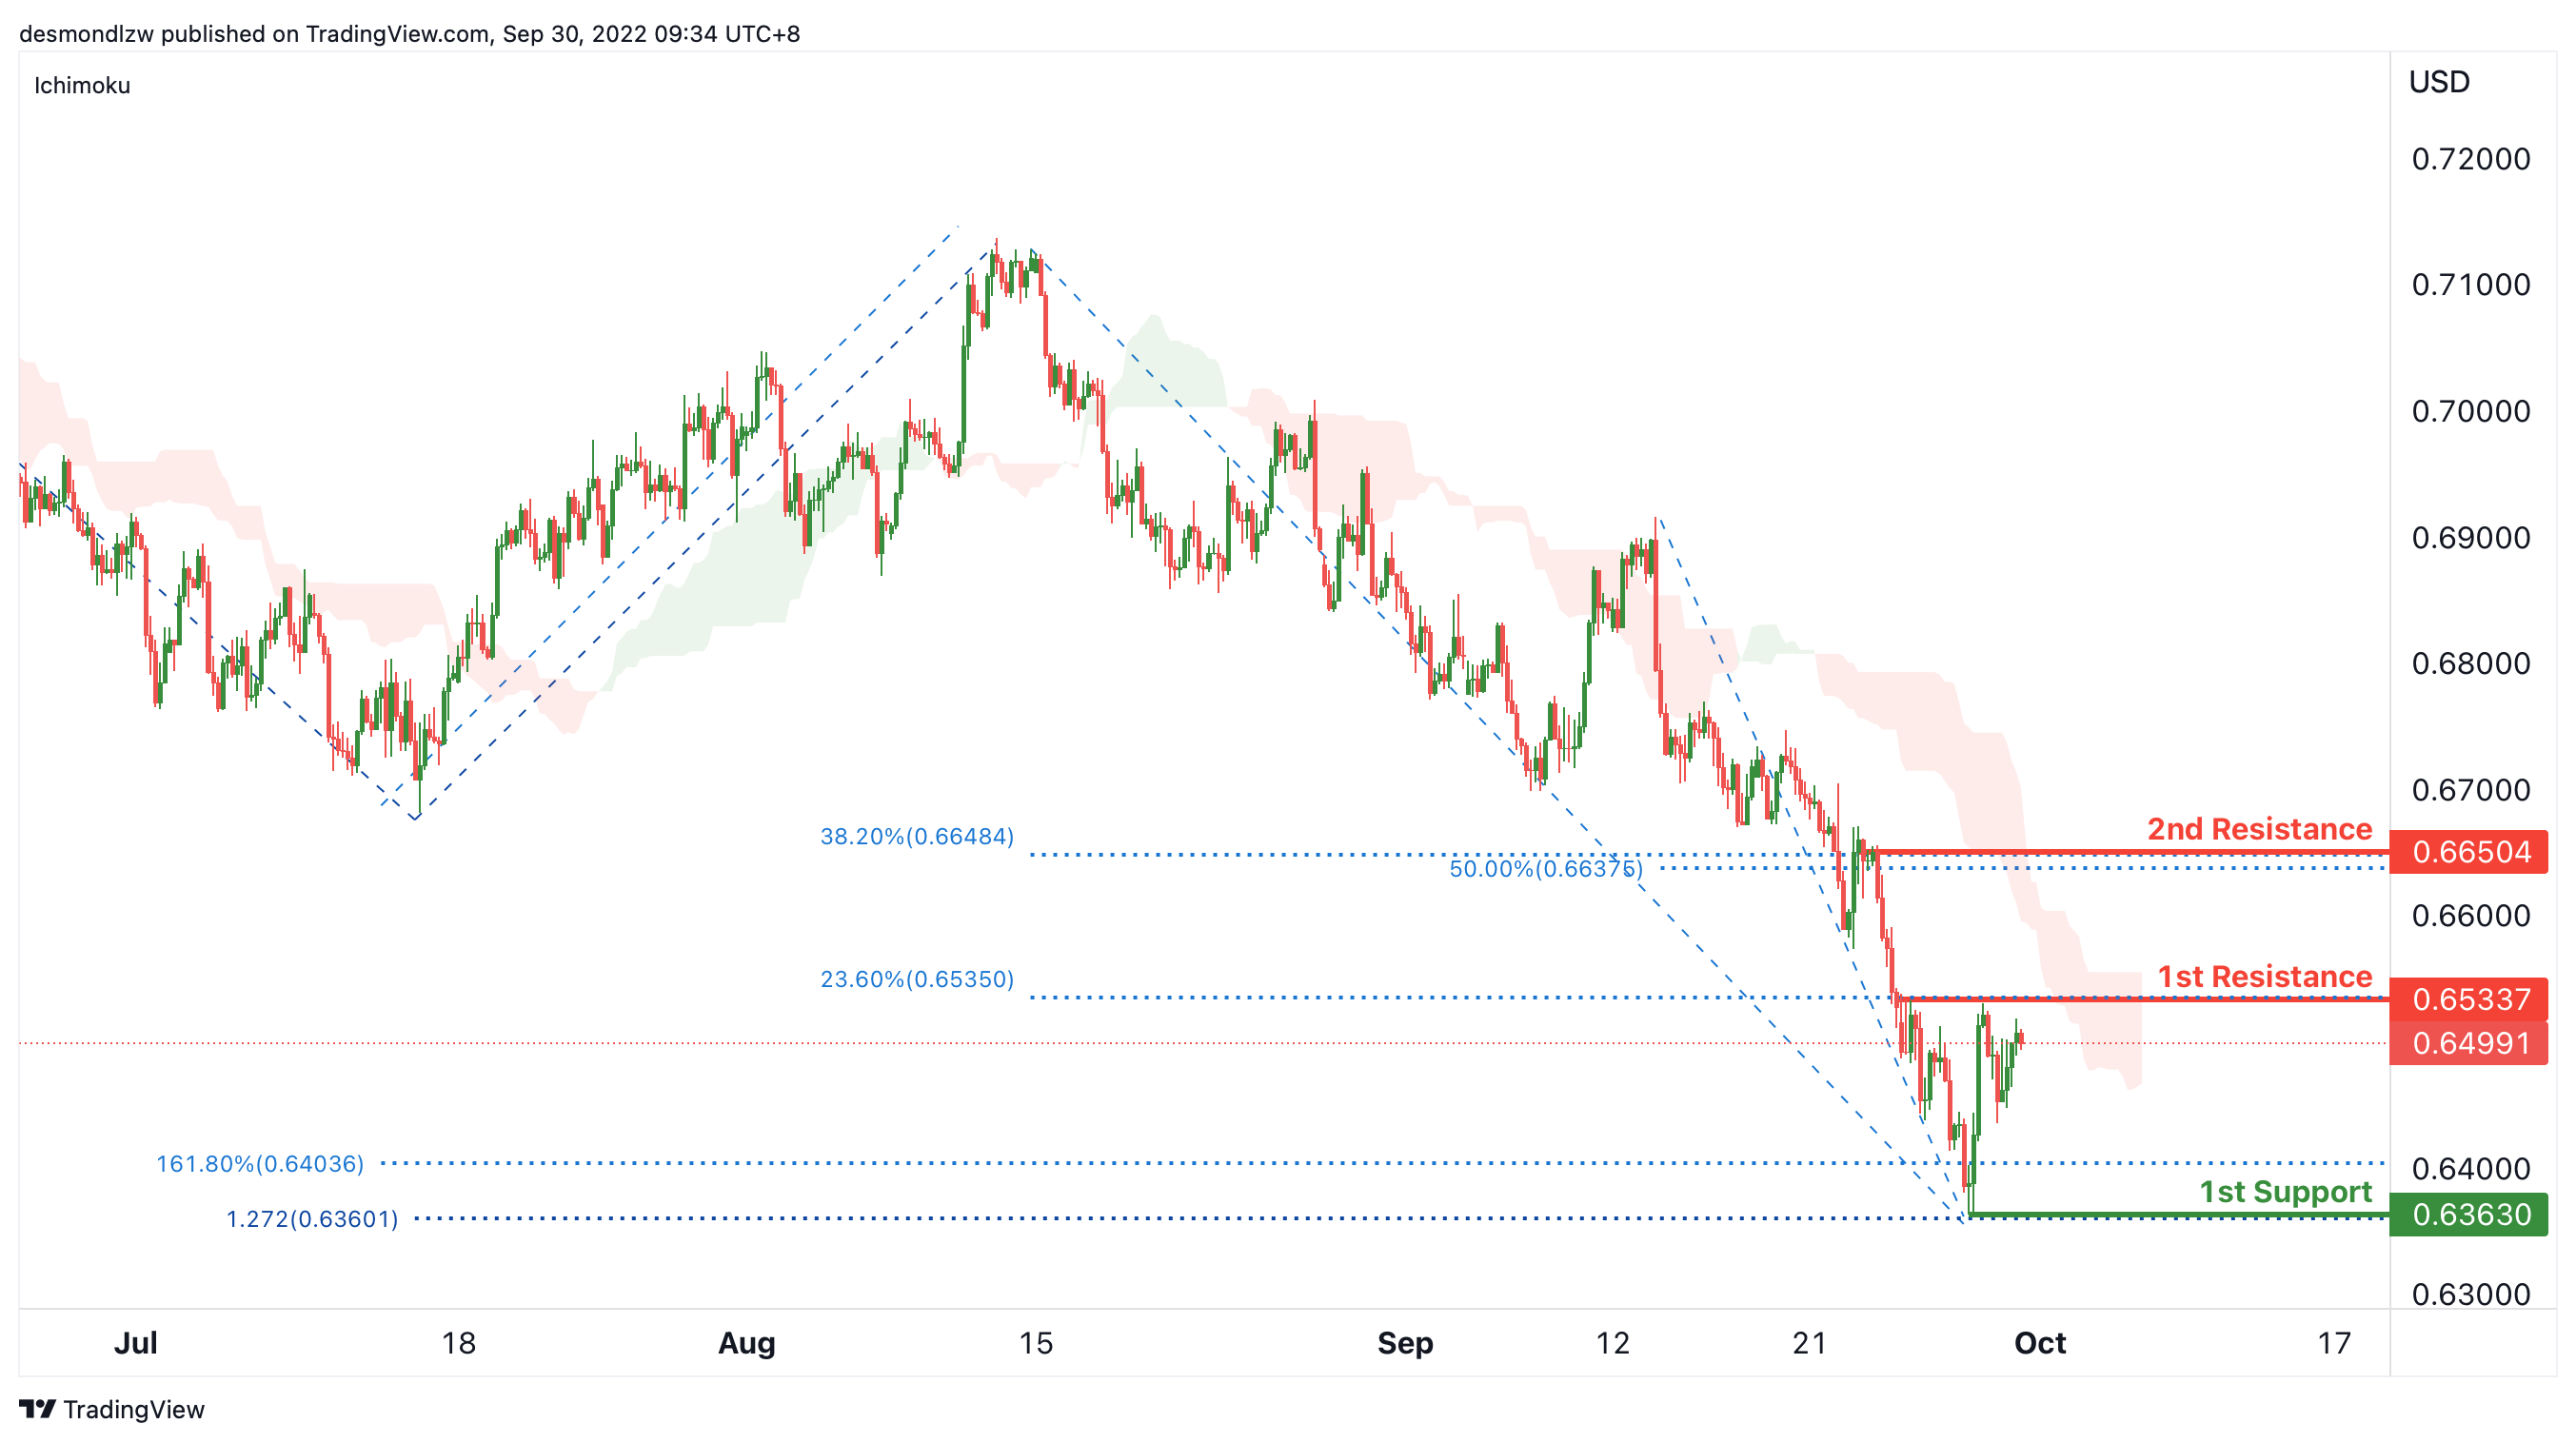
On the H4, the price is moving in a strong bearish trend. To add on confluence to this bias, price is below the Ichimoku cloud which indicates a bear market. Currently, the price is testing the 1st resistance at 0.65337, which is in line with the 23.6% fibonacci retracement. The price may drop from here to the 1st support at 0.63630, which is in line with the swing low, 161.8% fibonacci extension and 127.2% fibonacci projection. Alternatively, the price may rise to the 2nd resistance at 0.66504, where the pullback resistance, 50% and 38.2% fibonacci retracement are.
Areas of consideration
- H4, 1st resistance at 0.65337
- H4, 1st support at 0.63630
NZD/USD:
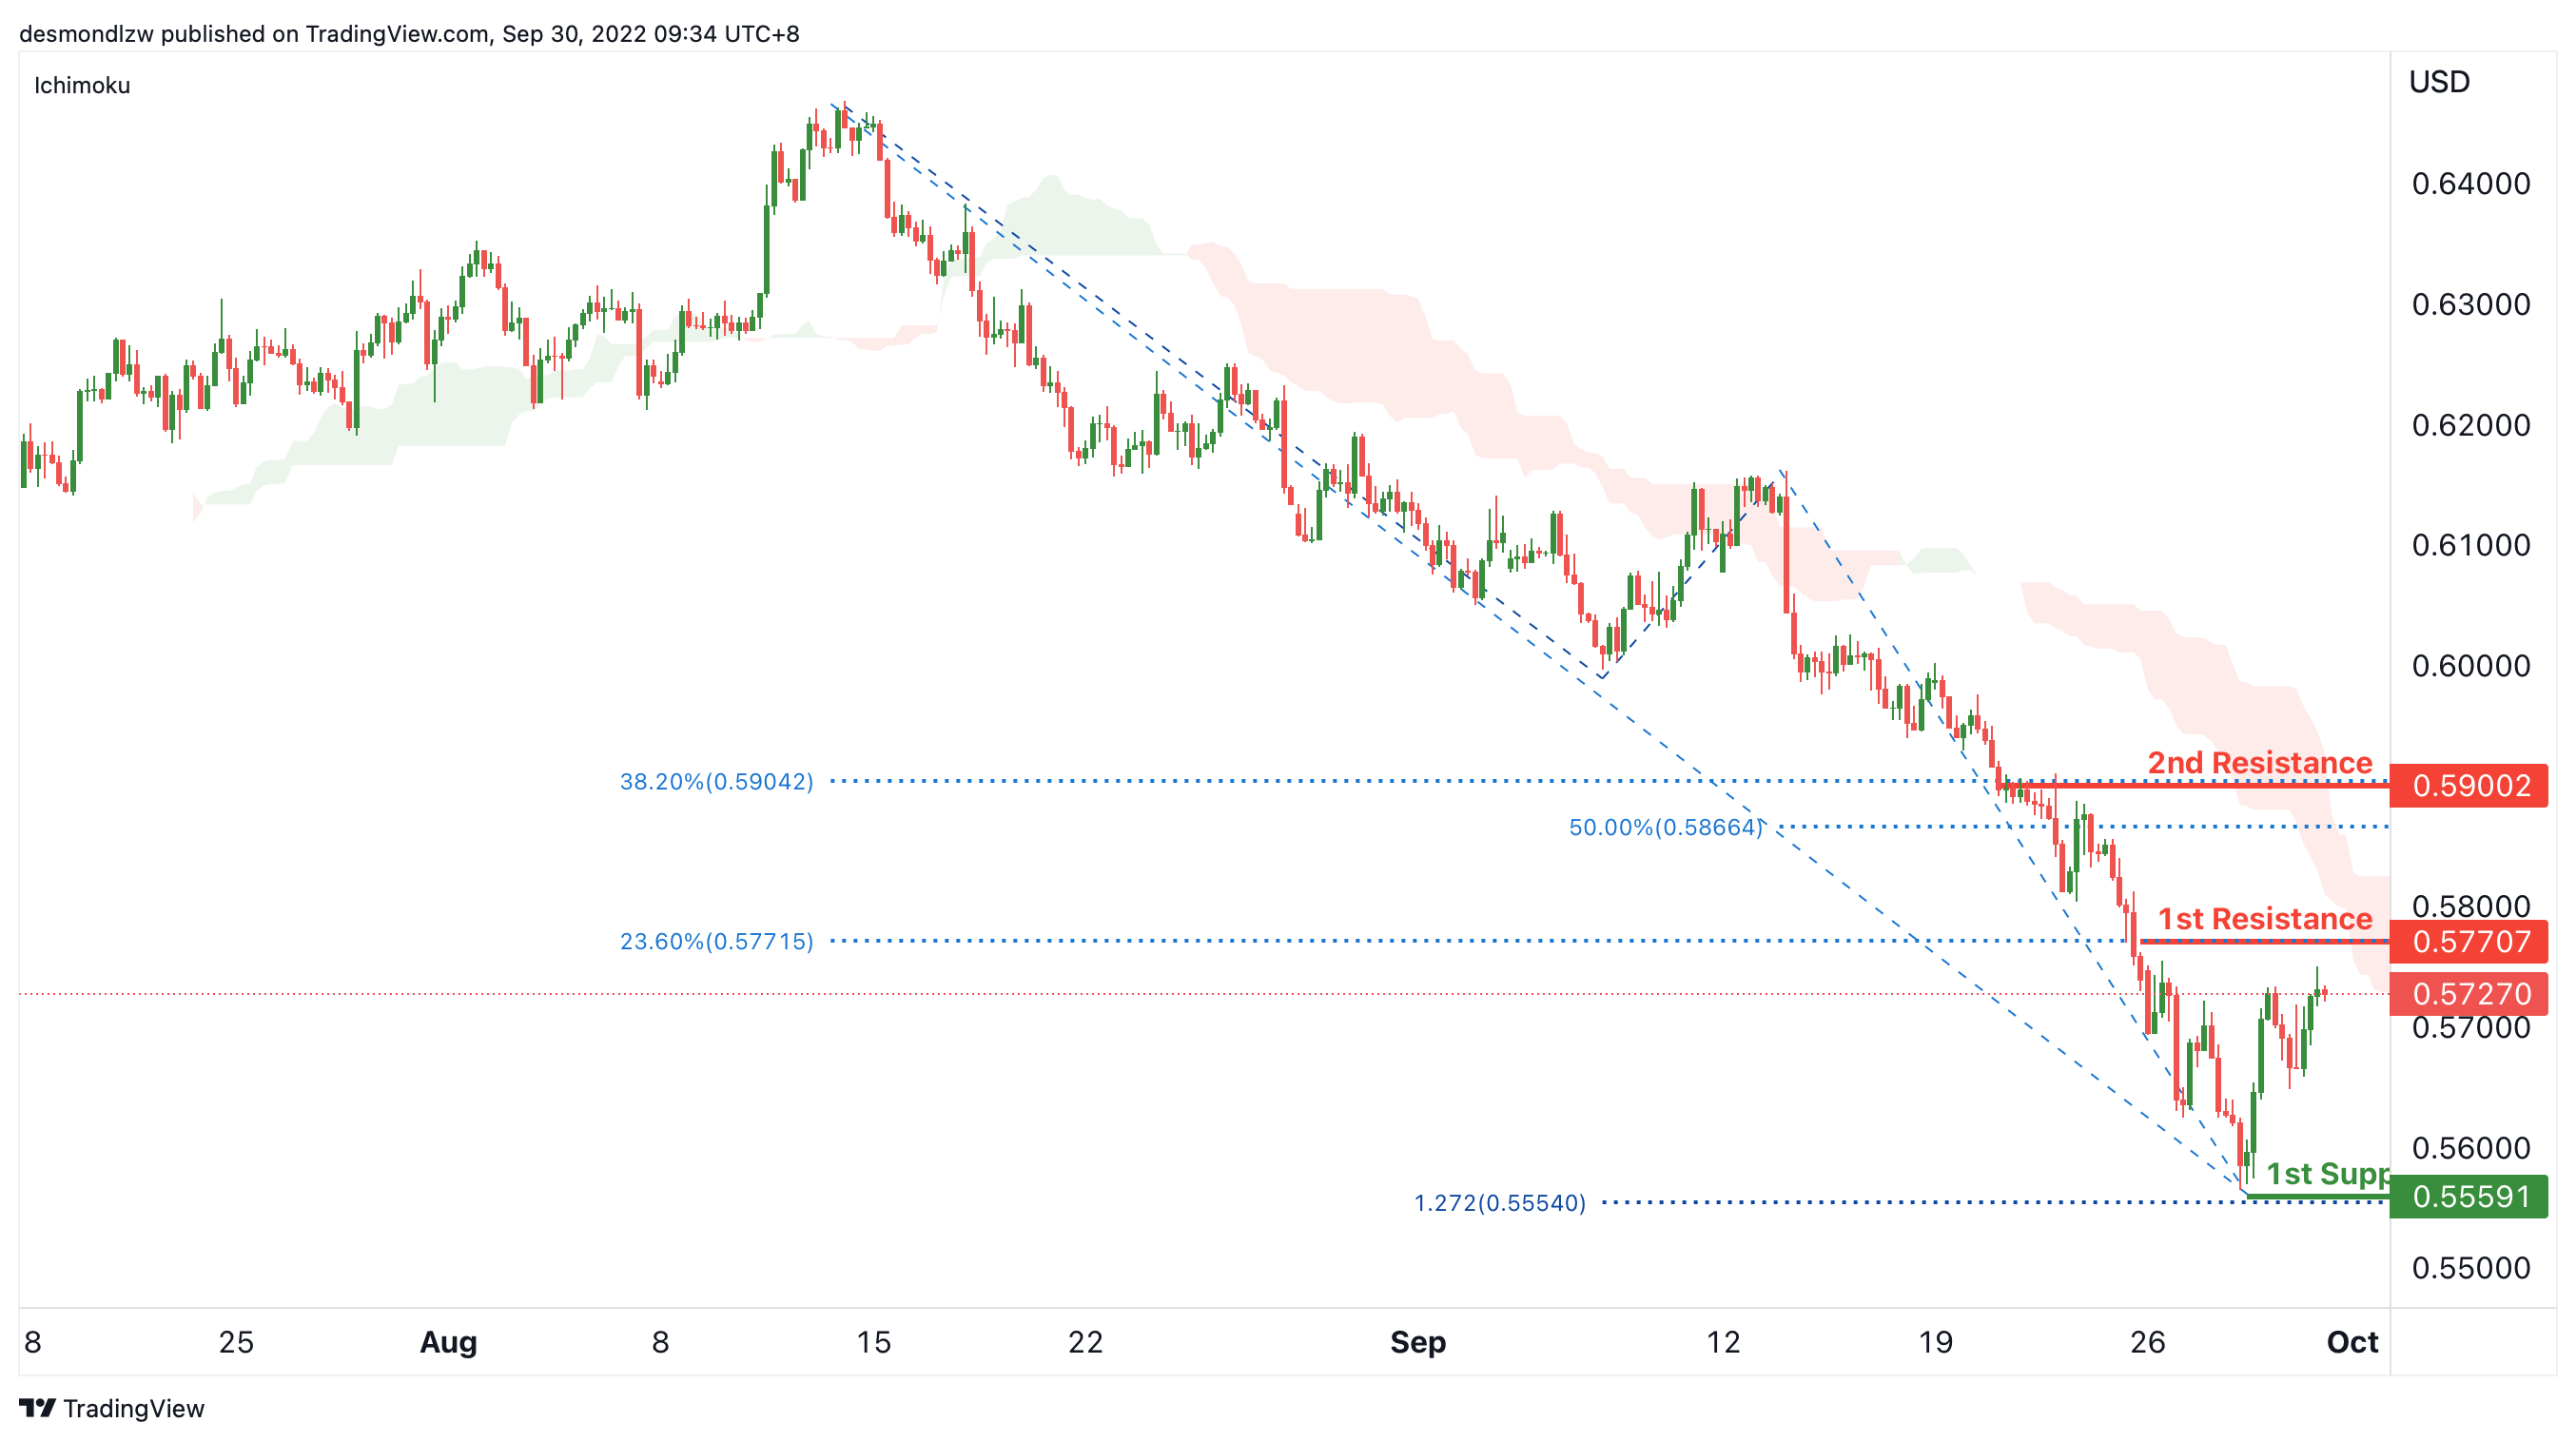
On the H4, with the price moving below the ichimoku cloud, we maintain a bearish bias that the price may test the 1st resistance at 0.57707, which is in line with the 23.6% fibonacci retracement and then drop to the 1st support at 0.55591, where the swing low and 127.2% fibonacci projection are. Alternatively, the price may break the 1st resistance and rise to the 2nd resistance at 0.59002, where the 38.2% and 50% fibonacci retracement are.
Areas of consideration:
- H4 time frame, 1st resistance at 0.57707
- H4 time frame, 1st support at 0.55626
USD/CAD:
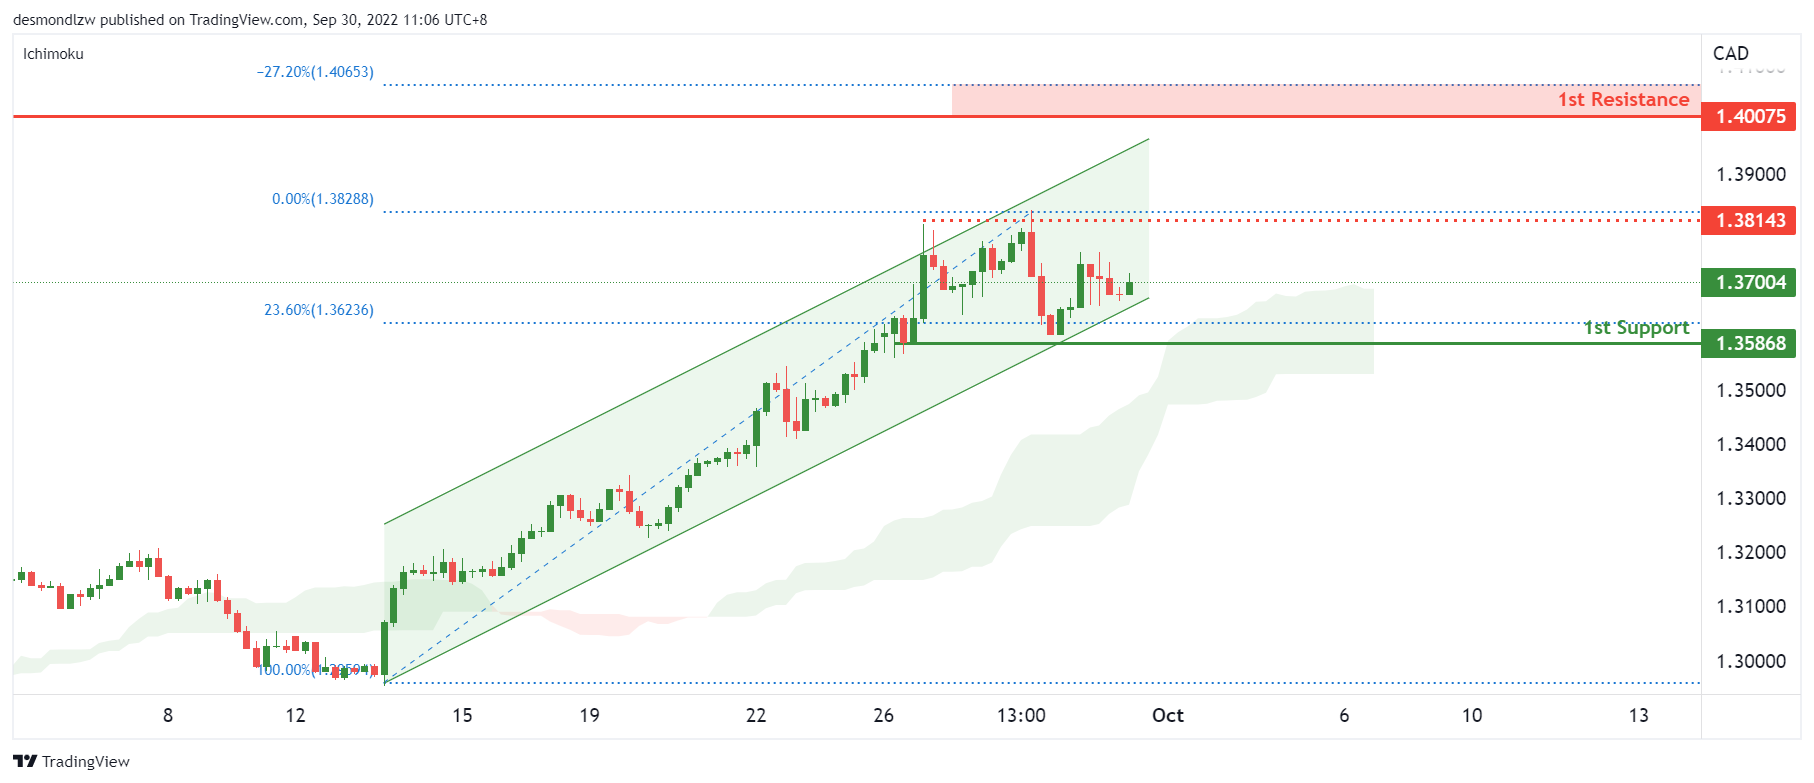
On the H4, the price retraced to the bottom of the ascending channel but maintains above the ichimoku cloud. We continue to have a bullish bias that price may rise to the 1st resistance at 1.40, which is in line with the 27.20% fibonacci expansion level and previous swing low from May 2020. However, there is a risk level at 1.3814 which was the previous swing high.
Areas of consideration:
- H4 time frame, 1st resistance at 1.40
- H4 time frame, 1st support at 1.3586
OIL:
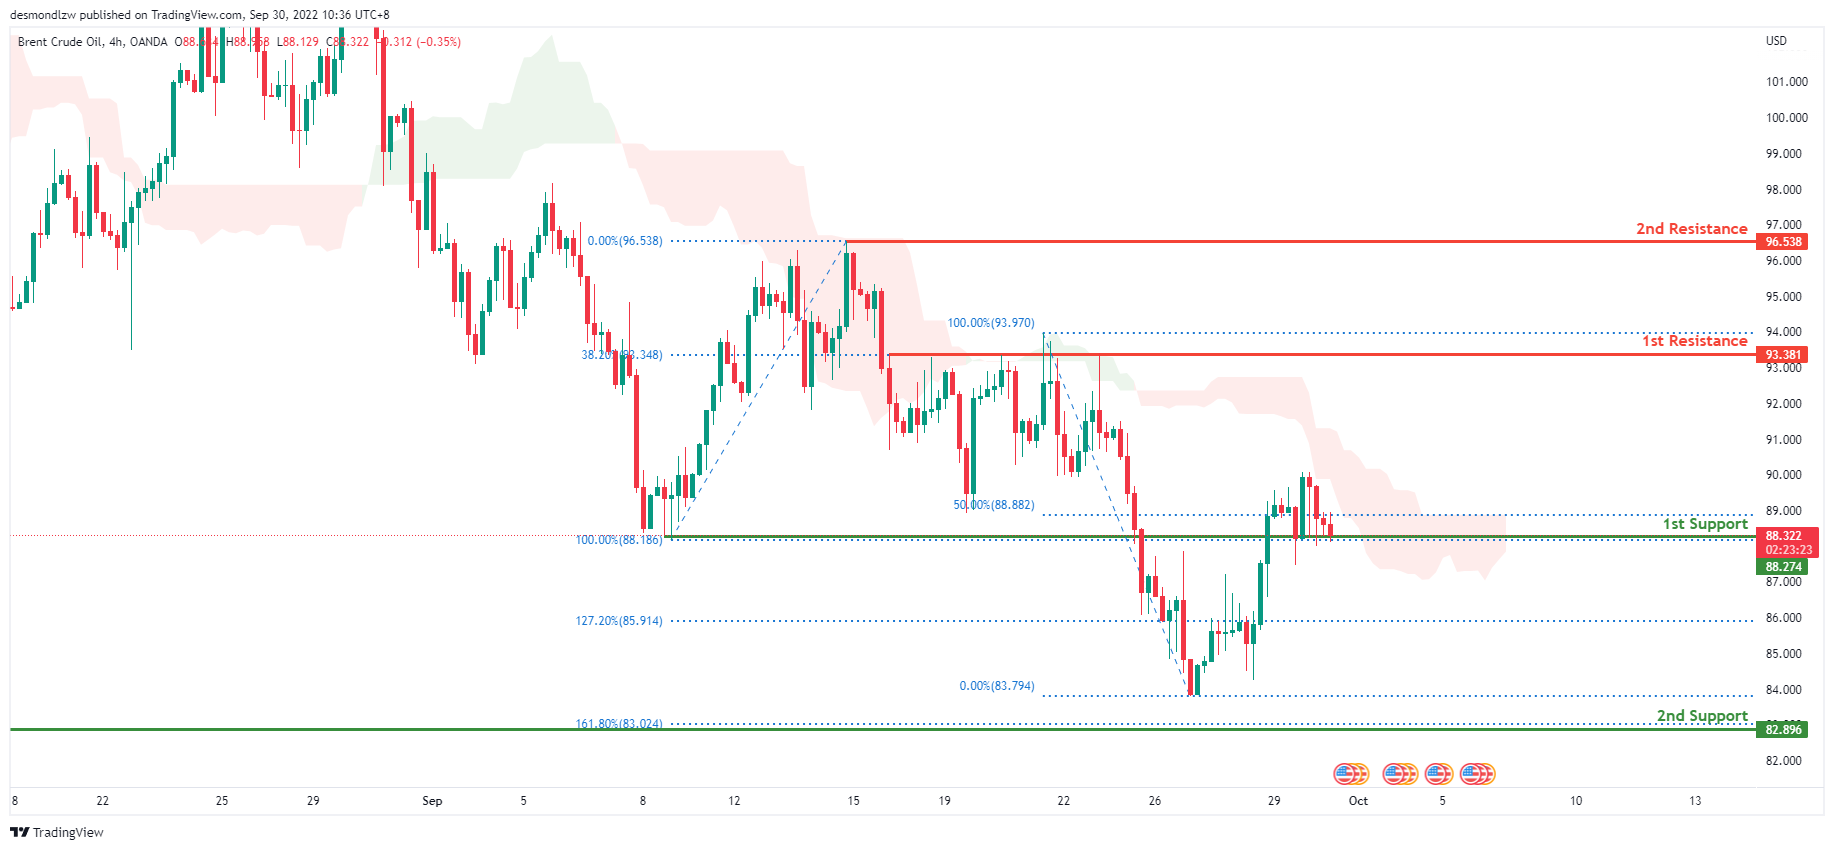
On the H4, oil is in a bearish trend, and the price is also below the ichimoku cloud, indicating a bear market. Price is currently consolidating along the first support level at 85.380, which corresponds to the 100% Fibonacci extension. Expect price to move to the first resistance level at 93.381, where the 38.2% Fibonacci extension line is.
Areas of consideration:
- H4 time frame, 1st resistance at 93.381
- H4 time frame, 1st support at 88.366
Dow Jones Industrial Average:
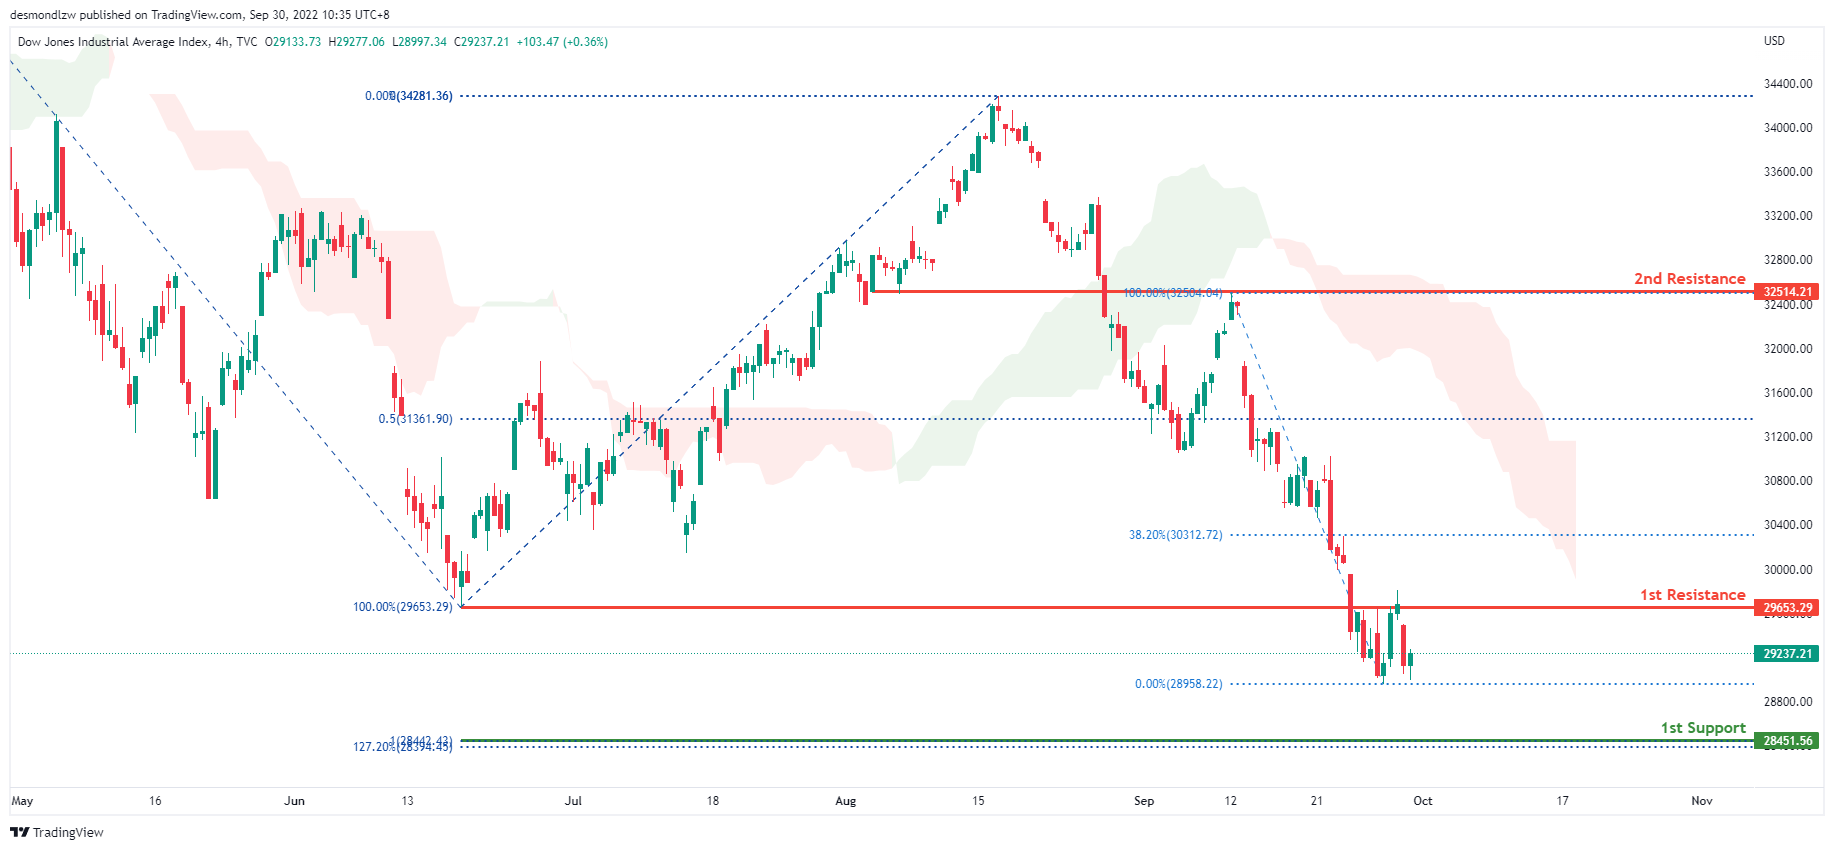
On the H4, the price is in a bearish trend. In addition, the price is below the ichimoku cloud, indicating a bearish market. Price has also broken through the first resistance level at 29653.29, which contains the 100% Fibonacci line and the previous swing low. Given the bearish momentum, price may return to the first support level at 28422.42, which contains the 100% Fibonacci projection line and the 127.2% Fibonacci extension line.
Areas of consideration:
- H4 time frame, 1st support at 28422.42
- H4 time frame, 1st resistance at 29653.29
DAX:
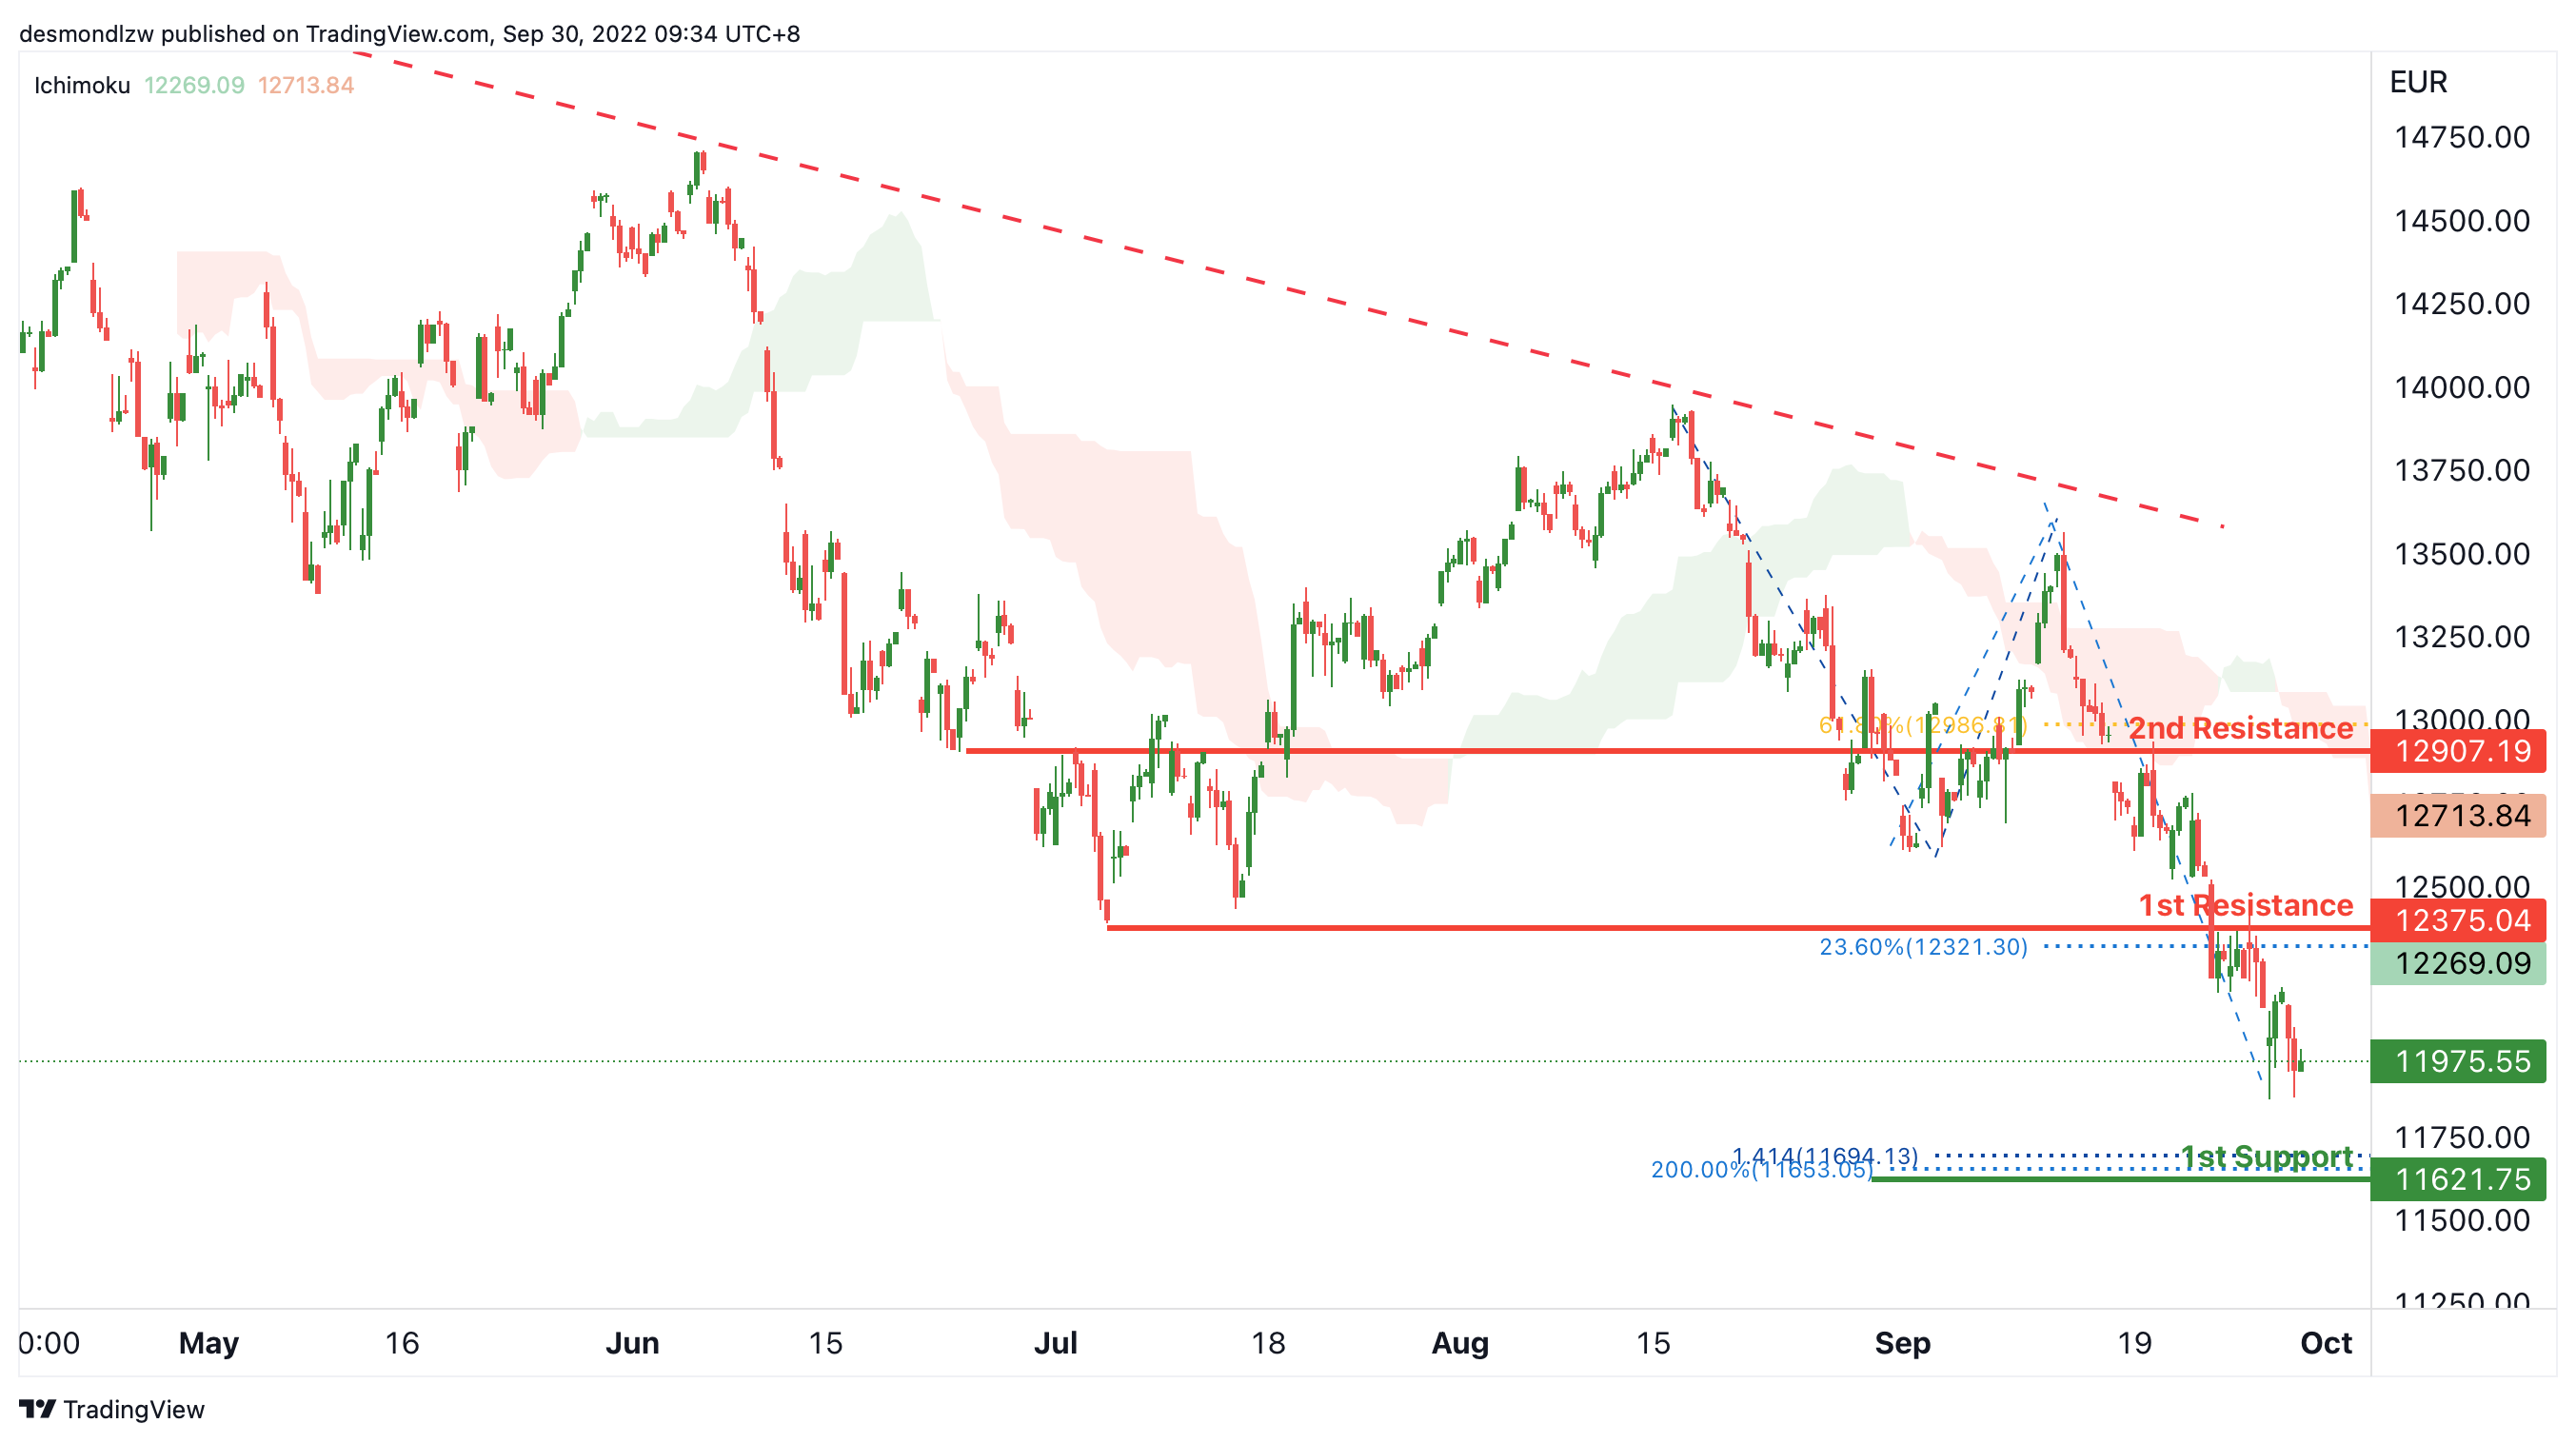
On the H4, with the price moving below the descending trendline and below ichimoku cloud, we have a bearish bias that the price may drop to the 1st support at 11621.75, where the 141.4% fibonacci projection and 200% fibonacci projection are. Alternatively, the price may rise to test the 1st resistance at 12375.04, which is in line with the overlap resistance and 23.6% fibonacci retracement. If the 1st resistance is broken, the price may rise to the 2nd resistance at 12907.19, where the 61.8% fibonacci retracement is.
Areas of consideration:
- H4 time frame, 1st resistance at 12375.04
- H4 time frame, 1st support at 11621.75
ETHUSD:
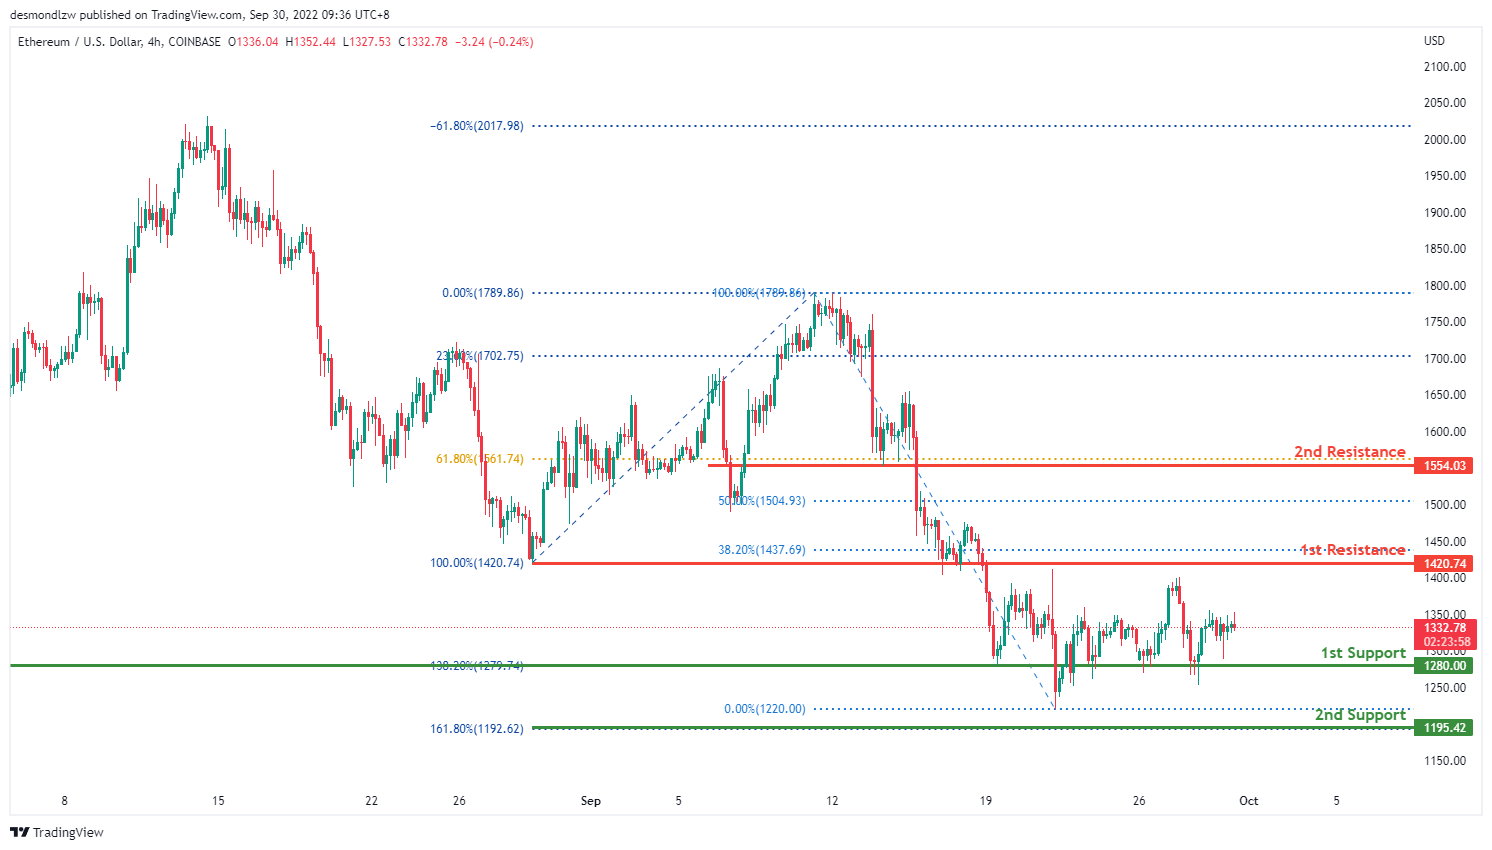
On the H4, the overall price of ETHUSD is very bearish. Price appears to be consolidating above the first support line at 1270.74, which also happens to be the 138.2% Fibonacci line. Price is expected to remain in this range between the first resistance at 1420.74, where the previous swing low is located, and the first support.
Areas of consideration:
- H4 time frame, 1st resistance of 1420.74
- H4 time frame, 1st support at 1280.00
BTCUSD:
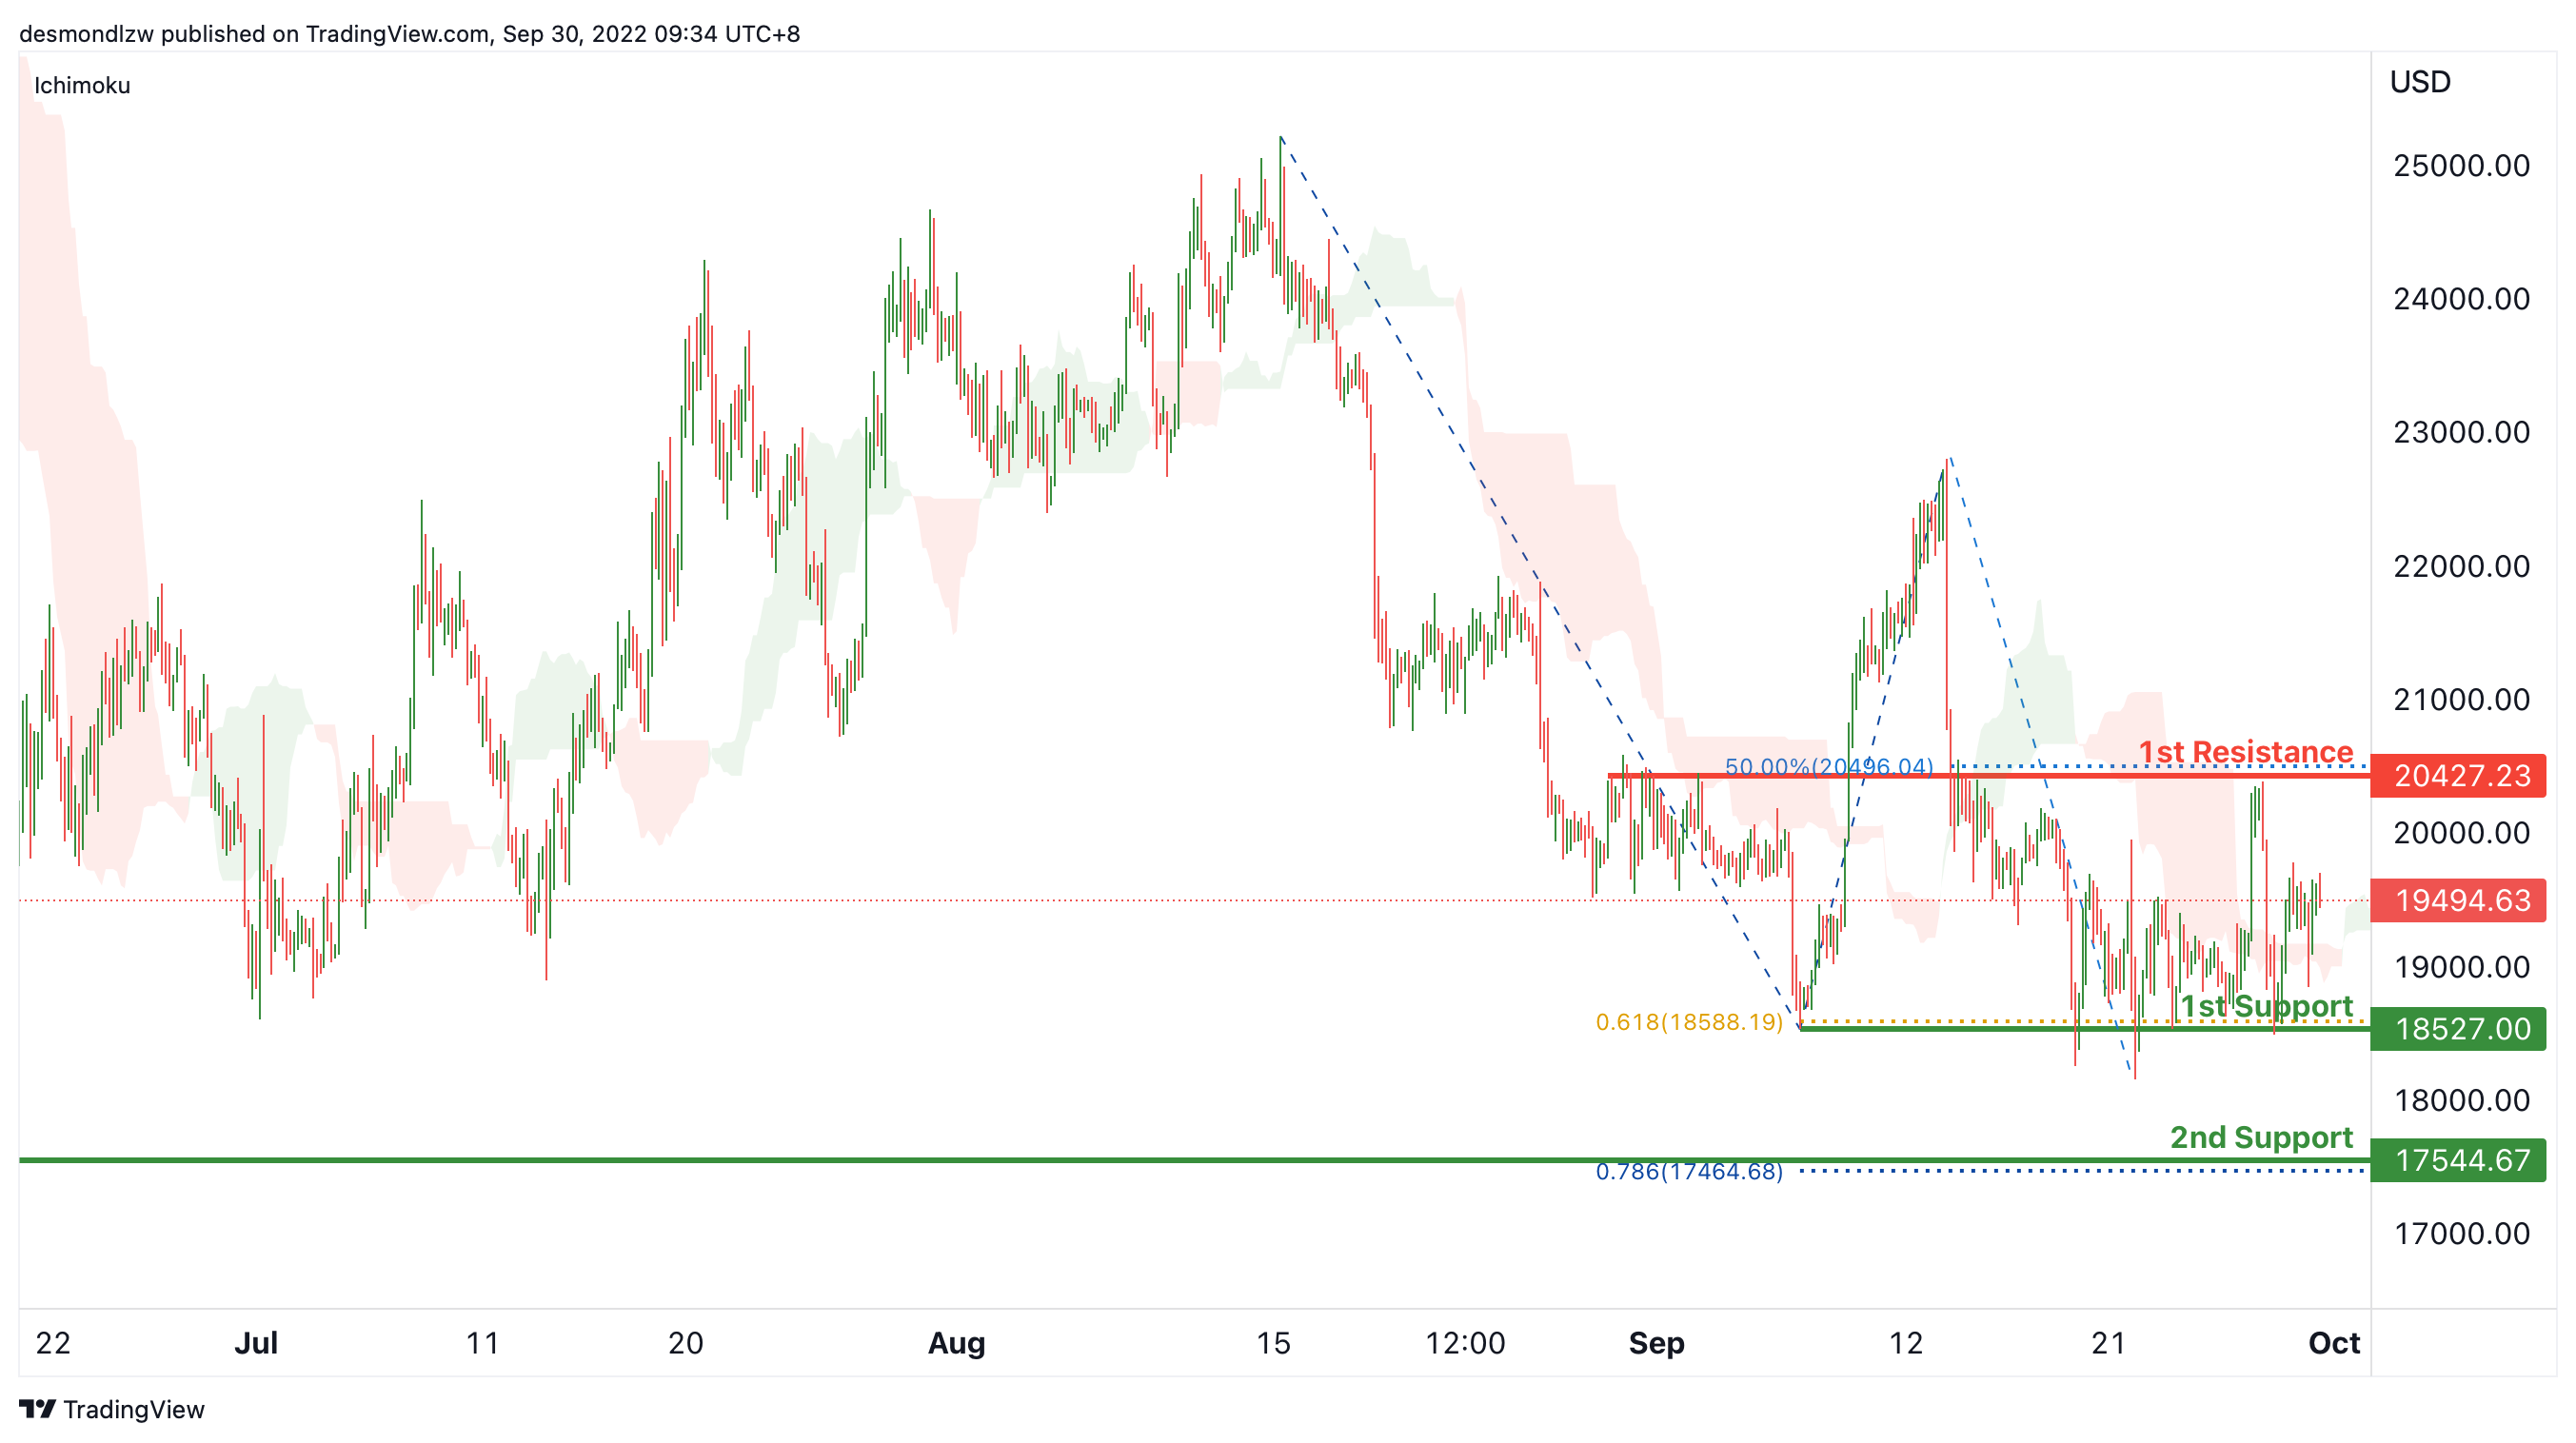
On the H4, price reversing from the 1st support and crossing the ichimoku cloud, we have a bullish bias that the price may test the 1st resistance at 20427.23, where the overlap resistance and 50% fibonacci retracement are. After testing the 1st resistance, the price may pullback and drop to the 1st support at 18527, which is in line with the swing lows and 61.8% fibonacci projection. If the 1st support is broken, the 2nd support could be at 17544.67, which is in line with the 78.6% fibonacci projection and swing low.
Areas of consideration:
- H4 time frame, 1st resistance at 20427.23
- H4 time frame, 1st support at 18527
S&P 500:
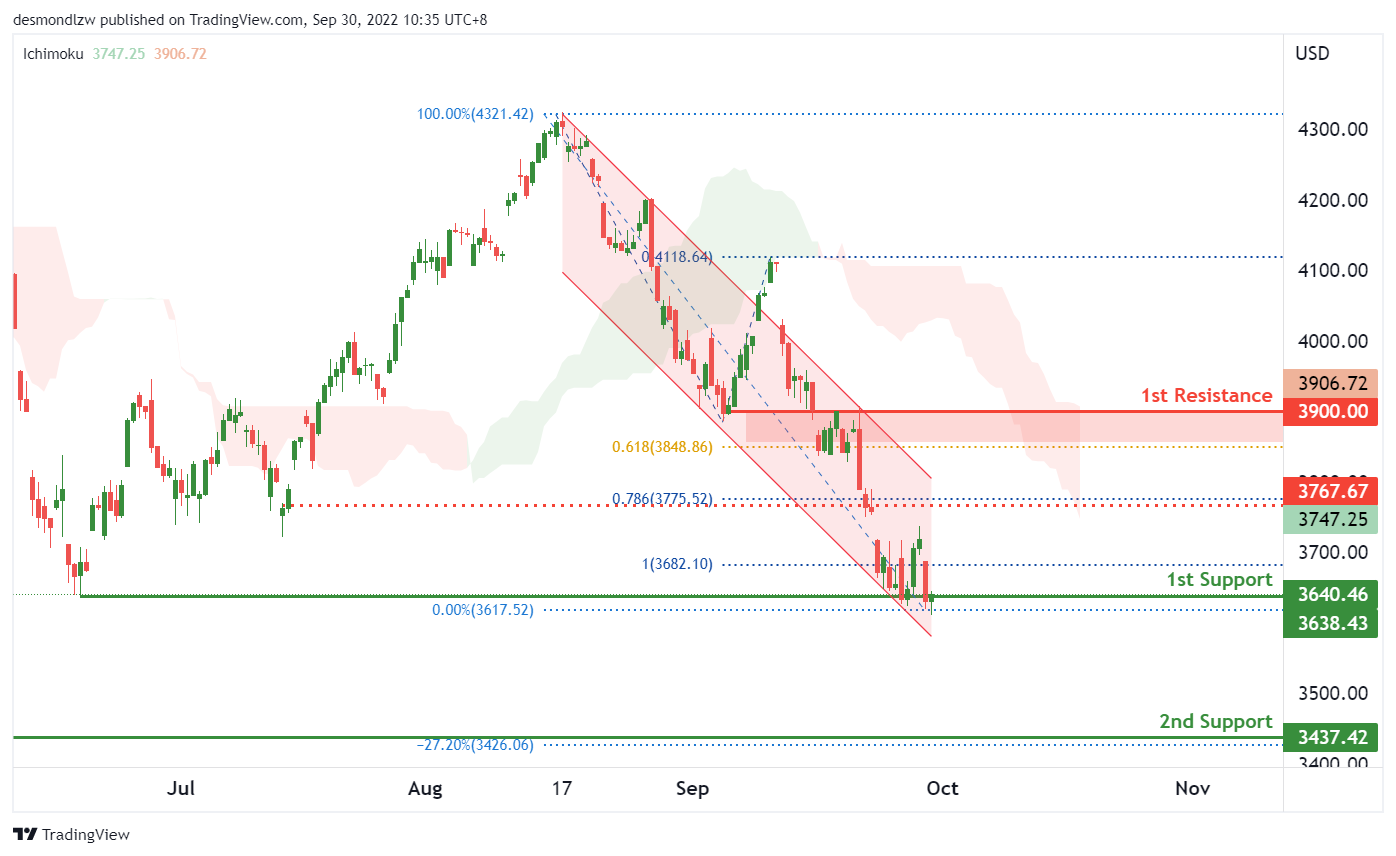
On the H4, with the price within a descending channel and below the ichimoku cloud, we continue to have a bearish bias. However, with the price currently at the 1st support off the 1st support of 3640, which is in line with the previous swing low of June 2022, we could see price testing the 3767 intermediate level before testing the 1st support again. Beyond the 1st support, the 2nd support is at 3427 which is in line with the previous swing low of October 2020 and the 27.20% fibonacci expansion level
Areas of consideration:
- H4 time frame, 1st resistance at 3900
- H4 time frame, 1st support at 3640
- H4 time frame, 2nd support at 3437
USD/CAD Daily Outlook
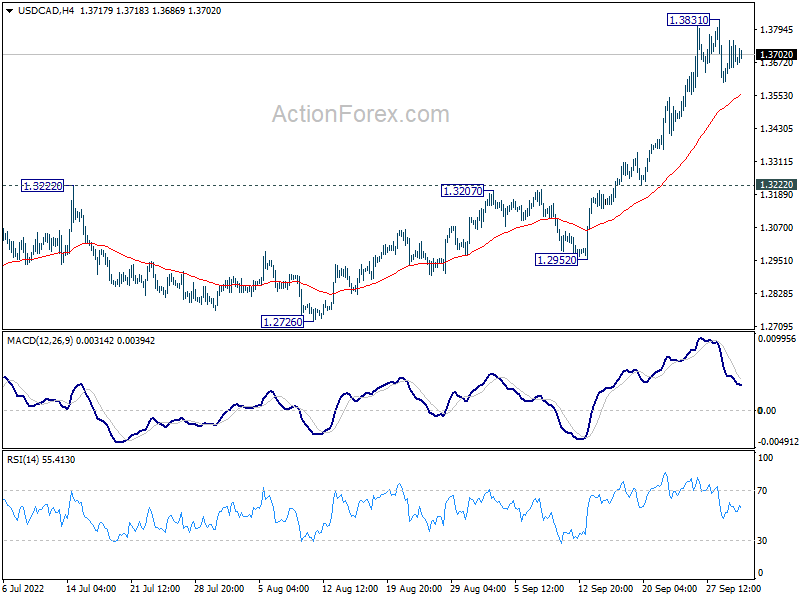
Daily Pivots: (S1) 1.3607; (P) 1.3682; (R1) 1.3759; More...
Intraday bias in USD/CAD stays neutral for consolidation below 1.3831 temporary top Downside of retreat should be contained well above 1.3222 support turned resistance to bring another rally. Break of 1.3831 will resume recent up trend to 161.8% projection of 1.2005 to 1.2947 from 1.2401 at 1.3925. Firm break there will target 200% projection at 1.4285.
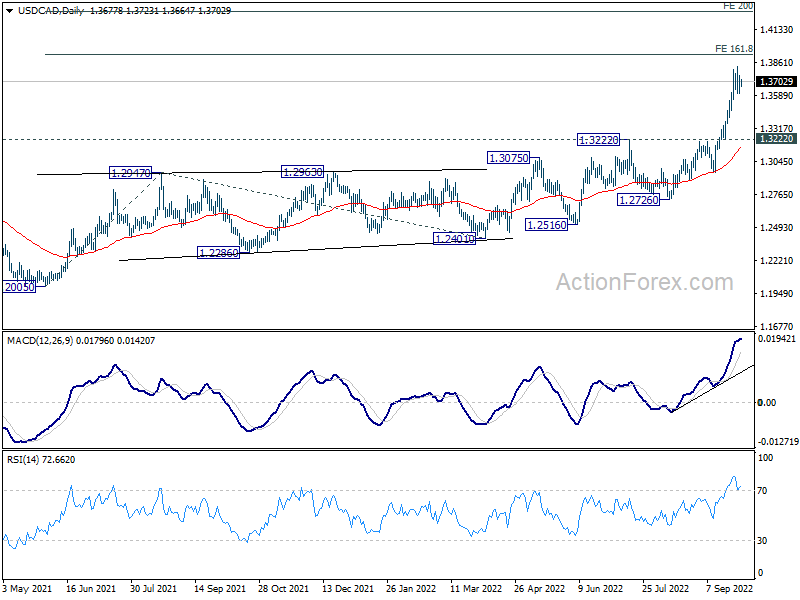
In the bigger picture, up trend from 1.2005 (2021 low) is still in progress. Based on current impulsive momentum, it could be resuming long term up trend from 0.9056 (2007 low). Whether it is or it isn't, retest of 1.4689 (2016 high) should be seen next. This will now remain the favored case as long as 1.3222 resistance turned support holds.
AUD/USD Daily Report
Daily Pivots: (S1) 0.6449; (P) 0.6488; (R1) 0.6540; More...
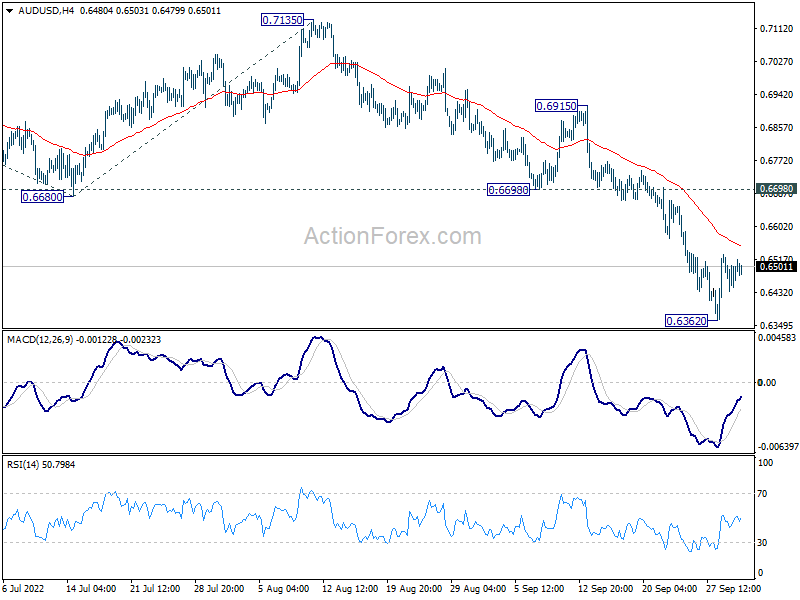
Intraday bias in AUD/USD remains neutral as consolidation from 0.6362 continues. Outlook will remain bearish as long as 0.6698 support turned resistance holds. Break of 0.6362 will resume larger down trend. Next target is 100% projection of 0.7660 to 0.6680 from 0.7135 at 0.6155.
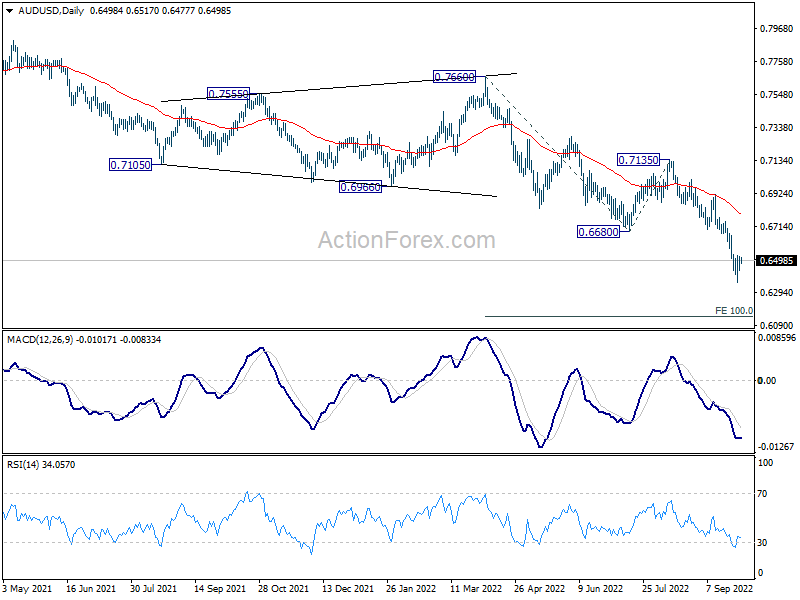
In the bigger picture, down trend form 0.8006 (2021 high) is expected to continue as long as 0.7135 resistance holds. With 61.8% retracement of 0.5506 (2020 low) to 0.8006 at 0.6461 firmly taken out, next target is 0.5506 low. Medium term momentum will now be closely monitored to gauge the chance of break of 0.5506.
USD/JPY Daily Outlook
Daily Pivots: (S1) 144.07; (P) 144.44; (R1) 144.80; More...
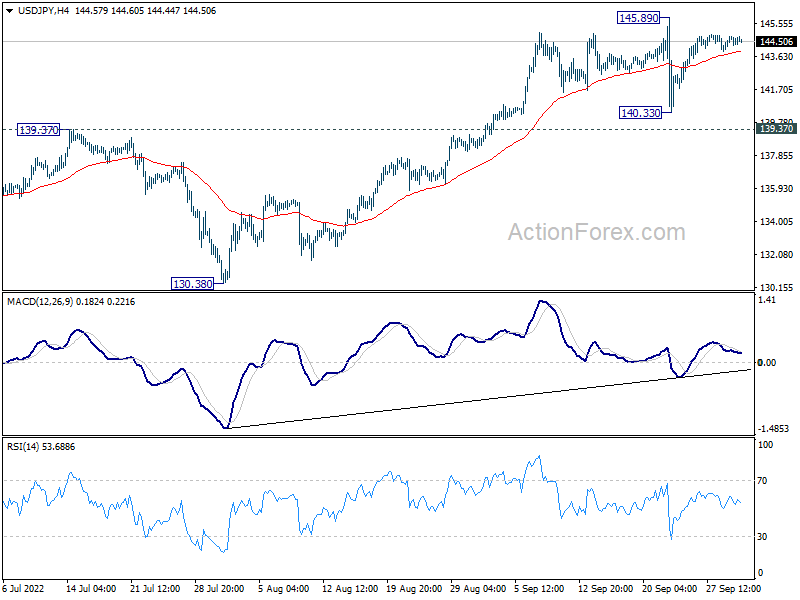
No change in USD/JPY's outlook as consolidation continues below 145.89. Intraday bias remains neutral for the moment. Further rally is expected as long as 139.37 resistance turned support holds. Break of 145.89 will target 147.68 long term resistance. On the downside, however, decisive break of 139.37 will confirm short term topping. Deeper decline would be seen back towards 130.38 support.
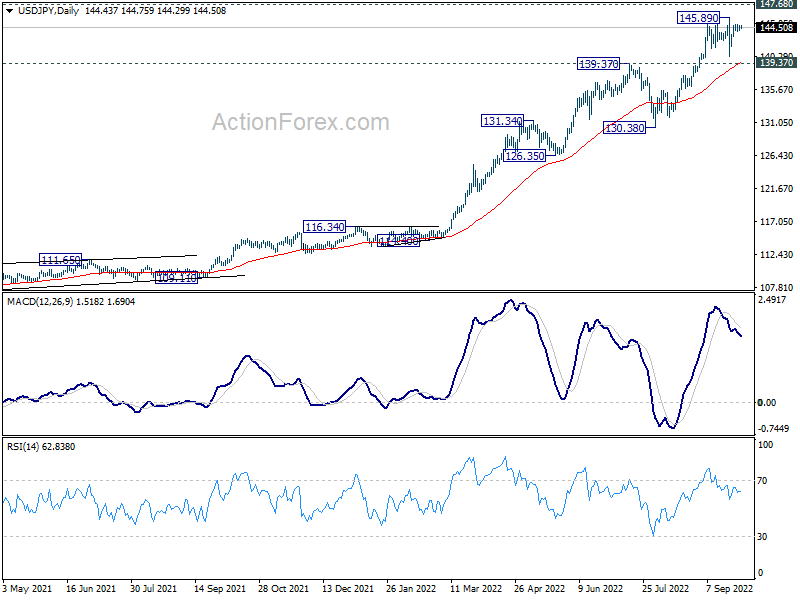
In the bigger picture, up trend from 101.18 is still in progress, as part of the whole up trend from 75.56 (2011 low). Further rise should be seen to 147.68 (1998 high). For now, break of 130.38 support is needed to be the first indication of medium term topping. Otherwise, outlook will stay bullish even in case of deep pull back.
USD/CHF Daily Outlook
Daily Pivots: (S1) 0.9717; (P) 0.9786; (R1) 0.9823; More...
Intraday bias in USD/CHF remains neutral for the moment. On the upside, above 0.9964 will resume the rally from 0.9369 to retest 1.0063 high. On the downside, break of 0.9694 support will extend the corrective pattern from 1.0063 with another falling leg, towards 0.9478 support first.
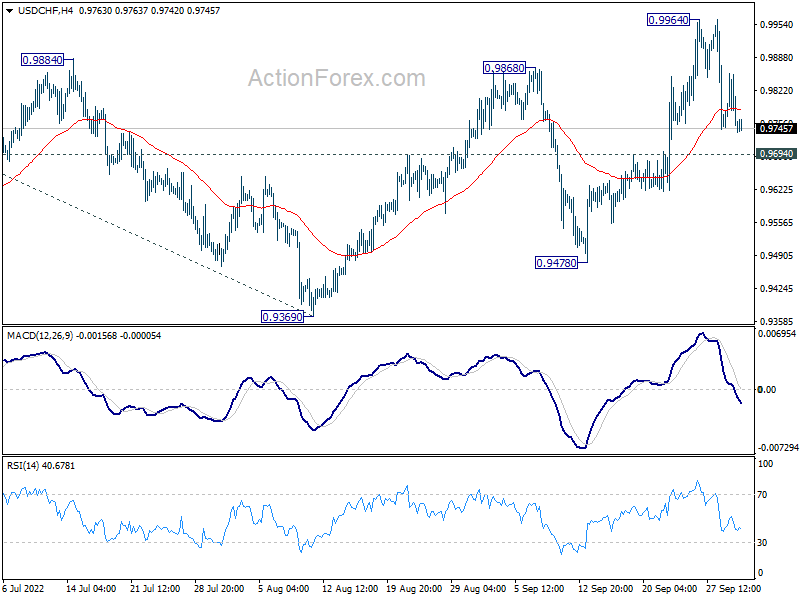
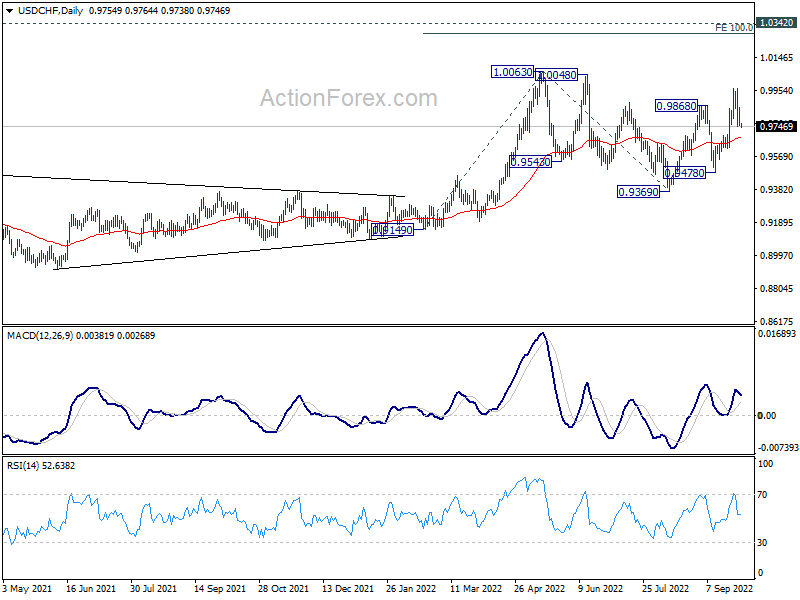
In the bigger picture, current development suggests that up trend from 0.8756 (2021 low) is still in progress. Sustained break of 1.0063 will target 100% projection of 0.9149 to 1.0063 from 0.9369 at 1.0283, and then 1.0342 (2016 high). For now, this will remain the favored case as long as 0.9369 support holds, even in case of deep pull back.
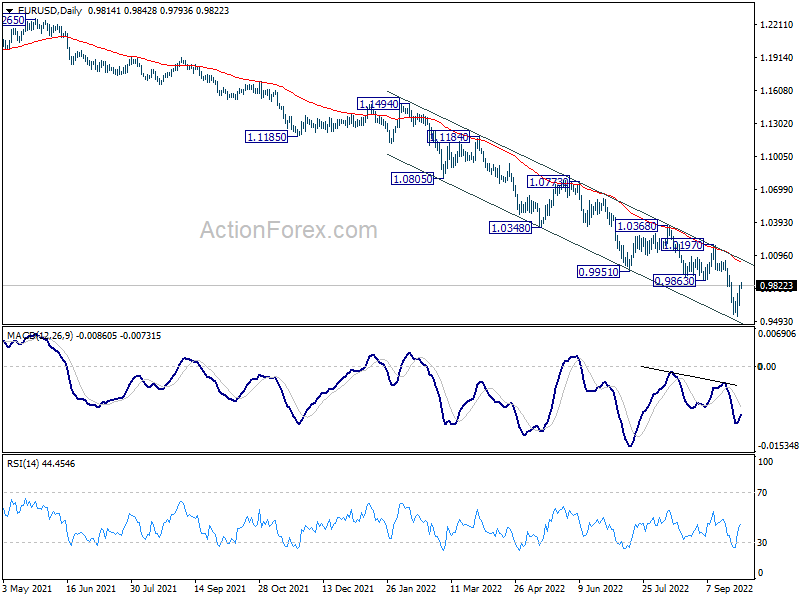
EUR/USD Daily Outlook
Daily Pivots: (S1) 0.9694; (P) 0.9755; (R1) 0.9874; More...
EUR/USD's rebound from 0.9534 extends higher but stays below 0.9863 support turned resistance. Intraday bias remains neutral and larger down trend is still expected to resume later through 0.9534. However, sustained break of 0.9863 will confirm short term bottoming, and bring stronger rally back to 1.0197 resistance instead.
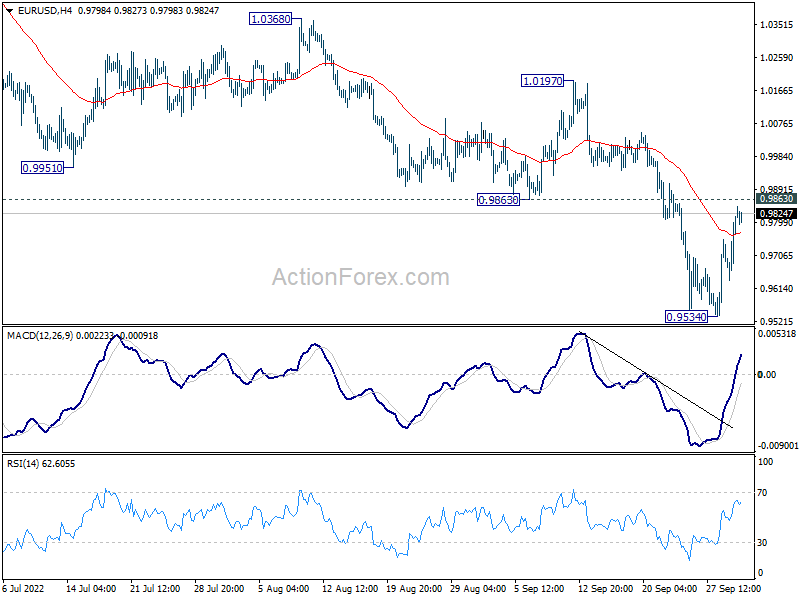
In the bigger picture, down trend from 1.6039 (2008 high) is still in progress. Next target is 100% projection of 1.3993 to 1.0339 from 1.2348 at 0.8694. In any case, break of 1.0197 resistance is needed to be the first sign of medium term bottoming. Otherwise, outlook will stay bearish even with strong rebound.