

Sample Category Title
EURGBP Wave Analysis
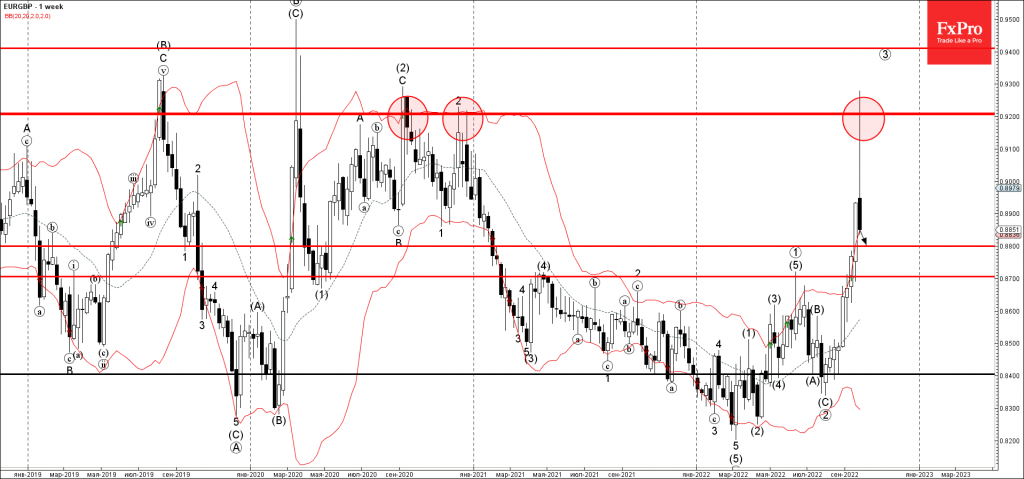
- EURGBP reversed from long-term resistance level 0.9200
- Likely to fall to support level 0.8800
EURGBP falling after the pair reversed down from the powerful long-term resistance level 0.9200 (which has been reversing the price from the middle of 2020), standing far above the upper weekly Bollinger Band.
The downward reversal from the resistance level 0.9200 is currently forming the strong weekly Candlesticks reversal pattern Falling Star.
EURGBP currency pair can be expected to fall further toward the next support level 0.8800.
EURCAD Wave Analysis
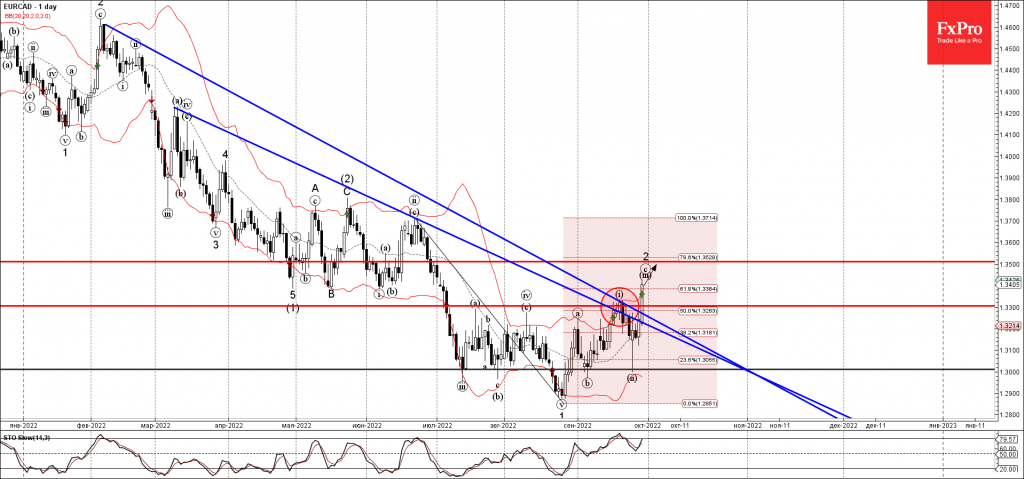
- EURCAD broke resistance level 1.3300
- Likely to rise to resistance level 1.3500
EURCAD currency pair rising strongly after the breakout of the resistance level 1.3300 (top of wave (i) from the middle of September) intersecting with the two resistance trendlines from March and February.
The breakout of the resistance level 1.3300 continues the (c)-wave of the minor ABC correction 2 from the end of August. EURCAD currency pair can be expected to rise further toward the next resistance level 1.3500 (target for the completion of the active ABC correction 2).
Eco Data 9/30/22
[php_everywhere instance="1"]
China September PMI and Potential Recovery
The yuan has been depreciating against the dollar, as have most other currencies. While not as dramatic as the yen, the rise in the USDCNY pair has started to raise concerns from Chinese officials. In the last couple of days, several formal outlets have come out to "warn" that yuan depreciation won't continue.
Some analysts have taken this to be something of a prelude to direct intervention. While the PBOC continues to set the reference rate higher in line with market pressures, it can at any moment step in to stop the decline. That might end up being seen as positive for many of the suppliers to China, particularly Australia and New Zealand.
But for how long?
The weakening Chinese currency makes it harder for Chinese firms to buy raw materials overseas. Should the government step in to shore up the currency, that might help importers. But the underlying reason for the weaker currency would persist, and could mean that imports don't rise as much or for long. Thus, the focus on business sentiment, and whether companies are recovering in the face of covid and the housing crisis.
Next week, China goes into a week-long national holiday, which would naturally affect productivity. After that, factories are expected to ramp up to meet demand ahead of the holiday season. With freight rates falling, logistics issues aren't expected to be as much of a problem this time around. So, the main question is whether industries are buying more raw materials ahead of anticipated higher demand (which would increase PMIs). Or is the situation less optimistic, which would translate into lower PMIs and potential pressure on the NZD and AUD.
How the data fits together
First to report are the official numbers from the NBS, which includes a narrower selection of larger businesses. Bigger firms are in a better position to access the cheaper credits that have been made available as part of the government's economic support program. Additionally, they have more internal market orientation, and are less likely to be impacted by the currency.
Caixin measures a larger number of smaller businesses that are more expert oriented. But also they are more dependent on imports for certain raw materials, particularly in the consumer segment. With investors looking to see how Chinese consumer demand is holding up, services PMI might get a little extra attention.
What to look out for
Official NBS Manufacturing PMI is forecast to improve slightly, but just miss returning to expansion at 49.8 compared to 49.5 previously. Non-Manufacturing PMI is forecast to not only remain healthily in expansion, but to actually improve to 52.8 from 52.6 prior.
Caixin Manufacturing PMI is forecast to match the official number at 49.8 compared to 49.5 prior. Also a slight improvement, but not enough to return to expansion. However, given the small difference to 50, for practical purposes, both figures are straddling the expansion/contraction line. It might take the figures from next month to return more confidence to the markets.
CHFJPY Stands in Medium-Term Ascending Channel after Sharp Sell-Off
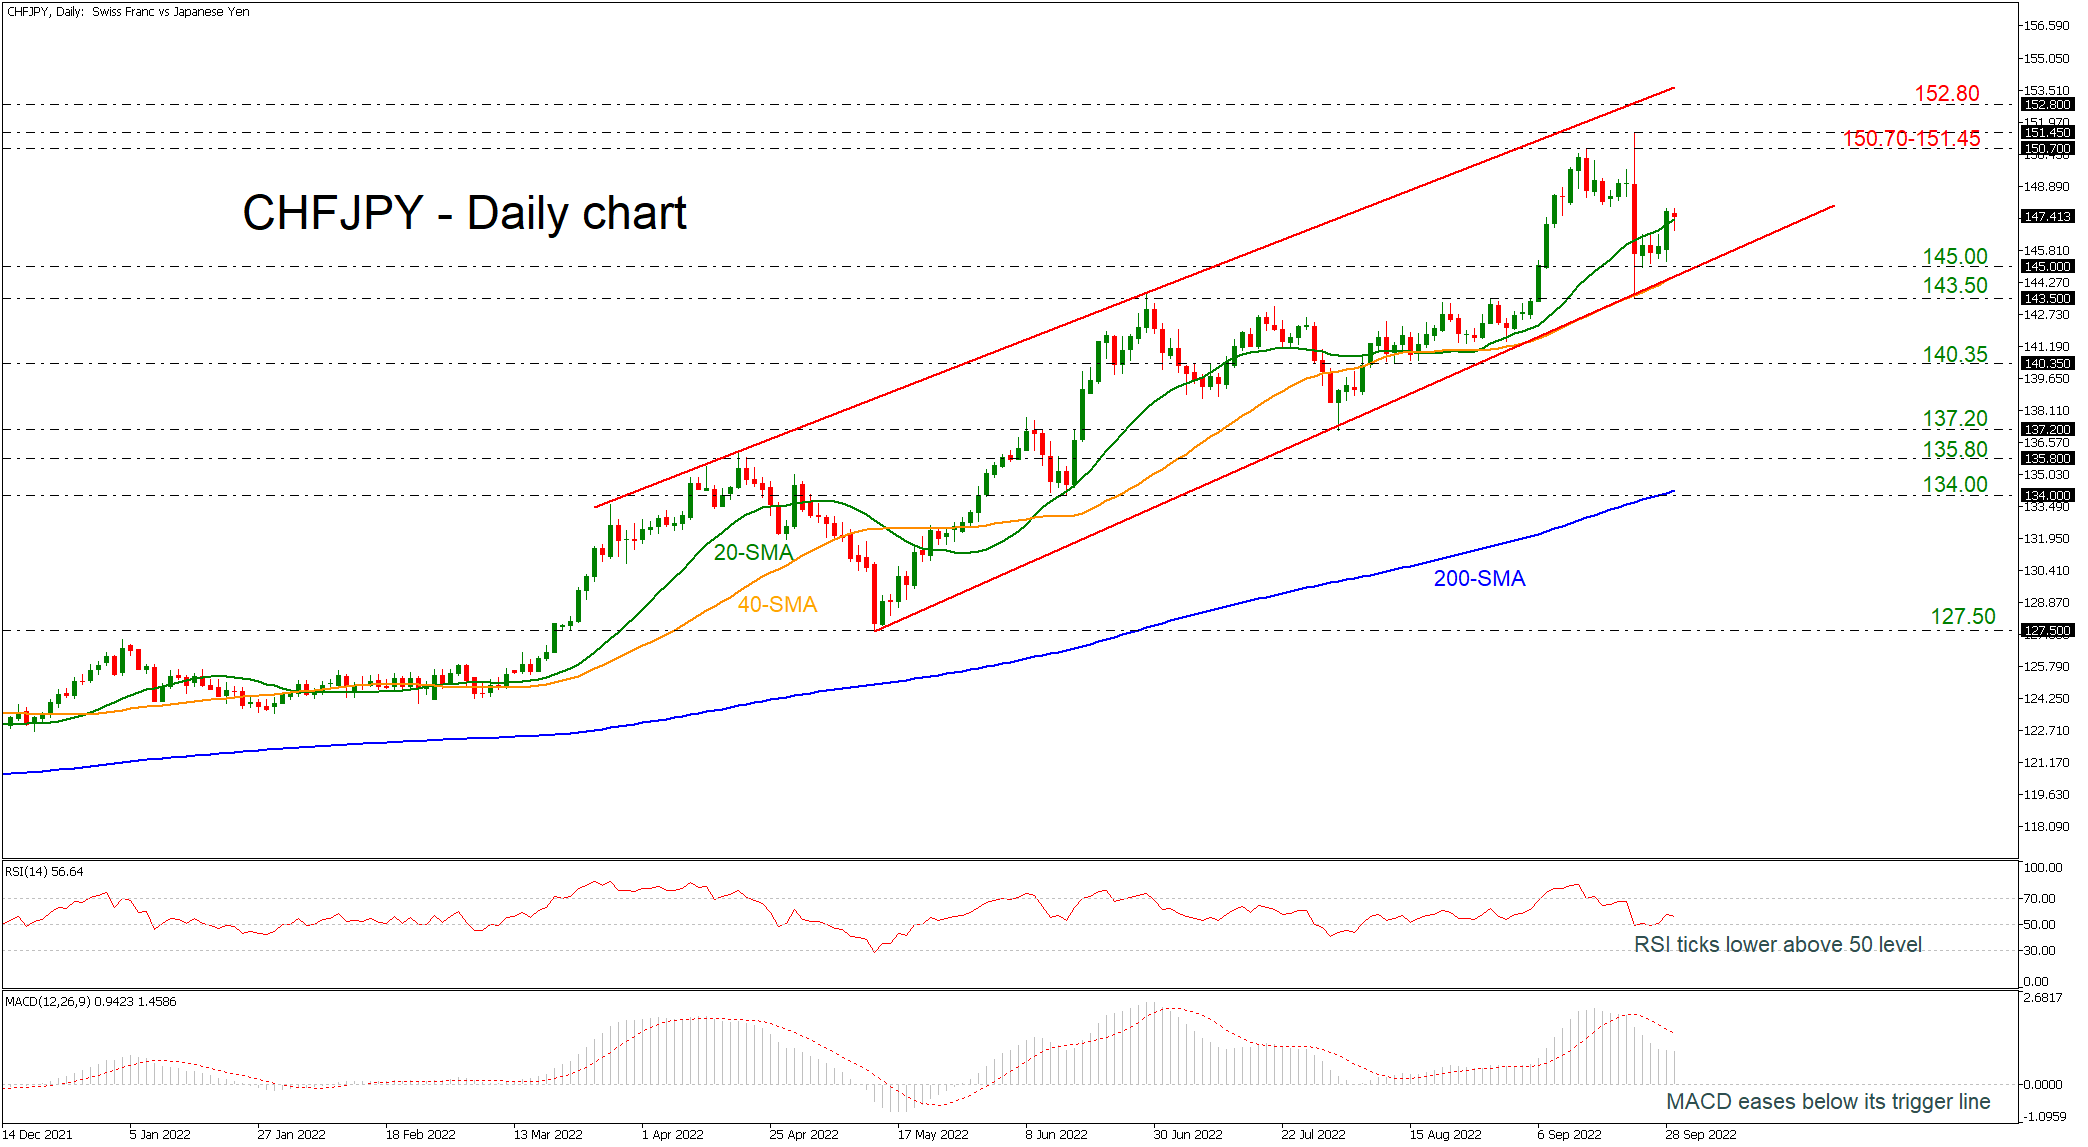
CHFJPY is gaining some ground after the sharp selling interest in the preceding sessions, while it is currently flirting with the 20-day simple moving average (SMA).
The technical oscillators are following the neutral-to-negative reaction in the market in the short-term timeframe. The RSI is ticking down in the positive region, while the MACD is losing momentum below its trigger line in the bullish area as well. Therefore, a reversal to the upside is on the cards, though remaining in the medium-term ascending channel.
If the pair manages to close above the 20-day SMA at 147.17, traders may increase their buy orders all the way to the 150.70 level. The bulls could try to break out of the 151.45 resistance and test the 152.80 barrier at the top of the channel.
However, if the 145.00 support trendline breaks, the four-month view will change to neutral, and the focus will transfer to the 143.50 hurdle. More declines could open the door for the 140.35 and the 137.20 barriers.
In conclusion, selling pressures on CHFJPY are likely to be short-lived as long as the price stays above 143.50.
Will Silver Erase its Wednesday Rebound?
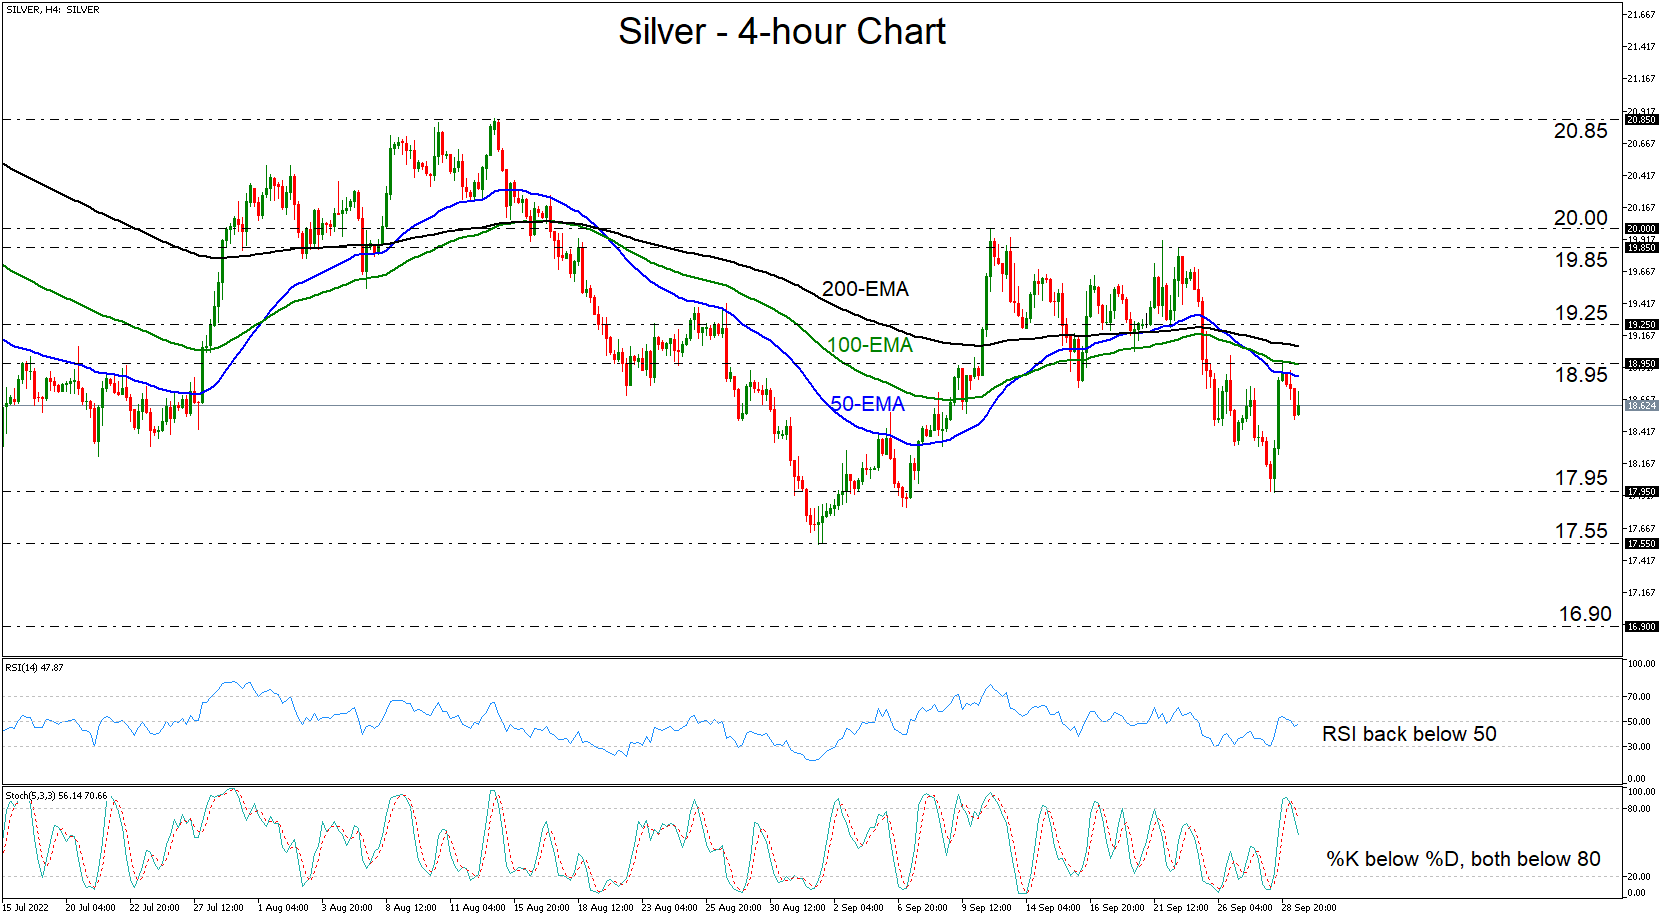
Silver jumped on Wednesday after triggering some buy orders near the 17.95 zone. However, the spike up was stopped by the 18.95 level, slightly above the 50-period exponential moving average (EMA) and near the 100-EMA. This prints a lower high on the daily chart and combined with the fact that the 200-EMA is also hovering above the price action, it suggests that another round of selling could be looming.
The RSI slid back below 50, while the Stochastic exited its above-80 zone. On top of that, its %K line lies below the %D, with both pointing down. This means that the white metal may have started gathering negative speed again, which supports the notion for renewed declines.
If the bears take the driver’s seat again, they may go for another test near the 17.95 zone and should they breach it, a test at the low of September 1 at 17.55 could be possible. If that zone is not able to attract buyers either, its break would lead the price to territories last seen in June 2020. The next area that could play the role of a support level may be the low of that month at around 16.90.
The bearish case could be discarded upon a break above 19.25, marked by the inside swing low of September 22, but the bulls might claim full control after they overcome the round number of 20.00, marked by the high of September 12. This would confirm a higher high on the daily chart and may see scope for bullish extensions towards the peak of August 15 at 20.85.
Putting everything together, despite silver’s recovery yesterday, the outlook remains gloomy, with the bears having the potential to retake charge and attempt breaking more support zones.
ETHUSD Consolidates after Decline Pauses
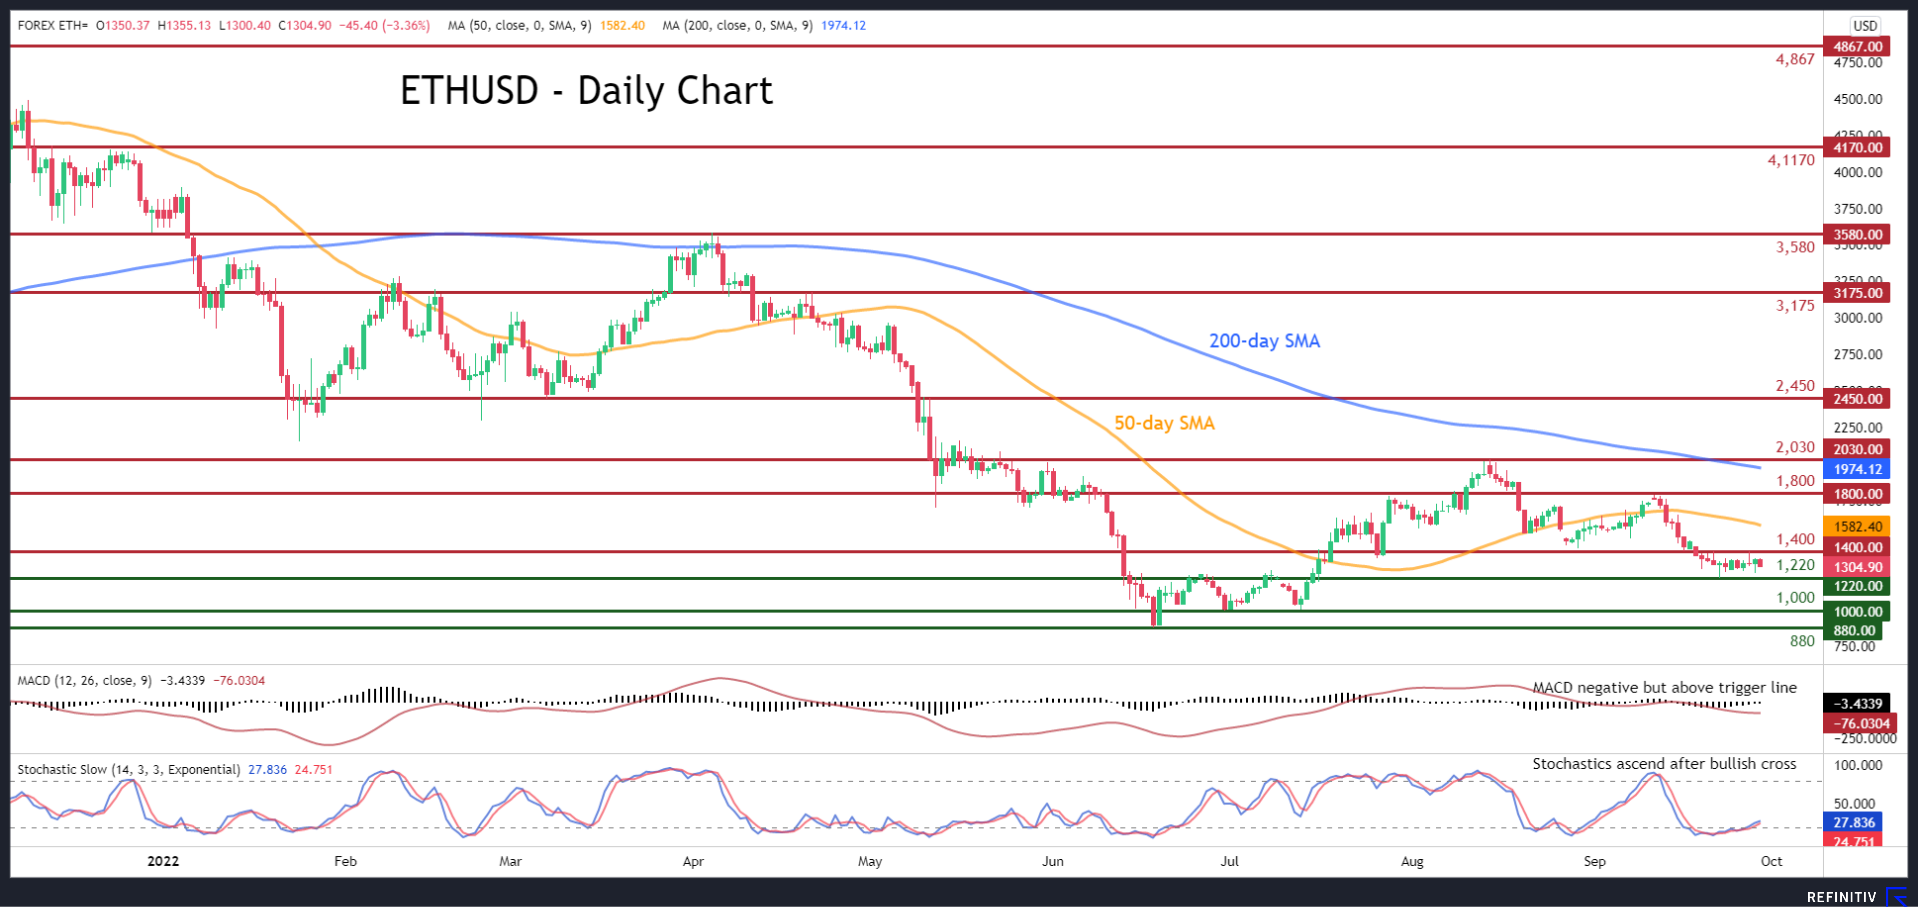
ETHUSD has been trending downwards since mid-August when the price failed to surpass the 2,030 mark. Even though Ethereum experienced an acceleration of its decline following the successful completion of the Merge two weeks ago, it has been trading sideways in the last few daily sessions.
The momentum indicators currently suggest that the negative forces are waning but continue to hold the upper hand. Specifically, the MACD histogram is found above its red signal line but in the negative territory, while the stochastic oscillator is ascending after posting a bullish cross in the oversold area.
Should buying interest intensify, the digital coin could gain some ground and test 1,400, which is the upper limit of its recent rangebound pattern. Piercing this threshold, the price could ascend towards the recent peak of 1,800 before the spotlight turns to the trend reversal point of 2,030. Even higher, the previous support of 2,450 could act as the next resistance zone.
Alternatively, should selling pressures persist, the price could decline towards its recent low of 1,220. If that floor collapses, the spotlight may turn to the crucial 1,000 psychological mark. A decline below the latter may trigger a retreat towards the 2022 low of 880.
In brief, ETHUSD appears to be in a consolidation mode, waiting for developments that could provide fresh directional impetus. That being said, a break above or below its tight range is likely to be followed by a significant move towards the same direction.
Fed Mester: We’re still not even in restrictive territory
Cleveland Fed President Loretta Mester told CNBC she didn't see a case for slowing down tightening right now. She said, "We can have that conversation (about a pause) but we're still not even in restrictive territory on the funds rate."
"I probably am a little bit above that median path because I see more persistence in the inflation process," Mester added. Getting above a 4% fed funds rate is important to helping to lower inflation, she said.
Separately, St. Louis Fed President James Bullard said, "If you look at the dots, it does look like the committee is expecting a fair amount of additional moves this year. I think that that was digested by markets and does seem to be the right interpretation."
Sunset Market Commentary
Markets
Yesterday, the ‘Bank of England bond market intervention’ brought some relief to the recent UK (and broader) sell-off. Optimists hoped this to be harbinger of some consolidation. At least for now, this hope stays fragile at best. European markets this morning failed to build on yesterday’s WS risk rebound. The news flow again didn’t help. UK PM Liz Truss indicated she doesn’t intend to backtrack on the government’s growth supportive policy. European economic confidence (93.7 from 97.3) dropped to the lowest level since late 2020, with all sub-indicators contributing to the decline. Despite this further deterioration in confidence/activity, the ECB stays under pressure to show determination in its anti-inflation campaign. Spanish September inflation eased from 10.5% Y/Y to 9.0%, but Belgian (11.3% see infra) and German inflation (2.2% M/M to be up 10.9% Y/Y from 8.8%) again showed highly worrisome readings. Germans yields are off the intraday peak levels but still rise between 3 bps (2-y) and 14 bps (30-y), with the German 10-y yield (2.25%) still near a new closing top for this cycle. US yields are rising between 8 bps (5-y) and 5 bps (30Y yield). US initial jobless claims declined further to 193k from 209k, illustrating a persistently tight labour market. Fed’s Mester repeated that demand is still outpacing supply as Fed rates still aren’t in restrictive territory yet. She clearly isn’t worried about the strong dollar as it helps cooling inflation. Swings in UK yields were less pronounced than recently. The very long end (30-y unchanged) is protected by the (in)visible hand of the BoE. The rise in shorter maturities (2-y + 20 bps) can only be seen as markets being highly sceptic on the UK policy mix. On Equity markets, the EuroStoxx 50 (-2 %), extends its decline below the 3550 support. US indices show similar losses.
On FX markets, the trading pattern maybe is slightly different from equities or interest markets. The US currency today stayed away from recent peak levels with the DXY index near 113 (compared to a peak of 114.78 yesterday). EUR/USD intraday even revisited the 0.9745/50 area. A break didn’t occur as sentiment remains risk-off but at 0.973 the USD performance maybe is slightly disappointing. Sterling gains modestly against the dollar (cable 1.096) and outperforms the euro (EUR/GBP 0.887). Central European currencies also feel quite some headwinds with regional central banks flagging they have reached (CNB, MNB) or are close to the peak (Poland) of the tightening cycle. Markets especially question this week’s ‘official’ end to the Hungarian tightening cycle as the forint sets a new all-time low at EUR/HUF 423! The zloty is also fighting an uphill battle with EUR/PLN at risk of breaking beyond the 4.85 June top. Even EUR/CZK is challenging the 24.70 mark which was recently ‘shielded’ by CNB FX interventions.
News Headlines
Belgian inflation accelerated in September to 0.96% M/M with the Y/Y figure surging from 9.94% to 11.27%, the first double digit print since January 1976 and the highest since August 1975. Inflation based on the health index has increased to 11.25% from 9.70%. Core inflation, which does not take into account price evolutions of energy products and unprocessed food, stands at 6.21% in September, compared to 5.74% in August. This is a result of increased inflation for processed food and services. The main price increases in September concerned electricity, natural gas, clothing, alcoholic beverages, domestic heating oil, restaurants and cafés, travels abroad and city trips, purchase of vehicles and rent.
Germany’s leading economic institutes significantly cut their growth forecasts compared to April numbers. They slashed this year’s GDP prognosis to 1.4% from 2.7% with 2023 GDP now expected to contract by 0.4% compared to 3.1% forecasted expansion in April. The downgrades mainly stem from the drastic increase in energy costs. “The consequences are production stops, losses in value creation, the relocation of production abroad and even plant closures. The number of companies that either do not receive any energy supply contracts at all or only receive them at extreme prices is currently increasing”. 2024 growth is expected just shy of 2%. The (average annual) inflation path stands at 8.4%-8.8%-2.2% for the 2022-2024 period.
Canada’s Economy Edges Up in July, Points to a Flat Reading for August
The Canadian economy expanded by 0.1% month/month (m/m) in July, beating Statistics Canada's flash estimate of -0.1%. The flash estimate for August was essentially flat.
July's increase in activity was concentrated in the goods sector. The goods-producing sector rose 0.5%, while the service-producing sector declined by 0.1%. Overall, output expanding in 11 of the 20 industries.
Substantial growth was seen in the mining, quarrying and oil and gas sector, which grew at 1.9% on the month. This was a product of an "increase of synthetic oil production coupled with a record level of production of marketable crude bitumen in Alberta contributed the most to growth. Oil sands output increased following maintenance turnarounds at facilities in the second quarter of 2022, which constrained production leading up to July."
The agriculture sector also rose at a substantial clip, increasing by 3.2% m/m. This was "driven by an increase in crop production. Crop production (except cannabis) expanded 7.2%, driven mainly by an increase in volumes of other grains and wheat."
Retail trade (-1.9%) and accommodation/food services (-1%) were weak on the month, as consumers are starting to pull back on spending.
Key Implications
Today's GDP release surprised to the upside, with the materials sectors taking the lead on the back of high commodity prices. Though there was noticeable weakness in some consumer-facing sectors, today's print combined with the August forecast reaffirms our tracking for the third quarter of around 1%. That's pretty good considering the backdrop of high inflation and rapidly rising interest rates that are weighing on the economy.
For the Bank of Canada, it needs to see further slowing in the economy in order to ease inflationary pressures. We have seen this already in recent labour market indicators, but GDP continues to remain in positive territory. How long this will last is uncertain, especially given our expectation that the BoC will get rates to 4% by year-end.