Sample Category Title
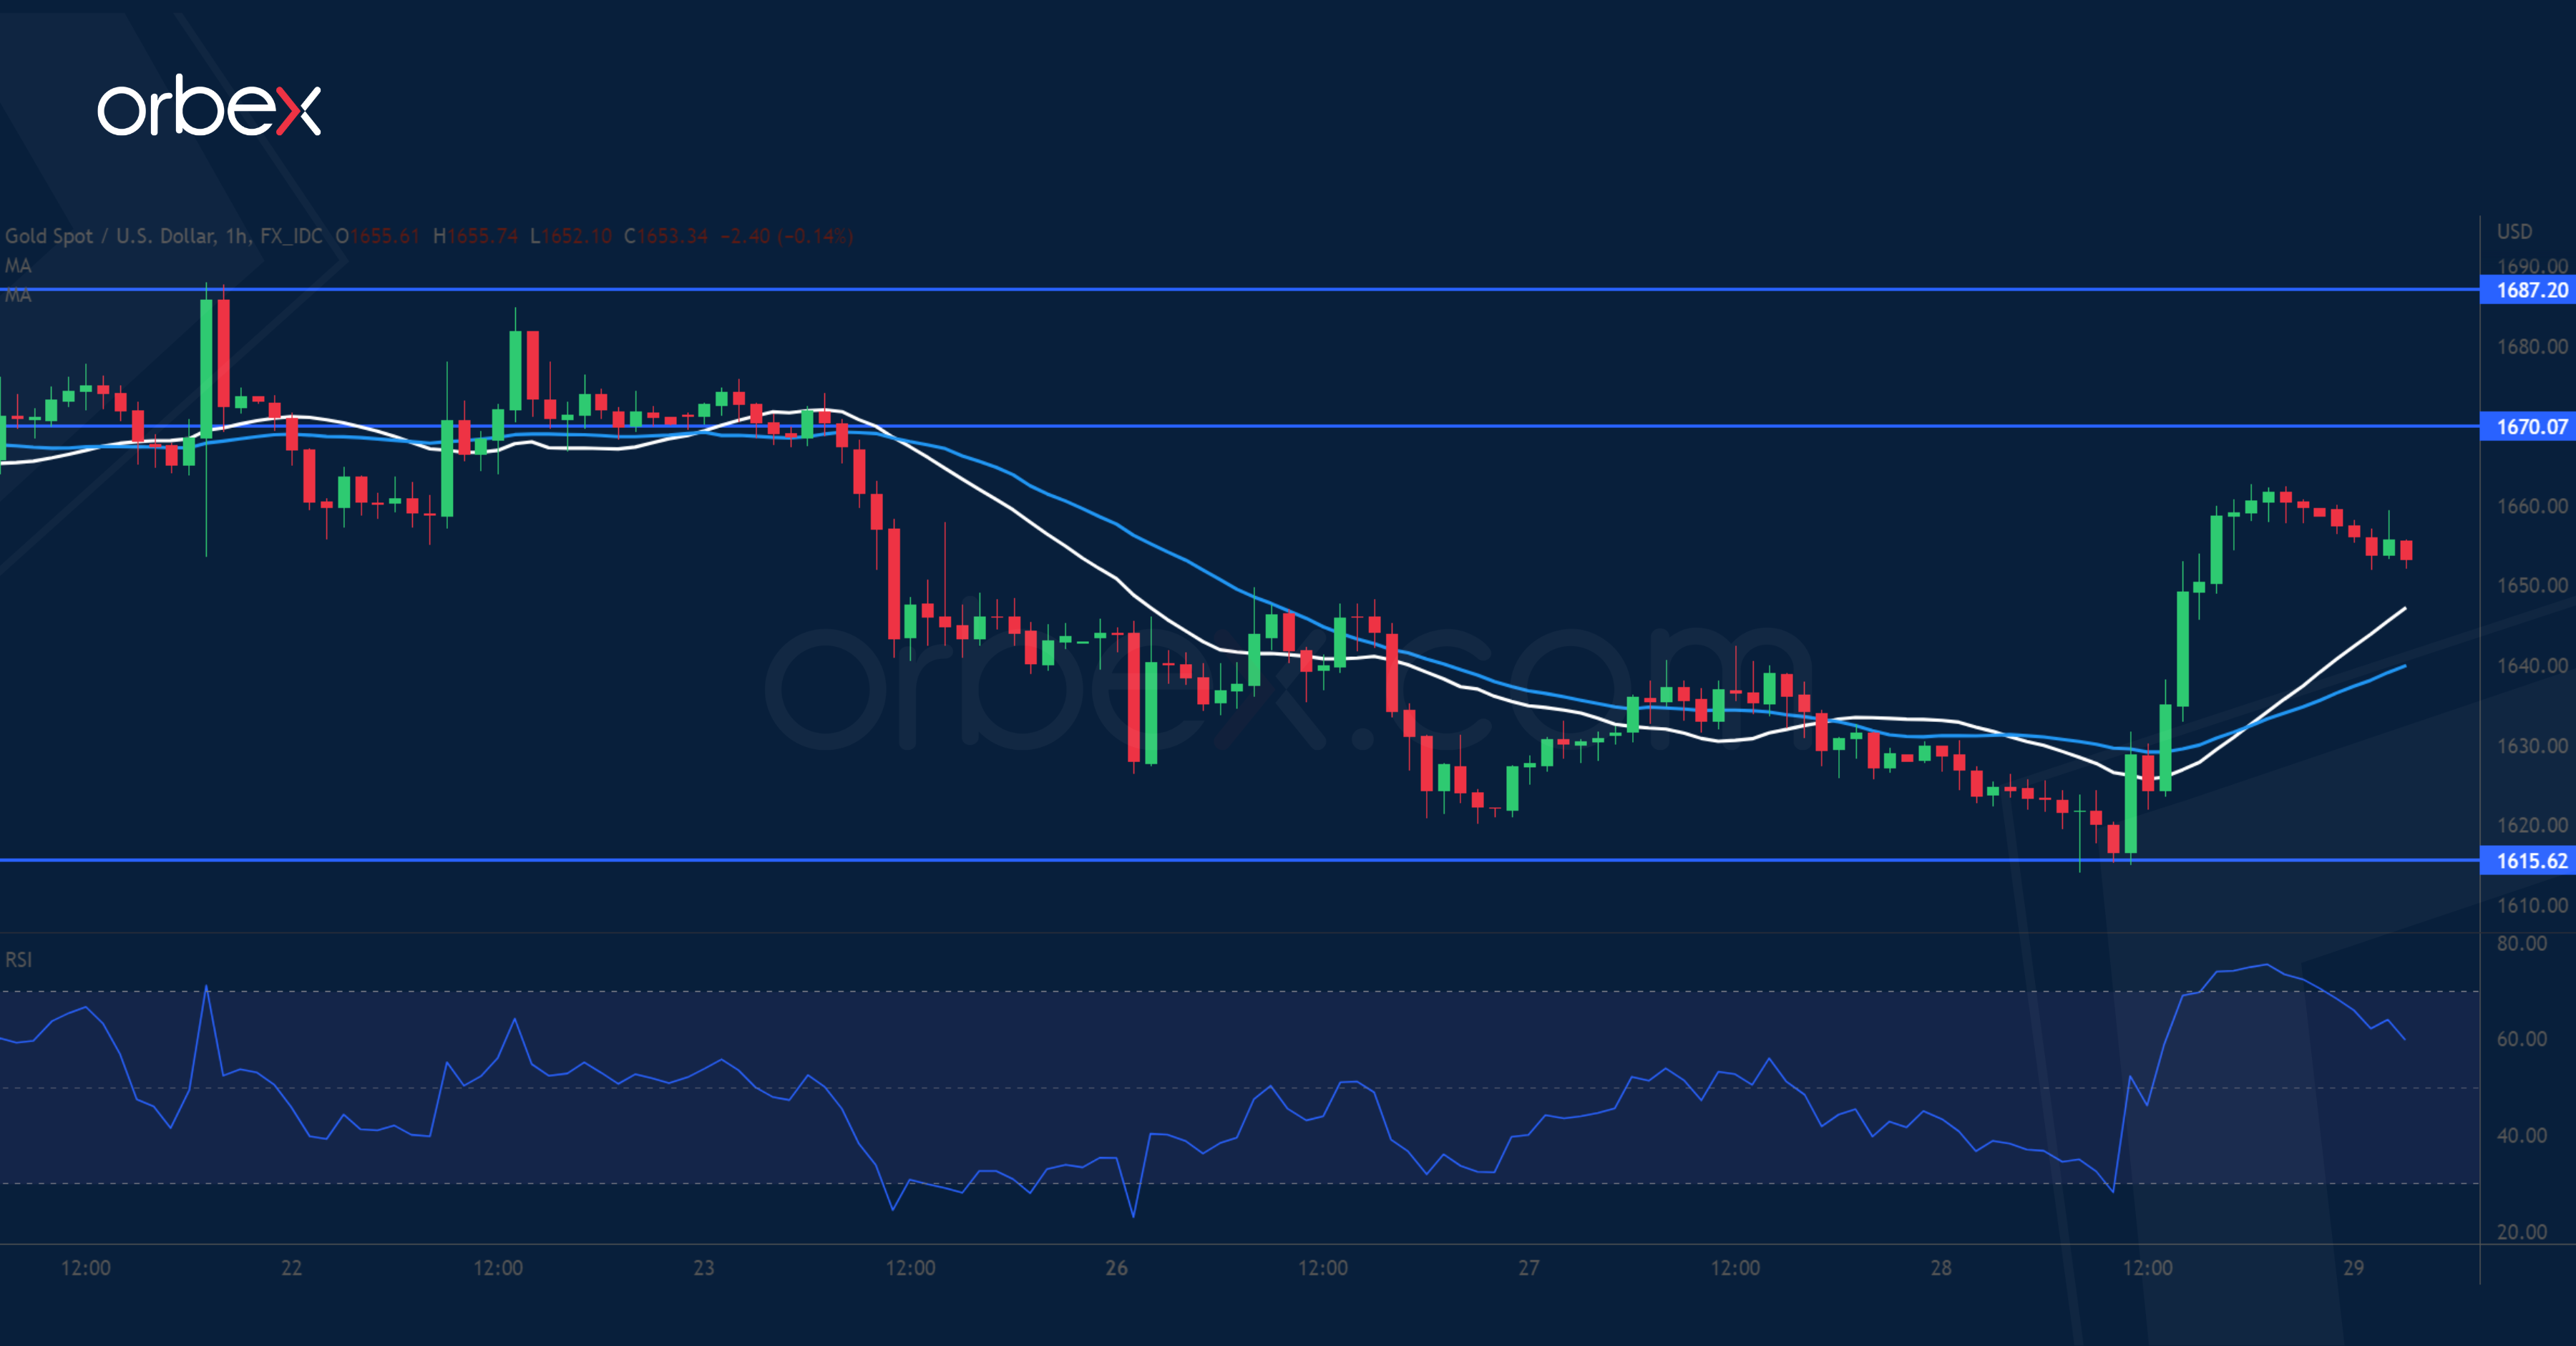
XAU/USD Tests Resistance
Bullion recoups losses as the greenback softens across the board. Still, the precious metal remains under pressure after the bulls gave up the critical floor around 1680. A brief consolidation was a signal that the path of least resistance had switched to the downside. 1615 has attracted some buying interests but most traders might worry about catching a falling knife. A new round of sell-off may send gold to April 2020’s low at 1570. 1670 has become a fresh resistance where the bears could be looking to sell into strength.
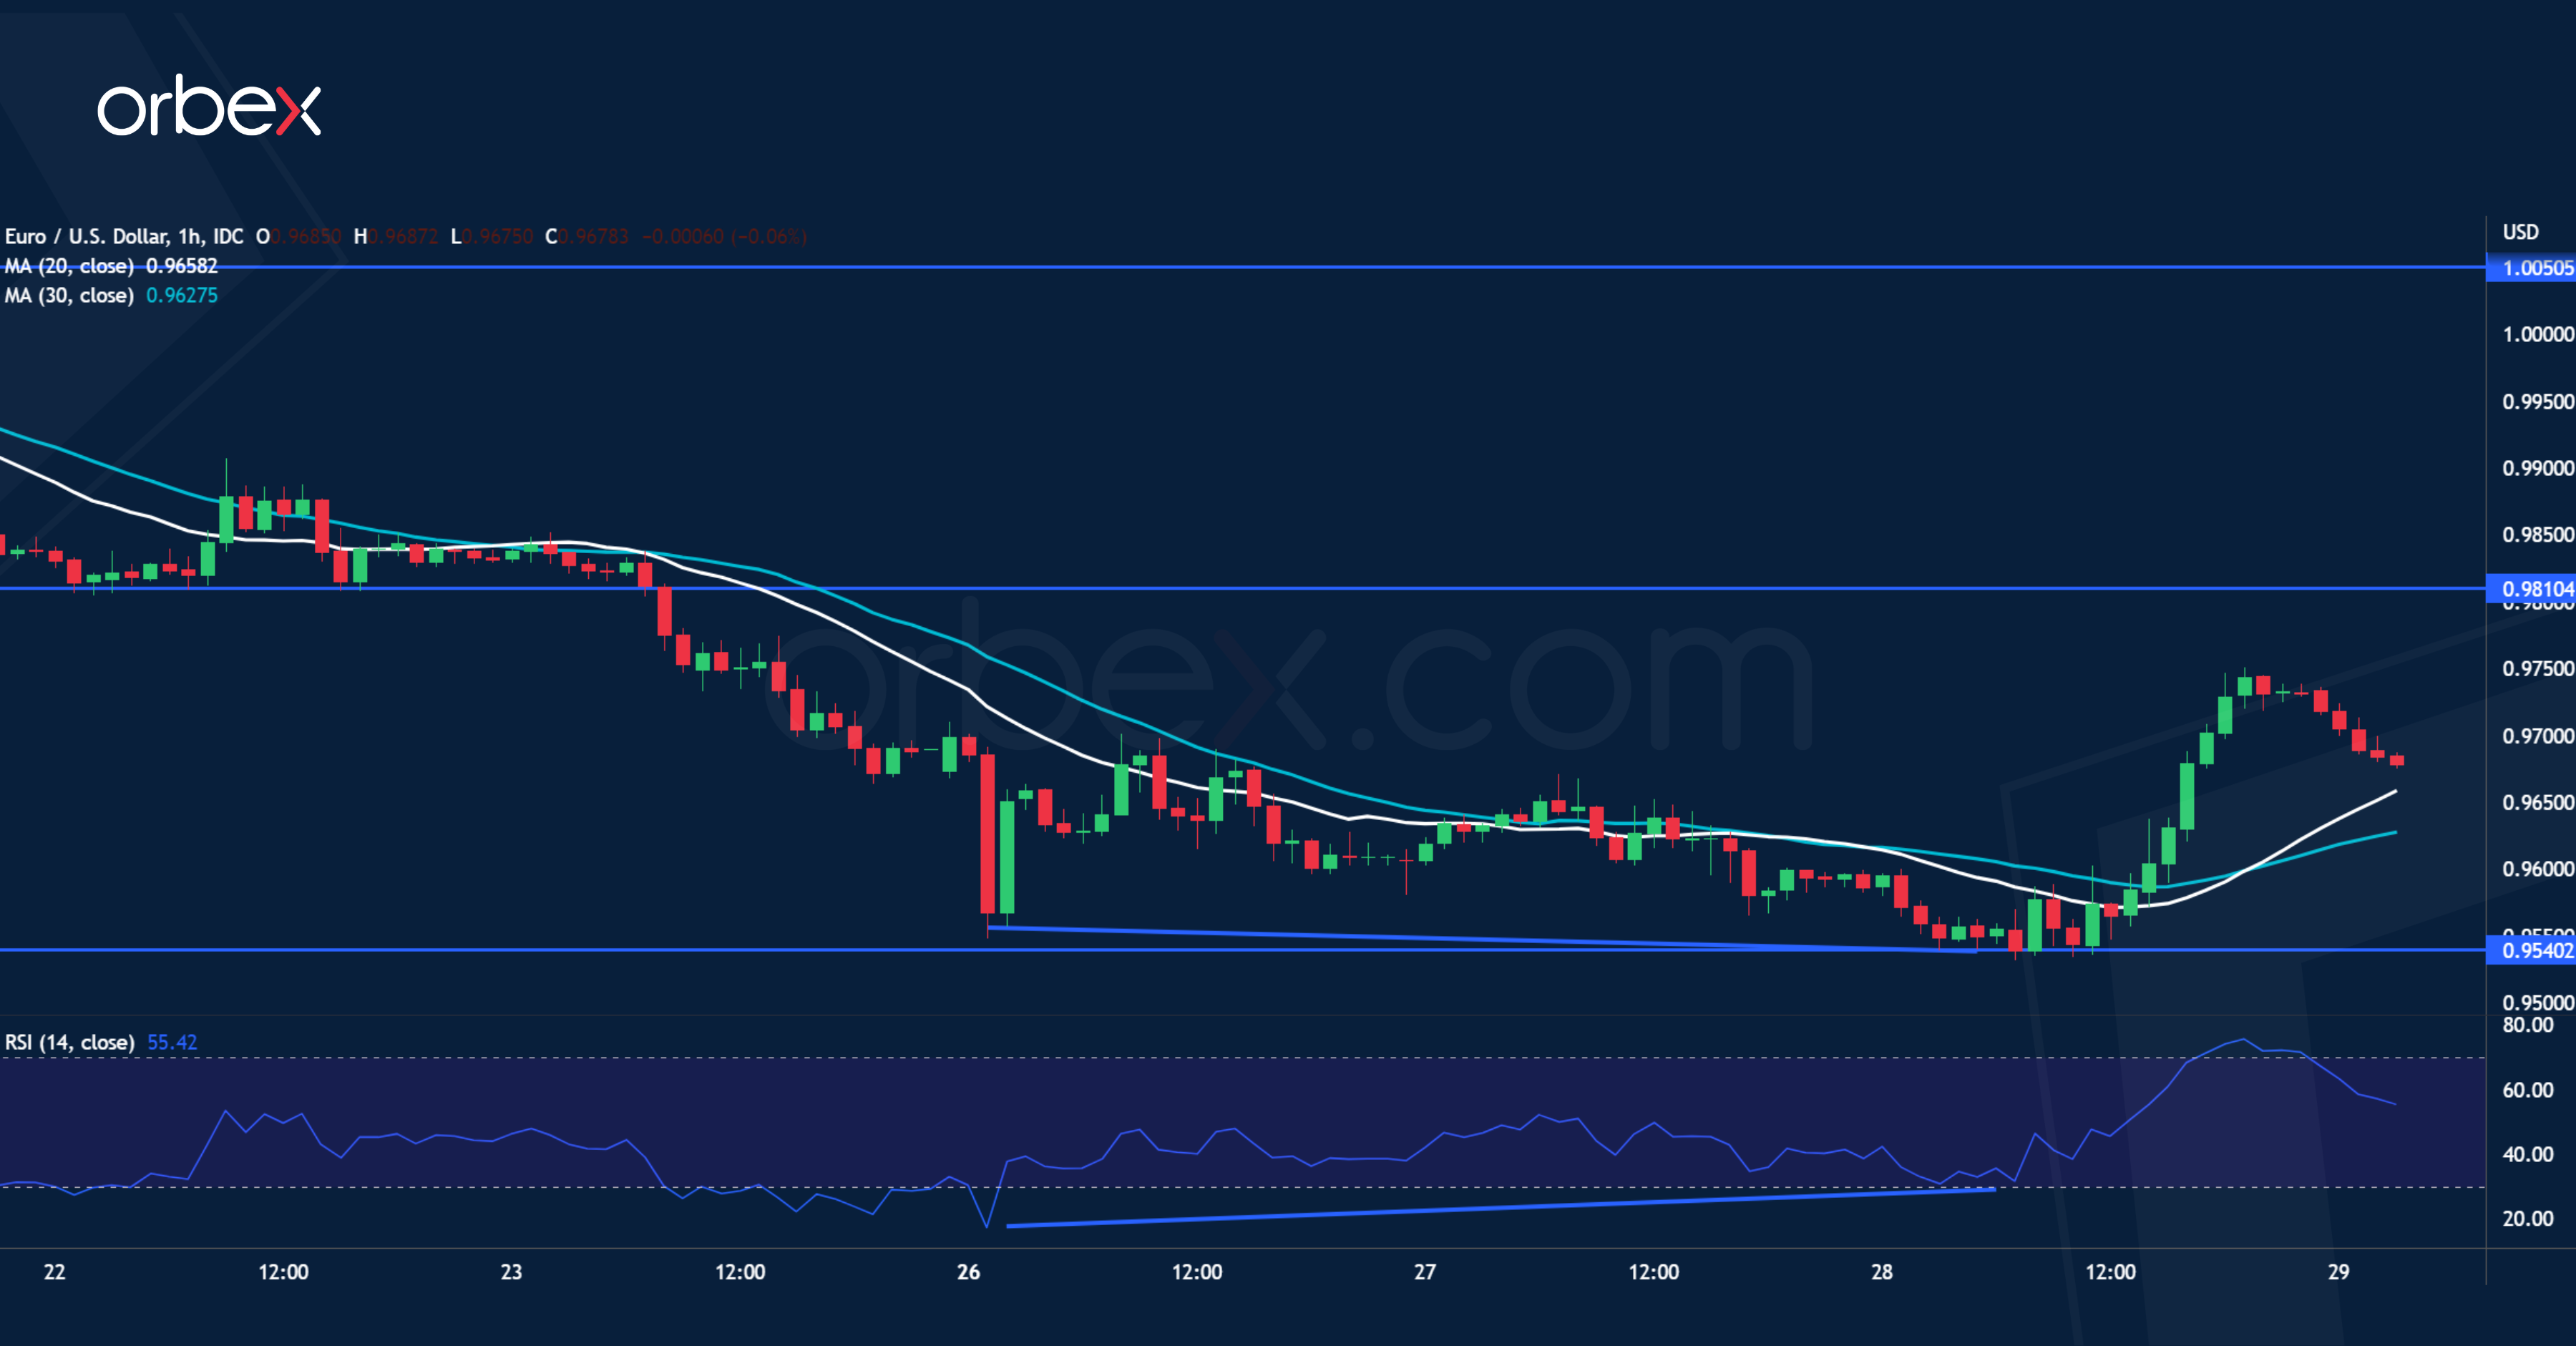
EUR/USD Attempts to Rebound
The US dollar retreats as traders take profits over a crowded trade. The RSI’s oversold situation on the daily chart shows exhaustion past parity and the dollar could use some breathing room. As the bias remains down traders may look for a higher sell point. A bullish RSI divergence suggests a slowdown in the sell-off momentum and a rise above 0.9700 has prompted more sellers to cover. 0.9810 is the next resistance and short-term sentiment would not improve unless 1.0050 is broken. 0.9540 has become the closest support.
Thanks for the Ride, Bailey
Hallelujah! The Bank of England (BoE) jumped in the UK’s shattered sovereign market to buy long-term UK bonds yesterday, because apparently, they have been warned that collateral calls on Wednesday afternoon could force investors to further dump their UK sovereign holdings. And the UK could no longer afford another heavy selloff wave on its sovereigns.
As a result, the BoE promised to buy as much as British sovereign papers as needed, to stabilize the UK’s sovereign debt market because Liz Truss government simply costs too much to the British economy. Britain needs a sugar daddy, and Mr. Bailey is now filling that position.
And the funny thing is, the BoE announcement came just a day before the Bank was supposed to start selling the bonds that it had bought during the financial crisis!
So yes, the BoE’s QT (Quantitative Tightening) was supposed to begin yesterday. But instead, the BoE made a dramatic U-turn, and started buying bonds.
And how about the QT? There will be no QT until a further announcement.
And given how the things look shaky in the UK, there will certainly be no QT in the close future.
What we will probably see is the BoE buying bonds to stabilize the UK’s sovereign market, and hiking the rates to fight inflation – and the Liz Truss’ irresponsible government.
I also believe that either Liz Truss and her Chancellor of Exchequer are on a hot seat, if they don’t take a step back from the spending package and tax cuts they announced last week.
Happily, though, the market heard Mr. Bailey, yesterday, and the UK sovereigns rallied. At least there is some confidence in the BoE – which is reassuring.
The British 10-year yield fell 10% yesterday, and the pound jumped past the 1.08 mark against the US dollar and consolidated below 0.90 against the euro. There is still a chance that the BoE’s bond buying is not enough, and that we see a surprise rate hike before the November 3rd meeting.
But at this point, the BoE can no longer let the British sovereigns, and the pound sink further.
Thanks Bailey
The surprise intervention from the BoE gave an energy boost to the markets yesterday, proving once again how the markets are addicted to the central bank money, and how they are depressed without it.
The FTSE recovered early losses and closed the session 0.30% higher, gold recovered to $1662 an ounce, American crude rallied past the $80 per barrel, also boosted by the Hurricane Ian’s negative impact on supply. Around 11% of the Gulf of Mexico production was halted due to the storm – which will certainly have a fueling effect on food and energy prices – and inflation in the US, which should’ve normally revived the Fed hawks. But the US indices rallied anyway!
The S&P500 gained almost 2% yesterday to above 3700 level, while Nasdaq jumped more than 2%.
Will the enthusiasm last? Not so sure. Yesterday’s price action was a sugar rush, triggered by the BoE intervention. Enthusiasm will likely fall as the level of blood sugar falls across the financial markets.
Vroom vroom
Porsche will be going public in a couple minutes, in unideal market conditions, but at least a day after the BoE gave a certain relief to the market.
The final listing price is near the top end of the range and is expected to give a value of around 75 billion euros to the company. Will the Porsche IPO be a flash in the pan, or could Porsche defy the law of gravity? We will see in a couple of minutes.
BoE’s Intervention Drives Broad-Based Risk-on
Market movers today
Aside from the ongoing focus on the developments in the UK and the tensions against Russia, markets will look out for the German flash inflation figures for September ahead of the Euro Area HICP tomorrow. Consensus is looking for a further uptick amid the surge in energy prices. In addition, the Euro Area Economic Sentiment Indicators are released for September, where a broad decline is expected in line with the other leading indicators released so far.
The Czech National Bank will have a monetary policy meeting, consensus expects no changes to the policy rate.
Minutes from Riksbank's September meeting will be published, while Ingves, Flodén and Ohlsson will give speeches today. Several other central bank speeches are scheduled throughout the day, including ECB's Panetta, Rehn and de Guindos as well as Fed's Mester and Daly.
The 60 second overview
BoE intervenes amid extreme bond market sell-off: EUR/GBP rose briefly yesterday to around the 0.90 mark. This comes after the BoE announced that it will buy long-end government bonds until 14 October to "restore orderly market conditions", with the gilt purchase size being up to GBP 5bn per operation. The BoE will then begin active QT (outright selling of government bonds) by 31 October, which was originally set to begin 3 October. The target still stands at reducing gilt holdings by GBP 80bn during the coming year. This intervention is intended to restore a bit more calm to the UK bond market, as opposed to the strong selling that we have seen in recent days.
Global markets seemingly affected by BoE intervention: BoE's intervention appeared to move global markets as the some 50bp decline in long-end Gilts also saw major spill-over to euro area as well as US yields, with US 10yr down some 30bp from highs. Equally, risk sentiment strongly improved and S&P500 ended the day at nearly +2%.
Equities: Yesterday we saw a tiny rally based on the UK QE and the reason for writing tiny is that the reversal of UK bond yields was extreme compared to the rally in equities. Cyclicals did not even outperform despite the equity rally, as health care was among the best sectors while tech was among the worst performers. VIX ticked lower but Min Vol outperformed and quality made its seventh consecutive day of outperformance. This tells the equity story about how the UK QE move in no way was a positive macro story but purely an action to avoid the worst-case scenario in financial markets. In US, Dow +1.8%, S&P500 +2.0%, Nasdaq +2.1%, Russell 2000 +3.2%. Some relief in Asia this morning and lift to European futures while US futures are flat.
FI: Yesterday, the market was all focused on the UK drivers. Until the BoE announcement of its decision to conduct temporary bond purchases on a daily basis until 14 October of GBP 5bn/day and only start QT on 31 October, UK gilts were trading heavy. From the announcement however to the end of day, we saw the 10y Gilt down more than 50bp and the 30y Gilt down by more than 1pp. Bund ASW widened above the 100bp mark again yesterday.
FX: GBP made headlines again as it briefly rose above 0.90 following BoE's decision to do temporary QE to stabilise the UK bond market. USD/JPY trades close to the 145 mark as 10Y US Treasury yields touched 4%.
Credit: Having taken out the peak in spreads reached during the pandemic yesterday, iTraxx Main eventually ended the day 4bp tighter at 135bp helped by the BoE's intervention. Meanwhile, Crossover was 20bp tighter at 651bp. Unsurprisingly, given the volatility issuance activity was limited with no corporate EUR deals priced and in FIG space only one Euro covered bond was launched.
Technical Outlook and Review
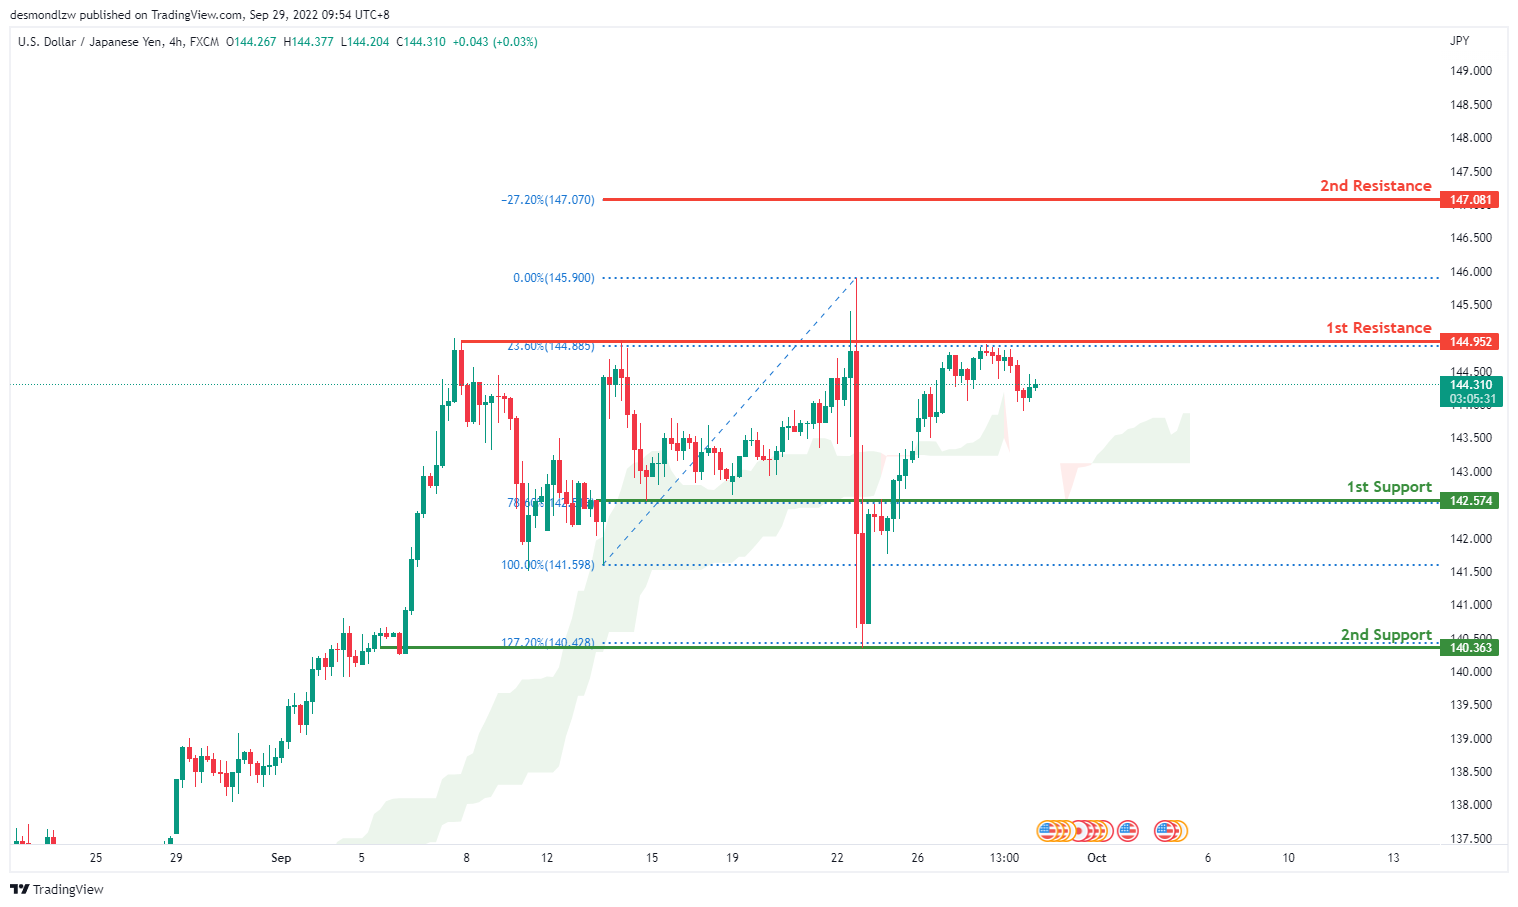
USD/JPY:
On the H4 chart, price has pushed through very strongly through the 1st support at 142.574 where the 78.6% Fibonacci line lies. Price has tapped and tried to break through the 1st resistance multiple times at 144.952 where the 23.6% Fibonacci line lies. Looking for price to possibly reflect back down from the 1st resistance back down towards the 1st support at 142.574 where the 78.6% Fibonacci line is. Alternatively, price might break through the 1st resistance and head towards the 2nd resistance at 147.070 where the -27.2% Fibonacci expansion line is.
Areas of consideration:
- H4 time frame, 1st resistance at 144.952
- H4 time frame, 1st support at 142.574
DXY:
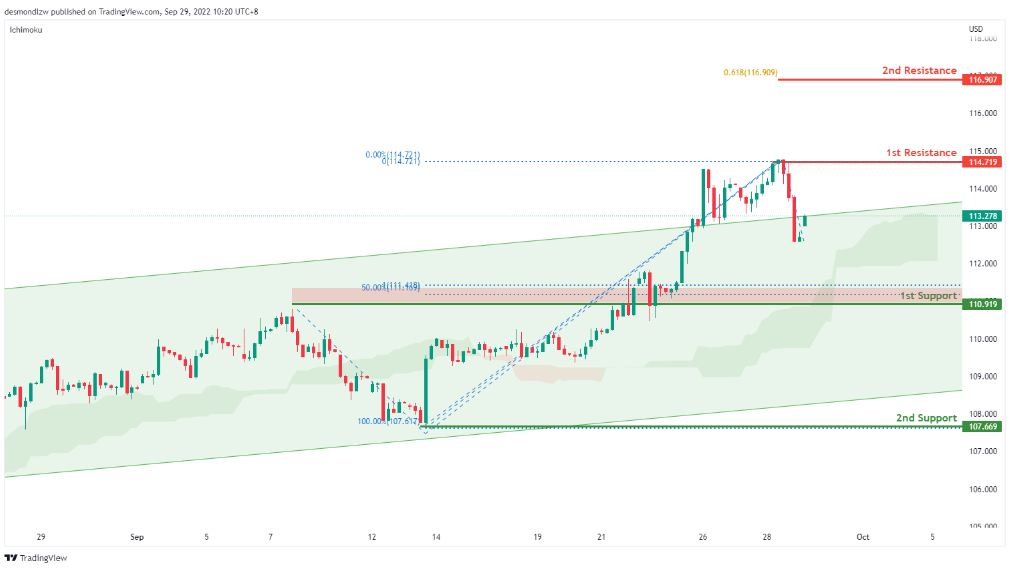
On the H4, price is still respecting the ichimoku and ascending trend hence we are bullish bias. Price has tested the first resistance at 114.719 levels where the previous swing high sits. If it breaks this level, there is a confirmation for strong bullish momentum and price might test the second resistance at 116.507 where the 61.8% sits. Alternatively price could pull back to test the first support at 110.919 where the 50% retracement and 100% projection sits. If price breaks this support it should test the second support at 107.669 where the previous swing low sits
Areas of consideration:
- H4 time frame, 1st resistance at 114.719
- H4 time frame, 1st support at 110.919
EUR/USD:
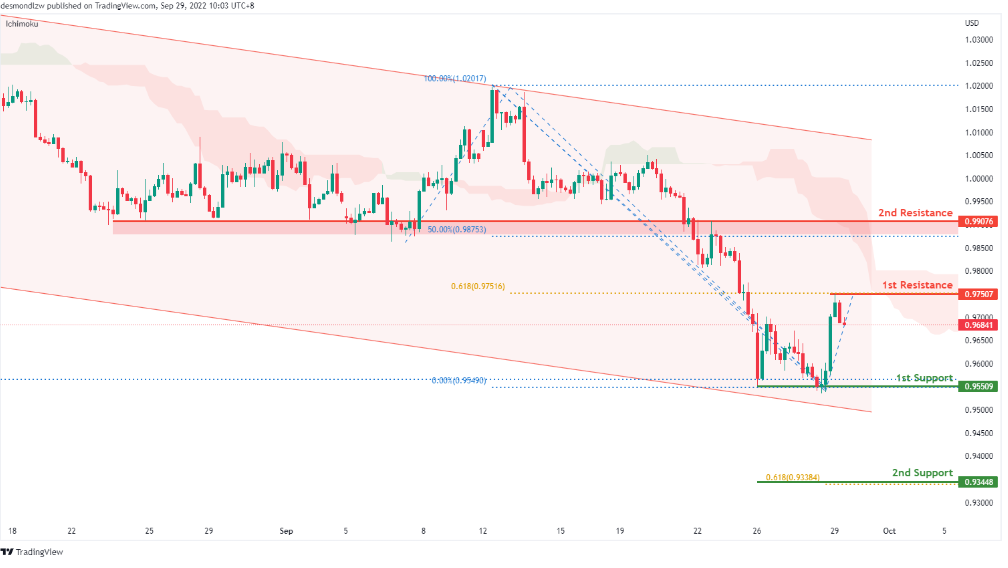
On the H4, price is moving within the channel in a descending manner- we are bearish biased. Price has bounced off the first support and is moving toward the first resistance at 0.9750 where the 61.8% projection sits. If price breaks this level, it will test the second resistance at 0.9907 where the 50% retracement and 100% projection sits. Alternatively, strong bearish momentum should bring price back to test the first resistance at 0.9550 where the previous swing low and 161.8% extension sits. If it breaks this level, we have a strong bearish confirmation to bring price down to 0.9344 where the 61.8% projection sits
Areas of consideration :
- H4 1st resistance at 0.9750
- H4 1st support at 0.9550
GBP/USD:
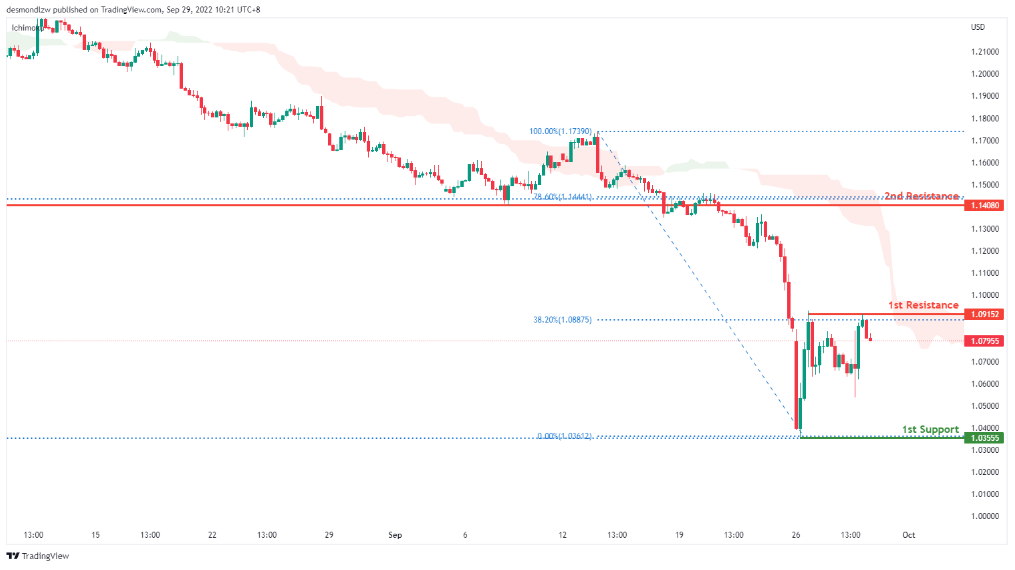
On the daily time frame, prices are still moving in a bearish momentum and have rejected the first resistance hence we are bearish biassed. Price has already tested the previous swing low at 1.0355 where the 138.2% extension sits. If bearish momentum continues, it should bring price to 0.9665 where the 161.8% extension sits. Alternatively price could pull back to test the first resistance at 1.0915 where the 38.2% retracement sits then the second resistance at 1.1408 where the previous swing low and 78.6% retracement sits
Areas of consideration:
- H4 1st resistance at 1.0915
- H4 1st support at 1.0355
USD/CHF:
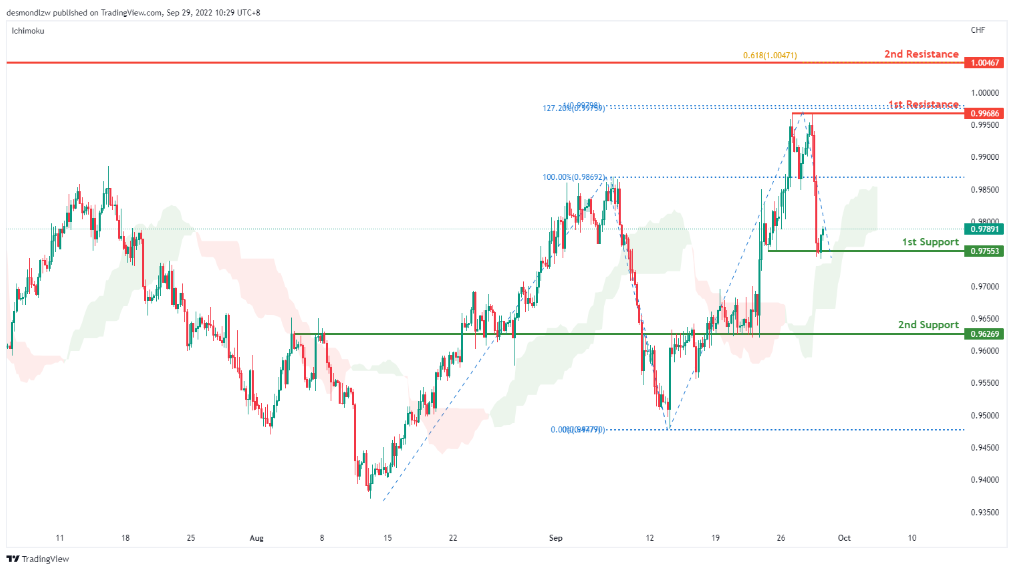
On the H4, prices have broken the descending channel and are still moving above the ichimoku cloud- we are bullish biased. Price has broken and rejected the first support and is moving toward the first resistance at 0.9968 where the 100% projection,127.2% extension and swing high sits. If bullish momentum continues, it should bring price to the second resistance at 1.0046 where the 61.8% projection and previous swing high sits. Alternatively, price could pull back to test the first support at 0.9755 where the 23.6% retracement and overlapping resistance sits. If it breaks the first support, it should bring price to the second support at 0.9626 where the previous swing low sits.
Areas of consideration
- H4 1st support at 0.9755
- H4 1st resistance at 0.9968
XAU/USD (GOLD):
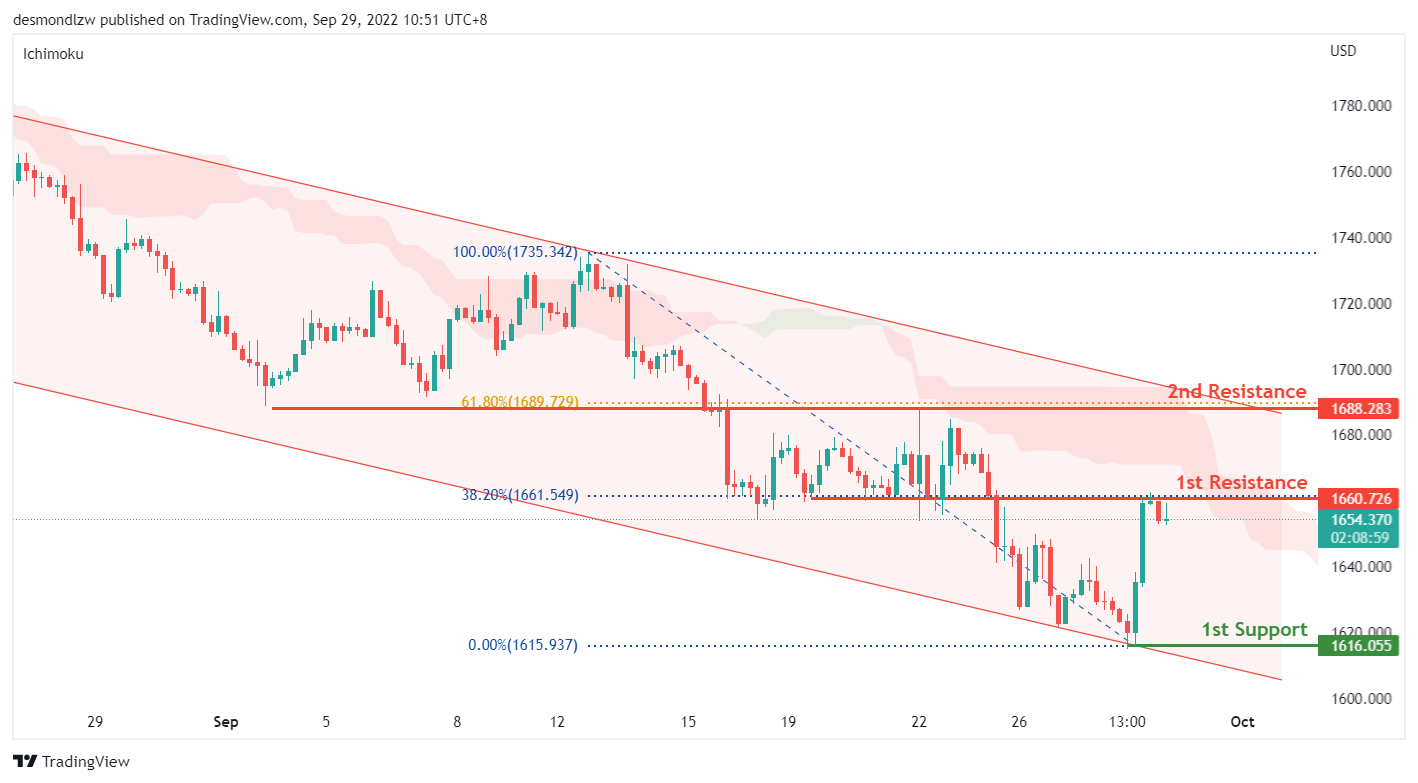
On the H4, with the price retracing from the 1st support of 1616 but still within the bearish channel and below the ichimoku cloud, we continue to have a bearish bias that price may reverse from the 1st resistance of 1660, which is in line with the 38.20% fibonacci retracement level. Alternatively, price could trade higher to test the top of the bearish channel and the 2nd resistance and 61.80% fibonacci level at 1688.
Areas of consideration:
- H4 time frame, 1st resistance at 1660
- H4 time frame, 2nd resistance at 1688
- H4 time frame, 1st support at 1616
AUD/USD:
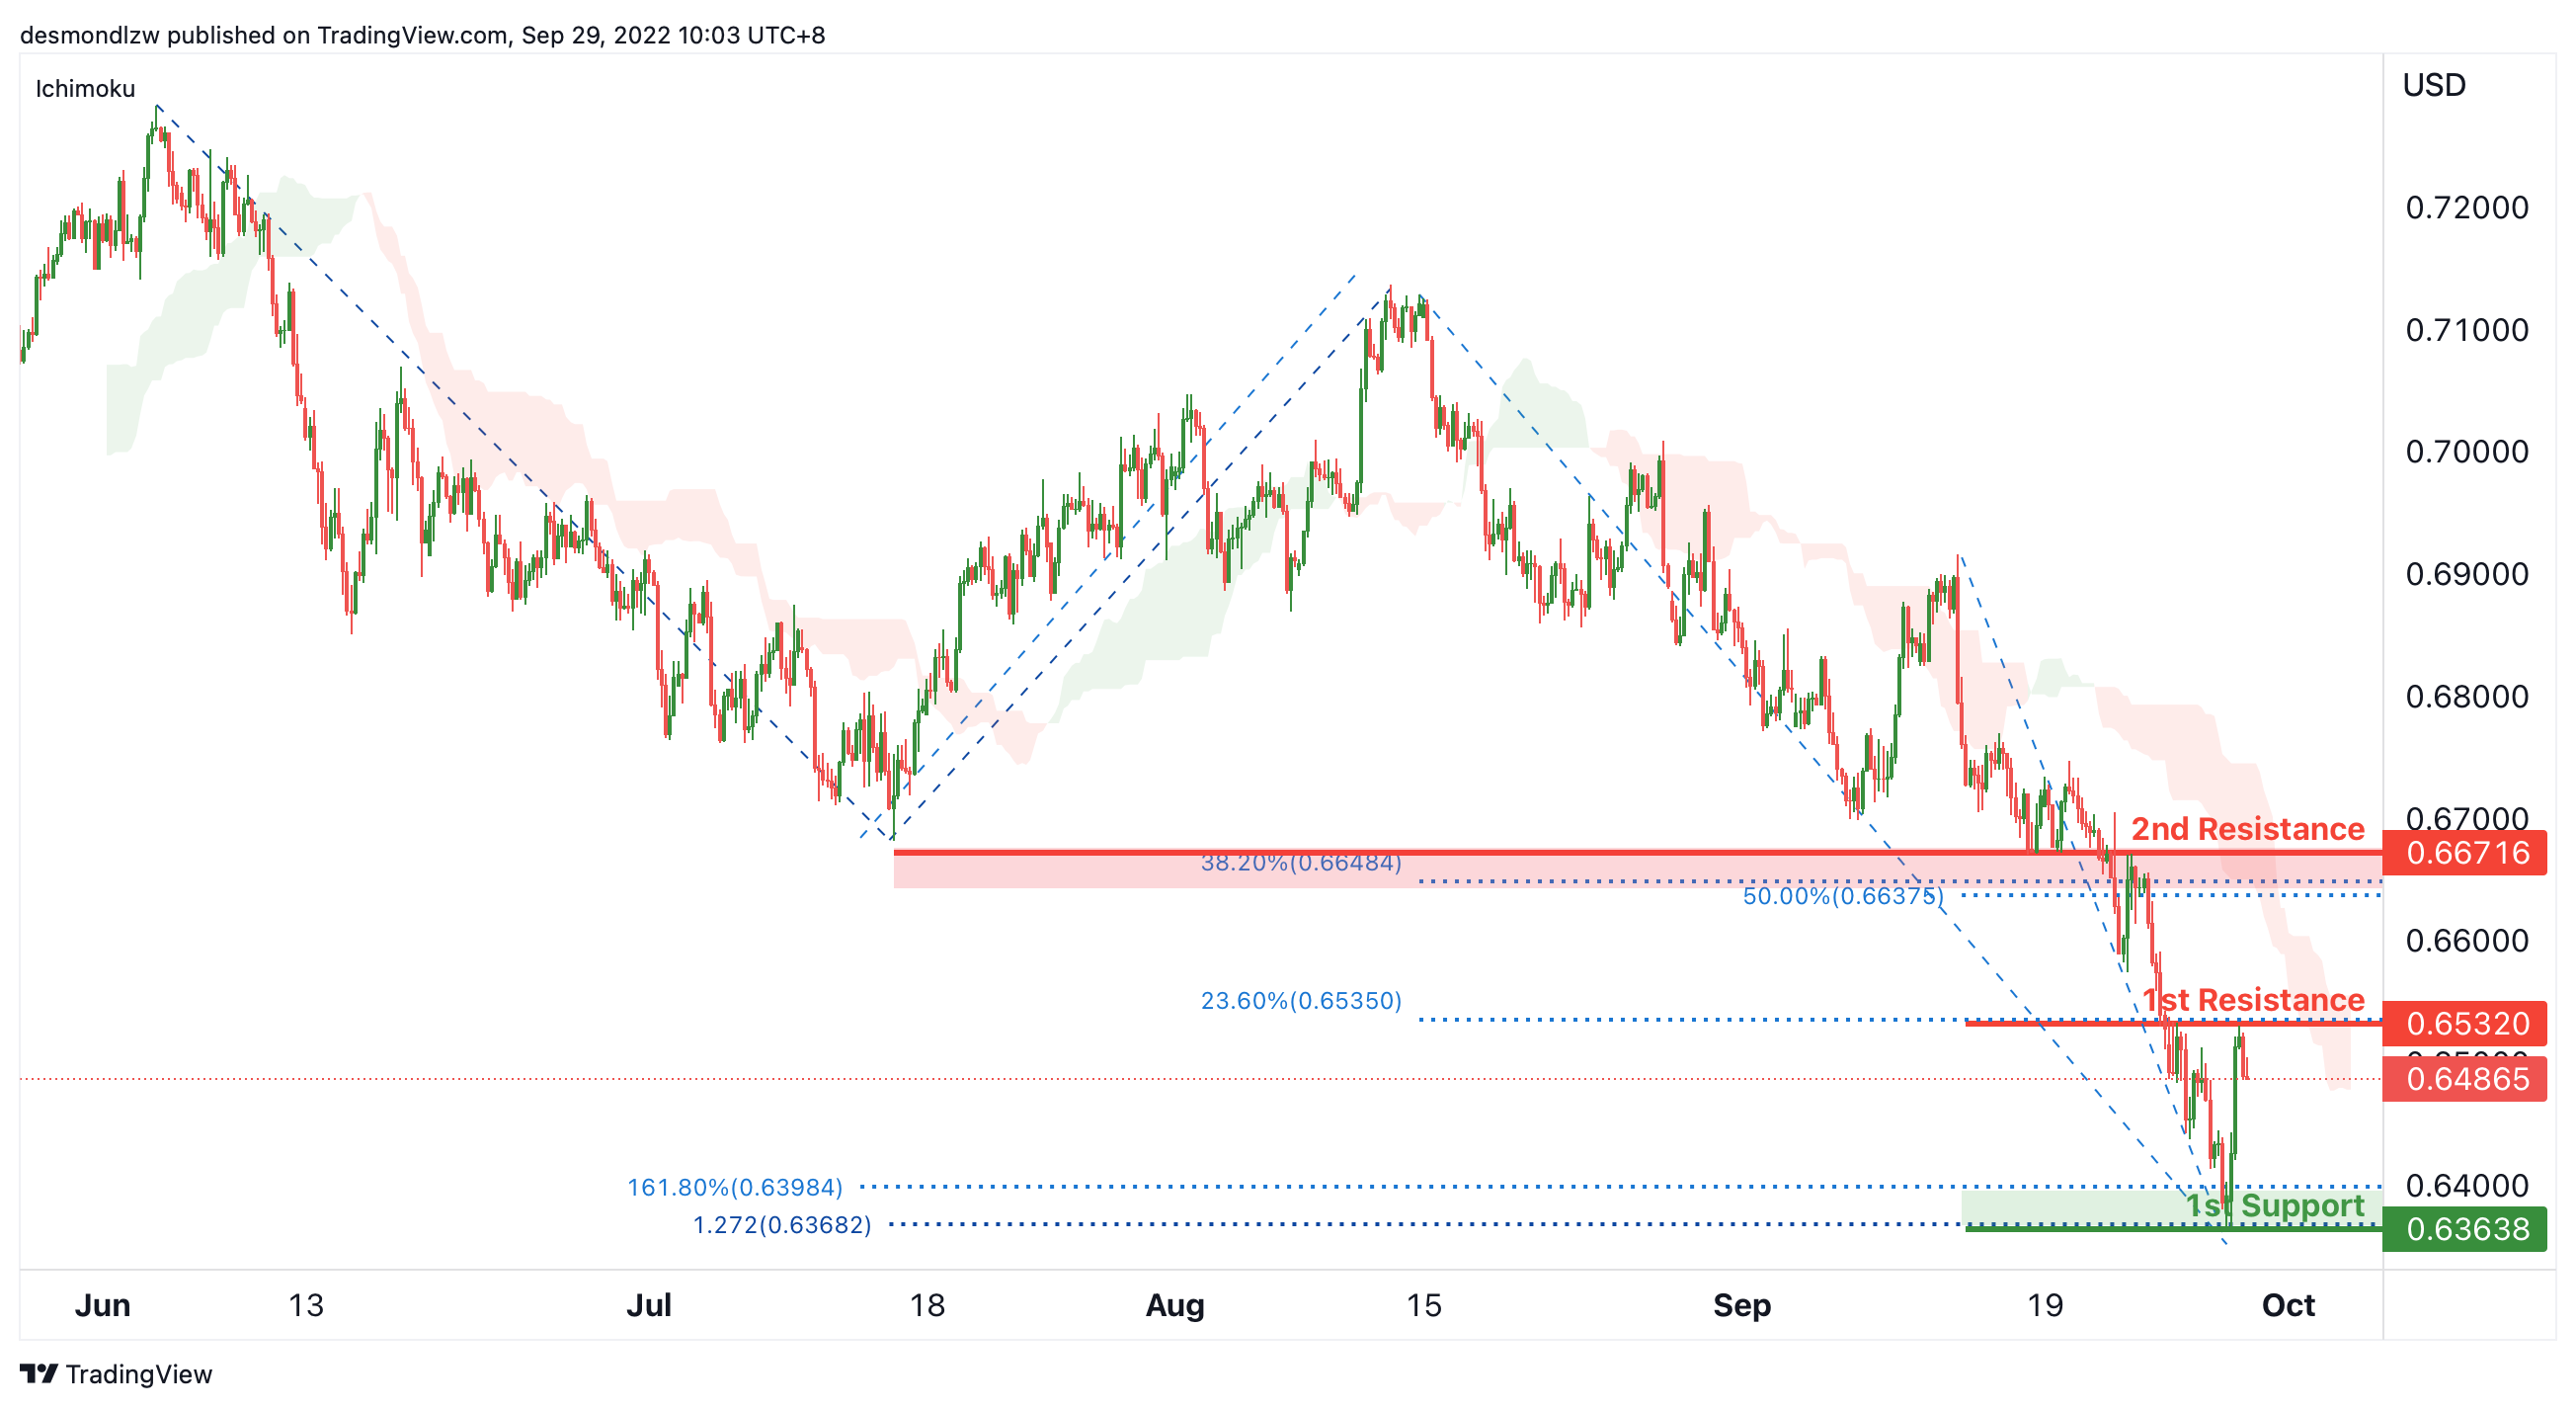
On the H4, the price is moving in a strong bearish trend. To add on confluence to this bias, price is below the Ichimoku cloud which indicates a bear market. Currently, the price is testing the 1st resistance at 0.65320, which is in line with the 23.6% fibonacci retracement. The price may drop from here to the 1st support at 0.63638, which is in line with the swing low, 161.8% fibonacci extension and 127.2% fibonacci projection. Alternatively, the price may rise to the 2nd resistance at 0.66716, where the pullback resistance, 50% and 38.2% fibonacci retracement are.
Areas of consideration
- H4, 1st resistance at 0.65320
- H4, 1st support at 0.63638
NZD/USD:
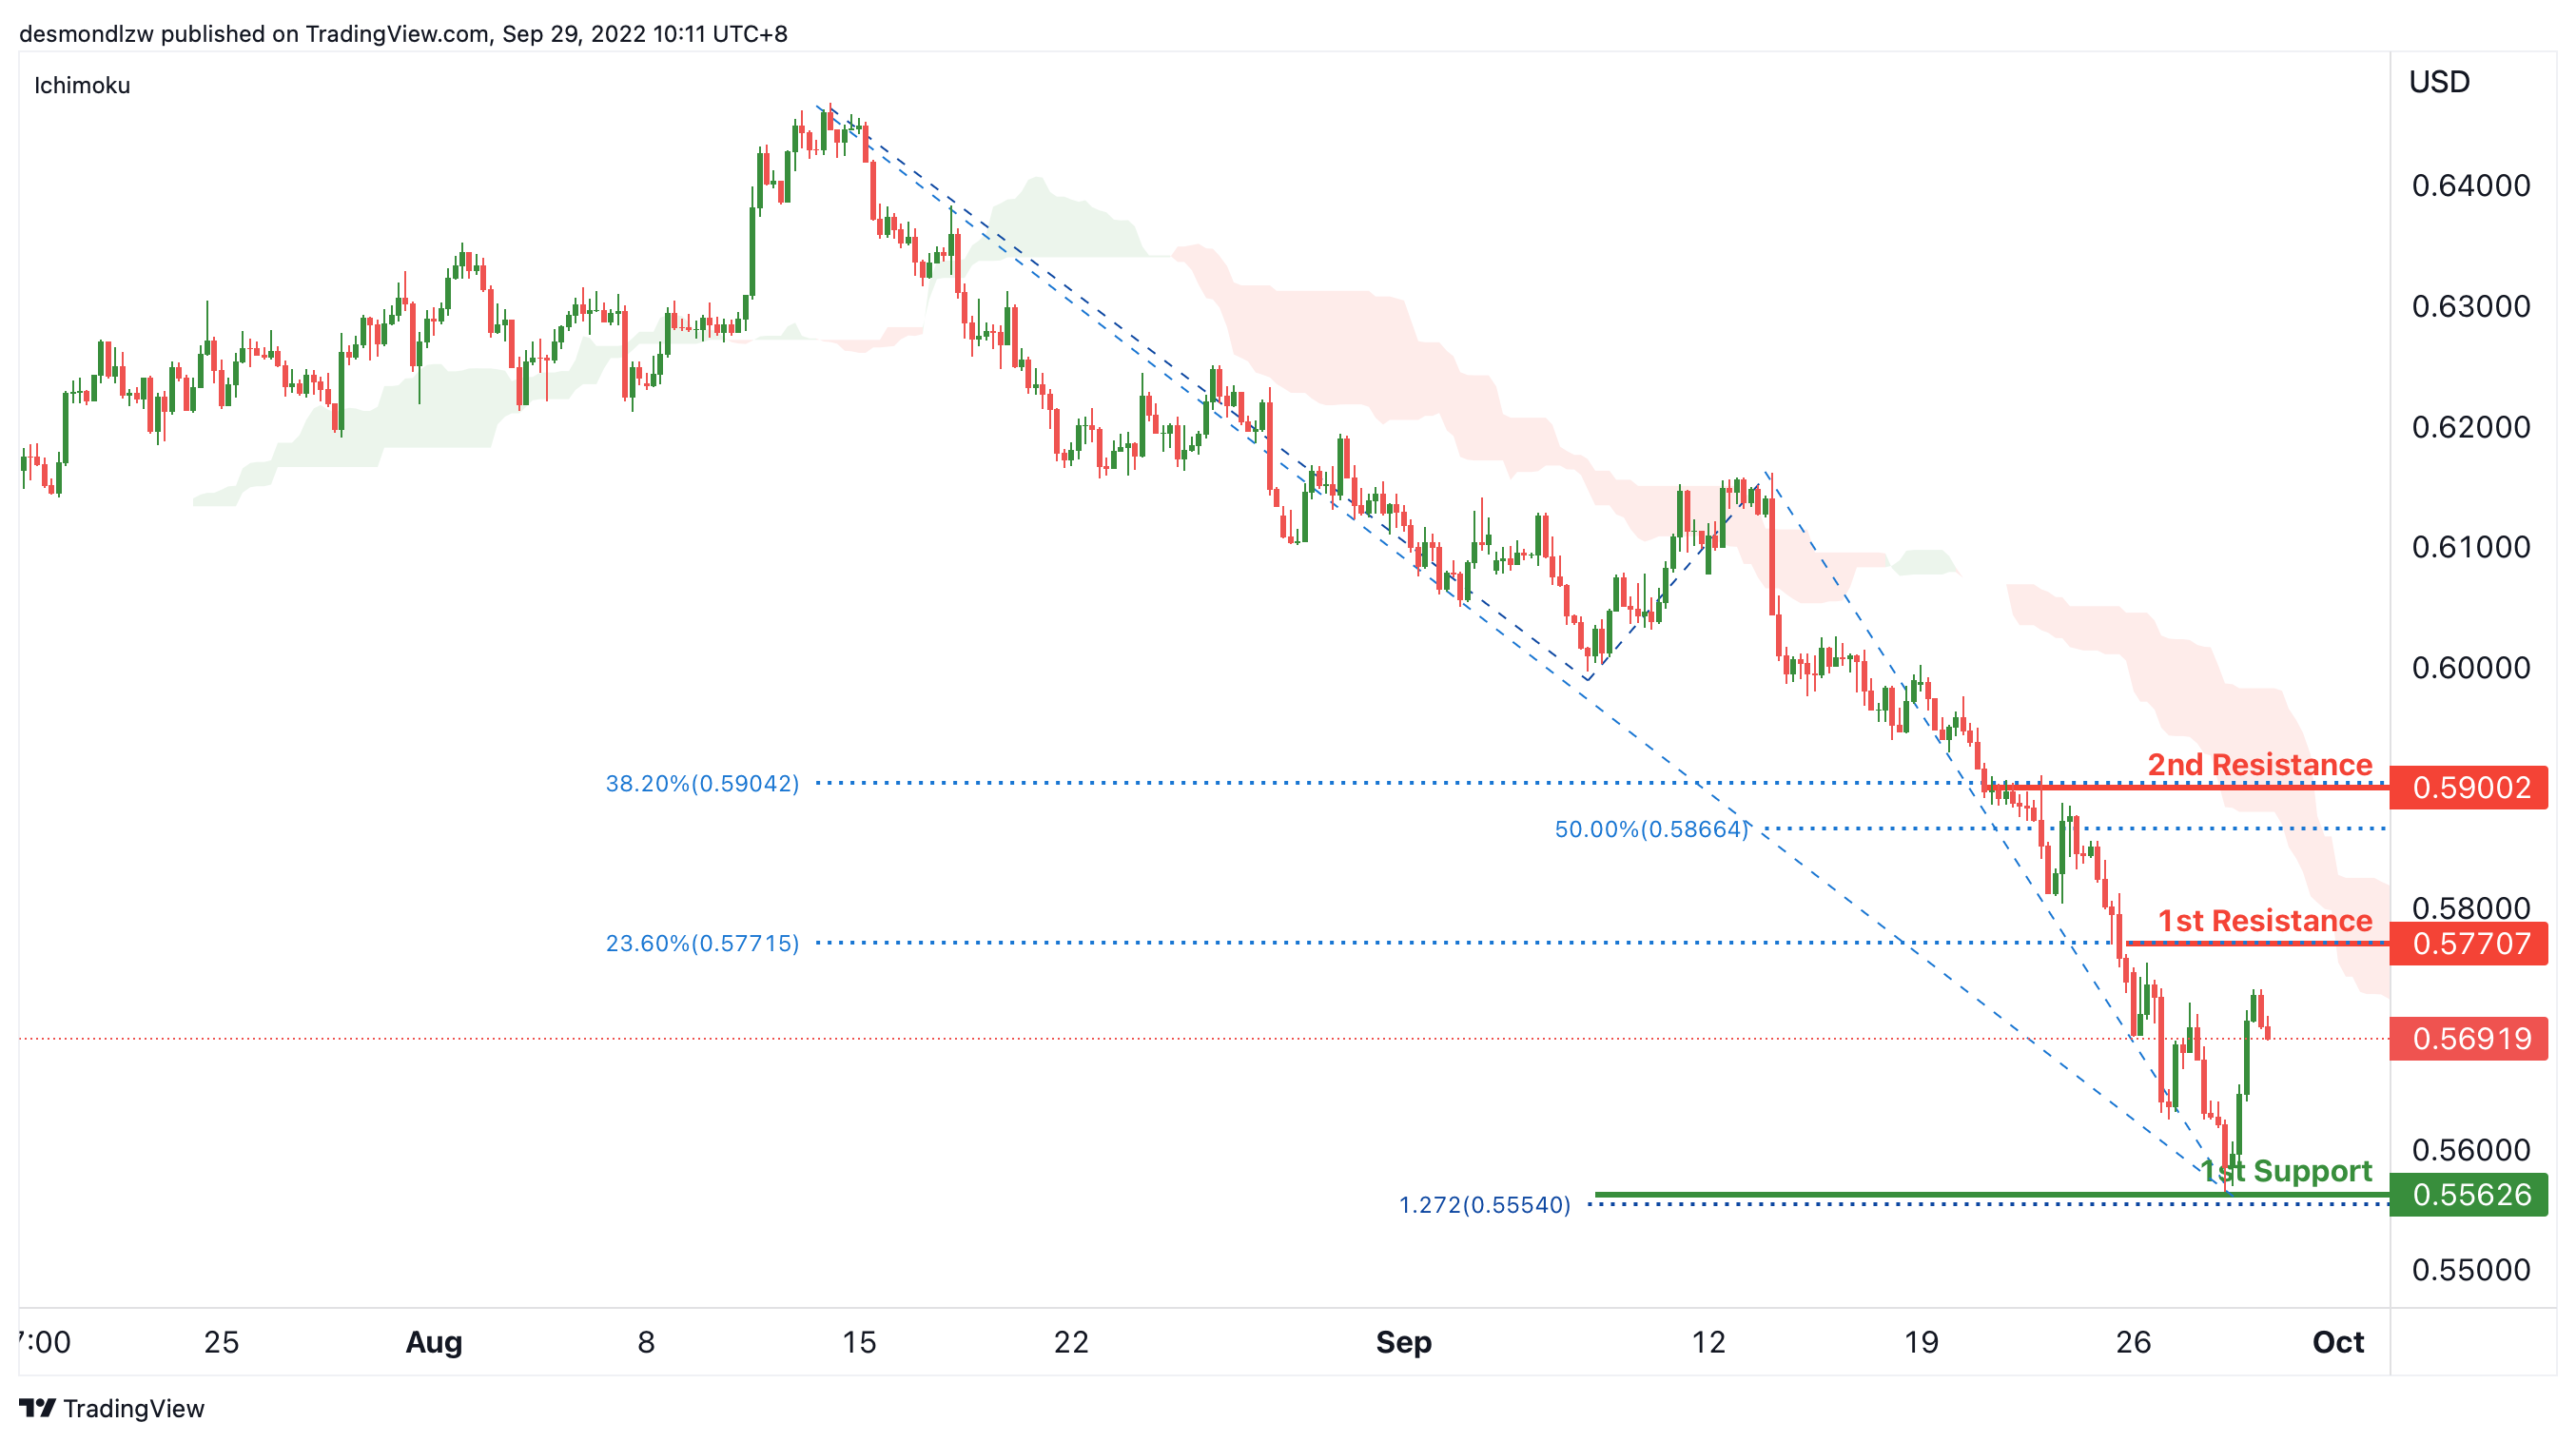
On the H4, with the price moving below the ichimoku cloud, we maintain a bearish bias that the price may test the 1st resistance at 0.57707, which is in line with the 23.6% fibonacci retracement and then drop to the 1st support at 0.55626, where the swing low and 127.2% fibonacci projection are. Alternatively, the price may break the 1st resistance and rise to the 2nd resistance at 0.59002, where the 38.2% and 50% fibonacci retracement are.
Areas of consideration:
- H4 time frame, 1st resistance at 0.57707
- H4 time frame, 1st support at 0.55626
USD/CAD:
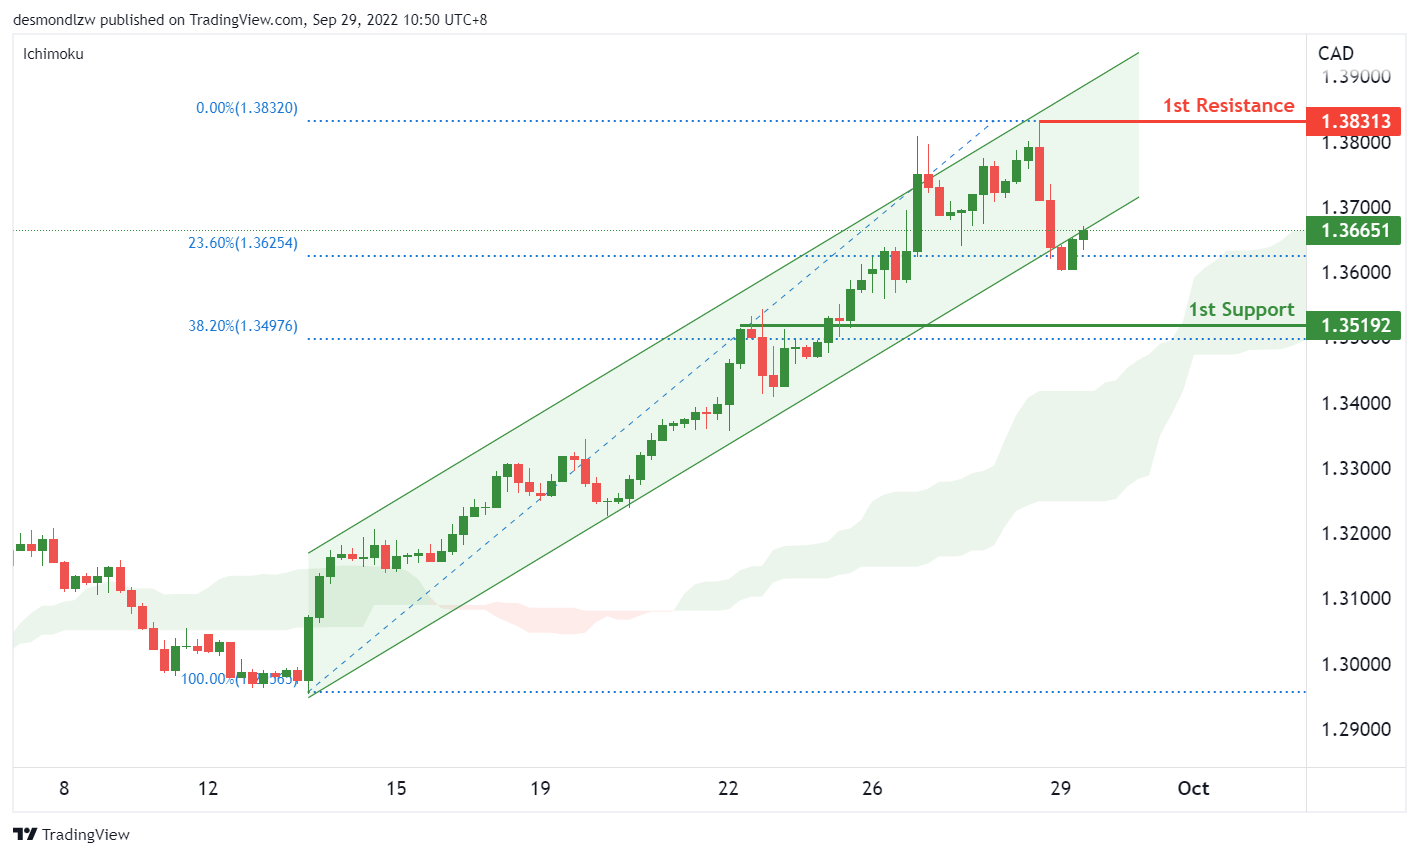
On the H4, the price broke out of the ascending channel but maintains above the ichimoku cloud. We continue to have a bullish bias that price may rise to the 1st resistance at 1.3831, previous swing major swing high. Currently price is at the 23.60% retracement level which could form a good intermediate support level to trigger the next move up to our resistance level.
Areas of consideration:
- H4 time frame, 1st resistance at 1.3831
- H4 time frame, 1st support at 1.3519
OIL:
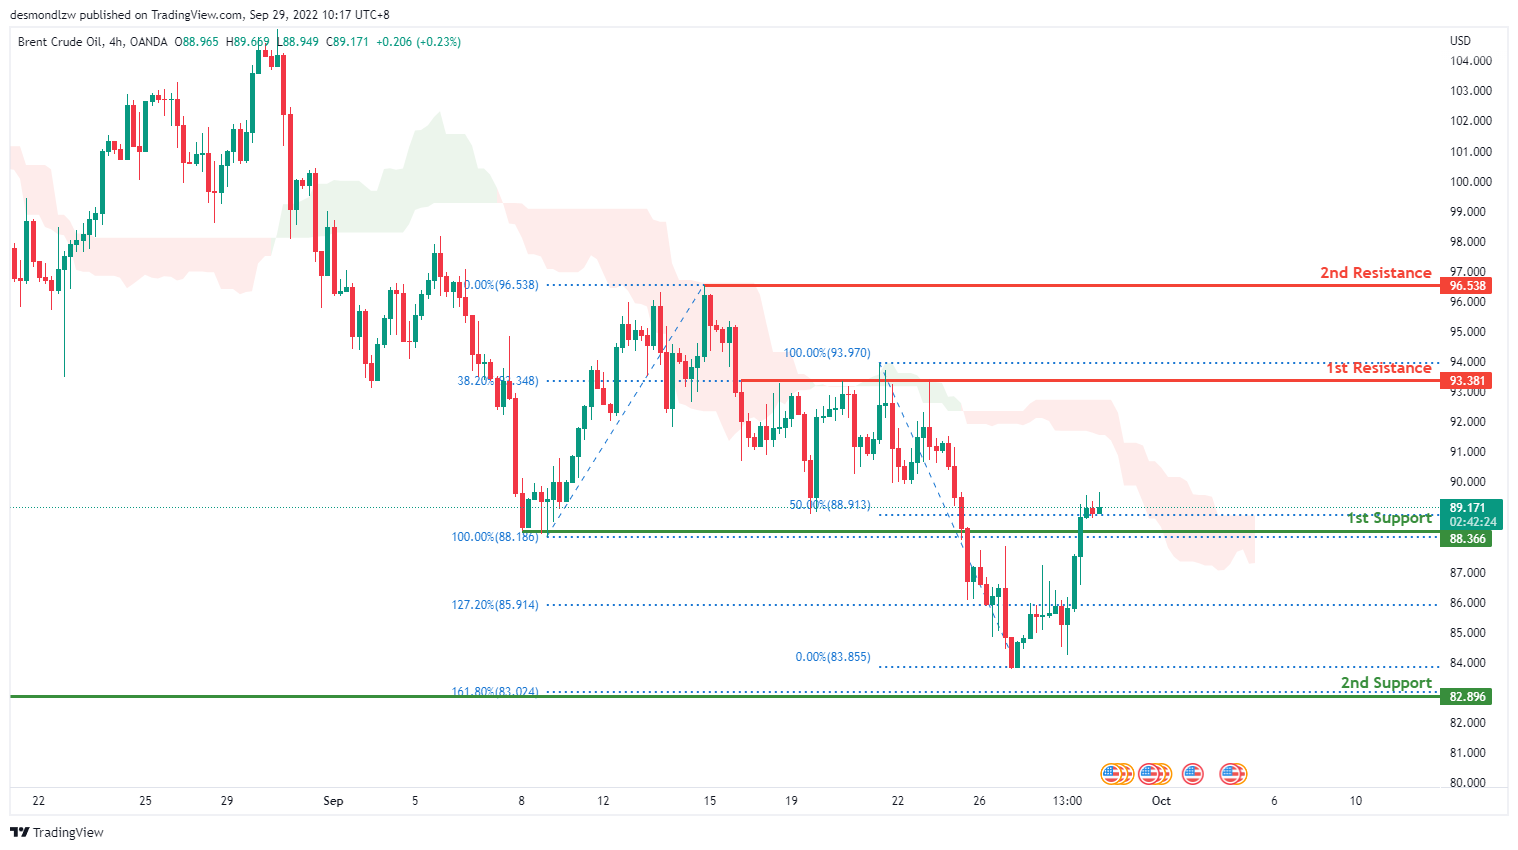
On the H4, oil is on a bearish trend and to add confluence to this, the price is below the ichimoku cloud which indicates a bear market. However, Price has broken back up the 1st support at 85.380 where the 100% Fibonacci extension lies. Expect price to possibly go to the 1st resistance at 93.381 where the 38.2% Fibonacci extension line is.
Areas of consideration:
- H4 time frame, 1st resistance at 93.381
- H4 time frame, 1st support at 88.366
Dow Jones Industrial Average:
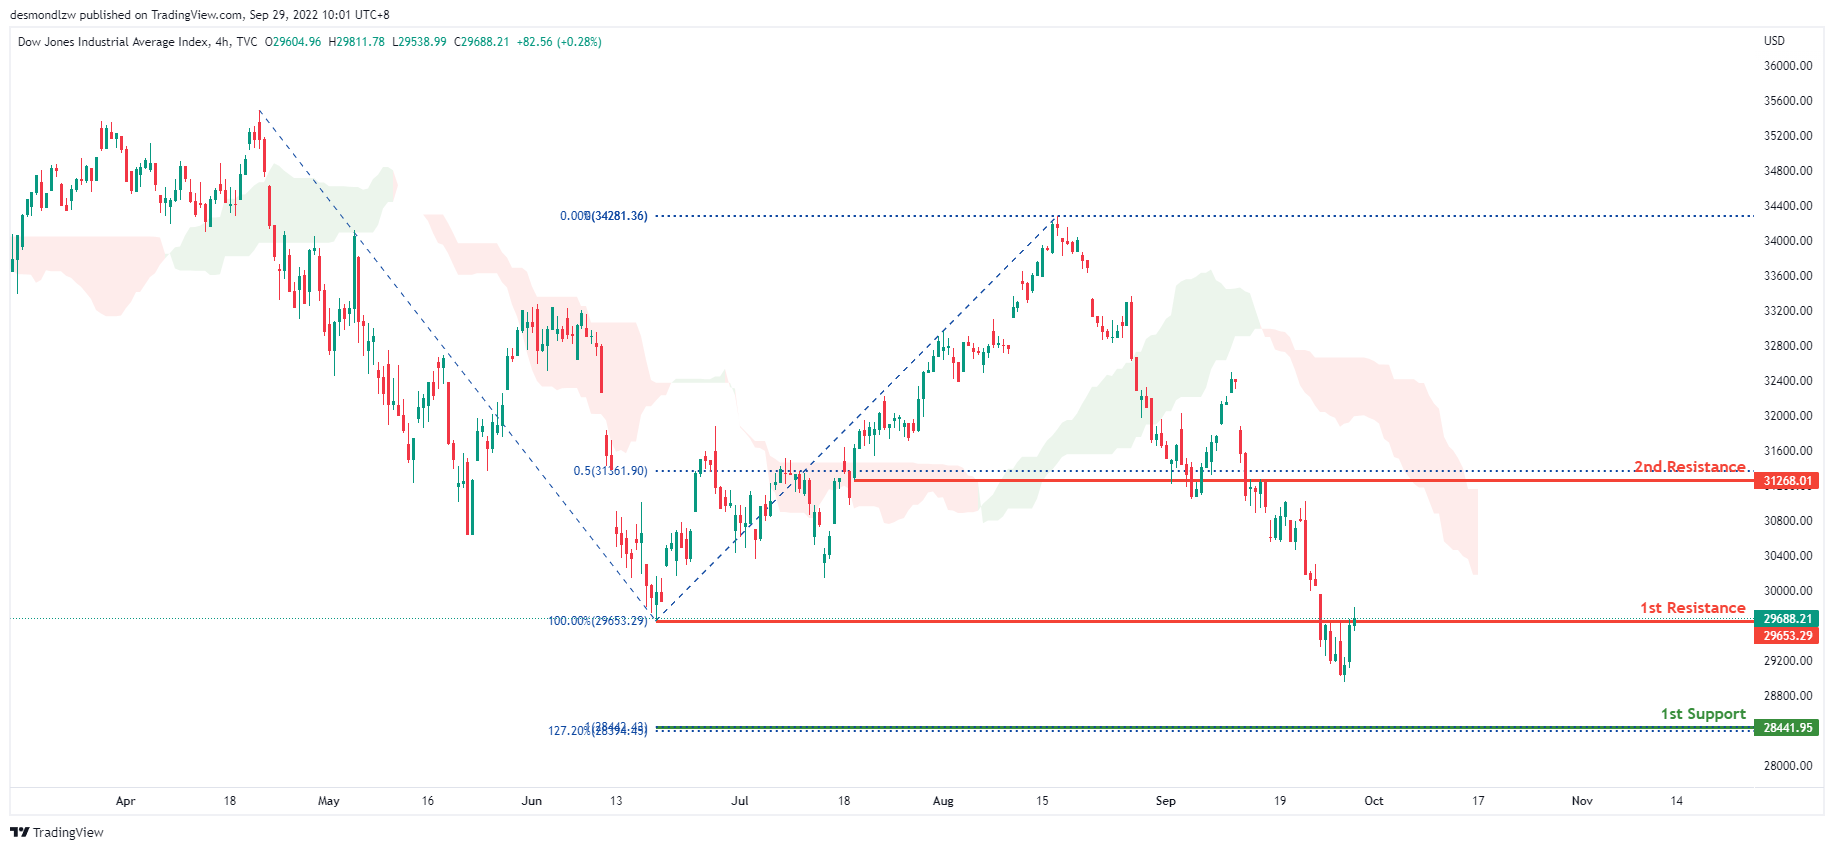
On the H4, price is on a very bearish trend. To add confluence to this, price is below the ichimoku cloud which indicates a bearish market. Price has also broke through and close back up the 1st support at 29653.29, where the 100% Fibonacci line and previous swing low lies. Since price has broken back above the 1st support , expect price to possibly head back up towards the 1st resistance at 31268.01 where the 50% Fibonacci line is.
Areas of consideration:
- H4 time frame, 1st support at 29653.29
- H4 time frame, 1st resistance at 31268.01
DAX:
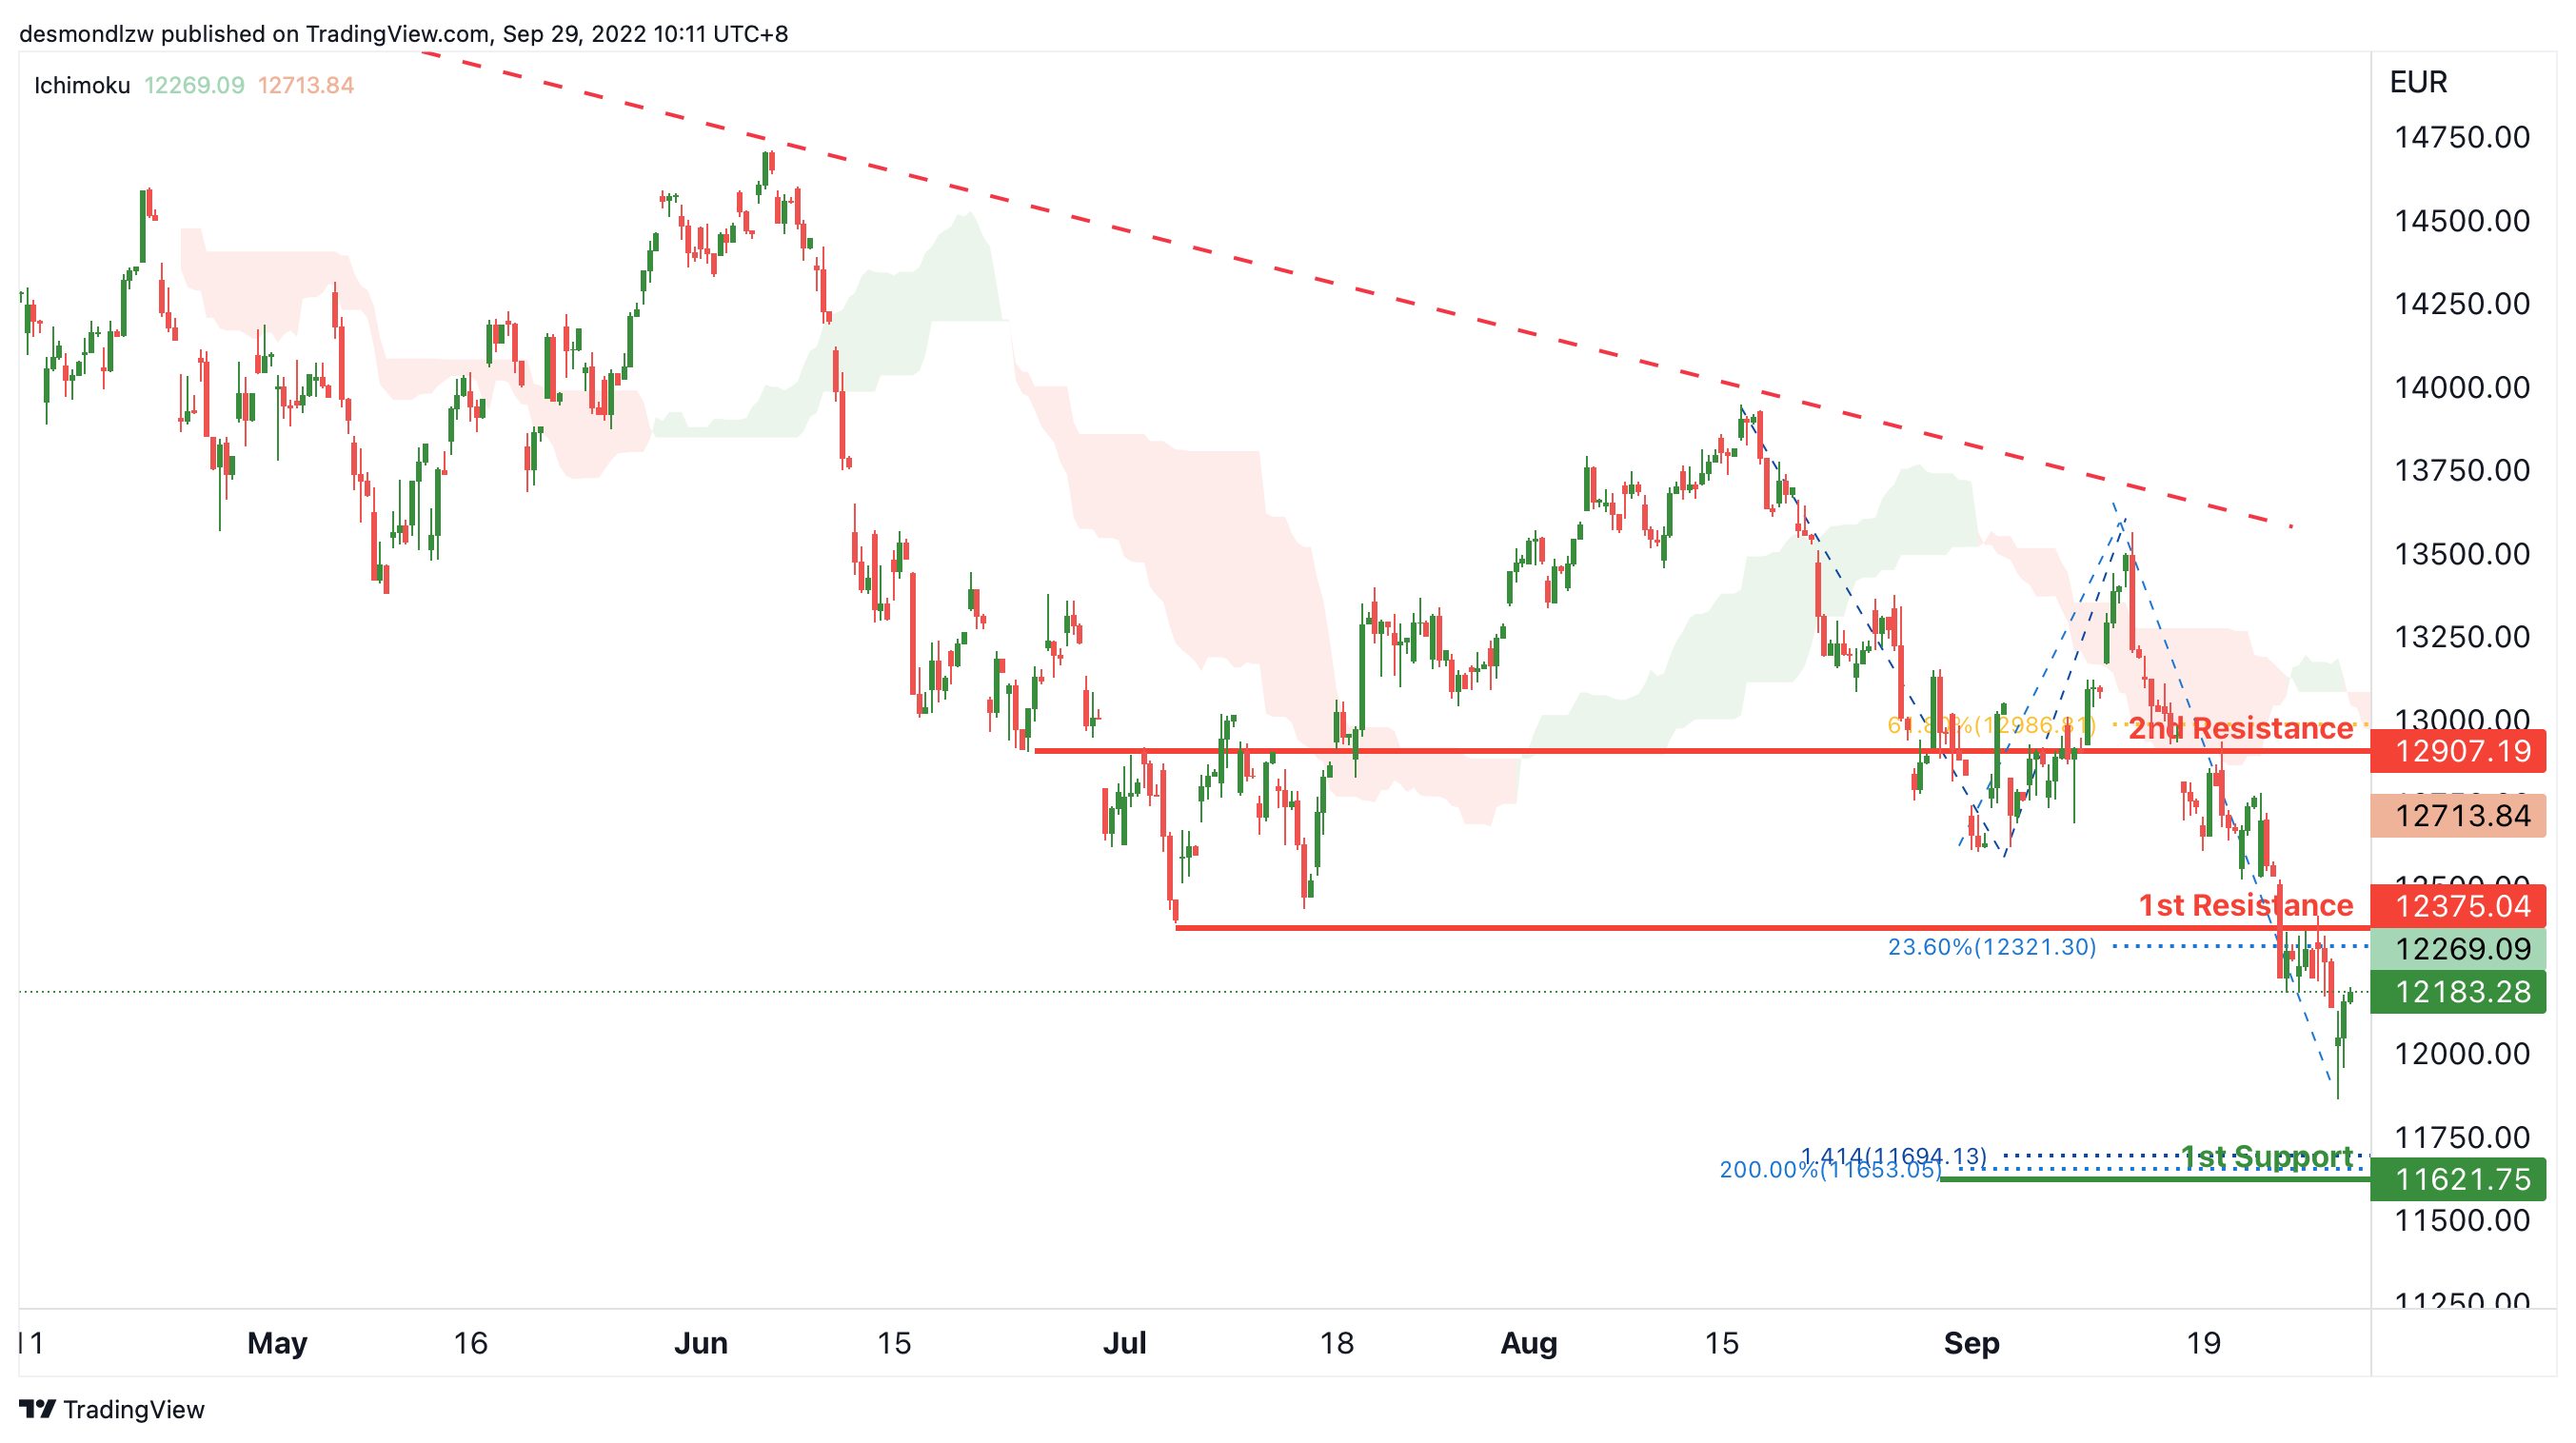
On the H4, with the price moving below the descending trendline and below ichimoku cloud, we have a bearish bias that the price may test the 1st resistance at 12375.04, which is in line with the overlap resistance and 23.6% fibonacci retracement and drop to the 1st support at 11621.75, where the 141.4% fibonacci projection and 200% fibonacci projection are. Alternatively, the price may rise to the 2nd resistance at 12907.19, where the 61.8% fibonacci retracement is.
Areas of consideration:
- H4 time frame, 1st resistance at 12375.04
- H4 time frame, 1st support at 11621.75
ETHUSD:
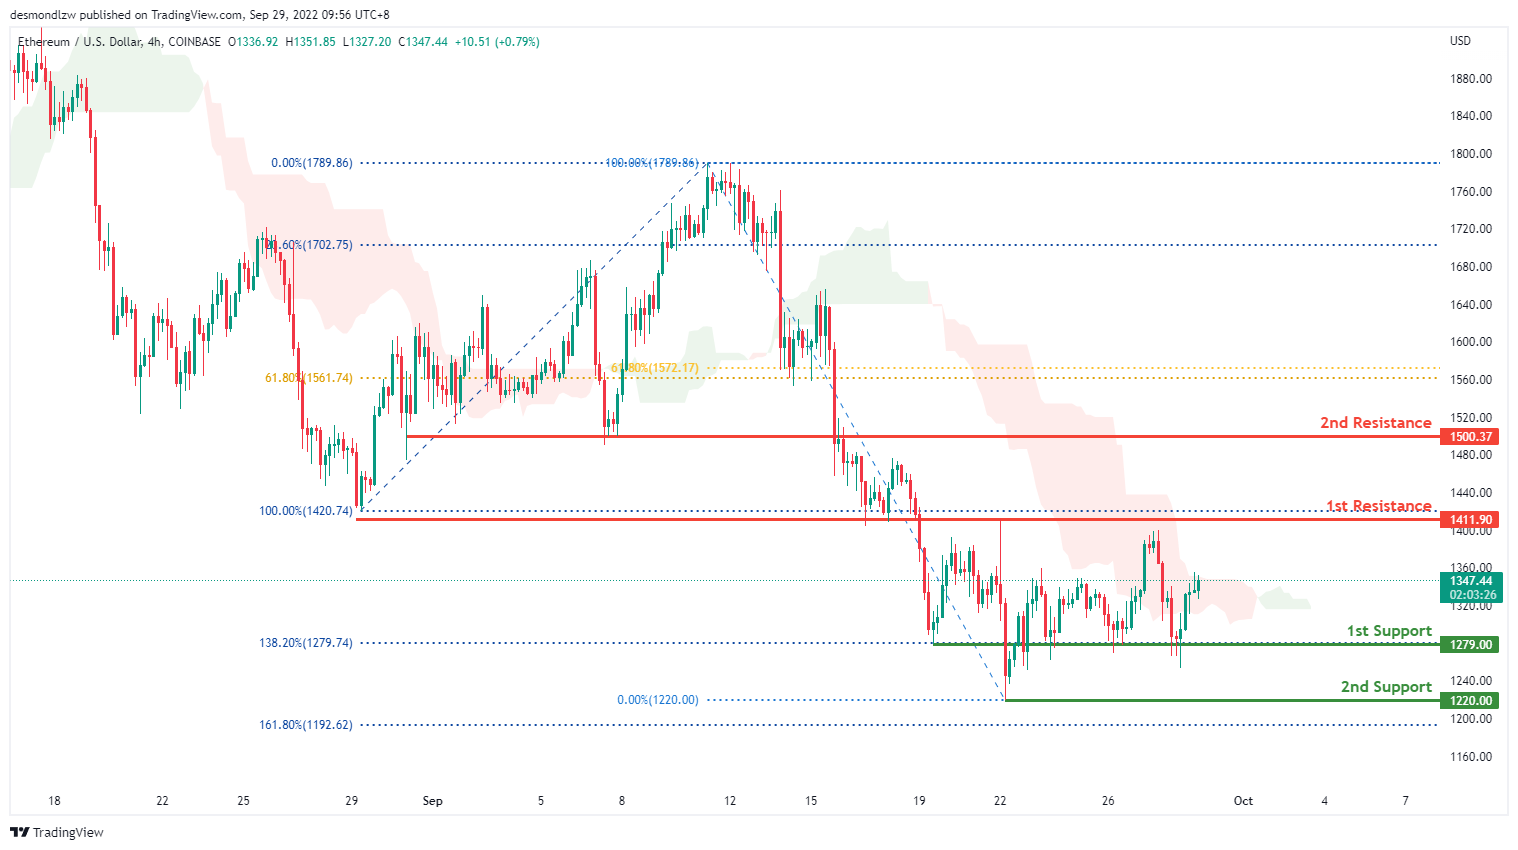
On the H4, overall price is very bearish on ETHUSD. Price has reflected off the 1st support at 1279.74 where the 138.2% Fibonacci line lies 6 times which indicates that the 1st support is a very strong level. Watching for price to head back up and potentially break through the 1st resistance at 1411.9 where the 100% Fibonacci line and previous swing low is.
Areas of consideration:
- H4 time frame, 1st resistance of 1411.90
- H4 time frame, 1st support at 1279.00
BTCUSD:
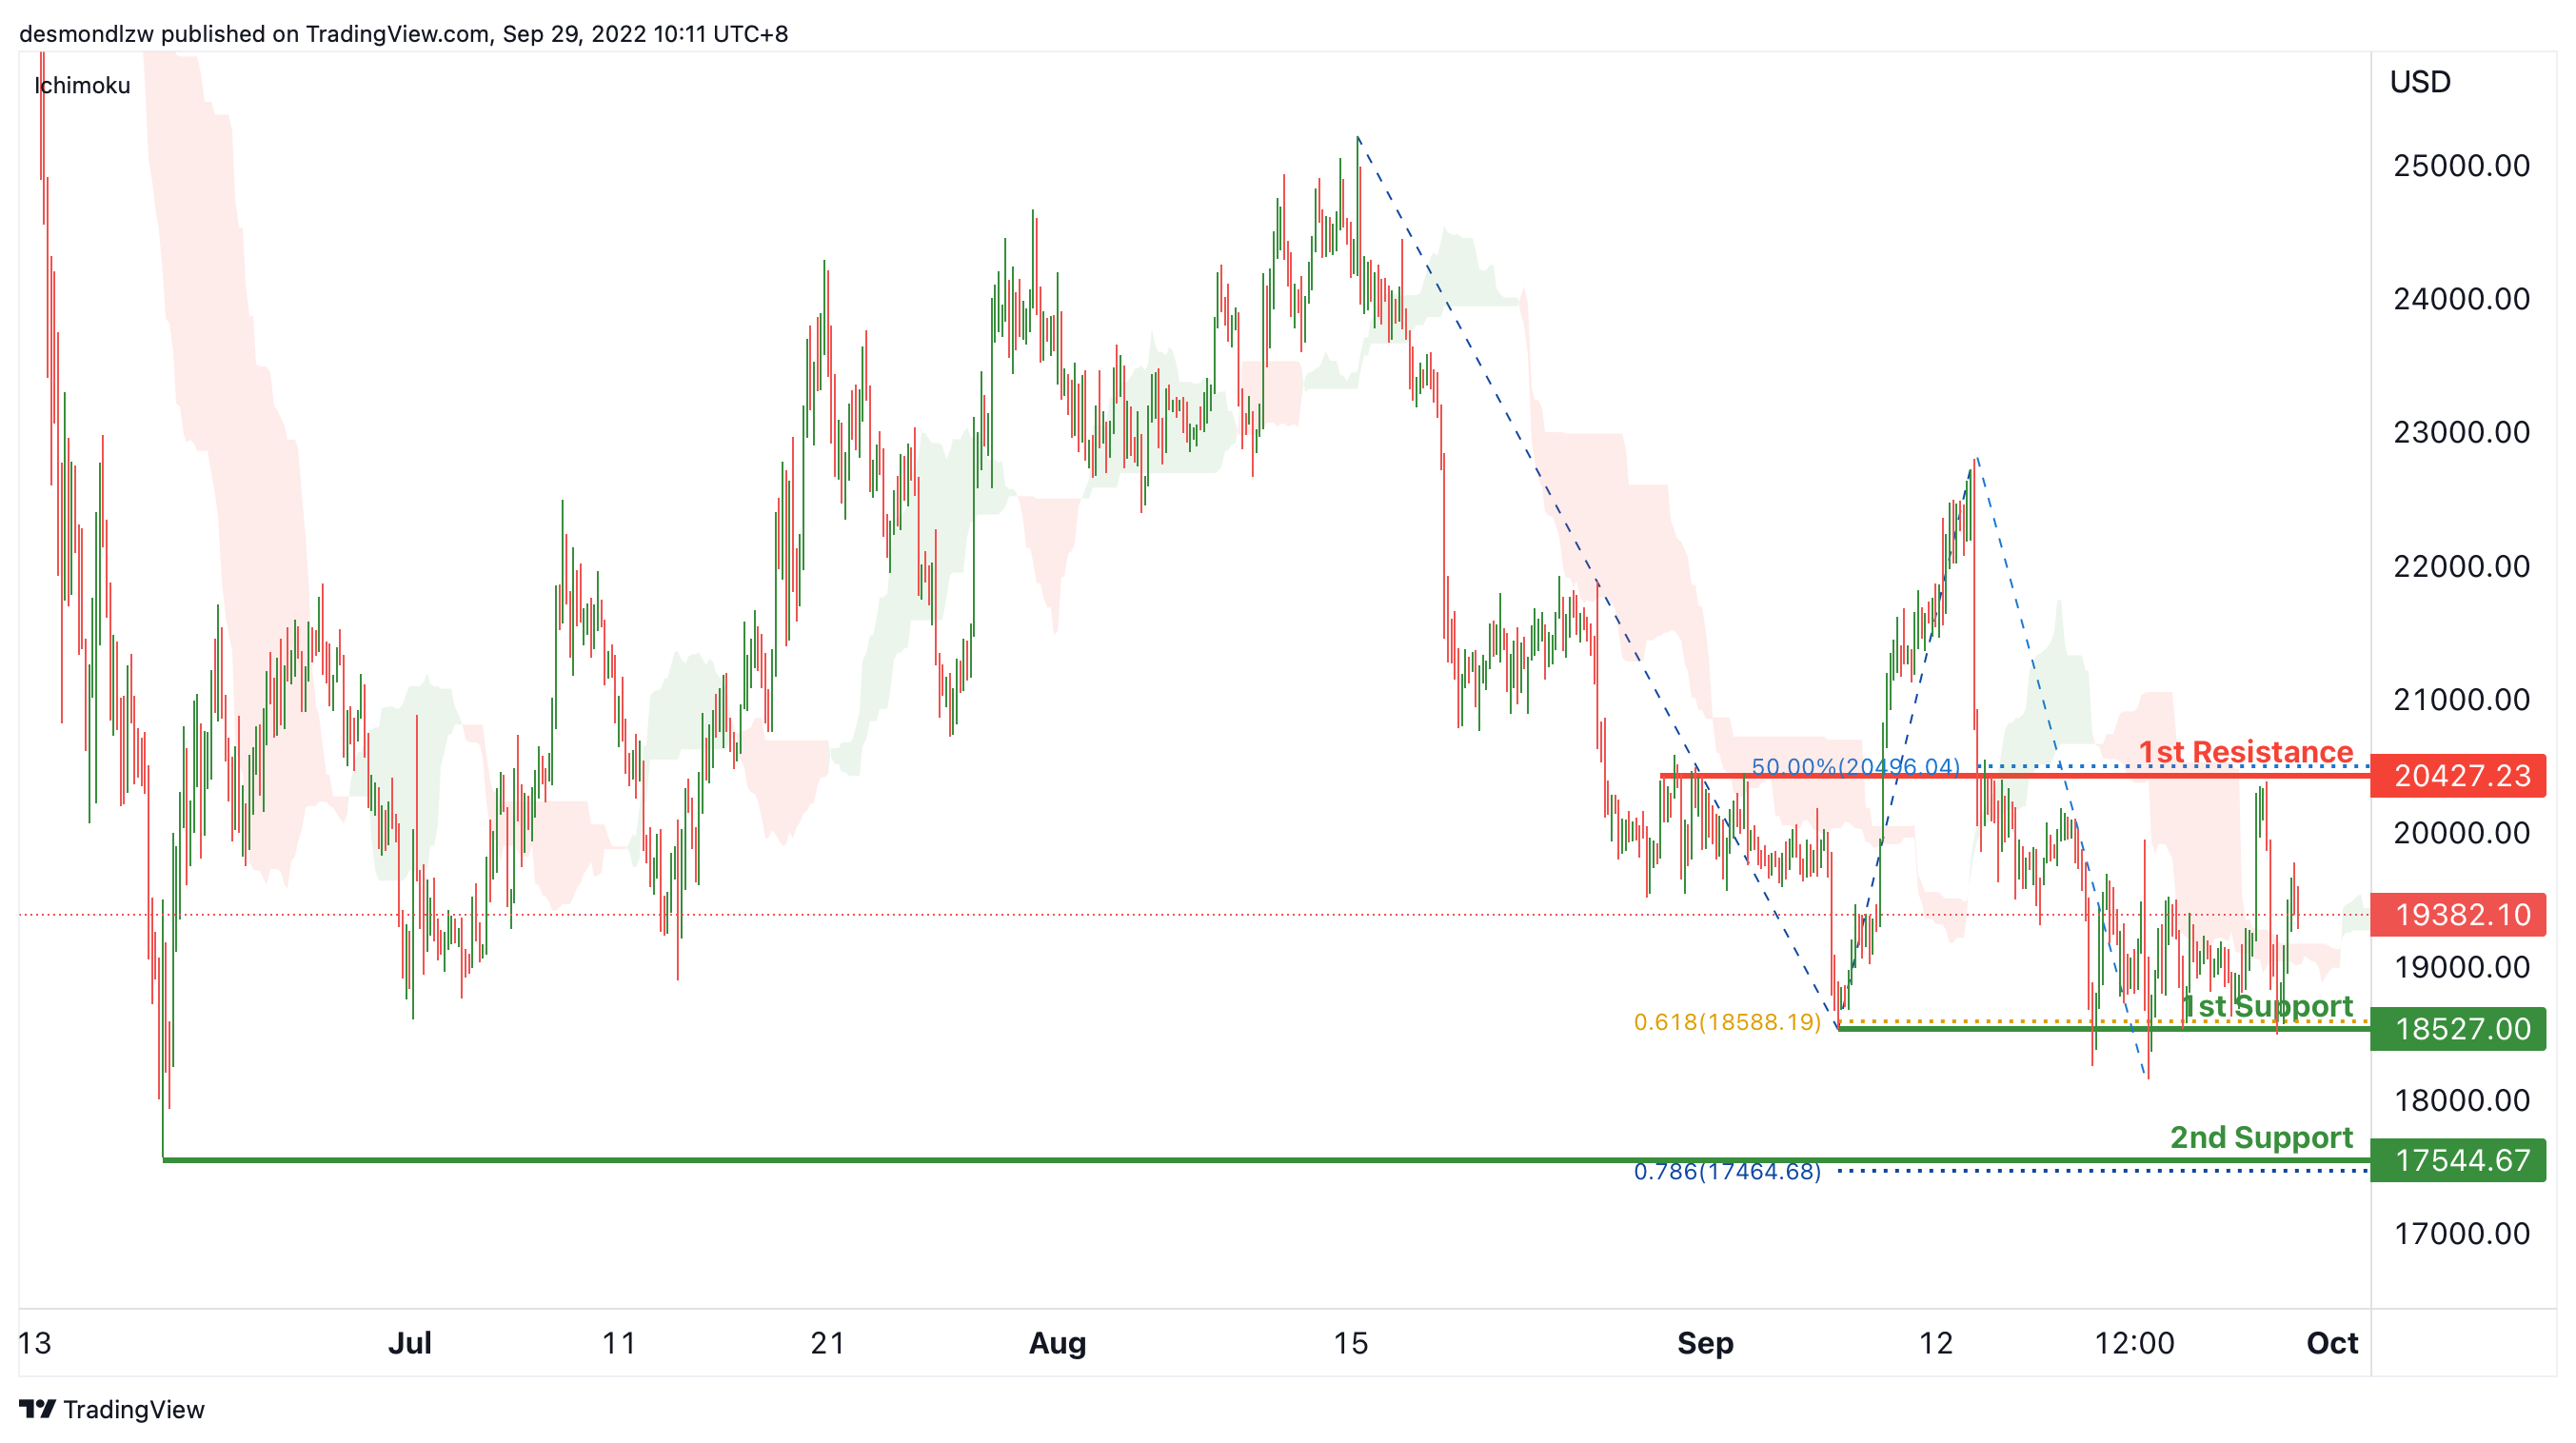
On the H4, price reversing from the 1st support and crossing the ichimoku cloud, we have a bullish bias that the price may test the 1st resistance at 20427.23, where the overlap resistance and 50% fibonacci retracement are. After testing the 1st resistance, the price may drop to the 1st support at 18527, which is in line with the swing lows and 61.8% fibonacci projection. If the 1st support is broken, the 2nd support could be at 17544.67, which is in line with the 78.6% fibonacci projection and swing low.
Areas of consideration:
- H4 time frame, 1st resistance at 20427.23
- H4 time frame, 1st support at 18527
S&P 500:
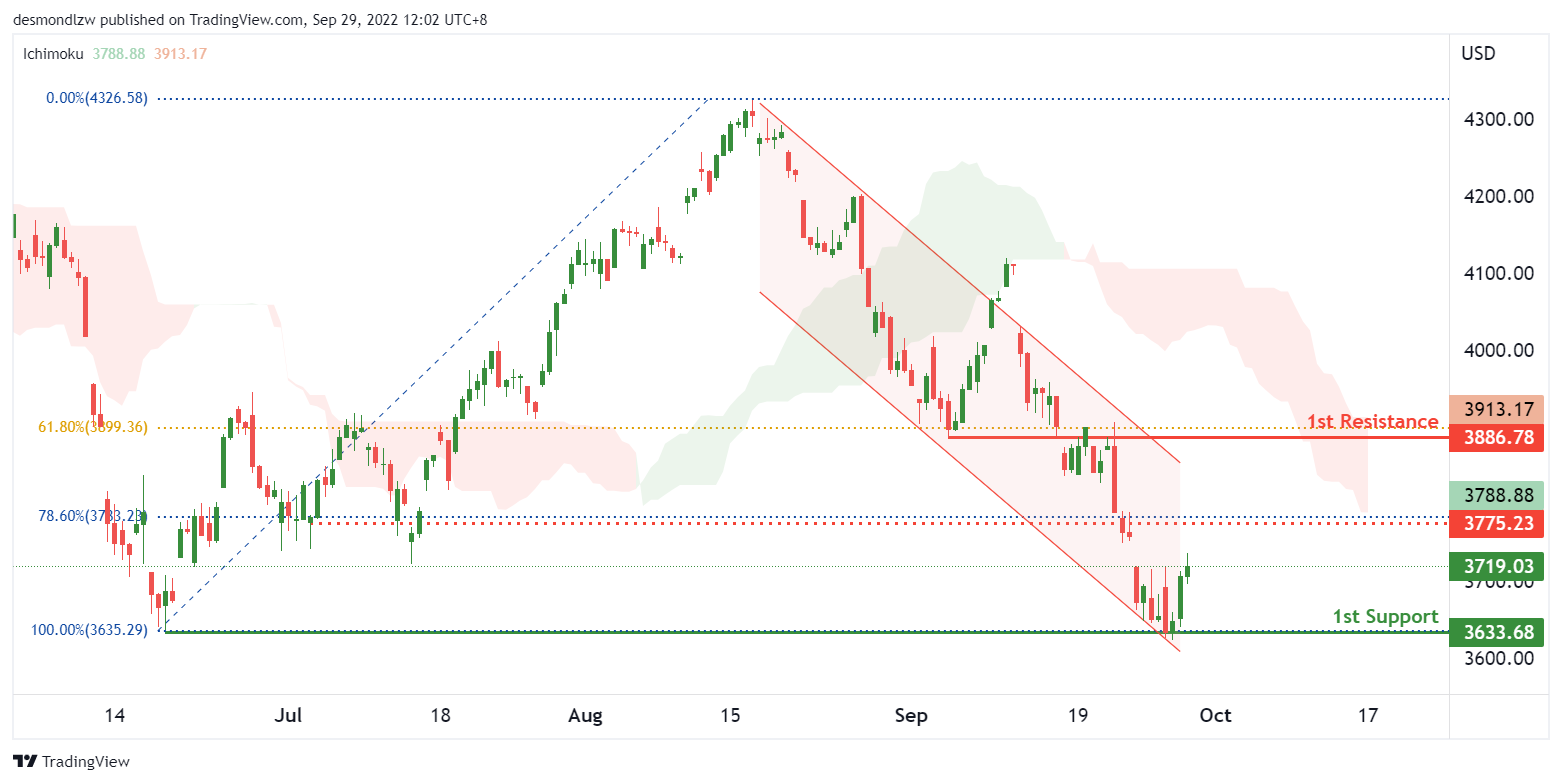
On the H4, with the price within a descending channel and below the ichimoku cloud, we continue to have a bearish bias. However, with the price bouncing off the 1st support of 3633, which is in line with the previous swing low of June 2022, we could see price testing the 3775 intermediate level before testing the 1st support again.
Areas of consideration:
- H4 time frame, 1st resistance at 3886
- H4 time frame, 1st support at 3633
GBP/JPY Daily Outlook
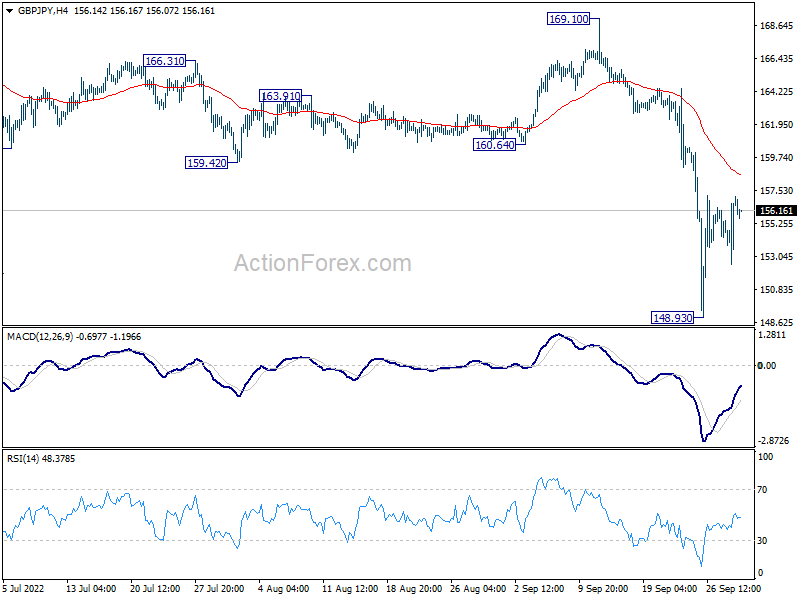
Daily Pivots: (S1) 153.98; (P) 155.53; (R1) 158.50; More...
GBP/JPY is staying in consolidation from 148.93 and intraday bias remains neutral. For now, risk will stay on the downside as long as 160.64 support turned resistance holds. Break of 148.93 will resume the decline from 169.10 towards 141.19 fibonacci level.
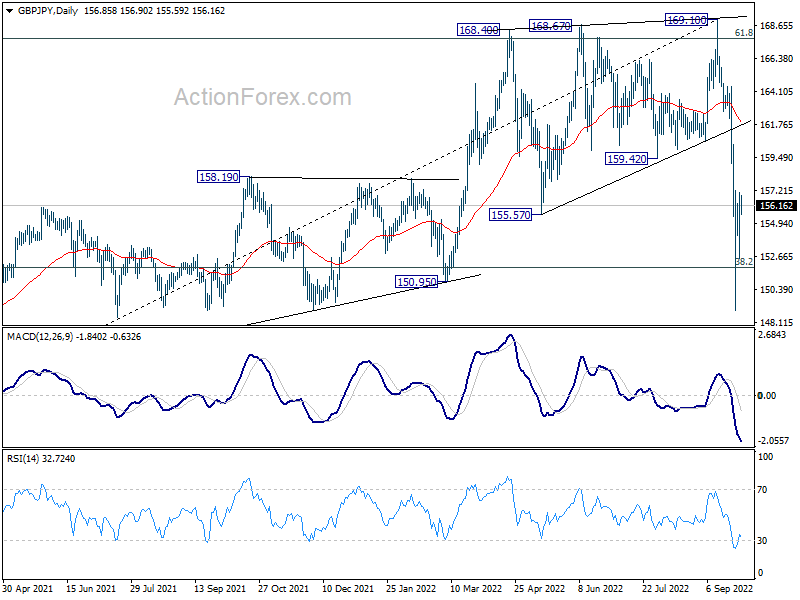
In the bigger picture, rise from 123.94 (2020 low) has completed at 169.10. 38.2% retracement of 123.94 to 169.10 at 151.84 is already met, and there could be some support from there for rebound. But risk will now stay on the downside as long as 169.10 resistance holds. Sustained trading below 151.84 will target 61.8% retracement at 141.19.
EUR/JPY Daily Outlook
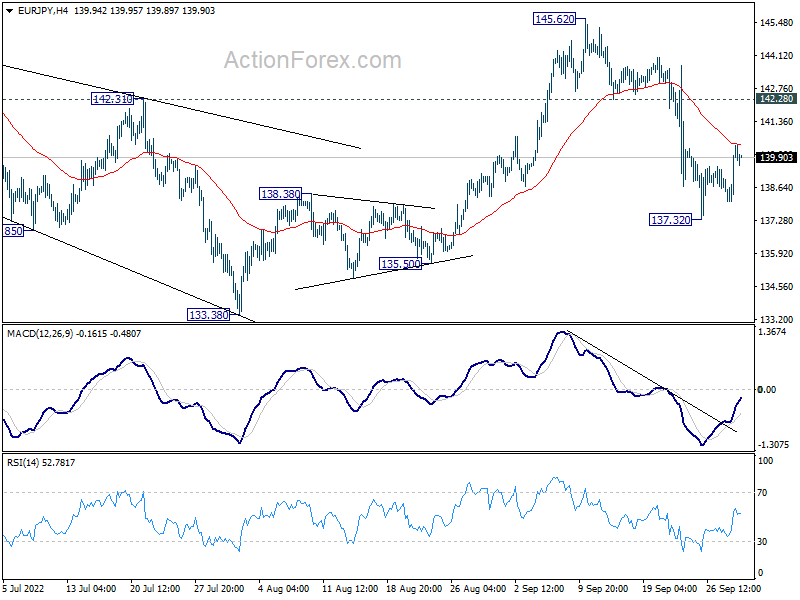
Daily Pivots: (S1) 138.78; (P) 139.59; (R1) 141.12; More....
EUR/JPY's consolidation from 1 37.32 is still in progress and intraday bias stays neutral. On the downside, break of 137.32 will resume the decline from 145.62 to 133.38 key support next. On the upside, though, break of 142.28 will turn bias back to the upside for retesting 145.62 high.
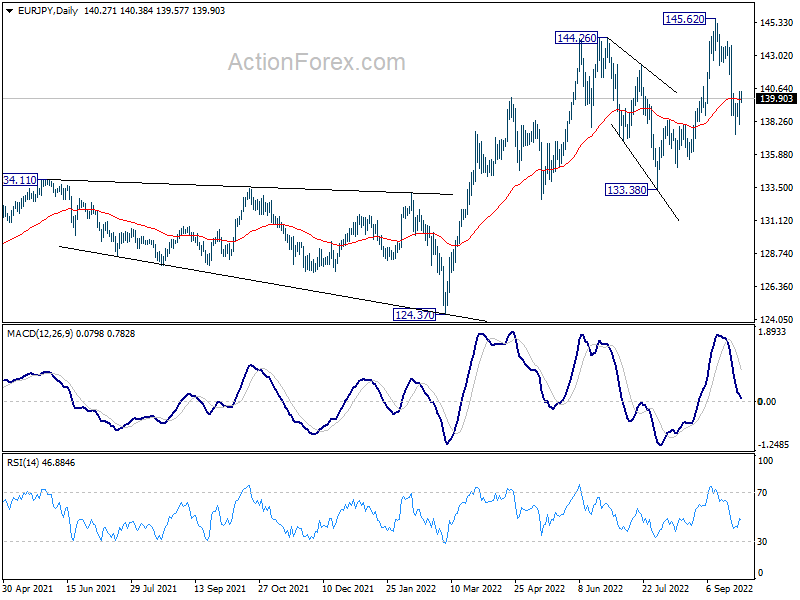
In the bigger picture, as long as 133.38 support holds, the up trend from 114.42 (2020 low) could still extend through 145.62 high. In that case, next target 149.76 (2015 high). However, sustained break of 133.38 will be a sign of medium term bearish reversal and bring deeper fall to 124.37 support first.
EUR/GBP Daily Outlook
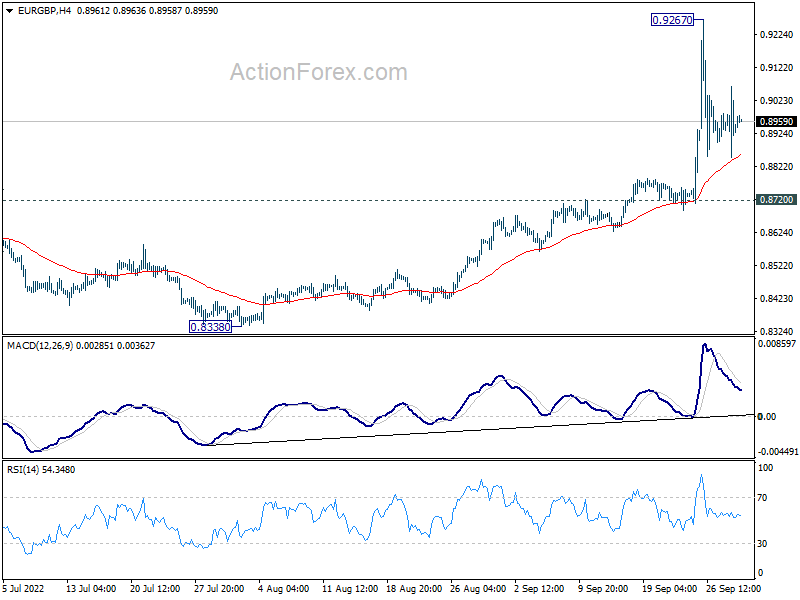
Daily Pivots: (S1) 0.8840; (P) 0.8953; (R1) 0.9053; More...
EUR/GBP's consolidation from 0.9267 is still extending and intraday bias stays neutral. Further rally is expected as long as 0.8720 resistance turned support holds. Above 0.9267 will target 0.9499 long term resistance. However, break of 0.8270 support will mix up the near term outlook.
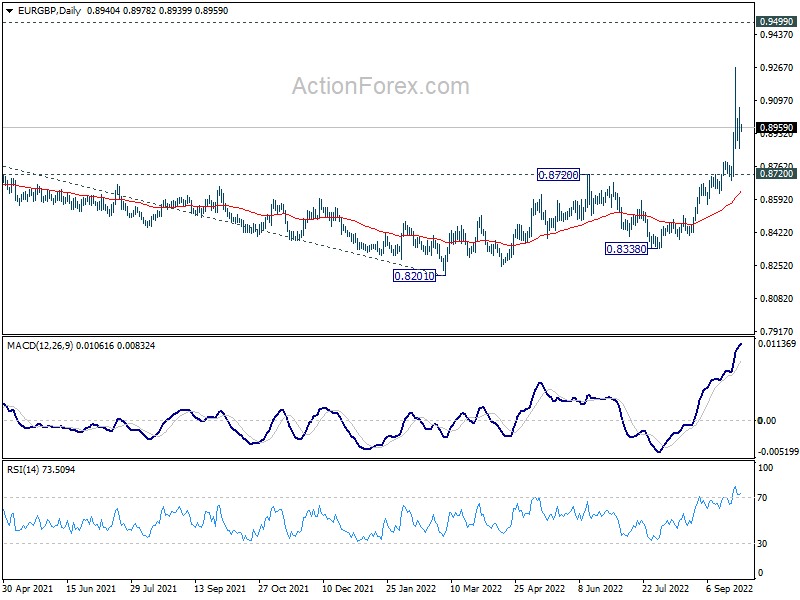
In the bigger picture, rise from 0.8201 is in progress targeting 0.9499 (2020 high) next. Based on current momentum, such rally should be resuming the up trend from 0.6935 (2015 low). Firm break of 0.9499 will target 61.8% projection of 0.6935 to 0.9499 from 0.8201 at 0.9786, which is close to 0.9799 (2008 high). This will now remain the favored case as long as 0.8720 resistance turned support holds.
EUR/AUD Daily Outlook
Daily Pivots: (S1) 1.4844; (P) 1.4924; (R1) 1.5005; More...
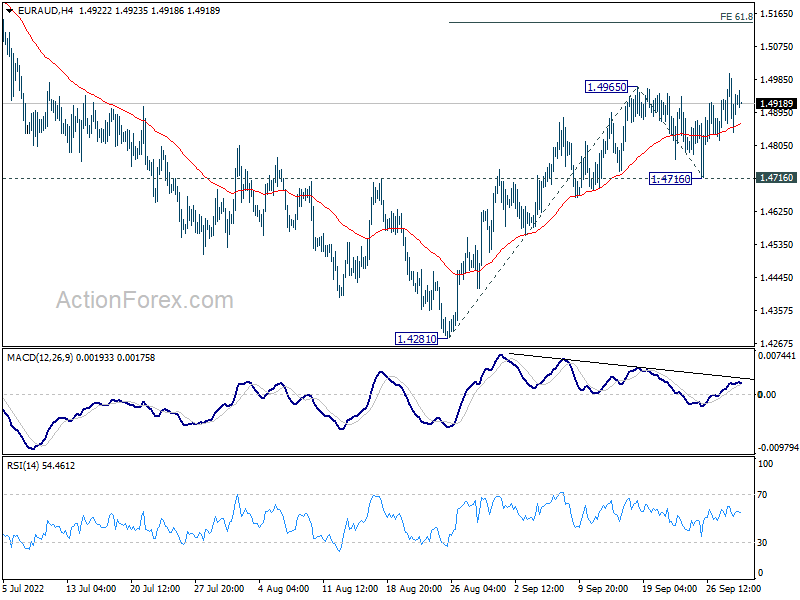
Intraday bias in EUR/AUD stays mildly on the upside for the moment. Current rebound form 1.4281 should target 61.8% projection of 1.4281 to 1.4965 from 1.4716 at 1.5139 and then 100% projection at 1.5400. On the downside, break of 1.4716 support is needed to indicate completion of the rebound. Otherwise, further rise will remain in favor in case of retreat.
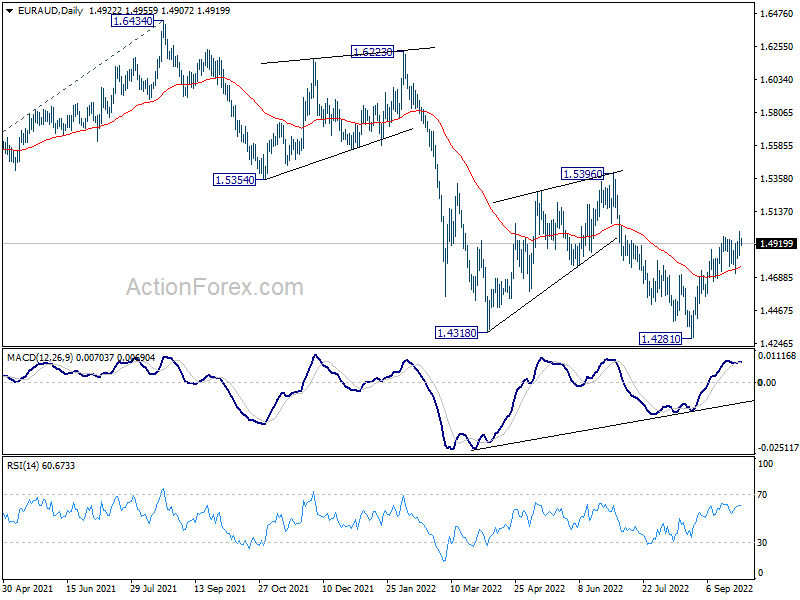
In the bigger picture, down trend from 1.9799 is still in progress. Break of 1.4318 low will target 61.8% projection of 1.9799 to 1.5250 from 1.6434 at 1.3623, which is close to 1.3624 long term support (2017 low). This will remain the favored case now as long as 1.5396 resistance holds.
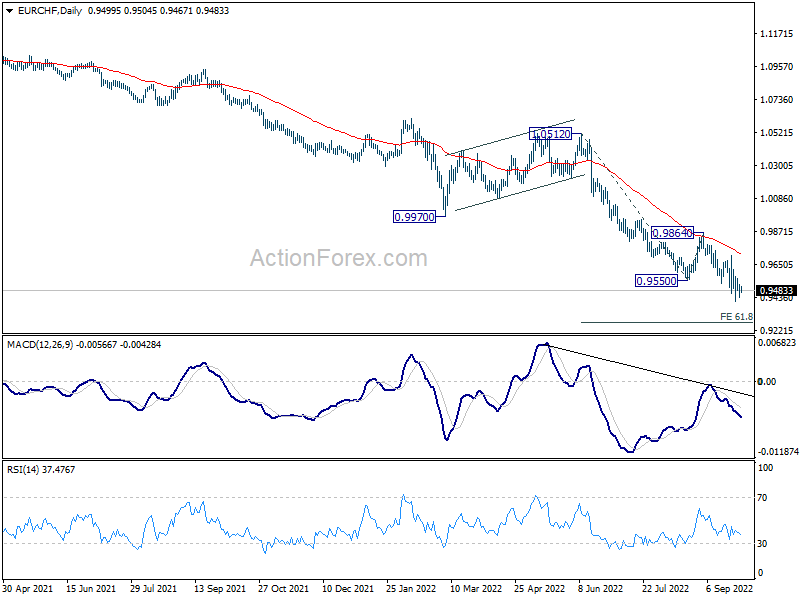
EUR/CHF Daily Outlook
Daily Pivots: (S1) 0.9450; (P) 0.9488; (R1) 0.9540; More....
EUR/CHF is staying in consolidation from 0.9470 and intraday bias remains neutral at this point. Outlook remains bearish with 0.9712 resistance intact. Break of 0.9407 will resume larger down trend. Next target is 61.8% projection of 1.0512 to 0.9550 from 0.9864 at 0.9269.
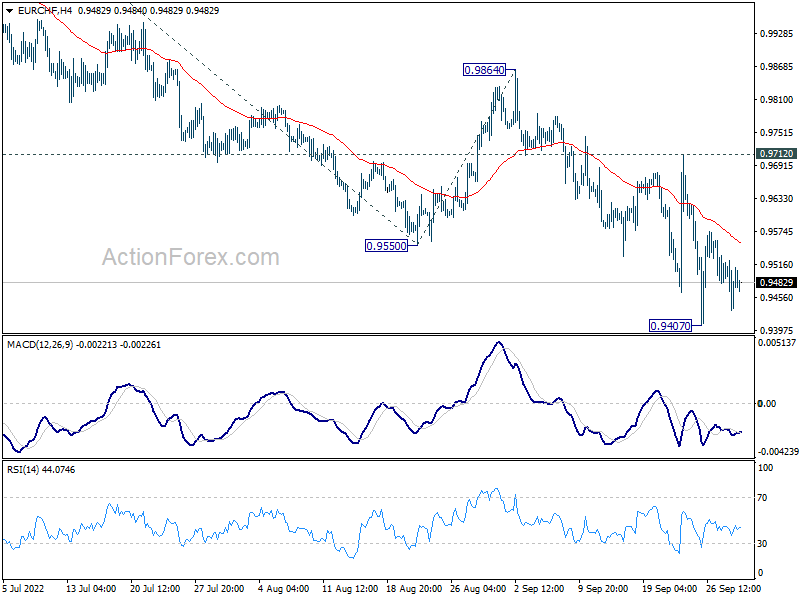
In the bigger picture, long term down trend from 1.2004 (2018 high) is still in progress. Next target is 138.2% projection of 1.2004 to 1.0505 to 1.1149 at 0.9033. On the upside, break of 0.9864 resistance is needed to be the first sign of medium term bottoming. Otherwise, outlook will stay bearish in case of strong rebound.