

Sample Category Title
Fed Bostic wants rate at 4.25% to 4.5% by year end
Atlanta President Fed Raphael Bostic said yesterday, "the lack of progress thus far has me thinking much more now that we have to get to a moderately restrictive stance. And for me, that is in the 4.25% to 4.5% range for our policy. My preference is that we get there by year end."
Bostic said that his expects another 75bps rate hike in November, followed by 50bps in December. But he added that "I don't think it'll be appropriate for us to continue to tighten and increase your rates until inflation gets to 2%. That will be guaranteeing that we've gone too far and we'll take the economy into a negative space."
"I'm still in the place of not really thinking that a recession is a foregone conclusion as we battle this," he said. "So we can have some weakening, but I don't think it, at this point, will take us to the historical recessionary experience."
Gold Price Turns Red Below $1,650, Upsides Capped
Key Highlights
- Gold price extended losses below the $1,650 support.
- A major bearish trend line is forming with resistance near $1,650 on the 4-hours chart.
- EUR/USD and GBP/USD might start a fresh downward move.
- USD/JPY could clear the last high at 145.90 and continue higher.
Gold Price Technical Analysis
Gold price remained in a bearish zone below the $1,688 resistance against the US Dollar. The price declined below the $1,665 support level to move into a bearish zone.
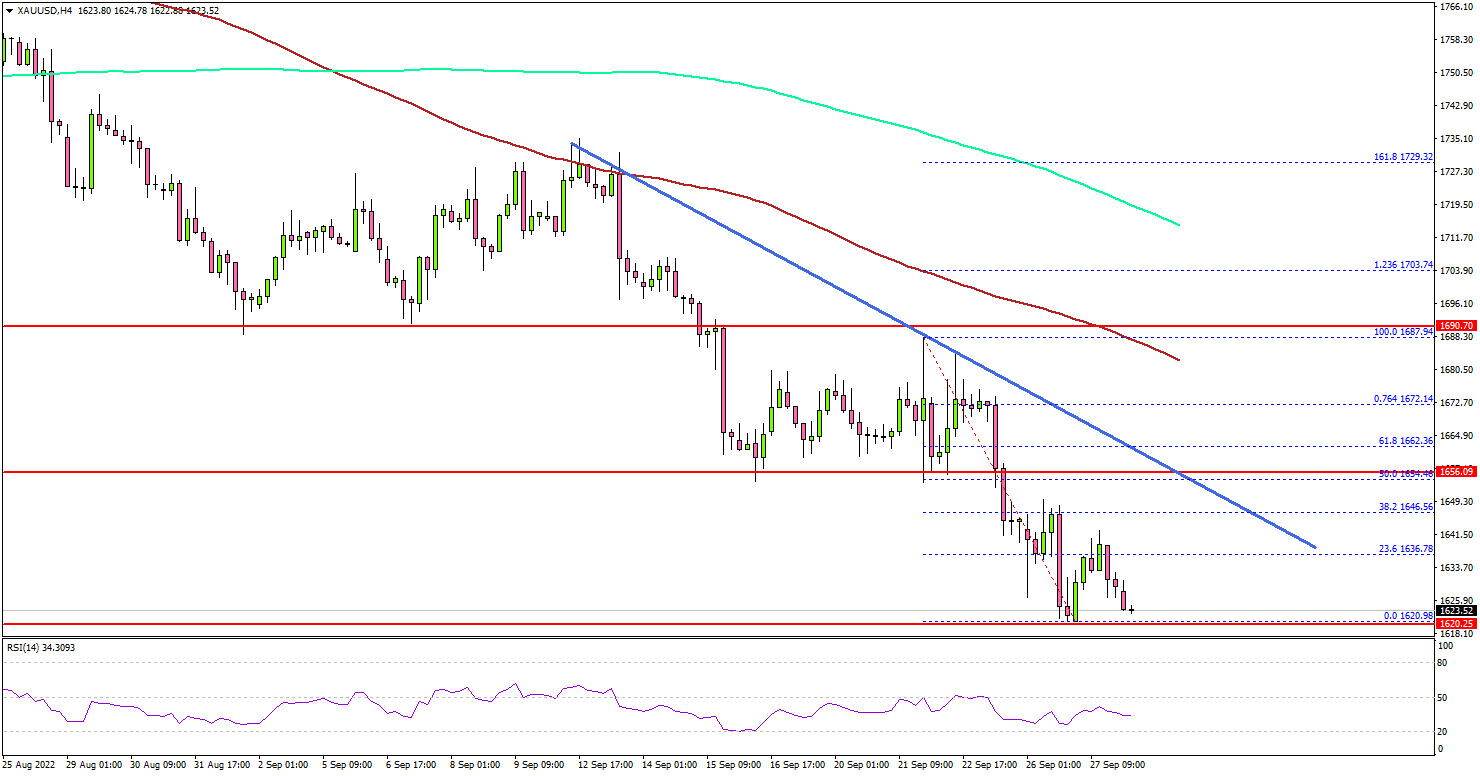
The 4-hours chart of XAU/USD indicates that the price extended losses below the $1,650 support, the 100 simple moving average (red, 4-hours), and the 200 simple moving average (green, 4-hours).
The price even spiked below the $1,625 level and traded as low as $1,620. It is now consolidating losses above the $1,620 level. On the upside, the price might face sellers near the $1,646 level. There is also a major bearish trend line forming with resistance near $1,650 on the same chart.
The next major resistance is near the $1,662 level. Any more gains might send the price towards the $1,688 resistance level.
On the downside, an initial support is near the $1,620 level. The next major support is near the $1,600 level, below which the price could accelerate lower. In the stated case, the price may perhaps decline towards the $1,580 level.
Looking at EUR/USD, the pair is facing resistance near the 0.9680 and 0.9700 levels. If the bears remain in action, the pair could decline below 0.9550.
Economic Releases to Watch Today
- US Pending Home Sales for August 2022 (YoY) - Forecast -1.4%, versus -1.0% previous.
- Federal Reserve Chair Jerome Powell Speech.
Elliott Wave View: Impulsive Rally in USDCAD Looks Incomplete
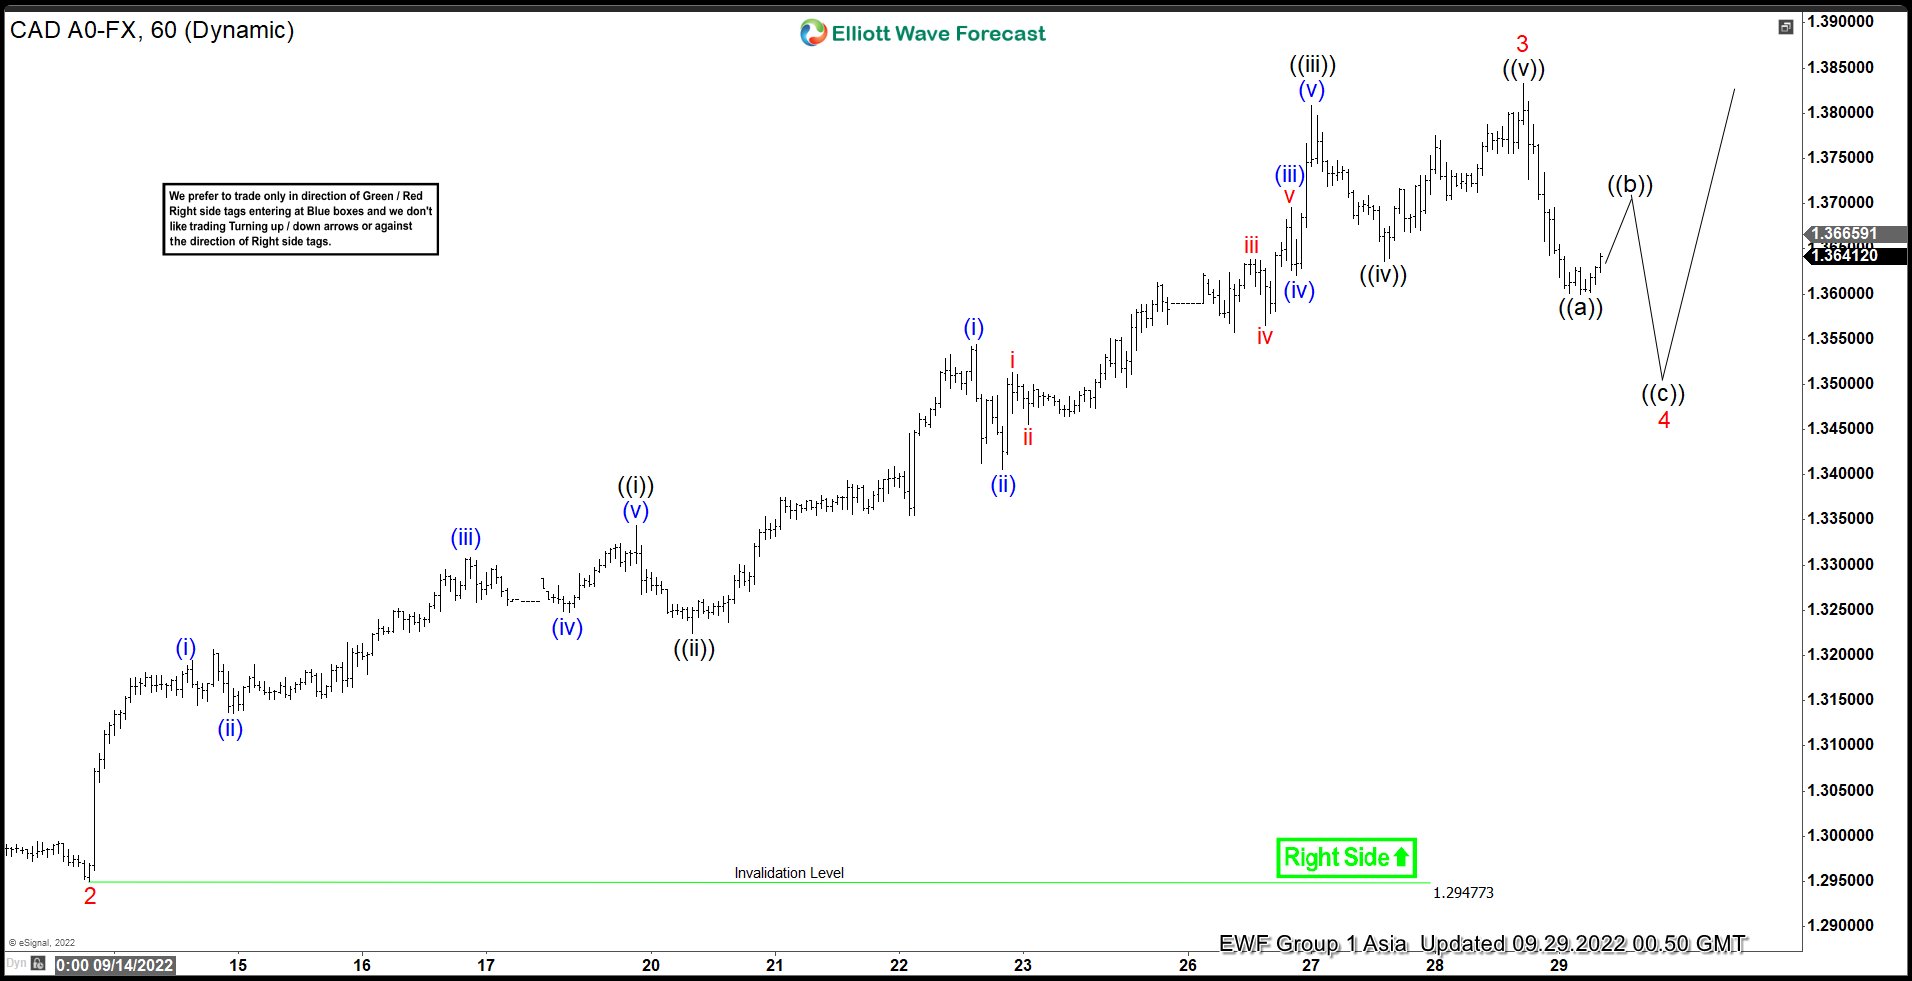
Short term Elliott Wave view on USDCAD suggests cycle from 8.11.2022 low is in progress as a 5 waves impulse structure. Up from 8.11.2022 low, wave 1 ended at 1.3208 and pullback in wave 2 ended at 1.2954. Pair has resumed higher in wave 3 with internal subdivision in another 5 waves of lesser degree. Up from wave 2, wave ((i)) ended at 1.3344 and pullback in wave ((ii)) ended at 1.3224. Pair then resumes higher in wave ((iii)) towards 1.3808 and dip in wave ((iv)) ended at 1.3636. Final leg higher wave ((v)) ended at 1.3833 which completed wave 3.
When measured from 8.11.2022 low relative to 9.13.2022 low, the rally to 1.3833 is around the 161.8% Fibonacci extension. This is the typical extension for wave 3. Pullback in wave 4 is now in progress to correct cycle from 9.13.2022 low. Pullback should take the form of 3 waves zigzag where wave ((a)) ended at 1.3601. Expect rally in wave ((b)) to fail for another leg lower in wave ((c)) to end wave 4. Potential area to end wave 4 is at 38.2 – 50% retracement of wave 3 at 1.339 – 1.3495. Near term, as far as pivot at 1.2947 low stays intact, expect pullback to find support in 3, 7, or 11 swing for further upside.
USDCAD 60 Minutes Elliott Wave Chart
CHFJPY Wave Analysis
- CHFJPY rising inside impulse wave (3)
- Likely to test resistance level 148.00
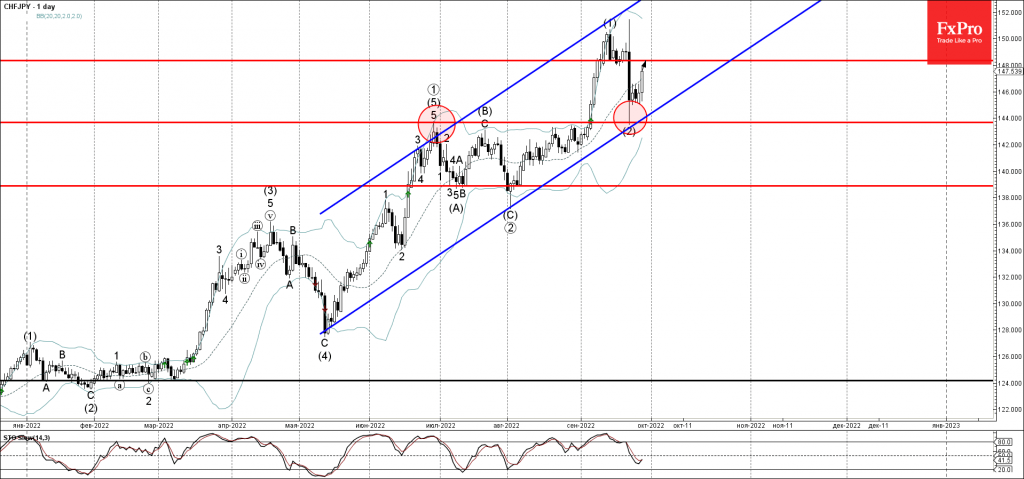
CHFJPY rising inside the intermediate impulse wave (3), which started earlier from the key support level 144.00 (former monthly high from June), intersecting with the daily up channel from May.
The active impulse wave (3) belongs to the higher order primary upward impulse sequence ③ from the start of August.
Given the prevailing uptrend and the strong Swiss franc bullish sentiment seen today, CHFJPY currency pair can be expected to rise further toward the next resistance level 148.00 (former minor support from the start of September).
USDCHF Wave Analysis
- USDCHF under bearish pressure
- Likely to fall to support level 0.9700
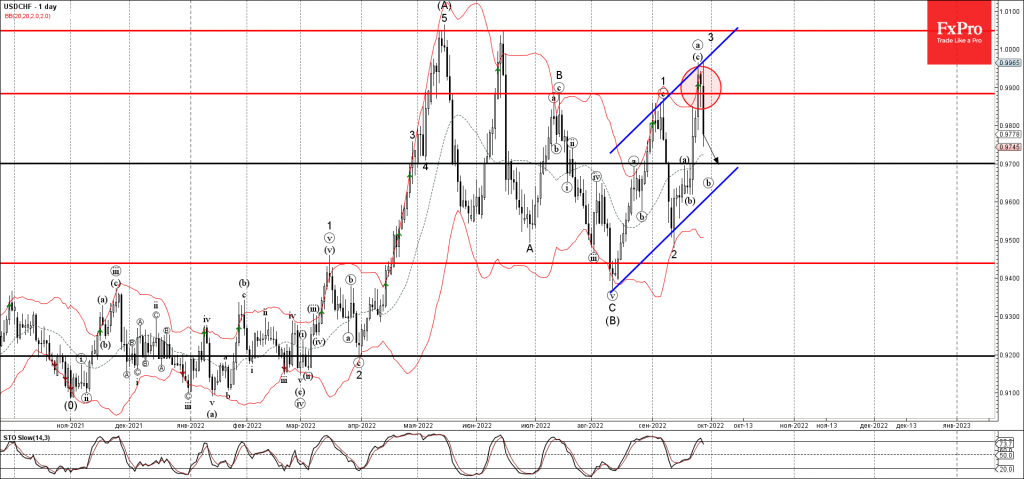
USDCHF currency pair under the bearish pressure after the pair reversed down from the pivotal resistance level 0.9885 (which has been reversing the pair from the middle of July), upper daily Bollinger Band and the resistance trendline of the daily up channel from August.
The downward reversal from the resistance level 0.9885 started the active short-term correction (b).
USDCHF currency pair can be expected to fall further toward the next round support level 0.9700 (former top of the minor wave (a) from the middle of September).
Eco Data 9/29/22
[php_everywhere instance="1"]
GBPAUD Comes Under Renewed Selling Interest
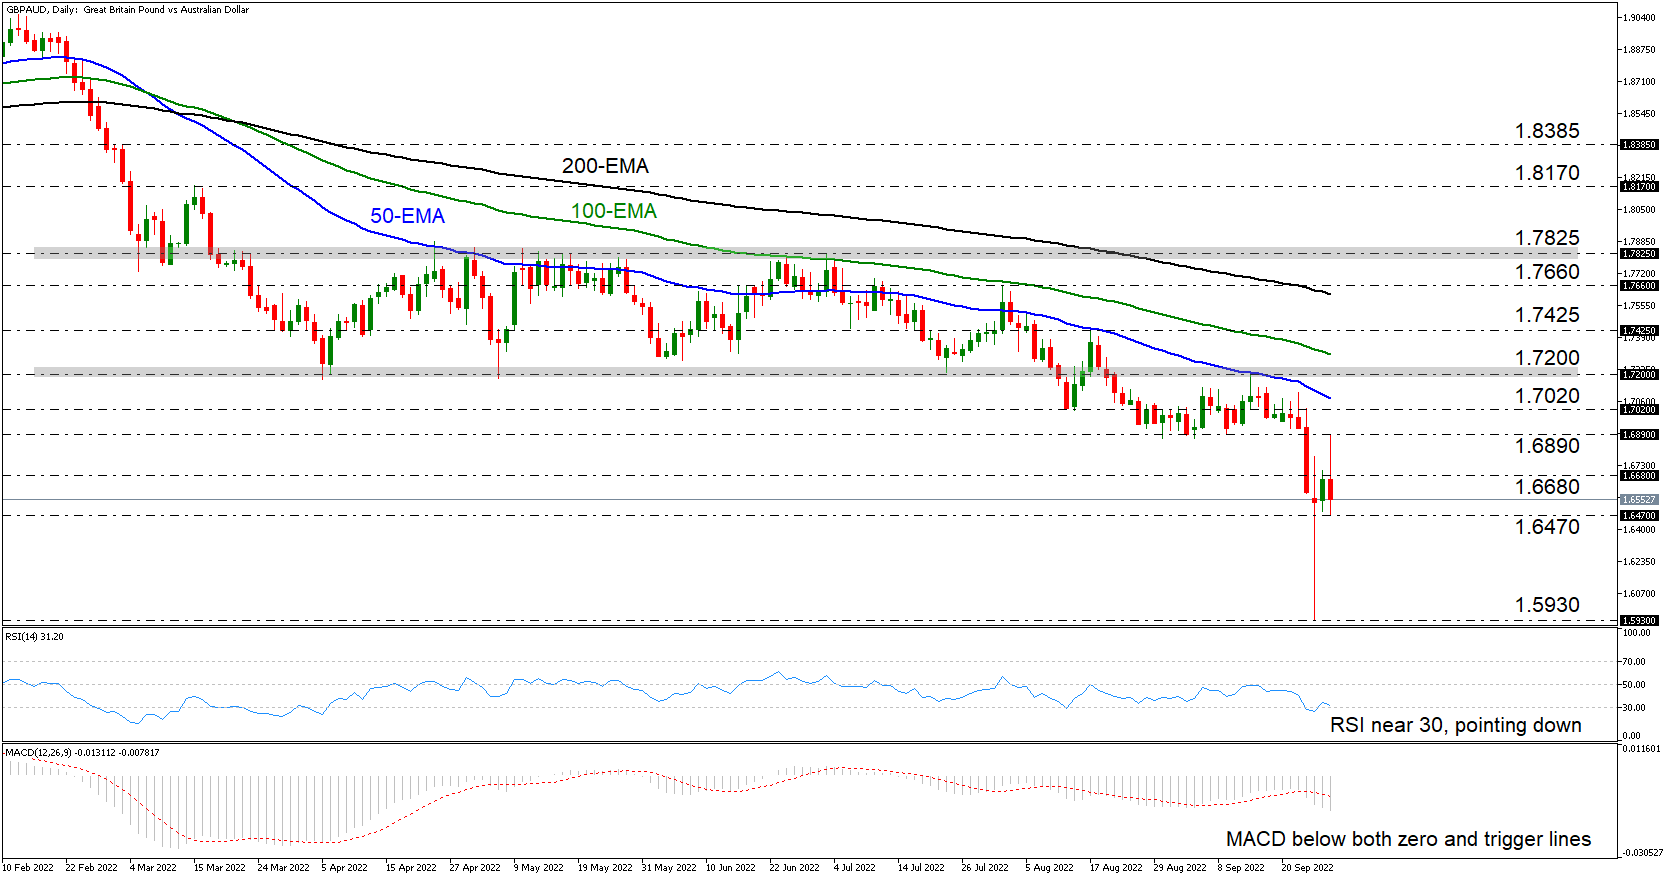
GBPAUD came under selling interest again on Wednesday, after it hit resistance at the 1.6890 barrier, which provided support between August 30 and September 9. In the bigger picture, even after Monday and Tuesday’s recovery, the pair remained below the lower end of the prior sideways range that contained the price action between March 18 and August 11, which suggests a bearish near-term outlook.
The RSI and the MACD add credence to that view. The former is slightly above 30, pointing down, while the latter is lying below both its zero and trigger lines, pointing south as well.
A break below today’s low of 1.6470 could carry larger bearish implications and perhaps set the stage for declines all the way down to Monday’s low of 1.5930. If the bears don’t stop there, their next challenge may be the 1.5790 zone, defined as a support by the low of October 26, 2016.
On the upside, a break above 1.7200 could signal the pair’s return within the aforementioned range, while the move that could change the outlook to positive may be a break above the upper bound of the aforementioned range at around 1.7825. Something like that could encourage the bulls to extend their advance towards the peak of March 15 at 18170, or the high of March 3 at 1.8385.
In brief, GBPAUD remains below the lower bound of a prior sideways range and today it came under renewed selling interest. This suggests that the bears could maintain control for a while more.
Global Consumer Spending and How Much Inflation is Left
As prices around the globe increase, consumers can buy less with the same amount of money. Some consumers have the capacity to increase spending. Either by borrowing money, getting a new job, or getting a raise. But, with average wages in most developed countries trending negative in real terms, generally consumers have less buying power.
Basic economics dictates that as purchasing power decreases, so does demand. This phenomenon is called "demand destruction" when caused by inflation. Excluding monetary and fiscal policy, this provides a natural "break" on inflation. That could be a factor to help central banks in controlling inflation. Meaning that consumer spending could give us some advance warning when central banks could start easing off on the rate hikes.
What to look out for
Friday has an avalanche of data, as it's the last day of the month and of the quarter. Here are the main data points relating to consumer behavior which could impact markets:
Japan: Is the odd one out of the global situation, because inflation hasn't gone significantly above target, despite the deprecation in the currency. Consumer confidence appears to be staging a little bit of a rebound since the summer, and is forecast to increase to 34.0 from 32.5 in August. That would be the second consecutive month of gains
Germany: As prices rise, Germans are being forced to do something they are really loath to do: Dip into their savings. Real wages in Germany have remained negative, and Germans appear to be responding by closing their wallets. Monthly August German retail sales are forecast to switch to negative at -1% compared to +1.9% in July. Annual Retail sales are expected to come in at -5.1% compared to -2.6% prior.
Switzerland: Another country that has managed to avoid some of the upward price pressure, and retail sales have remained relatively stable through the year. Monthly fluctuations are natural, but a trend similar to the GDP growth rate is seen as generally not putting pressure on monetary policy. Monthly Retail sales are expected to increase to 0.6% compared to -0.5%. But annual retail sales are expected at 2.0% compared to 2.6% prior.
US: There are two important data points coming out for the US. First is Personal Spending, which is expected to expand. However, it should be noted that this figure is not adjusted for inflation, so increased spending is likely a reflection of Americans keeping pace with rising prices, and not necessarily a sign of increased demand. US August Personal Spending is expected to come in at 0.2% compared to 0.1% prior.
The University of Michigan Consumer Sentiment survey is seen as the most reliable measure of how willing Americans are to keep buying. As inflation has started to turn around mostly on the back of lower gasoline prices, it appears US consumers are willing to keep spending. But, that goes hand-in-hand with increased use of credit cards, as credit card debt is near a decade high level.
Michigan Consumer Sentiment is expected to expand to 59.5 from 58.2 prior.
Bitcoin Reacting Lower From Elliott Wave Blue Box Area
In this technical blog, we will look at the past performance of 1-hour Elliott Wave Charts of Bitcoin. In which, the decline from 15 August 2022 high is unfolding as a nest and showed a lower low sequence. Therefore, we knew that the structure in Bitcoin is incomplete to the downside & should see more weakness. So, we advised members to sell the bounces in 3, 7, or 11 swings at the blue box areas. We will explain the structure & forecast below:
Bitcoin 1 Hour Elliott Wave Chart
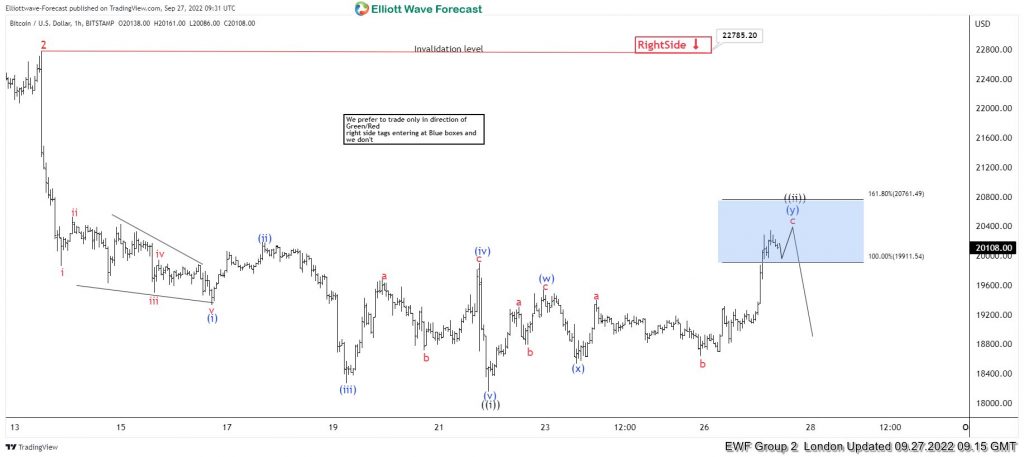
Here’s 1hr Elliott wave Chart from the 9/27/2022 London update. In which, the decline to $18157 low ended 5 waves from 9/13/2022 high in wave ((i)) & made a bounce in wave ((ii)). The internals of that bounce unfolded as an Elliott wave double correction where wave (w) ended at $19541 high. Then a decline to $18533 ended wave (x) pullback and started the (y) leg higher towards $19911- $20761 blue box area from where sellers were expected to appear looking for more downside or for a 3 wave reaction lower at least.
Bitcoin Latest 1 Hour Elliott Wave Chart
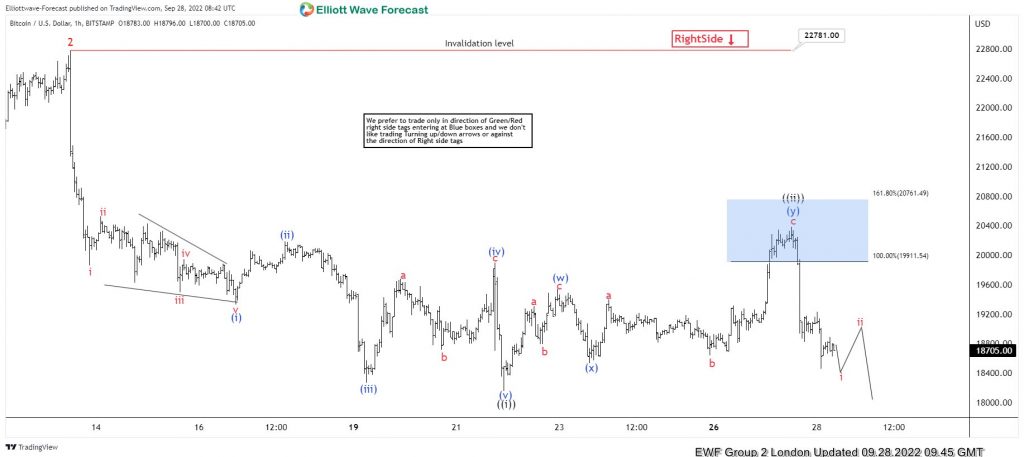
This is the Latest 1hr view from the 9/28/2022 London update. In which the Bitcoin is showing a reaction lower taking place from the blue box area allowing shorts to get into a risk-free position shortly after taking the position. However, a break below $18157 low still needs to be seen to confirm the next extension lower towards $15773- $14685 area lower & avoid double correction higher.
Sunset Market Commentary
Markets
The heavy UK Gilt sell-off triggered a response by the Bank of England. They consider the repricing, especially at the very long end of the curve, as a material risk to UK financial stability especially should dysfunction in the market continue or worsen. In order to restore market functioning and reduce any risks from contagion to credit conditions for UK households and businesses, the BoE will carry out temporary purchases of long-dated UK bonds on whatever scale is necessary. The UK central bank also decided to postpone by one month last week’s decision to actively conduct gilt sale operations (QT) with the aim of reducing the (QE) stock by £80bn annually (sales + redemptions). To put things in context: the BoE launches some kind of operation twist in the midst of its normalization cycle which should heavily invert the UK Gilt curve and highlights difficulties central banks run into following years of lavish policy easing. Putting the pedal to the metal while slamming the breaks. The UK 30-yr yield drops a full percentage point on a daily basis after rising from 3.5% to over 5% since last week’s mini budget by UK Chancellor Kwarteng which caused the troubles. The UK 2- and 10-yr yields drop 31 bps and 44 bps respectively. Sterling temporary lost out on the decision with EUR/GBP spiking from 0.8950 to 0.9050, before returning to 0.90.
ECB talk filled today’s agenda. ECB Lagarde struck again a hawkish tone: “Our primary goal is not to create a recession. Our primary objective is price stability and we have to deliver on that. If we were not delivering, it would hurt the economy far more.” Therefore additional rate hikes are necessary at the next several meetings. ECB Rehn called a 50 bps hike in October the minimum while hawkish ECB Holzmann thinks its too early to accelerate to a 100 bps move. Markets discount the in-between repeat of the 75 bps September rate hike. By the end of the year, ECB rates will hit neutral levels, allowing for the a start of QT (balance sheet roll-off) which should be part of the normalization process as well. EU interest rate markets trade extremely volatile today with hourly swings of 10 bps more rule than exception. If any, we reckon an intraday outperformance of the front end of the curve. We also retain the German Finanzagentur announcement to increase Q4 bond issuance by €10.5bn to €47.5bn. Real rates remain the driver at the (very) long end of the curve. The German 10-yr real yield closes in on positive marks for the first time since 2014. The US 10-yr real rate exceeds 1.5% for the first time since 2011. Both are testament to markets embracing that central banks won’t backdown if economies hit recessions and that restrictive policies will be with us for way longer than originally expected. Weaker stock markets (-0.5%) and a (slightly) stronger dollar remain part of the current market playbook.
News Headlines
The economic tendency index of the Swedish Konjuntur Institutet dropped 6.4 points in September to 90.8. All sectors contributed to the decline. Consumer confidence fell further to a new record low. All questions included in the indicator contributed to the decline, in particular how consumers view the outlook for their personal finances over the coming year. The confidence indicator for the manufacturing industry dropped 5.7 points to 110.0 and has now fallen for four months in a row. The confidence indicator for the retail shows a much weaker situation than normal and this is also the case for the services sector, even as employment plans remain optimistic. Poor domestic demand was illustrated by a further decline in August retail sales (-0.4% M/M and -5.1% Y/Y). Despite a sharp deceleration in activity, the Riksbank last week raised its policy rate by 1.0% to 1.75. The central bank also suggested that the peak policy rate next year could be 2.5%+ rather than 2.0% guided in June. The SEK 2-y swap over the previous days rose further to 3.5%, in line with the repricing in EMU. At EUR/SEK 10.90, the krone continues to trade near the weakest levels since the spring of 2020. On a separate topic, the Swedish national debt office said it proposes to gradually phase out foreign currency exposure of the central government debt. Analysis of the debt office concluded that currency exposure involved a higher risk without lowering the cost over time.