Sample Category Title
GBP/USD Slides as Turmoil Continues
Pound sharply lower despite BoE intervention
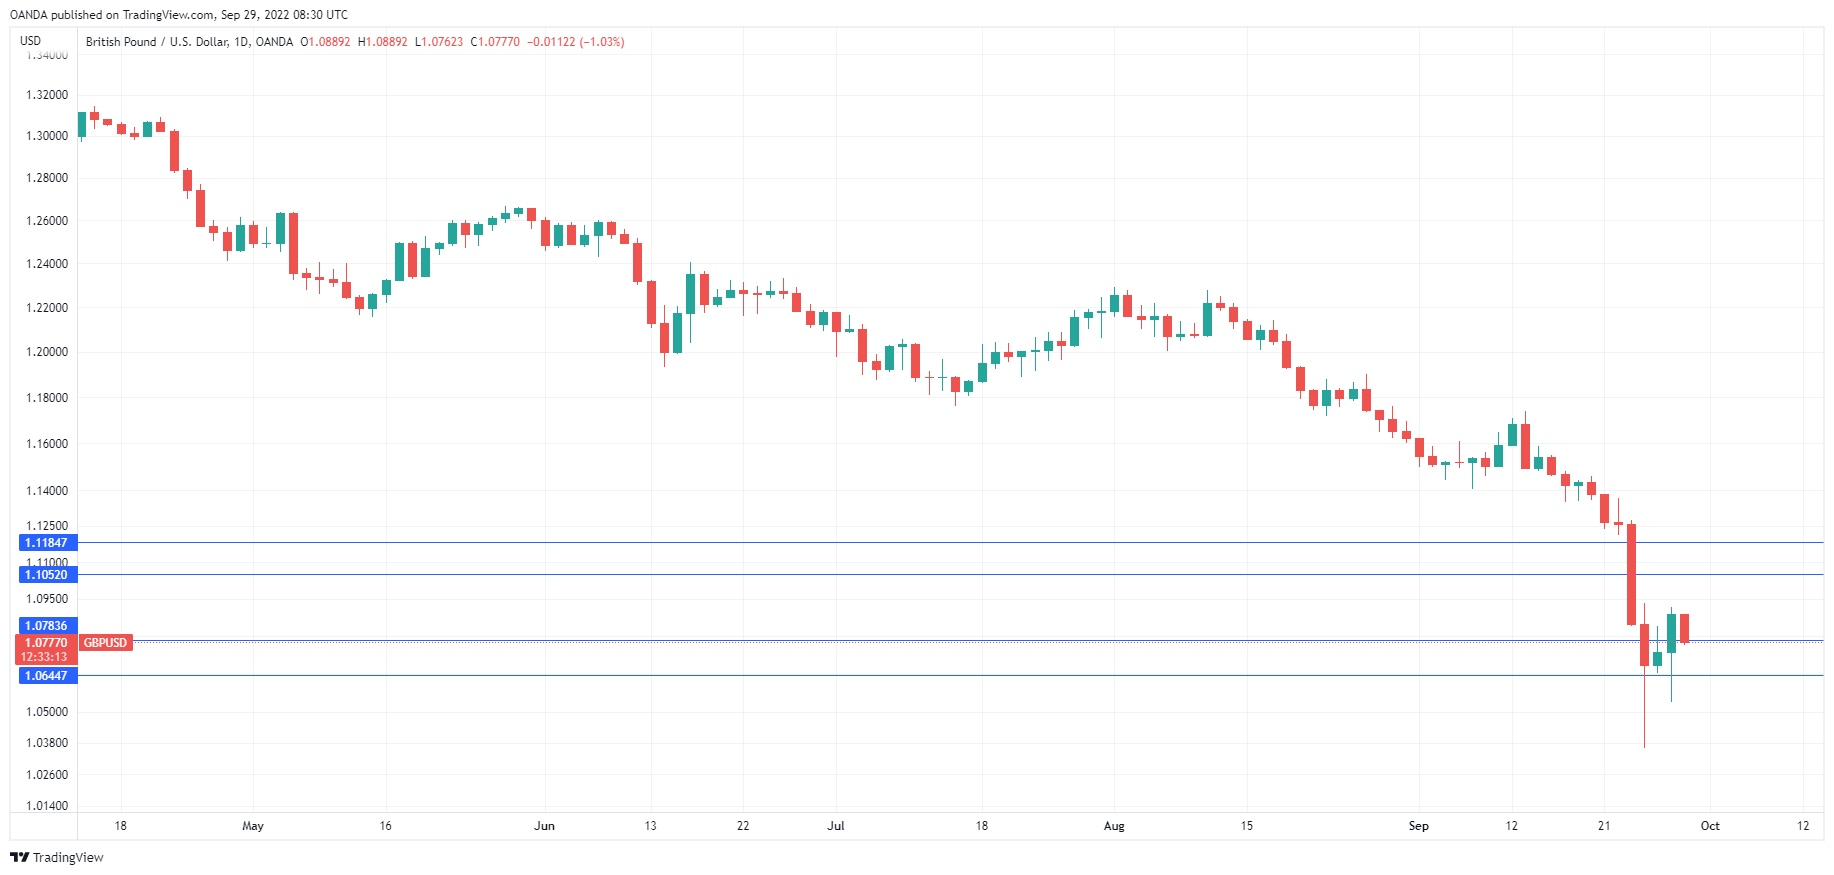
The roller-coaster continues for the British pound, which is down sharply today. In the European session, GBP/USD is trading at 1.0774, down 1.05%.
It has been a remarkable week for the British pound, which has exhibited sharp volatility since Friday, when Chancellor Kwarteng unveiled his mini-budget. The package included unfunded tax cuts, despite weak a weak economy and inflation hovering at 9.9%. The financial package was criticised at home as well as abroad; the International Monetary Fund and US Commerce Secretary Gina Raimondo also panned the plan. Former US Treasury Secretary Lawrence Summers had perhaps the most unkind cut of all, saying that the UK had the worst economic policy of any major country.
The British pound fell 3.6% on Friday and kept falling on Monday, hitting a record low of 1.0359. Bond prices tumbled and the turmoil became so acute that the Bank of England intervened on Wednesday in order to avoid a possible crash in the bond market. The BoE said that the crisis threatened financial stability and purchased just over one billion pounds in securities and will continue purchasing securities every day until October 14th. The bailout could hit over 60 billion pounds. The BoE’s announcement sent bond prices higher and stabilized the bond market. The pound shot up 1.45% on Wednesday, but has reversed directions and is down sharply today.
Prime Minister Truss is under heavy pressure to shelve the financial plan which has caused chaos in the markets, but for now, the government is standing firm and says it won’t back down. Truss and Kwarteng will have to face the music at the Conservative Party’s annual conference next week, and it’s likely we haven’t heard the last word on the mini-budget which has triggered a major financial crisis.
GBP/USD Technical
- GBP/USD is testing support at 1.0782. Next, there is support at 1.0644
- There is resistance at 1.1052 and 1.1184
EUR/USD Outlook: Bears Regain Control after Bulls Got Trapped at Pivotal Fibo Barrier
The Euro returned to red in early Thursday’s trading and has already retraced a half of Wednesday’s 1.5% recovery rally, after traders reacted on oversold conditions.
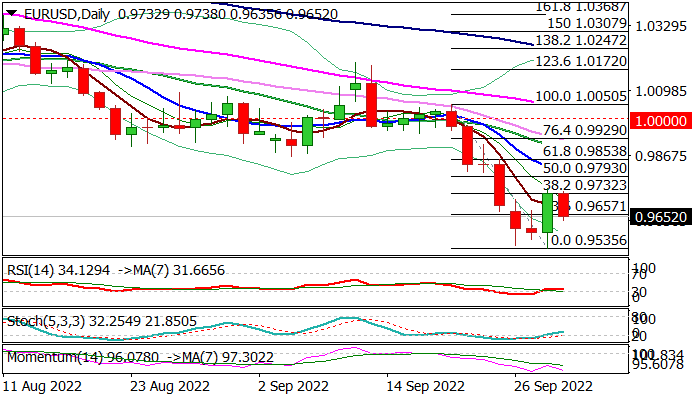
It seems that bounce was short-lived, as recovery repeatedly failed to clearly break above pivotal Fibo barrier at 0.9732 (Fibo 38.2% of 0.0050/0.9535 bear-leg), generating an initial signal of a bull trap.
Bearish daily studies support the action, allowing limited price adjustments on oversold conditions and complementing strongly Euro-negative fundamentals.
Today’s close below broken Fibo 23.6% at 0.9657 would confirm that bears regained control and open way for retesting new 20-year low at 0.9535, violation of which would risk drop towards psychological 0.90 support.
However, long-legged Doji candle is forming on weekly chart and suggesting that bears may take an extended breather before resuming larger downtrend.
Fibo level at 0.9732 marks solid resistance which should keep the upside protected and guard pivotal barrier at 0.9793 (50% retracement / falling 10DMA).
Res: 0.9732; 0.9750; 0.9793; 0.9812.
Sup: 0.9635; 0.9600; 0.9569; 0.9535.
ECB Simkus: My choice is 75bps for next hike
ECB Governing Council member Gediminas Simkus said he choice for the next rate hike is 75, adding that "a couple of options may be on the table but 50 is the minimum." He indicated that ECB should target "as soon as possible" on reducing its balance sheet.
At the same event another Governing Council member Madis Muller said "inflation calls for significant rate hikes," but it's "too early to say how much in basis points."
Also Governing Count member Mario Council said, "Right now frontloading other debates may in my opinion have a destabilizing effect that we really need to avoid. We have a path towards normalization of monetary policy and that's the focus right now."
Bitcoin’s 10-day flat
Market picture
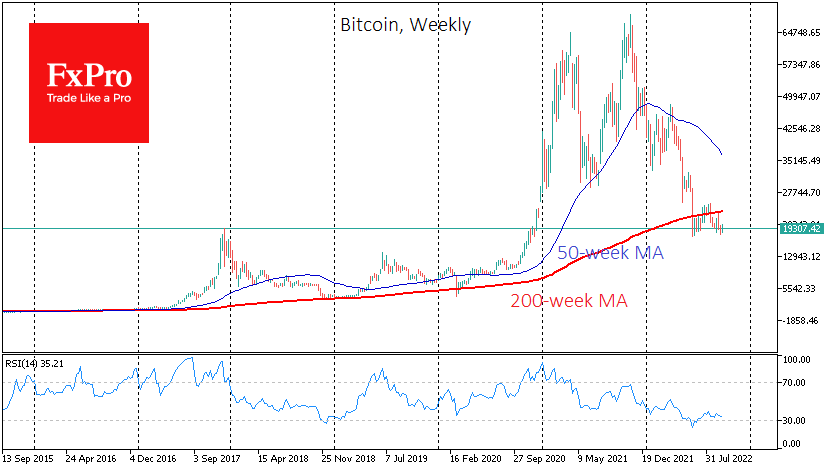
Bitcoin is up 3.1% over the past 24 hours, trading around $19,400. After a downward momentum early in the day, the first cryptocurrency received some support thanks to a recovery in risk appetite.
Ethereum is gaining 3.5% overnight to $1330, with the top cryptocurrencies ranging from +0.5% (Cardano) to +4.7% (BNB). Overall, total crypto capitalisation rose 2.2% to $937B overnight, according to CoinMarketCap.
CoinShares said UK investors are buying Bitcoin amid the Pound’s collapse this week, as we see with rising BTC/GBP trading volumes.
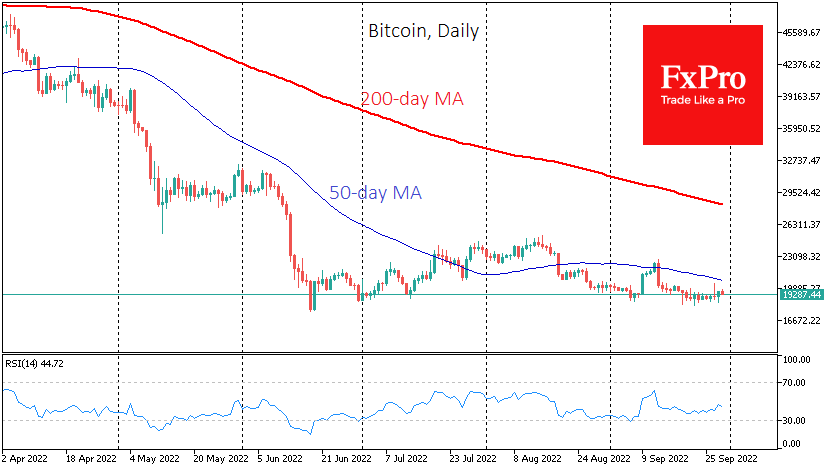
The momentum in the first and second half of the day has balanced each other out. As a result, Bitcoin has been moving sideways for the last ten days – without a clear trend and in a narrow range. This “dangling at the bottom” indicates Bitcoin accumulates in the area just below 20K. For now, the long-term pattern remains that the first cryptocurrency is attracting buyers on the decline from the previous cyclical peak.
News background
In an online discussion organised by the Bank of France, the heads of the world’s leading central banks called for increased regulation of the decentralised finance (DeFi) sector justified against the backdrop of its development.
Australia’s central bank has announced the launch of a Digital Central Bank Currency (CBDC) by mid-2023. Fed chairman Jerome Powell said the Fed has not yet decided on the digital dollar (CBDC) promotion.
Cardano founder Charles Hoskinson said he would never support a government-owned digital currency that violates the privacy of its owner.
The IMF said that the Proof-of-Stake (PoS) consensus algorithm could lead to excessive concentration of control at cryptocurrencies and custodial service providers with risks to the integrity of markets.
WTI Oil Futures Bounce Off 8-Month Low, Downtrend Intact
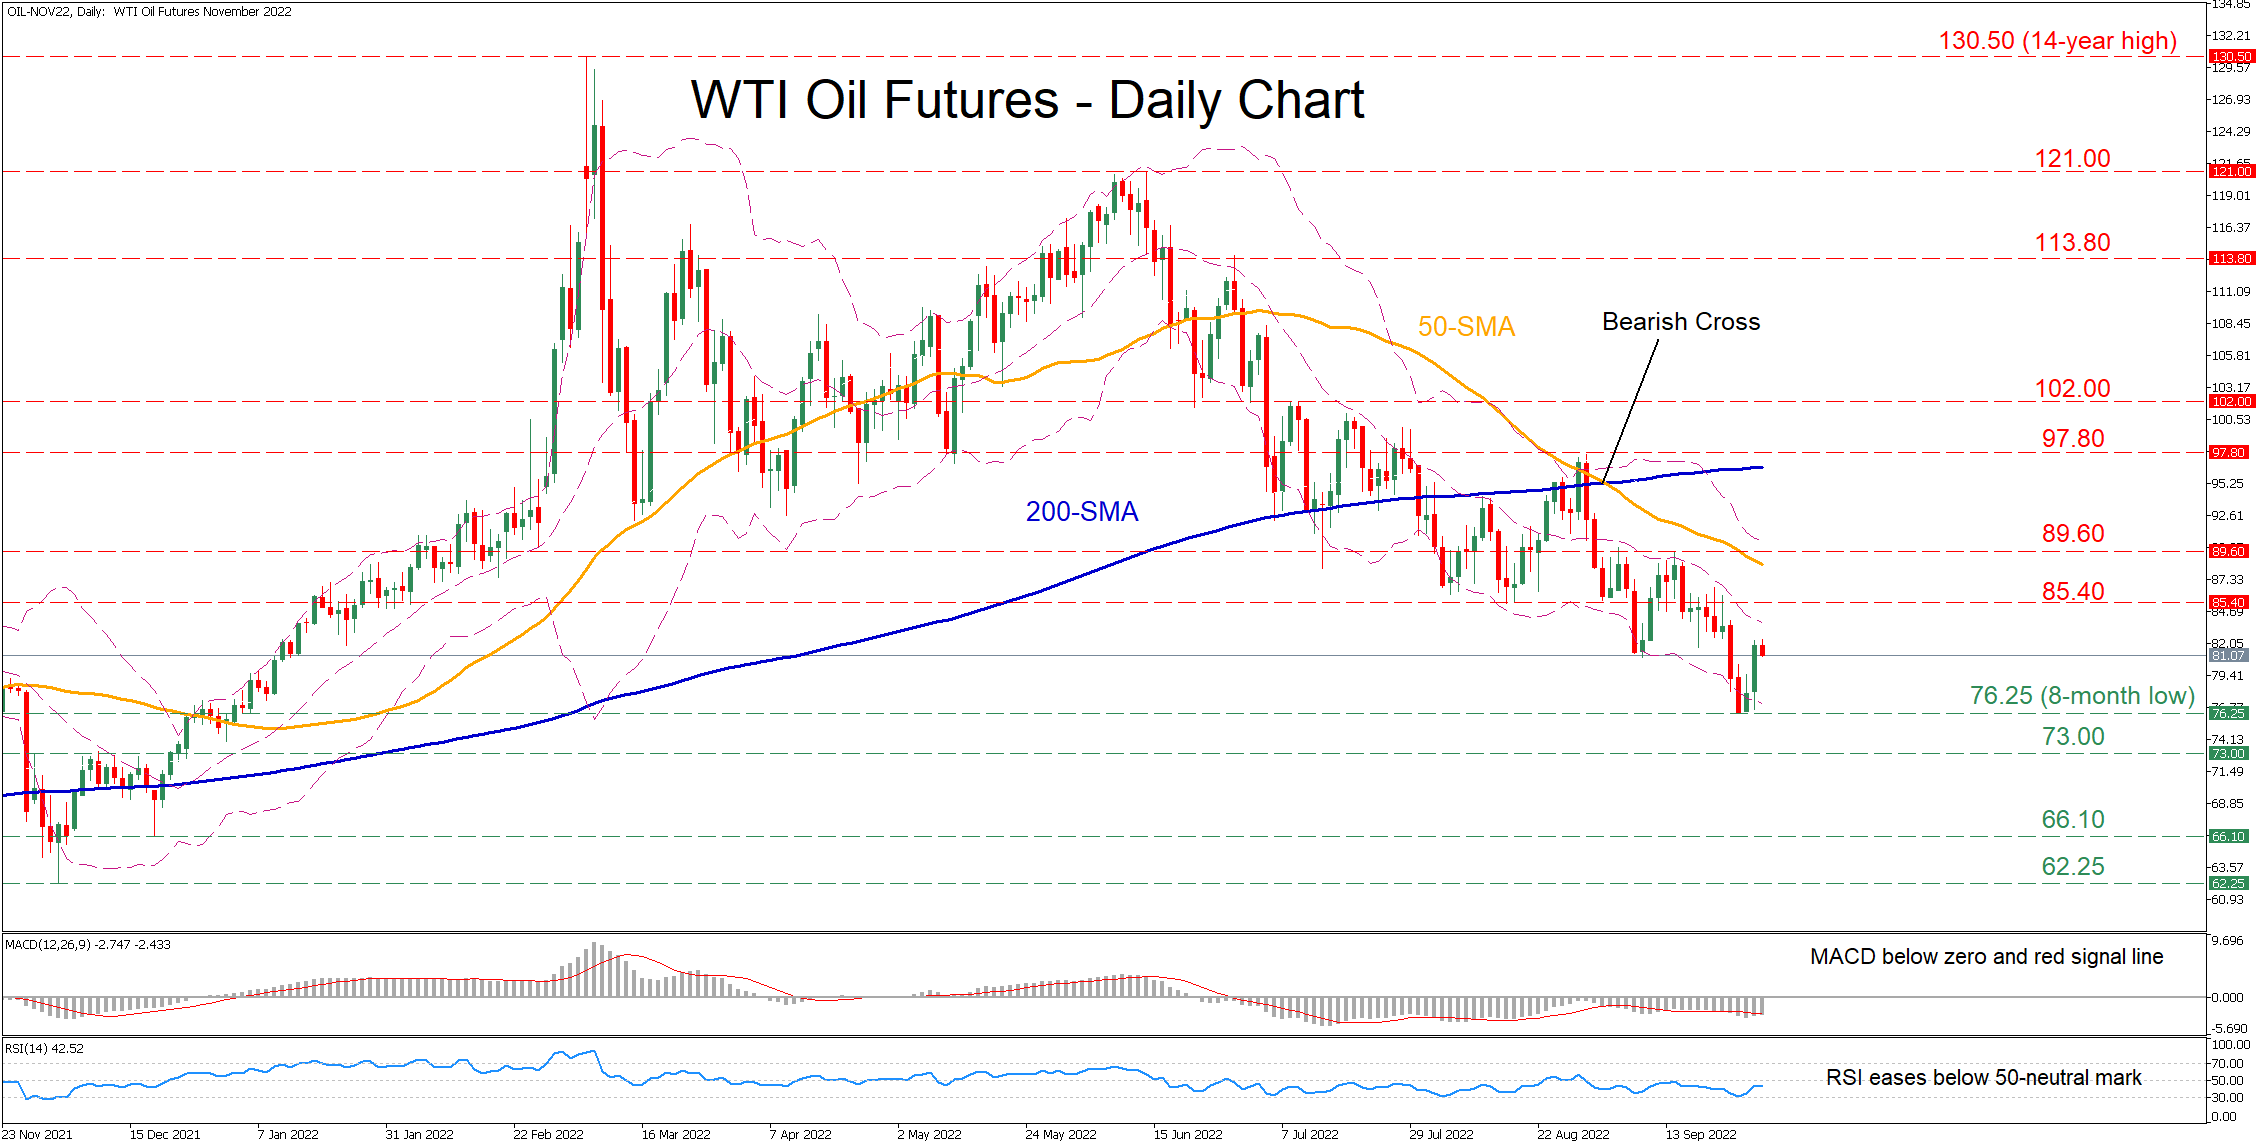
WTI oil futures (November delivery) have been experiencing a prolonged decline since mid-June when the price failed to surpass the 121.00 mark. Although the commodity has been recording consecutive fresh lows in the last few daily sessions, it managed to recoup some losses after hitting an 8-month low.
The short-term oscillators are depicting that bearish forces remain in control despite the recent upside bounce. Specifically, the MACD remains below both zero and its red signal line, the RSI is flatlining beneath the 50-neutral threshold.
Should the negative momentum intensify further, price declines could cease at the eight-month low of 76.25. Dipping beneath that region, the bears could target the December 2021 resistance zone of 73.00 before the December low of 66.10 comes under examination. Even lower, the November bottom of 62.25 may provide downside protection.
On the flipside, bullish actions might propel the price towards the recent support zone of 85.40, which could now act as resistance. Conquering this barricade, the price may ascend towards 89.60 or higher to challenge the August peak of 97.70. A break above the latter could open the door for the 102.00 region.
Overall, despite the minor upside correction, WTI oil futures are likely to lose more ground as the commodity appears to be facing persistent downside pressure. For that bearish tone to reverse, the price needs to jump above the 97.80 ceiling.
AUDUSD Detects Oversold Conditions Near Fresh Lows
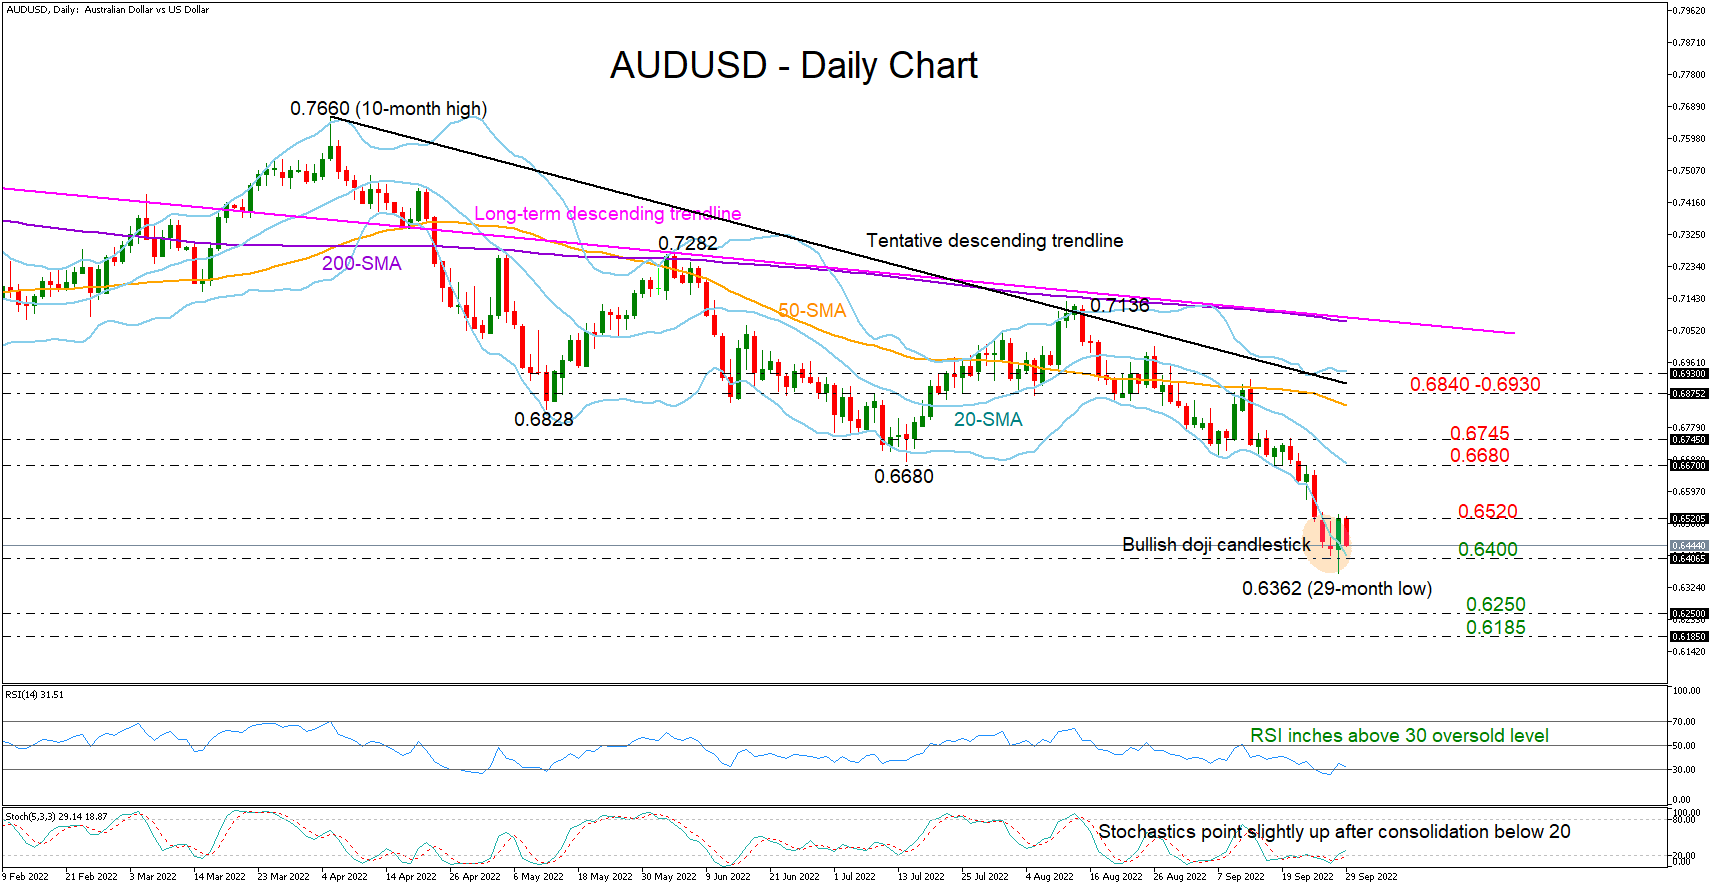
AUDUSD was trimming Wednesday’s quick bounce from the 29-month low of 0.6362 during Thursday’s early European trading hours, but the completed doji candlestick pattern continued to feed hopes for an upside reversal.
Given the price’s continuous contact with the lower Bollinger band over the past month, the odds are favoring the bulls. The RSI and the stochastics are adding to this optimism as the indicators are trying to exit the oversold territory.
Nevertheless, buyers could hold up until the price successfully claims the nearby resistance of 0.6520. If that proves to be the case, the pair might fly directly towards July’s trough of 0.6680, where the 20-day simple moving average (SMA) happens to be. Slightly higher, the 0.6745 region had been frequently tested during 2019 and could be the key for an advance towards the 0.6840-0.6900 zone. Note that the 50-day SMA, as well as the tentative descending trendline from 0.7660, are positioned within this region.
If the bearish scenario plays out, with the price closing below 0.6400, the next pivot point could develop around 0.6250, taken from April 21 2020. Should sellers persist, the downtrend could stretch towards the 0.6185 barrier.
In short, despite the clear downtrend in AUDUSD, the technical picture is increasing the stakes for some stabilization in the market. Perhaps a decisive close above 0.6520 could help the pair to gain some extra ground.
US Dollar Index: The Primary Corrective Trend Could Have Just Begun
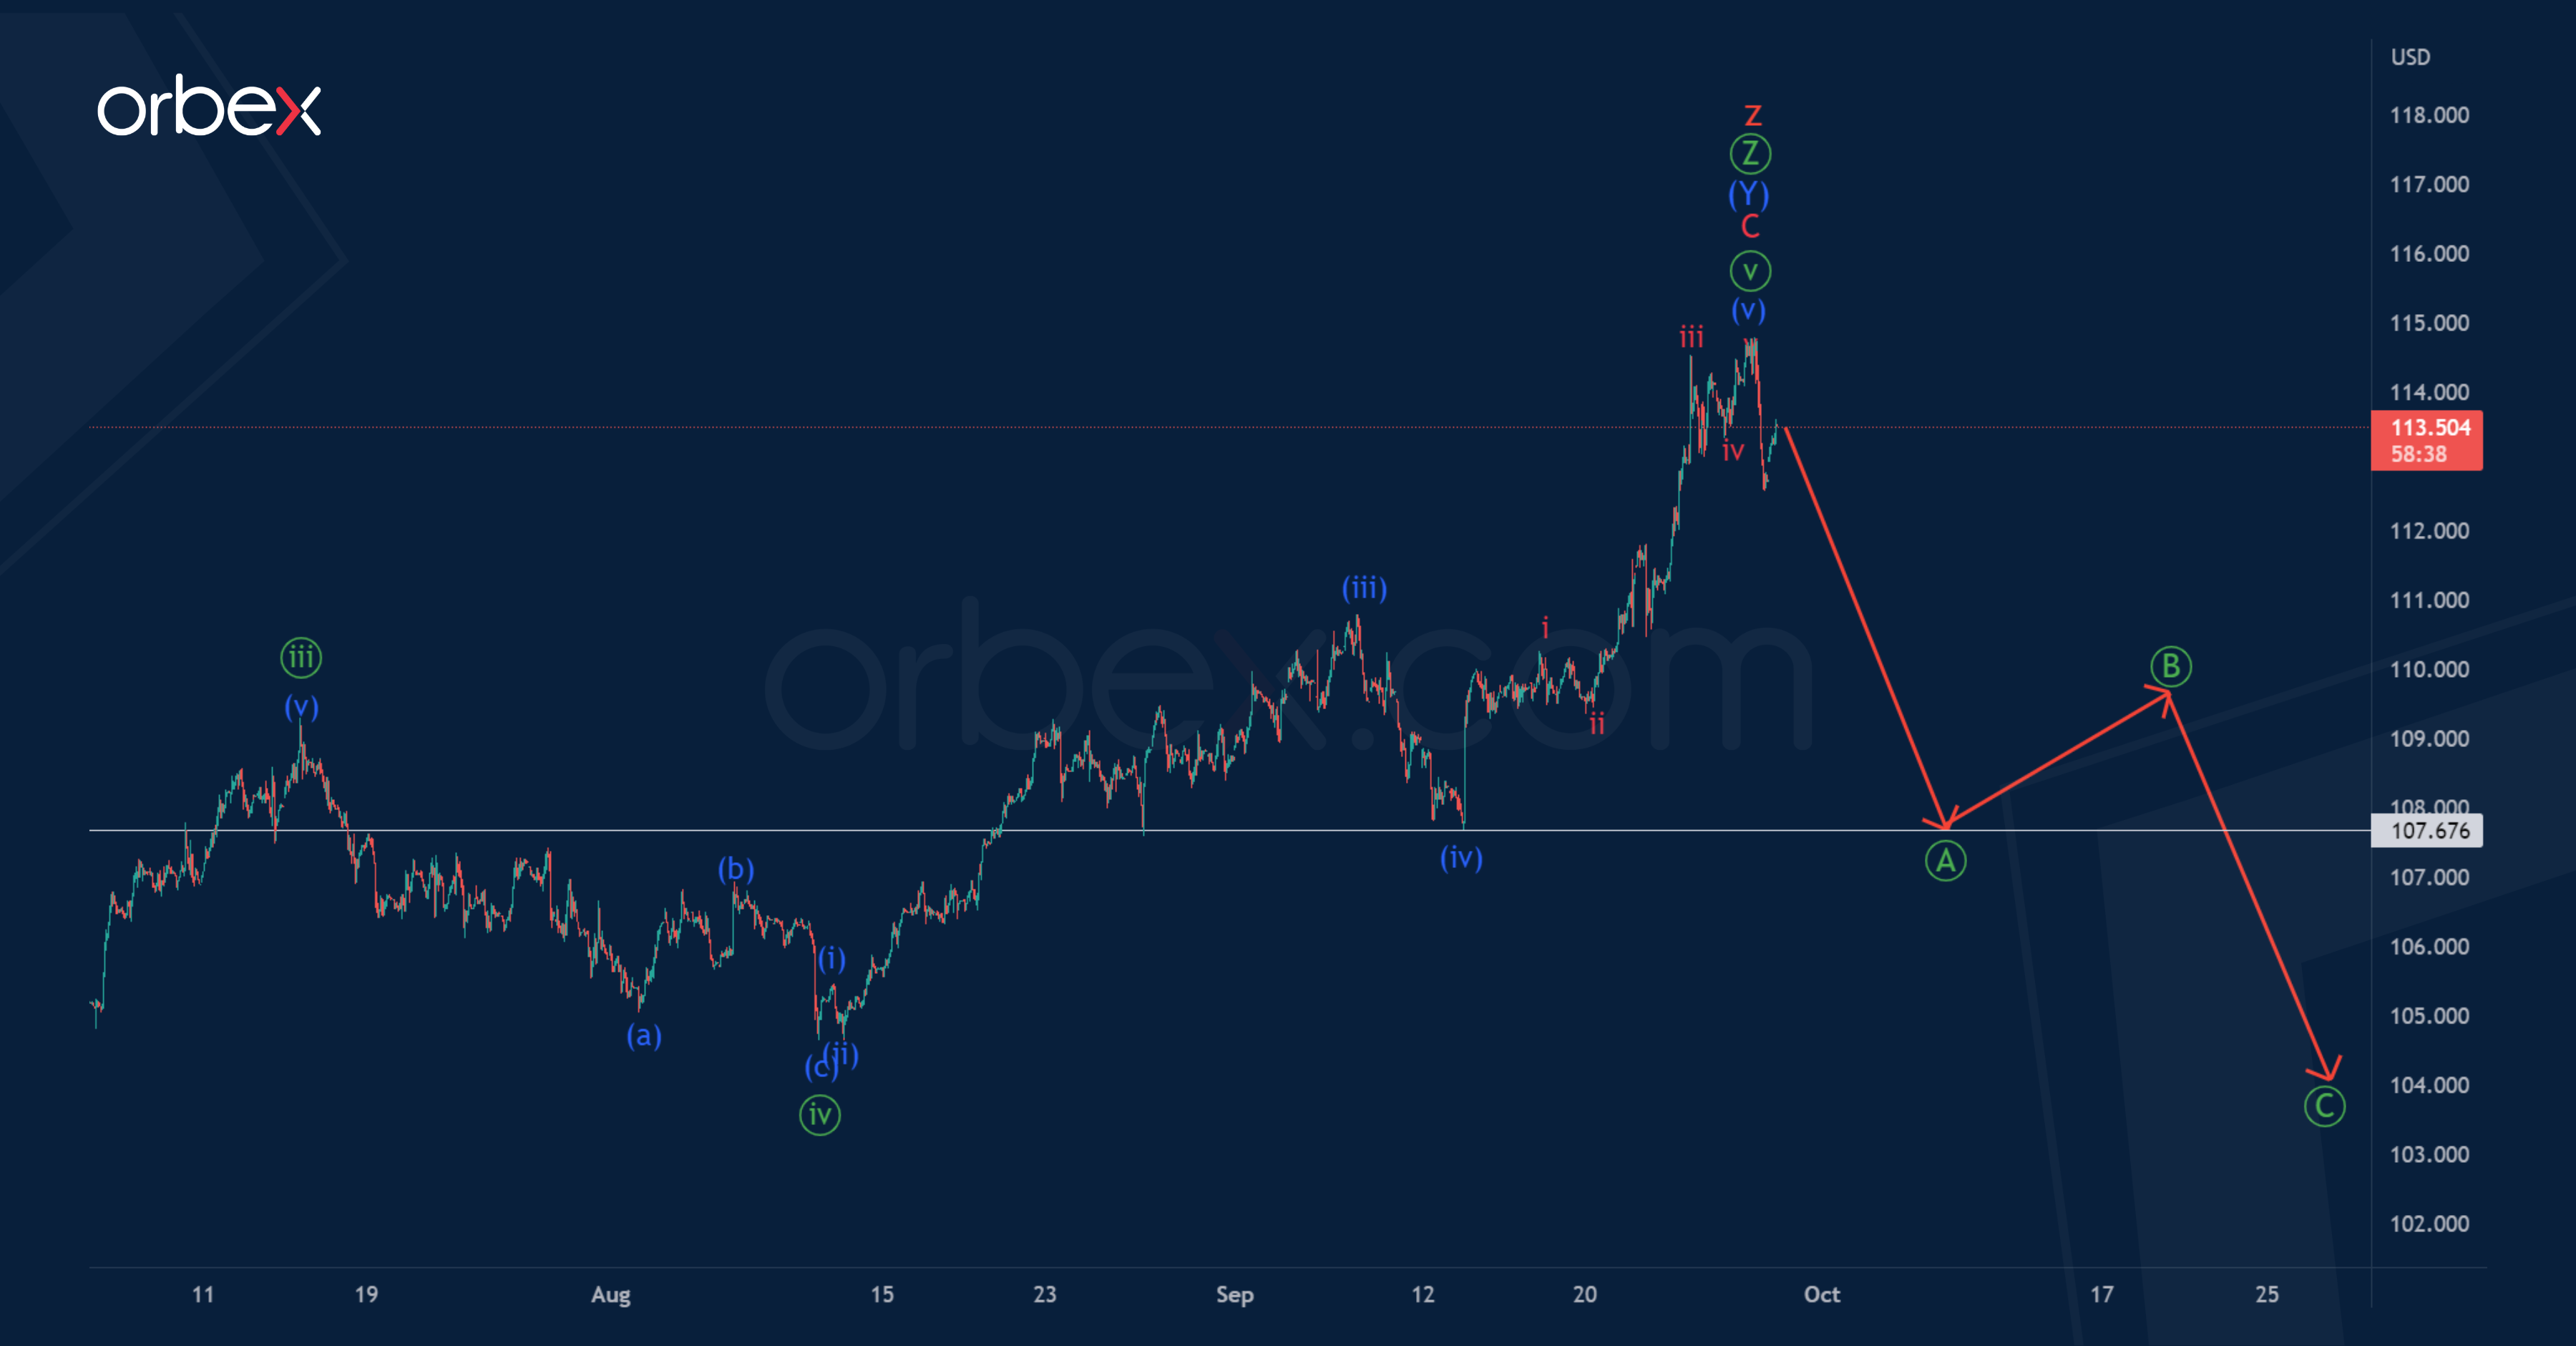
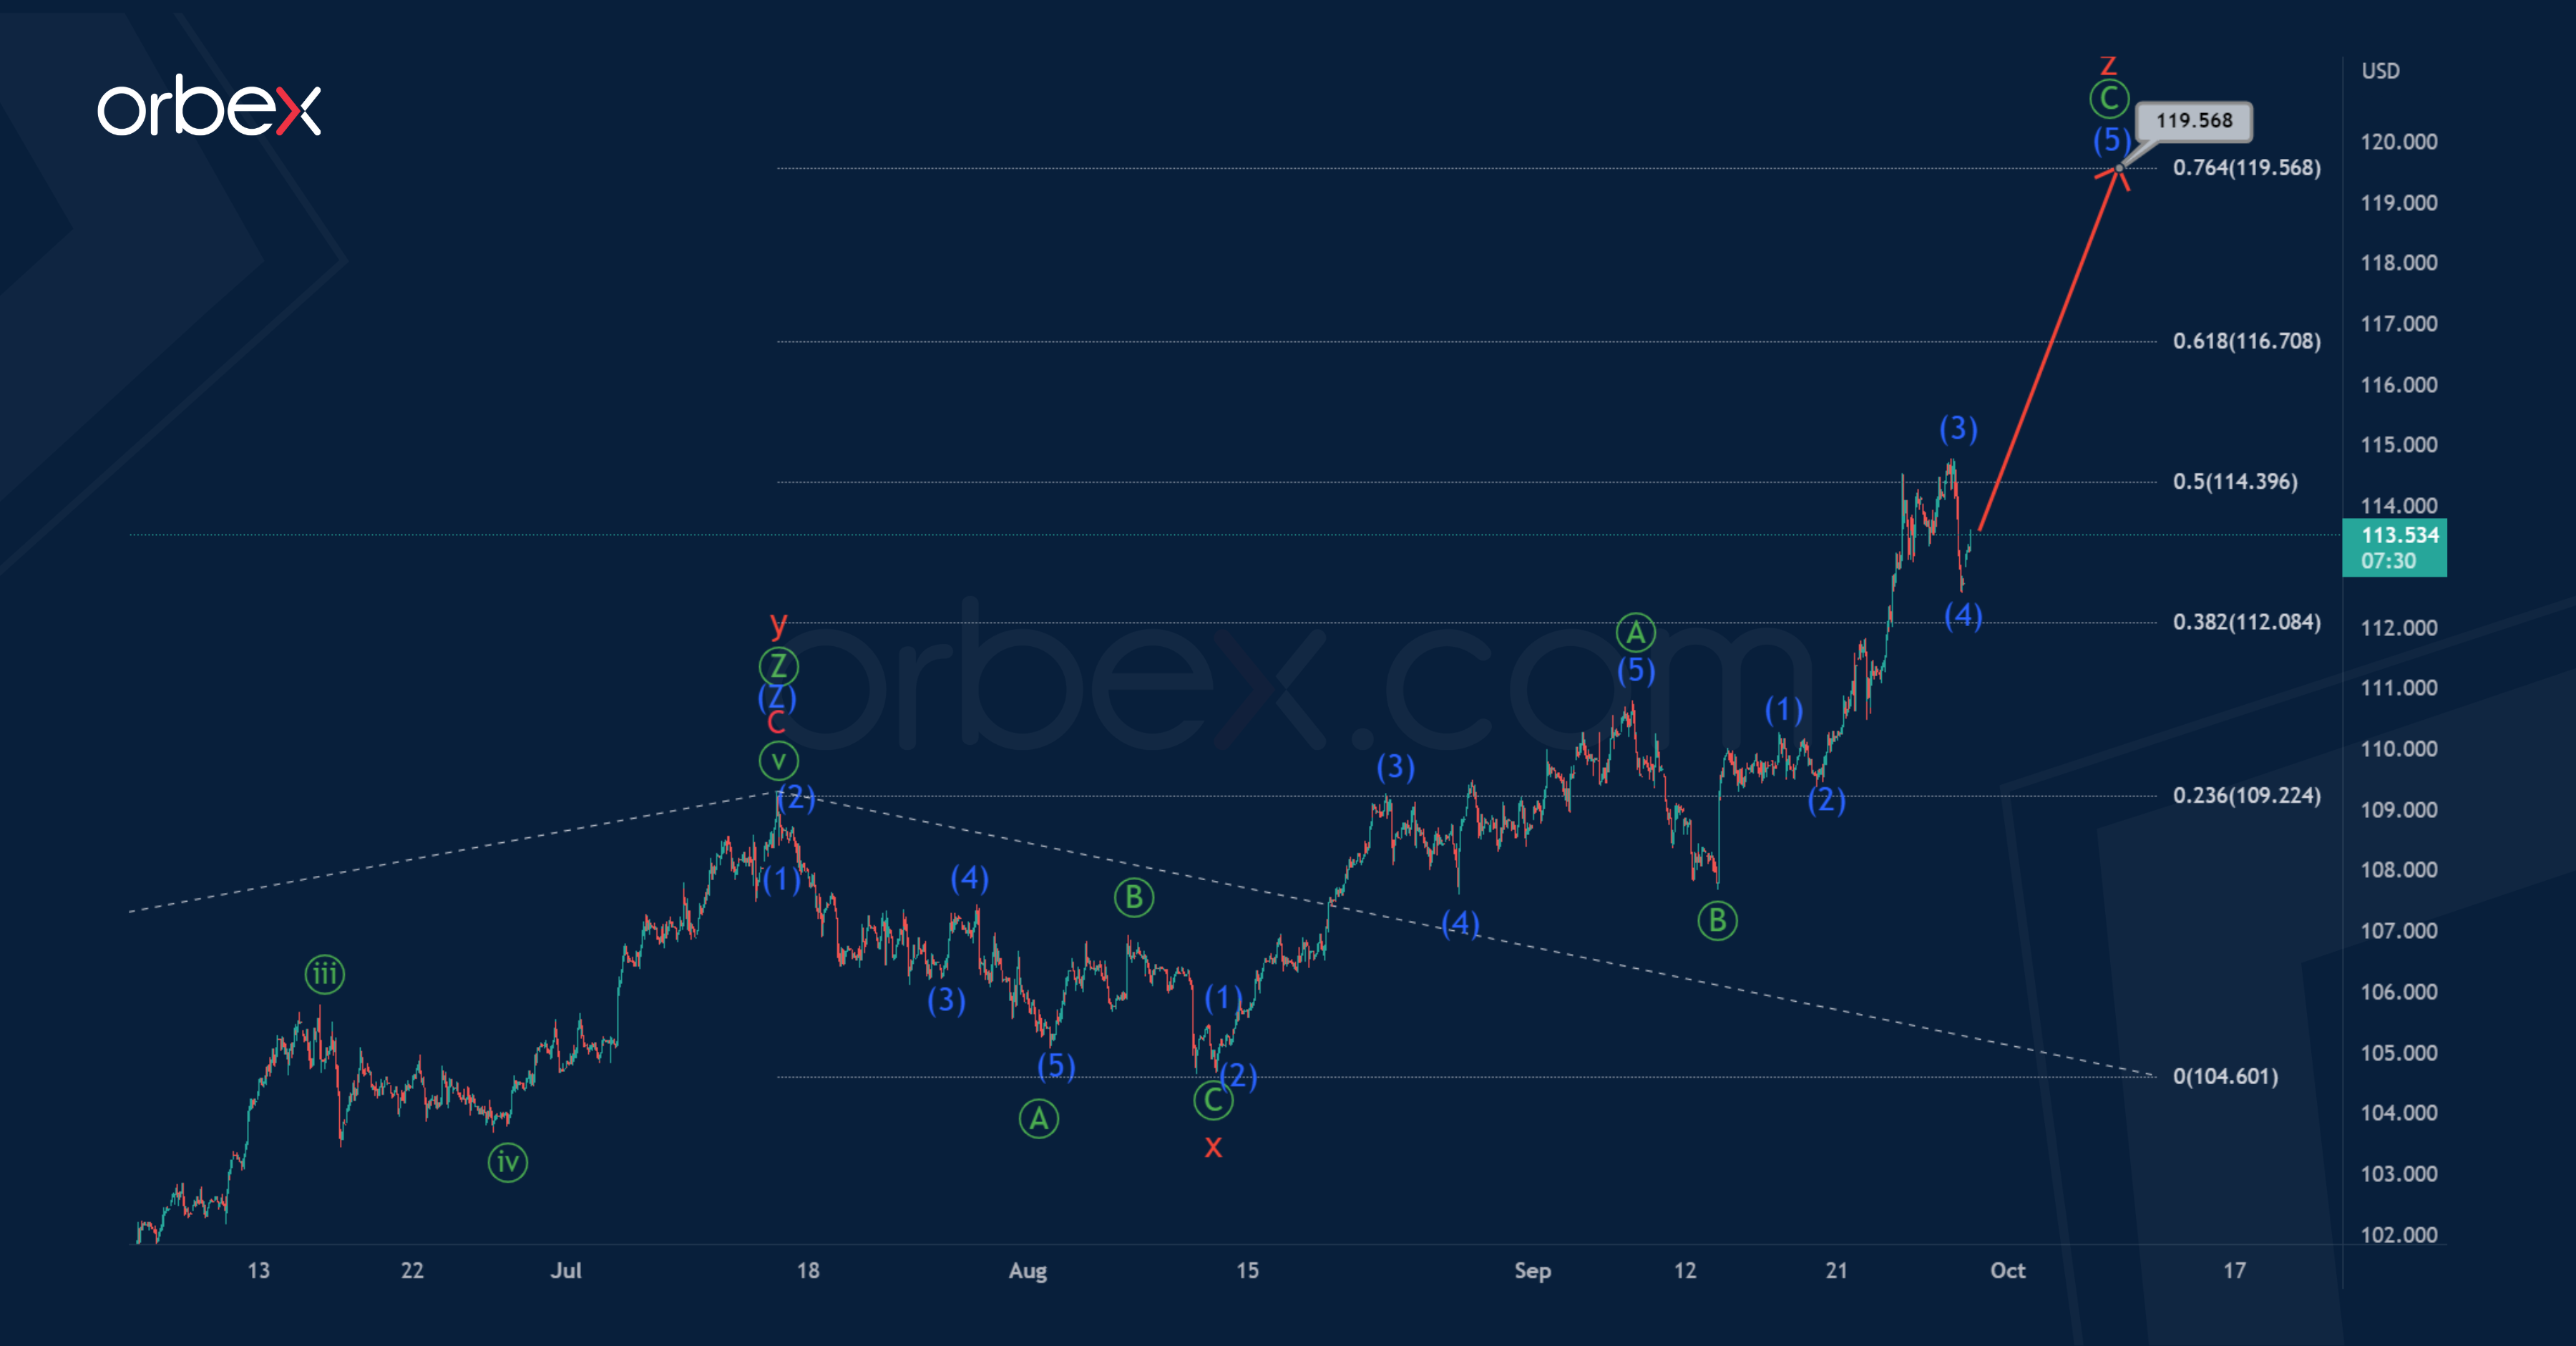
We talked about the situation on the DXY index a little more than two weeks ago. Apparently, its internal structure shows the completion of the global corrective trend, which took the form of a triple zigzag consisting of five main cycle waves w-x-y-x-z.
It is possible that the market has now begun the formation of the initial part of a new bearish trend.
It is assumed that the bears are starting to build the first impulse sub-wave of the potential standard zigzag Ⓐ-Ⓑ-Ⓒ. The end of the impulse Ⓐ is possible at a minimum of 107.67, which is marked by a minuette fourth correction.
An approximate scheme of possible future movement is shown on the chart.
However, another option is also possible, in which the formation of a cycle triple zigzag is not yet fully completed.
Most likely, at the level of 104.60, the bearish cycle wave x was completed, which took the form of a standard zigzag Ⓐ-Ⓑ-Ⓒ of the primary degree. After that, an upward impulse price movement in the wave z began.
The wave z may take the form of a zigzag Ⓐ-Ⓑ-Ⓒ, where the first impulse and correction are already completed.
The entire wave z may complete its pattern near 119.56. At that level, it will be at the 76.4% Fibonacci extension of wave y.
GBP/USD: Correction Faced Strong Headwinds at Key Resistances
Cable is standing at the back foot in early Thursday, signaling that two-day recovery on oversold conditions, which was sparked by strong downside rejection on Monday, might be running out of steam.
Price adjustment on profit taking after sterling entered uncharted territory, was a logical scenario, although there is a big question mark about the strength and length of correction, as overall picture is very bearish.
Cable is on track for the seventh straight monthly fall, with Septembers drop being the biggest since June 2016 that warn of limited upticks before larger bears resume.
On the other side, ear-term picture is unclear, as negative momentum is strong and moving averages are in bearish setup on daily chart, but the RSI is still oversold and weekly action is so far shaped in Doji candle with very long tail.
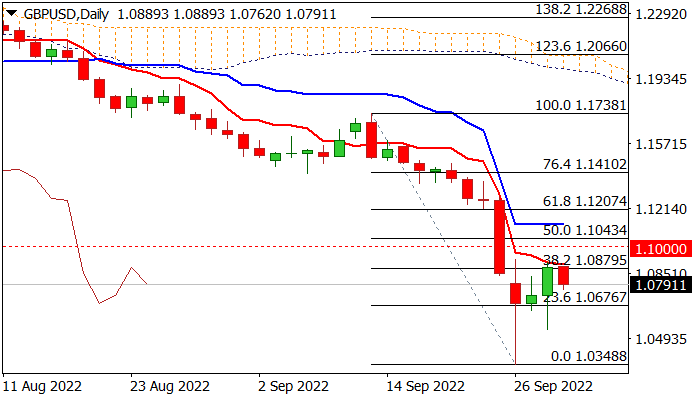
Correction was so far capped by pivotal resistances at 1.0900 zone (Fibo 38.2% of 1.1738/1.0348 bear-leg / daily Tenkan-sen) and near-term bias is expected to remain with bears while the price stays below these barriers, but bears will require a confirmation on weekly / monthly close below 1985 low at 1.0520.
Conversely, sustained break of 1.0900 resistance zone would signal extended recovery, but only lift above daily Kijun-sen (1.1124) would neutralize bears for stronger correction.
Res: 1.0879; 1.0904; 1.1000; 1.1043.
Sup: 1.0762; 1.0676; 1.0539; 1.0520.
Daily Technical Analysis
EUR/USD
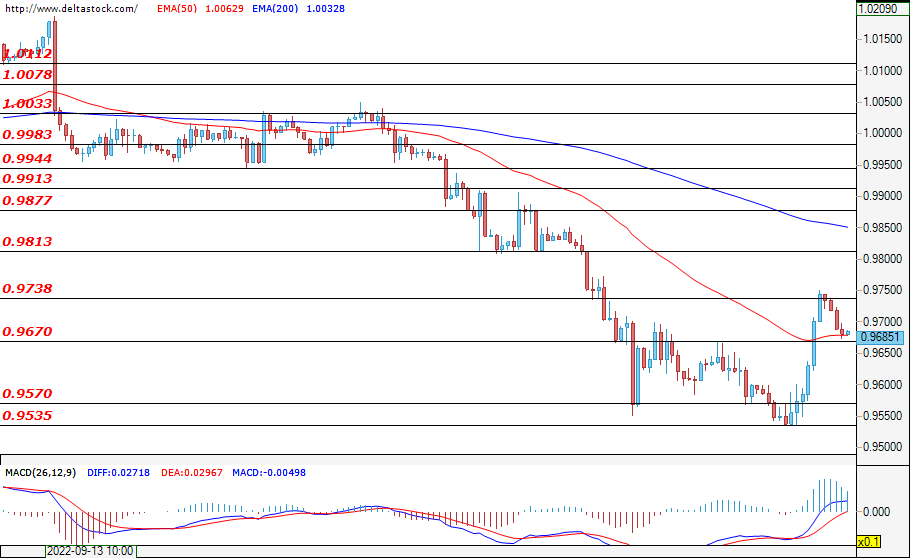
The single European currency is trying to stop its depreciation against the U.S. dollar, and after hitting another rock bottom at 0.9535, the pair’s rate managed to settle above the two supports at 0.9570 and at 0.9670. Attempts by the bulls to settle more permanently above the resistance at 0.9738 are not particularly successful so far, but the bears cannot gain an upper hand either as they try to overcome the support at 0.9670. This, however, doesn’t necessarily mean that the downward movement is over just yet. An economic indicator that may have an impact on the rates today is the weekly jobless claims data for the U.S.
USD/JPY
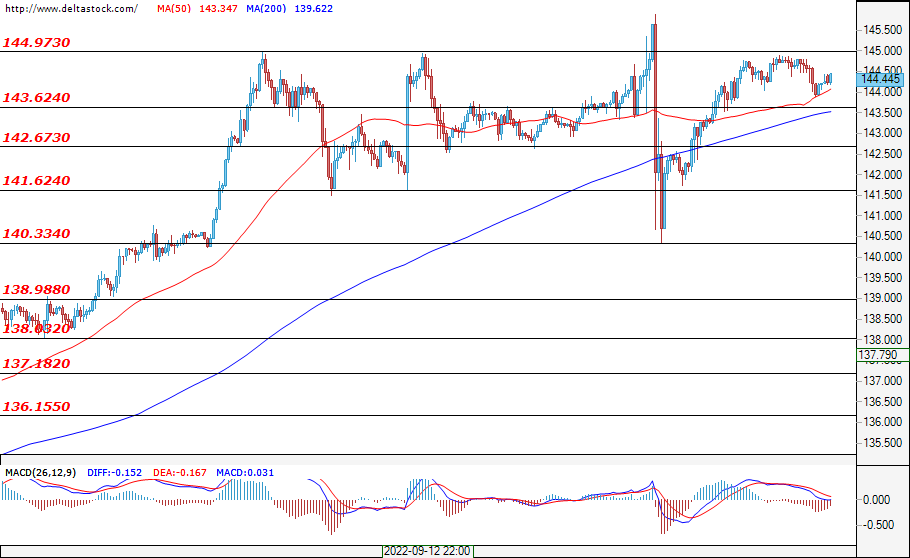
The consolidating movement of the currency pair between the support at 143.61 and the resistance at 144.93 continued, both in the past trading session and in the beginning of the new one. The bulls control the market and so a successful breakout at the 145.00 level would not be a surprise to anyone. In the opposite case, if the support at 143.61 is overcome, then it would open the way for the bears towards the next two support zones at 142.68 and at 141.62, where the bulls should intervene and stop their advance.
GBP/USD
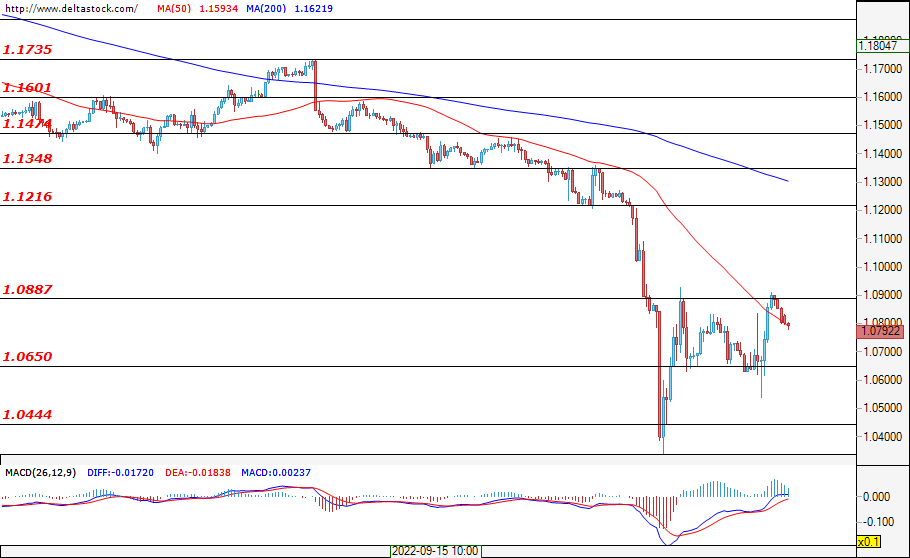
The bulls' attempt to break through the resistance at 1.0884 proved unsuccessful. Although the pound has been trying to consolidate above the support at 1.0444 since the start of the week, this does not mean that the bears have given up just yet. The bulls need to break through at least two important resistances – 1.0884 and 1.1217 – before they can be said to have achieved any temporary success. Sentiment remains negative and the bears are likely to look for new lows should they breach the support at 1.0444.
EUGERMANY40
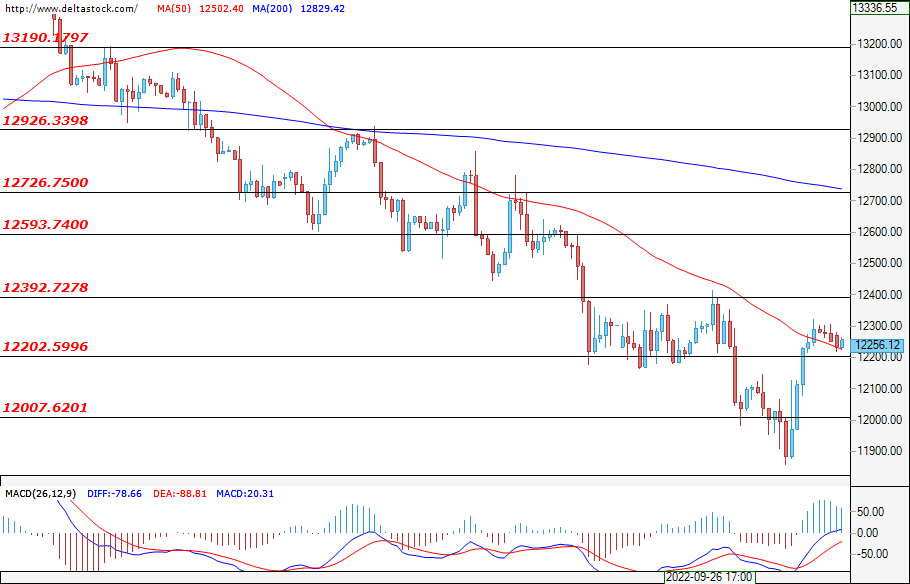
The downward movement of the German index was limited for now and the bears stopped at the support at 12028. However, the performance of the bulls so far is not convincing, because their target – the resistance at 12392 – has yet to be reached. If this does not happen and this resistance is not overcome, it is very likely that the bears will easily pass through the support at 12028, thus continuing the downtrend formation.
US30
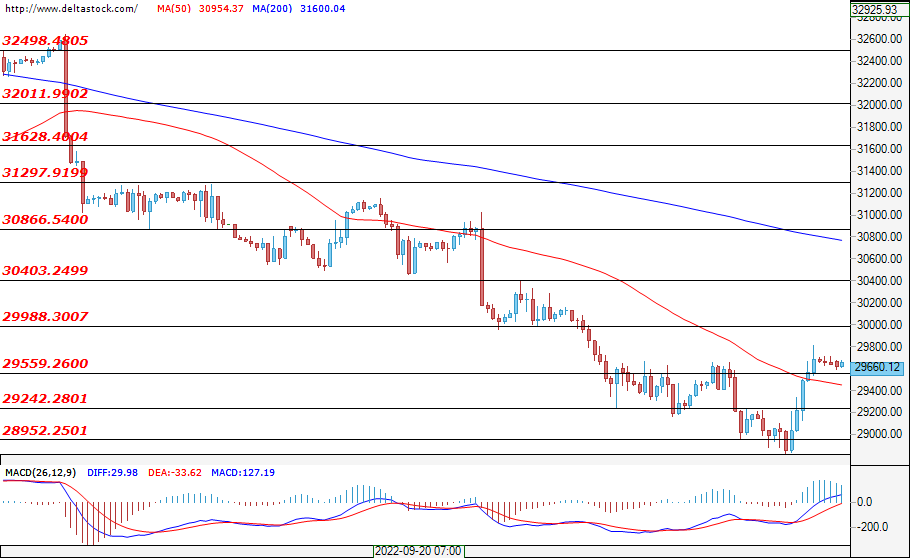
The U.S. blue-chip index is trying to recover from the sell-off from the past week, holding its course above the support level at 29658. On the other hand, the bulls' target – the resistance at 29998 – has also not been overcome. If this does not happen, then we are likely to witness the return of the bears to the market and another attack on the support at 29242.
US Oil Bounces Back
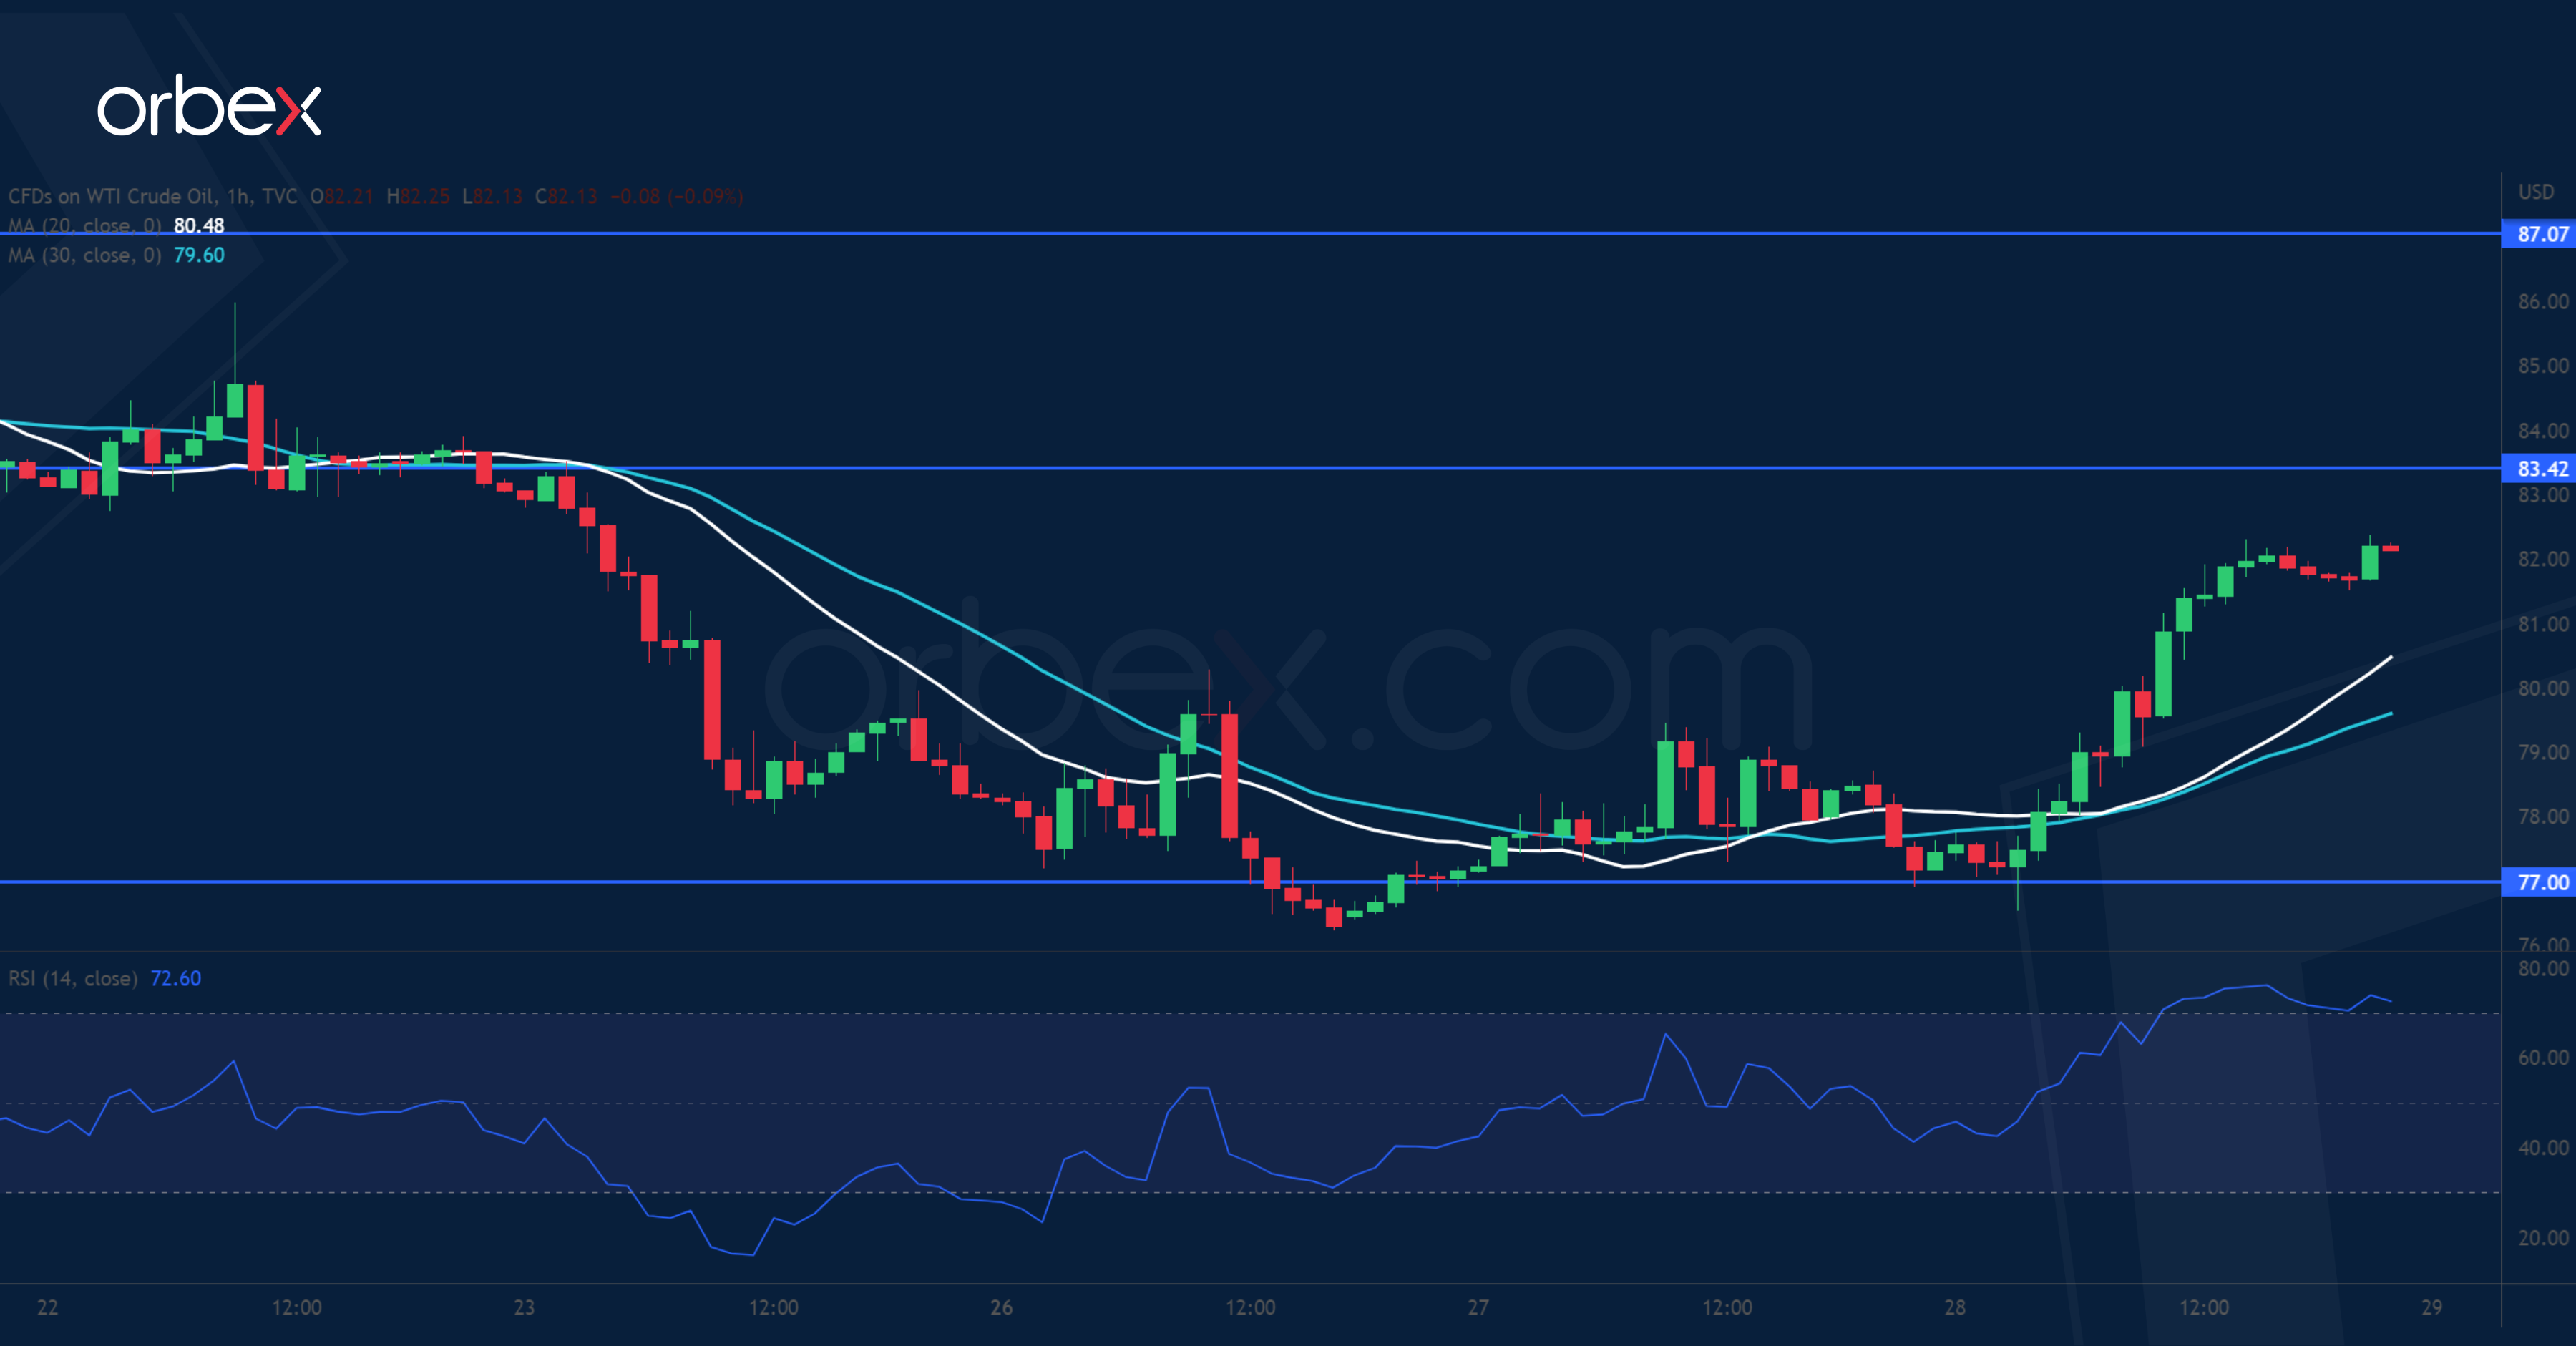
WTI rallies back as US crude stocks fell more than expected. A fall below 82.00 has renewed the pressure on the buy side by invalidating the recent rebound. Trend followers may take this as a signal to add their stakes. The price is hovering above this year’s low at 75.00 with some bargain hunting off 77.00. An overbought RSI may limit the upside. The support-turned-resistance at 83.40 coincides with the 20-day moving average and could be a congestion area. Further up, stiff selling would be expected in the supply area next to 87.00.