Sample Category Title
Takaichi’s Strong Win Boosts Tech Stocks
Last week’s hectic trading ended with a rebound in technology stocks and Bitcoin. Optimism spilled across most assets that are trading on sentiment these days, including gold and silver.
Nvidia, for example, jumped nearly 8% and pushed the Dow above the 50’000 mark for the first time in history — with no major news on the wire other than CEO Jensen Huang saying, “to the extent that people continue to pay for AI and AI companies are able to generate a profit from that, they’re going to keep on doubling, doubling, doubling.”
Fair enough. But what about capacity constraints? What about the speed of demand growth potentially lagging investments that could become obsolete faster than the depreciation rates used on Big Tech balance sheets? And what about circular deals? What happens if a key customer like OpenAI misses a payment?
The point is this: markets rebounded on Friday after a chaotic week, but the fundamental questions that keep investors up at night remain firmly in place. Last week, Amazon, Google, Meta and Microsoft announced plans to spend around $650–700 billion on AI-related investments in 2026, mostly in data centers, AI infrastructure, chips and computing capacity, as they race to dominate the AI era. That figure is far higher than earlier estimates and will flow straight into the pockets of enablers such as Nvidia, AMD, memory chipmakers and data center operators. Yet for the big spenders, a portion of this outlay seems to be a show-off — to signal dominance to others in the AI race rather than being fundamentally justified.
And big gains — like the ones we saw last Friday — can be just as unsettling as big losses. Both signal markets navigating agitated waters, where moves may not prove sustainable.
The good news is that Japanese Prime Minister Sanae Takaichi won — and won big — her bet in the weekend snap election. She pulled off a stunning victory, with her ruling Liberal Democratic Party (LDP) scoring a historic landslide and securing a two-thirds supermajority in the powerful lower house of parliament — even more if you include its coalition partner. That gives her party its most dominant position in decades and a strong mandate to push through an expansive fiscal agenda, particularly benefiting defense and technology. This likely helps explain why South Korea’s Kospi rebounded nearly 4% today. Still, the tech rebound could face speed bumps ahead.
Across Japanese markets, JGB yields jumped at the open, with the 10-year returning to the highest levels in a week on fiscal spending concerns. The Nikkei and Topix also jumped at the open, both hitting fresh record highs on growth and fiscal optimism, but the Nikkei later gave back most early gains — likely reflecting rising yield pressure and concerns that growth may come at a cost. The Topix, by contrast, is holding on to gains, up more than 2% at the time of writing.
The yen gapped lower at the open but quickly retraced losses, suggesting currency traders are leaning toward the idea that the Bank of Japan (BoJ) would not hesitate to act if inflation runs too hot under such an expansive fiscal plan. As a result, the yen’s rebound may look like a brief honeymoon — or a bout of day-dreaming — before the reality of fiscal spending sinks in for a country whose ambitions may be running ahead of its wallet.
Away from Japan, the dollar index kicks off the week under renewed selling pressure, partly due to gains in the yen, gold and silver. The USDCHF continues to push lower after forming solid resistance earlier this month and remains one of the few assets left in the traditional safe-haven space.
Bitcoin is consolidating near the $70’000 mark this morning after successfully building support near $60’000 during last week’s slump. Still, it is hard to say whether the worst is behind us. The rebound since Friday has not even reached the minor 23.6% Fibonacci retracement of the October-to-last-week selloff, which sits near $77’000. For now, Bitcoin remains in a bearish consolidation phase.
With Big Tech earnings and spending announcements now behind us, the week ahead may see markets digest the news, reprice expectations and consolidate — barring surprise headlines from any direction. Coca-Cola, McDonalds and Cisco are among the big names that will go to the earnings confessional.
On the geopolitical front, US crude has returned to its 200-day moving average after weekend talks between the US and Iran were described as “very good” by the US President. Whether that is enough to justify easing tensions and keep oil in a bearish trend — below $64 per barrel, the 38.2% Fibonacci retracement of the summer 2025 slide — remains to be seen. Risks remain two-sided.
On the data front, the week’s agenda is packed with key US releases, including jobs data due Wednesday and inflation figures on Friday. Expectations point to continued softening in labour markets alongside easing inflation — the ideal combination for Federal Reserve (Fed) doves.
In the absence of major data elsewhere, the US dollar is likely to remain in the driver’s seat for FX markets. Major currencies start the week higher, with the EUR/USD and cable both gaining, though support from European Central Bank (ECB) and Bank of England (BoE) policy outlooks remains uncertain. In the UK in particular, expectations that the BoE is close to a rate cut should cap upside.
The AUD/USD is back above the 70-cent level and could extend toward 0.72 on divergence between Reserve Bank of Australia (RBA) and Fed outlooks — a move that would officially mark the end of the 2021–2025 downtrend. The AUD/JPY — one of the market’s favourite carry trades — hit a fresh record high this morning. Despite rising JGB yields and hawkish BoJ bets, rate differentials remain attractive for a further extension of the bullish trend.
The key risk is a direct FX intervention from Japanese authorities, who remain deeply concerned about the yen’s rapid depreciation and its impact on household purchasing power.
EUR/JPY Daily Outlook
Daily Pivots: (S1) 184.76; (P) 185.28; (R1) 186.21; More...
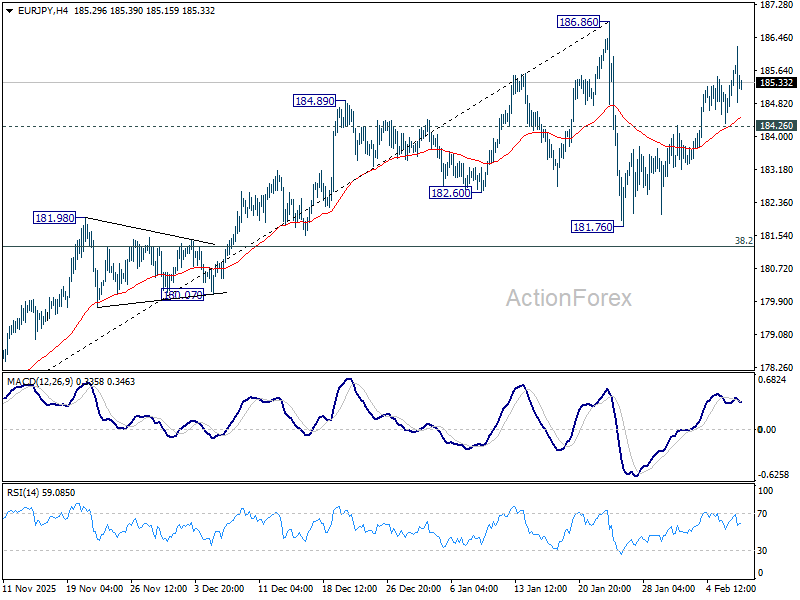
Intraday bias in EUR/JPY stays neutral for the moment. Price actions from 186.86 are developing in to a near term consolidation pattern. On the downside, below 184.26 support will bring another fall as the third leg. But downside should be contained by 38.2% retracement of 172.24 to 186.86 at 181.27 to bring rebound. On the upside, decisive break of 186.86 will resume larger up trend.
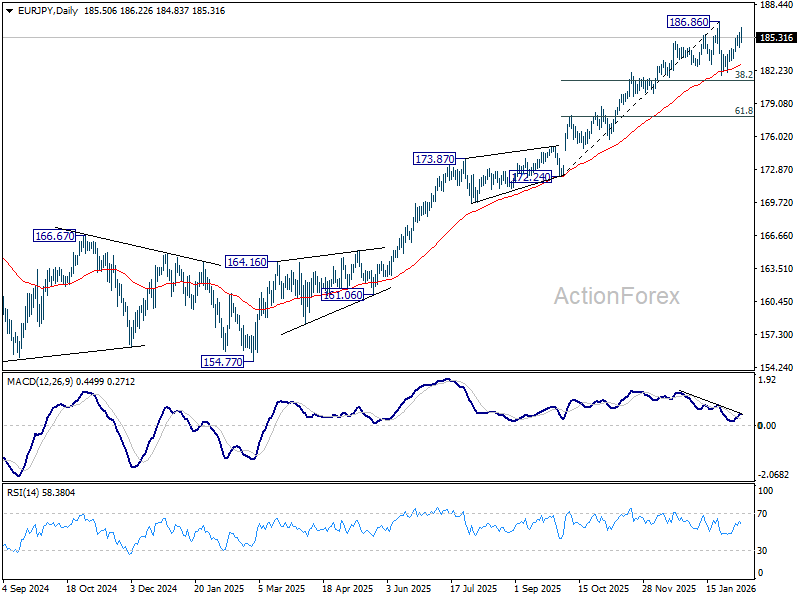
In the bigger picture, up trend from 114.42 (2020 low) is in progress. Upside momentum has been diminishing as seen in bearish divergence condition in D MACD. But there is not clear sign of topping yet. On resumption, next target is 78.6% projection of 124.37 to 175.41 from 154.77 at 194.88 next. Meanwhile, outlook will stay bullish as long as 55 W EMA (now at 174.22) holds, even in case of deep pullback.
Japan Election Rally Lifts Asia as Yen Finds Support From Intervention Rhetoric
Japan dominated the Asian session as markets reacted to Prime Minister Sanae Takaichi’s decisive election victory over the weekend. The scale of the win, which delivered a supermajority in parliament, triggered a powerful relief rally in domestic equities and set the tone for the broader region. Nikkei surged to a fresh record above 57,000 before trimming some gains, but it continues to hold the bulk of the move. That momentum spilled across the region, lifting Asian equities broadly.
The move was also supported by improving global sentiment after US markets showed renewed resilience late last week. DOW surged to a new record above 50,000 last Friday, signaling that concerns over AI-driven disruption and capex excess have not derailed the broader bull market. With US equities regaining their footing, risk appetite in Asia found an additional tailwind.
Despite the equity surge, Yen’s initial selloff was restrained. Rather than extending sharply lower, the currency stabilized and even firmed modestly as the session progressed, reflecting traders’ sensitivity to renewed intervention risk.
Japanese officials were quick to step up verbal warnings. Finance Minister Satsuki Katayama reiterated over the weekend that authorities stand ready to engage markets to stabilize the Yen, stressing that Japan retains the right to intervene against moves that deviate from fundamentals. Katayama also confirmed close coordination with US Treasury Secretary Scott Bessent, reinforcing the credibility of Japan’s warnings.
That message was echoed today by top currency diplomat Atsushi Mimura, who said authorities were watching FX developments “with a high sense of urgency.” Chief Cabinet Secretary Minoru Kihara added to the chorus, voicing concern over one-sided currency moves. The coordinated messaging appears to have been effective in discouraging aggressive Yen selling, at least for now.
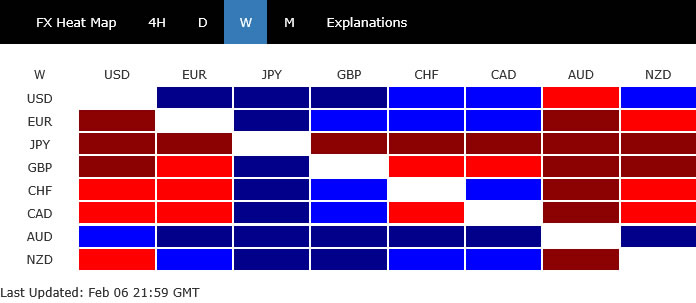
In currency markets, Yen emerged as the strongest performer of the day so far, followed by Aussie and Euro. On the other side, Dollar lagged the most, followed by Sterling and Kiwi, while Swiss Franc and Loonie traded more neutrally. Looking ahead, attention will shift quickly to a heavy US data slate, headlined by the delayed non-farm payrolls report and January CPI. Those releases will determine whether the current rebound in risk sentiment has legs.
In Asia, Nikkei rose 4.22%. Hong Kong HSI is up 1.71%. China Shanghai SSE is up 1.26%. Singapore Strait Times is up 0.50%. Japan 10-year JGB yield is up 0.055 at 2.289.
Nikkei celebrates Takaichi landslide, USD/JPY faces post-election reality check
Japan enters the week riding a powerful post-election wave after equities surged to fresh record highs. Nikkei jumped above 57,000 following Prime Minister Sanae Takaichi’s historic election victory. Although the index has since retreated modestly, it is still holding on to the bulk of its gains, up nearly 4.5% on strong domestic risk appetite.
Takaichi’s win was historic in scale. Her Liberal Democratic Party captured 315 seats in the lower house, its strongest showing ever, and together with coalition partner Ishin now controls 351 seats. That gives the ruling bloc a two-thirds supermajority, allowing it to override the upper house and advance legislation with unprecedented ease.
That supermajority significantly strengthens Takaichi’s hand. It opens the door not only to aggressive fiscal measures but also to constitutional changes, while easing the path for defense spending increases amid a more challenging global environment. For equity investors, political uncertainty has collapsed, and policy execution risk has been sharply reduced.
Yen, however, has not followed equities in a straight line. USD/JPY initially jumped at the Asian open but quickly retreated. Traders remain alert to the risk of intervention should the Yen weaken too sharply, limiting follow-through on election-driven selling. This leaves currency markets in wait-and-see mode. With the election result now fully realized, the question is whether Yen selling momentum can re-emerge as focus shifts back to fiscal expansion, or whether the pair has already priced in the bulk of the political shock.
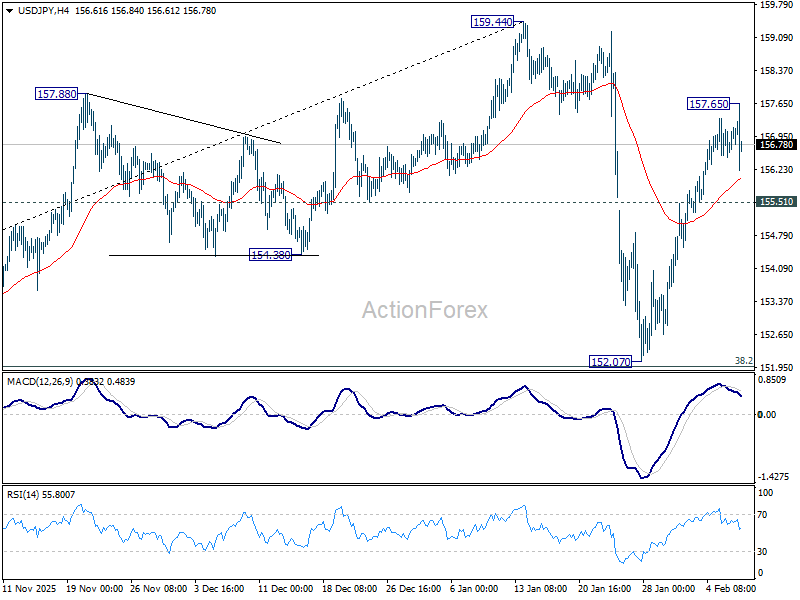
Technically, momentum is already showing signs of fatigue. USD/JPY’s 4H MACD is falling below its signal line, indicating that the rebound from 152.07 is losing steam. That move is viewed as the second leg of a broader corrective pattern from 159.44. While further gains remain possible as long as 155.51 holds, strong resistance is expected near 159.44 high. A clear break below 155.51 would argue that the third leg of the correction is already underway, reopening the path back toward the 152.07 support ahead.
Japan's nominal pay accelerates to 2.4% in December, but real wages still negative
Japan’s real wages fell -0.1% yoy in December, marking the 12th consecutive monthly decline, though the contraction was the smallest seen in 2025. While the pace of erosion is clearly slowing, the data underline how inflation continues to outpace pay gains for households.
Nominal wages rose 2.4% yoy, extending a 48-month streak of increases, but the outcome fell short of expectations for a 3.0% rise. The acceleration from November’s 1.7% growth points to improving momentum, but not yet at a pace sufficient to deliver sustained real income gains.
Breaking down the components, base salaries rose 2.2% yoy, picking up from November's 1.7% yoy. Overtime pay increased 0.9%, slightly slower than the prior month's 1.2%. Special payments, largely winter bonuses, rose 2.6% up from 1.5%.
Attention now shifts firmly to the upcoming spring wage negotiations. The key questions are whether large firms can again deliver pay hikes above 5% for the third straight years, and whether those gains finally spill over to smaller companies.
Gold eyes 5,300 after surviving shakeout, but longer-term reset will take more time
After two volatile weeks, Gold appears to have regained its footing. Prices have stabilized around the 4,400 area and have since pushed back above 5,000, signalling that the first wave of profit taking has likely run its course. The sharp pullback from the record high was forceful, but the subsequent price action suggests sellers have become less aggressive, opening room for a tradable rebound in the near term.
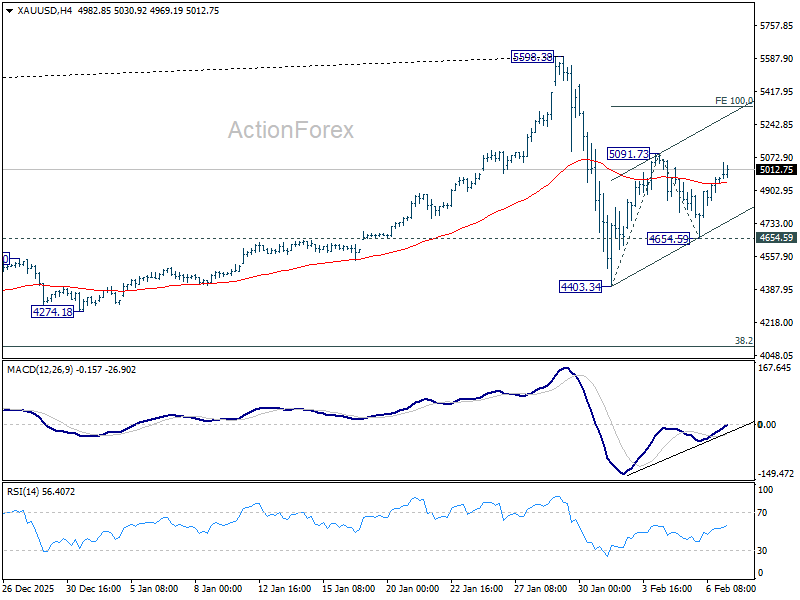
Technically, the decline from 5,598.38 to 4,403.34 is seen as the initial phase of a broader medium-term correction. That phase now appears complete. Price action since 4,403.34 marks the second phase of this corrective process, which can unfold in a more complex and time-consuming manner rather than a simple straight-line rebound.
For short-term traders, the outlook is constructive. The exhaustion of the initial profit-taking wave raises the prospect of further upside in the near term. As long as pullbacks remain contained, momentum favours additional gains before sellers re-emerge in force.
In this context, 4,654.49 serves as the key tactical line. Any near-term dip should be contained above this level. On the upside, decisive break of 5,091.73 would open the way toward 100% projection of 4,403.34 to 5,091.73 from 4,654.59 at 5,342.98. . That level is a natural target for the current rebound and represents the upper boundary of what short-term traders should reasonably expect from this phase.
However, strength into the 5,340–5,598 zone is likely to attract another round of profit taking, particularly from longer-term holders. That supply should cap near-term upside and prevent Gold from immediately resuming its larger bull trend.
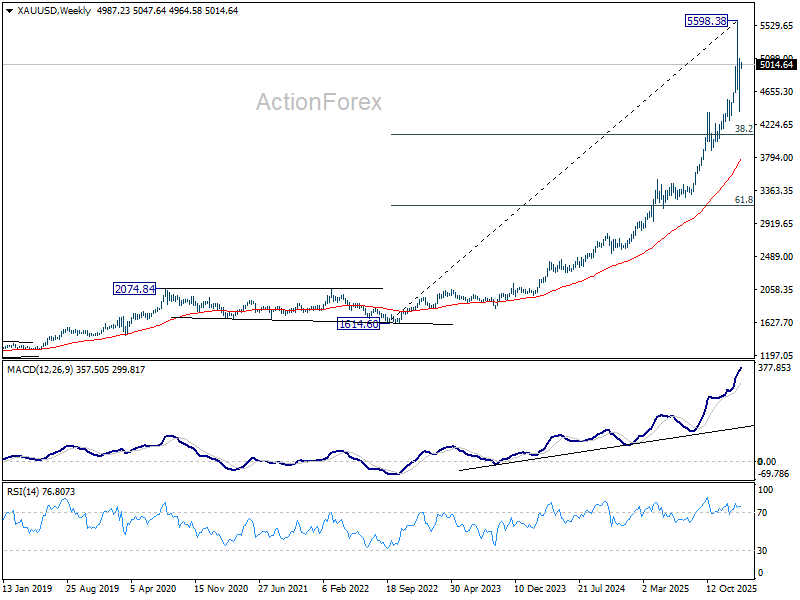
For long-term investors, patience is essential. The current rebound is not viewed as a trend resumption but as part of a broader consolidation correcting the entire advance from 1,614.50 (2022 low). While the long-term structure remains bullish, the market still needs time to absorb prior gains.
Any deeper pullback is expected to find stronger demand near the 4,000–4,400 accumulation zone, reinforced by 38.2% retracement of 1,614.60 to 5,598.38 at 4,076.57. Until fresh catalysts emerge, that area is the preferred zone for rebuilding long positions ahead of the next major uptrend, likely months rather than weeks away.
Delayed US jobs report to drive the next shift in Fed pricing
The week is set to be dominated by US economic data, with markets focused on the delayed January non-farm payroll report and January CPI. While both releases speak directly to the Fed’s mandate, it is the labor market that will ultimately shape near-term policy expectations.
The payroll report, postponed by several days due to the temporary government shutdown, arrives after a volatile stretch for risk assets. Last week’s tech-sector rout briefly lifted expectations for a March rate cut, but that shift has already begun to unwind. A hold at the March FOMC meeting remains the central scenario. The late-week recovery in equities, capped by a record close in DOW, has eased pressure on policymakers to act quickly.
Markets remain more confident about easing later in the year. The June meeting is firmly in focus, with roughly a three-in-four chance priced for a cut to the 3.25–3.50% range.
Inflation data this week will be watched closely but is unlikely to prove decisive unless it shows renewed and persistent acceleration. Fed officials have repeatedly stressed that tariff-related price pressures should be temporary, reducing the risk of overreaction to modest upside surprises.
The labor market, however, presents a different risk profile. Signs of a sharp slowdown in hiring would be harder to dismiss and could prompt renewed discussion around more insurance cuts. This imbalance sets up asymmetric market reactions, with downside surprises in jobs likely to move pricing more than upside inflation shocks.
In the UK, GDP figures will attract growing attention after the BoE's surprising dovish hold last week. Markets have become increasingly confident that a March rate cut is possible, putting incoming data under greater scrutiny. The UK economy struggled for momentum at the end of 2025, and policymakers are now assessing whether fiscal measures from the Autumn Budget have meaningfully lifted activity. The durability of any such support into early 2026 remains an open question.
With the committee deeply split, marginal data surprises could easily tip the balance ahead of the March meeting. Growth data that disappoints would reinforce the case for easing, while resilience could embolden the more cautious camp.
Beyond the US and UK, secondary releases including Eurozone Sentix confidence, Swiss CPI, and China’s inflation data will provide additional color on global demand conditions, but they are likely to play a supporting role in a week dominated by US labor market risk.
Here are some highlights for the week:
- Monday: Japan average cash earnings; Swiss SECO consumer climate; Eurozone Sentix investor confidence.
- Tuesday: Australia Westpac consumer sentiment; Australia NAB business confidence; US retail sales, import prices, employment cost index.
- Wednesday: China CPI, PPI; US non-farm payrolls; BoC deliberations.
- Thursday: Japan PPI; UK GDP, production, trade balance; US jobless claims.
- Friday: New Zealand BNZ manufacturing; New Zealand inflation expectations; Swiss CPI; Eurozone GDP revision, trade balance; US CPI.
EUR/JPY Daily Outlook
Daily Pivots: (S1) 184.76; (P) 185.28; (R1) 186.21; More...
Intraday bias in EUR/JPY stays neutral for the moment. Price actions from 186.86 are developing in to a near term consolidation pattern. On the downside, below 184.26 support will bring another fall as the third leg. But downside should be contained by 38.2% retracement of 172.24 to 186.86 at 181.27 to bring rebound. On the upside, decisive break of 186.86 will resume larger up trend.
In the bigger picture, up trend from 114.42 (2020 low) is in progress. Upside momentum has been diminishing as seen in bearish divergence condition in D MACD. But there is not clear sign of topping yet. On resumption, next target is 78.6% projection of 124.37 to 175.41 from 154.77 at 194.88 next. Meanwhile, outlook will stay bullish as long as 55 W EMA (now at 174.22) holds, even in case of deep pullback.
Gold Recovers as Bitcoin Crashes Amid High Volatility
It was a strong week for equities, with the Dow moving above 50,000 and the Nikkei 225 jumping after Sanae Takaichi secured a clear majority. Improved political clarity in Japan helped lift market sentiment.
Gold started the week lower as selling continued from the previous period of volatility. However, once market pressure eased, buyers returned and prices moved back toward the $5,000 level. Bitcoin, in contrast, had a weak week, as speculators sold following its recent poor performance, raising doubts about its role as an alternative asset.
There were few major economic data releases. U.S. employment data was delayed to this week, while U.S. manufacturing data surprised to the upside. The Bank of England and the ECB both kept interest rates unchanged, while the Australian central bank raised rates by 0.25%.
Markets This Week
U.S. Stocks
Technology stocks were under pressure, but the Dow finished the week strongly above 50,000 as investors bought large, established companies. The U.S. economy remains stronger than expected, and lower interest rates continue to support these stocks. Despite the Dow reaching record highs, the uptrend is not very strong, so short-term traders may find better opportunities in range trading. Medium-term traders may still look for higher levels and consider buying on dips. Resistance is seen at 50,500, 51,000, 51,500, and 52,000, while support is at 49,500, 48,500, and 48,000.
Japanese Stocks
Japanese stocks reacted positively to Takaichi’s victory and her party securing a majority, as markets expect continued government support for the economy and a weaker yen. In the short term, the market looks overbought, so some pullback or sideways movement is possible. However, once this consolidation is complete, the medium-term outlook remains positive as policies aimed at supporting growth are expected to continue. Resistance is seen at 59,000円, 60,000円, and 61,000円, while support is located at 55,000円, 54,000円, 53,000円, and 52,000円.
USD/JPY
USD/JPY had a strong week as traders bought the pair ahead of the expected election victory by Takaichi. Recent comments from Takaichi suggesting she is not opposed to a weaker yen supported further buying. However, the market is now trading close to recent highs, where the risk of Bank of Japan intervention increases. As a result, the pair may move sideways in the near term as gains are consolidated. Resistance is seen at 158, 159, 159.5, and 160, while support is located at 155, 154, 153, and 152.
Gold
Gold saw further stop-loss selling on Monday as panic selling continued, but prices recovered through the rest of the week as investors continued to value gold highly amid elevated geopolitical risks and concerns over government finances. Volatility remained high, with the $5,000 level acting as key resistance. Technical indicators now point to sideways movement, and with gold still up more than 10% this year, range trading may be the preferred approach in the near term. Resistance is seen at $5,050, $5,100, $5,200, $5,500, and $5,600, while support is located at $4,800, $4,650, $4,600, and $4,500.
Crude Oil
WTI crude continued to test higher levels last week but failed at resistance as tensions in Iran eased. The weekly close below the 10-day moving average suggests the recent uptrend has paused for now. As a result, the market may move lower, with prices likely to trade in the $66.50 to $60 range in the near term. Resistance is seen at $66.50, $70, and $75, while support is located at $60, $55, and $50.
Bitcoin
Bitcoin fell sharply last week as speculators sold after being disappointed with its recent performance compared to gold, leading some to question its role in the financial system. Prices rebounded quickly from the $60,000 area, as many investors still believe in Bitcoin, noting that large drops in the past have often been followed by strong gains. However, as long as Bitcoin remains below the 10-day moving average, the short-term bias remains lower. A move back above the 10-day moving average could trigger a sharp rebound. Resistance is seen at $75,000, $80,000, $85,000, and $95,000, while support is located at $65,000, $60,000, and $55,000.
This Week’s Focus
- Monday: Japan Current Account
- Tuesday: U.S. Retail Sales
- Wednesday: China CPI and PPI, U.S. Nonfarm Payrolls
- Thursday: U.K. GDP, Industrial Production and Trade Balance, U.S. Existing Homes Sales
- Friday: E.U. GDP and Trade Balance, U.S. CPI
Japanese markets are set to be in focus following the Takaichi government securing a majority, with attention turning to yen weakness and its impact on equities. In the U.S., retail sales and employment data are the key events this week and are likely to influence all major markets. Gold and Bitcoin will also be closely watched as both attempt to recover recent losses amid ongoing volatility.
Gold eyes 5,300 after surviving shakeout, but longer-term reset will take more time
After two volatile weeks, Gold appears to have regained its footing. Prices have stabilized around the 4,400 area and have since pushed back above 5,000, signalling that the first wave of profit taking has likely run its course. The sharp pullback from the record high was forceful, but the subsequent price action suggests sellers have become less aggressive, opening room for a tradable rebound in the near term.
Technically, the decline from 5,598.38 to 4,403.34 is seen as the initial phase of a broader medium-term correction. That phase now appears complete. Price action since 4,403.34 marks the second phase of this corrective process, which can unfold in a more complex and time-consuming manner rather than a simple straight-line rebound.
For short-term traders, the outlook is constructive. The exhaustion of the initial profit-taking wave raises the prospect of further upside in the near term. As long as pullbacks remain contained, momentum favours additional gains before sellers re-emerge in force.
In this context, 4,654.49 serves as the key tactical line. Any near-term dip should be contained above this level. On the upside, decisive break of 5,091.73 would open the way toward 100% projection of 4,403.34 to 5,091.73 from 4,654.59 at 5,342.98. . That level is a natural target for the current rebound and represents the upper boundary of what short-term traders should reasonably expect from this phase.
However, strength into the 5,340–5,598 zone is likely to attract another round of profit taking, particularly from longer-term holders. That supply should cap near-term upside and prevent Gold from immediately resuming its larger bull trend.
For long-term investors, patience is essential. The current rebound is not viewed as a trend resumption but as part of a broader consolidation correcting the entire advance from 1,614.50 (2022 low). While the long-term structure remains bullish, the market still needs time to absorb prior gains.
Any deeper pullback is expected to find stronger demand near the 4000–4400 accumulation zone, reinforced by 38.2% retracement of 1,614.60 to 5,598.38 at 4,076.57. Until fresh catalysts emerge, that area is the preferred zone for rebuilding long positions ahead of the next major uptrend, likely months rather than weeks away.
EUR/USD Holds Support As Traders Weigh Next Upside Push
Key Highlights
- EUR/USD dipped below 1.1900 and tested the 1.1780 support.
- It cleared a key bearish trend line with resistance at 1.1810 on the 4-hour chart.
- GBP/USD could start another increase if it climbs above 1.3720.
- Gold prices remain stable above $4,800 and might eye another increase.
EUR/USD Technical Analysis
The Euro started a fresh decline from 1.2080 against the US Dollar. EUR/USD dipped below 1.1950 and 1.1900 before the bulls appeared.
Looking at the 4-hour chart, the pair tested the 61.8% Fib retracement level of the upward move from the 1.1577 swing low to the 1.2082 high. The pair remained stable above the 100 simple moving average (red, 4-hour) and the 200 simple moving average (green, 4-hour).
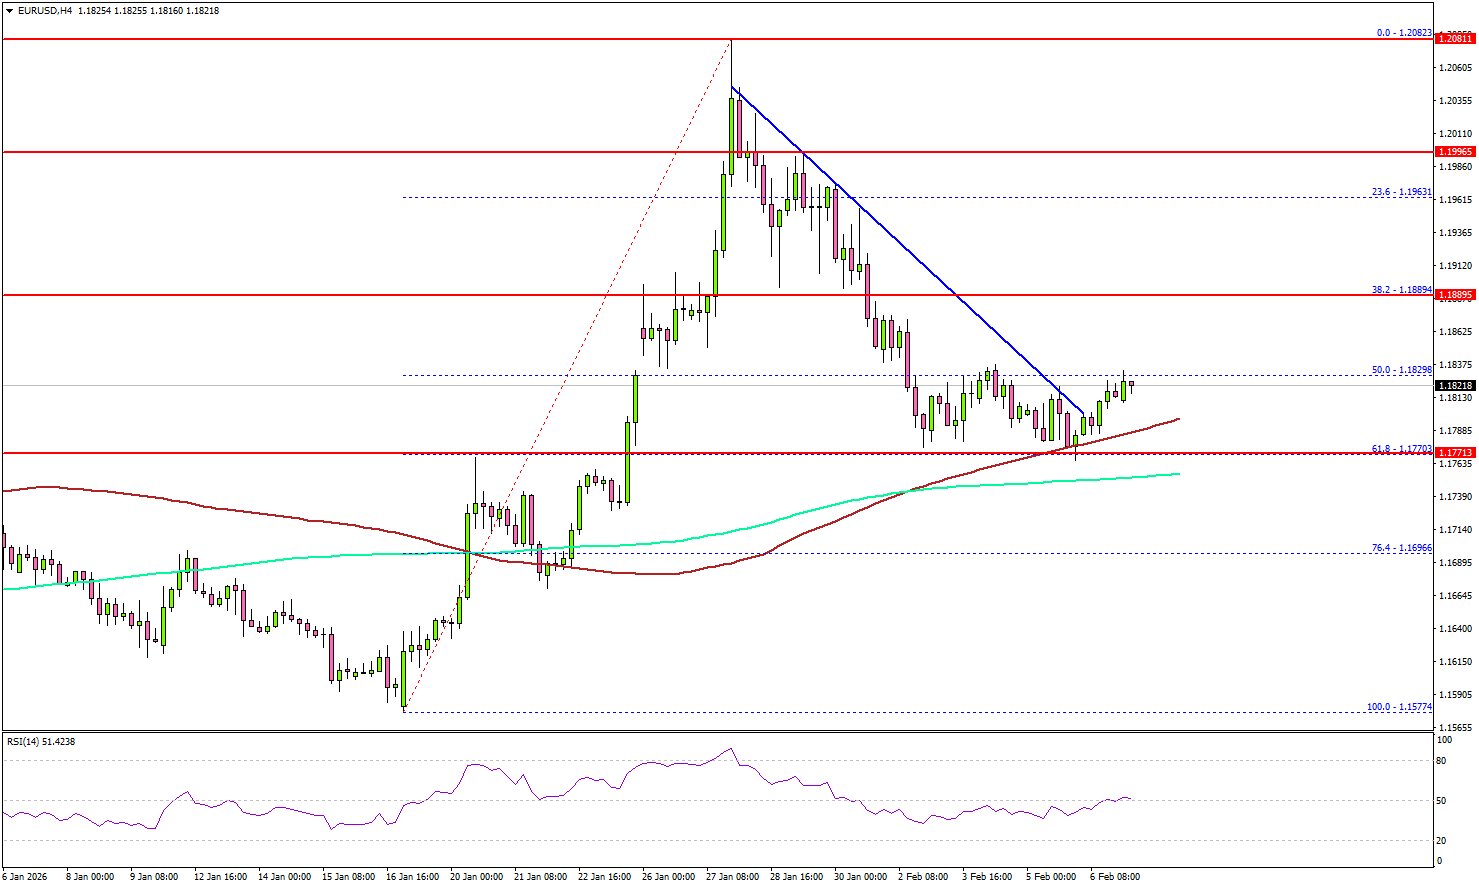
The pair is stable above 1.1780 and recently cleared a key bearish trend line with resistance at 1.1810. On the upside, the pair could face hurdles near 1.1850.
The next stop for the bulls might be 1.1890. A close above 1.1890 could open the doors for more gains. In the stated case, the bulls could aim for a move toward 1.1920. Any more gains could set the pace for a fresh move to 1.2000.
Immediate support could be 1.1780. The first major area for the bulls might be near 1.1720. The main support sits at 1.1700, below which the pair might gain bearish momentum. In the stated case, it could even revisit 1.1650.
Looking at GBP/USD, the pair is stable above 1.3500 and might soon aim for a fresh increase if it clears the 1.3720 resistance.
Upcoming Key Economic Events:
- Euro Zone Sentix Investor Confidence for Feb 2026 - Forecast -1.8, versus -1.8 previous.
Nikkei celebrates Takaichi landslide, USD/JPY faces post-election reality check
Japan enters the week riding a powerful post-election wave after equities surged to fresh record highs. Nikkei jumped above 57,000 following Prime Minister Sanae Takaichi’s historic election victory. Although the index has since retreated modestly, it is still holding on to the bulk of its gains, up nearly 4.5% on strong domestic risk appetite.
Takaichi’s win was historic in scale. Her Liberal Democratic Party captured 315 seats in the lower house, its strongest showing ever, and together with coalition partner Ishin now controls 351 seats. That gives the ruling bloc a two-thirds supermajority, allowing it to override the upper house and advance legislation with unprecedented ease.
That supermajority significantly strengthens Takaichi’s hand. It opens the door not only to aggressive fiscal measures but also to constitutional changes, while easing the path for defense spending increases amid a more challenging global environment. For equity investors, political uncertainty has collapsed, and policy execution risk has been sharply reduced.
Yen, however, has not followed equities in a straight line. USD/JPY initially jumped at the Asian open but quickly retreated. Traders remain alert to the risk of intervention should the Yen weaken too sharply, limiting follow-through on election-driven selling. This leaves currency markets in wait-and-see mode. With the election result now fully realized, the question is whether Yen selling momentum can re-emerge as focus shifts back to fiscal expansion, or whether the pair has already priced in the bulk of the political shock.
Technically, momentum is already showing signs of fatigue. USD/JPY’s 4H MACD is falling below its signal line, indicating that the rebound from 152.07 is losing steam. That move is viewed as the second leg of a broader corrective pattern from 159.44. While further gains remain possible as long as 155.51 holds, strong resistance is expected near 159.44 high. A clear break below 155.51 would argue that the third leg of the correction is already underway, reopening the path back toward the 152.07 support ahead.
Japan’s nominal pay accelerates to 2.4% in December, but real wages still negative
Japan’s real wages fell -0.1% yoy in December, marking the 12th consecutive monthly decline, though the contraction was the smallest seen in 2025. While the pace of erosion is clearly slowing, the data underline how inflation continues to outpace pay gains for households.
Nominal wages rose 2.4% yoy, extending a 48-month streak of increases, but the outcome fell short of expectations for a 3.0% rise. The acceleration from November’s 1.7% growth points to improving momentum, but not yet at a pace sufficient to deliver sustained real income gains.
Breaking down the components, base salaries rose 2.2% yoy, picking up from November's 1.7% yoy. Overtime pay increased 0.9%, slightly slower than the prior month's 1.2%. Special payments, largely winter bonuses, rose 2.6% up from 1.5%.
Attention now shifts firmly to the upcoming spring wage negotiations. The key questions are whether large firms can again deliver pay hikes above 5% for the third straight years, and whether those gains finally spill over to smaller companies.
Eco Data 2/9/26
| GMT | Ccy | Events | Act | Cons | Prev | Rev |
|---|---|---|---|---|---|---|
| 23:30 | JPY | Labor Cash Earnings Y/Y Dec | 2.40% | 3.00% | 1.70% | |
| 23:50 | JPY | Current Account (JPY) Dec | 2.70T | 2.95T | 3.14T | |
| 05:00 | JPY | Eco Watchers Survey: Current Jan | 47.6 | 49.1 | 48.6 | |
| 08:00 | CHF | SECO Consumer Climate Q1 | -30 | -30 | -31 | |
| 09:30 | EUR | Eurozone Sentix Investor Confidence Feb | 4.2 | -0.2 | -1.8 |
| 23:30 | JPY |
| Labor Cash Earnings Y/Y Dec | |
| Actual | 2.40% |
| Consensus | 3.00% |
| Previous | 1.70% |
| 23:50 | JPY |
| Current Account (JPY) Dec | |
| Actual | 2.70T |
| Consensus | 2.95T |
| Previous | 3.14T |
| 05:00 | JPY |
| Eco Watchers Survey: Current Jan | |
| Actual | 47.6 |
| Consensus | 49.1 |
| Previous | 48.6 |
| 08:00 | CHF |
| SECO Consumer Climate Q1 | |
| Actual | -30 |
| Consensus | -30 |
| Previous | -31 |
| 09:30 | EUR |
| Eurozone Sentix Investor Confidence Feb | |
| Actual | 4.2 |
| Consensus | -0.2 |
| Previous | -1.8 |
AI Anxiety Shakes Markets, But Doesn’t Break Them; Dollar Rebound Might Fade
After days dominated by fears of an intensified tech rout and structural disruption from artificial intelligence, markets ended the week on a steadier footing. While volatility picked up meaningfully, Friday’s price action made clear that talk of an imminent trend reversal remains premature. Investors responded to midweek stress not by abandoning equities wholesale, but by rotating and selectively re-engaging. Sharp rebounds in some of the hardest-hit names underscored that confidence in long-term growth themes has weakened, but not collapsed.
This behavior reflects a maturing bull market rather than a broken one. As the cycle moves deeper into its later stages, investors are becoming more opportunistic and less complacent, choosing their entry points carefully instead of reflexively buying every dip. Such a shift almost inevitably brings more choppy conditions. Markets are now more sensitive to narratives, earnings expectations, and policy signals, which increases short-term volatility even as longer-term trends remain broadly intact.
Across asset classes, this has translated into consolidation rather than continuation. Big moves earlier in the week were followed by hesitation, suggesting participants are reassessing risk rather than repositioning aggressively. In that sense, the message from last week is clear that volatility is rising, leadership is narrowing, but the broader market structure still argues for caution against calling an outright top too early.
Currency markets reflected this selective risk adjustment. Aussie ended the week as the strongest performer, supported by the RBA’s hawkish turn, while the Dollar held firm amid bouts of risk aversion. Kiwi also outperformed on improved sentiment into the close. At the other end, Yen was the weakest major as election positioning and fading intervention risk weighed, with Sterling also under pressure after the BoE’s dovish hold. Euro and Swiss franc traded more neutrally.
US Stocks Hold Their Nerve Despite Tech Turbulence
After spending much of last week fixated on AI disruption risks and the threat of an intensified tech rout, Friday’s performance in US equities delivered an important counterpoint. Price action suggested that markets are not ready to abandon the broader uptrend, even as volatility rises and leadership narrows.
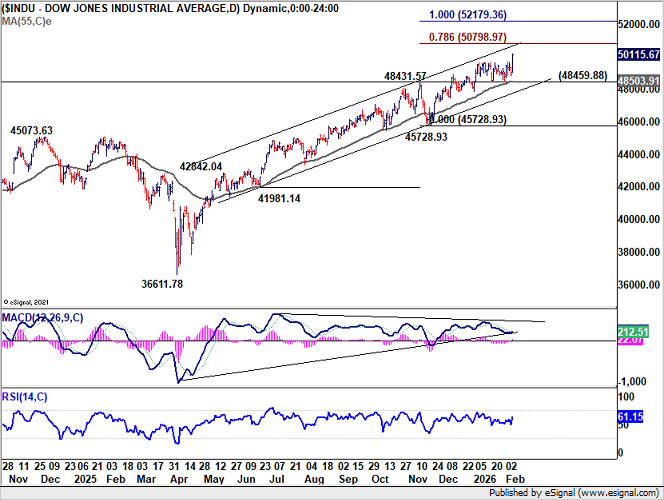
The standout move came from DOW, which surged nearly 2.5% on Friday to close above the 50,000 psychological level for the first time, and set a fresh record. The S&P 500 and NASDAQ both finished the week in the red. However, the sharp intraweek selloff now looks more like part of a near-term consolidation phase rather than the start of a broader trend reversal.
Crucially, Friday’s rebound within the tech sector itself challenges the bearish narrative. Some of the week’s hardest-hit names staged decisive recoveries, suggesting that positioning had become stretched rather than structurally broken. Nvidia jumped nearly 8% on Friday, while Broadcom rallied around 7%, both following steep declines earlier in the week. That behavior signals that investors have not meaningfully given up on the AI investment theme.
Instead, it appears markets are reassessing valuation, timing, and earnings delivery rather than rejecting the growth story outright. AI remains central to medium-term expectations, but the tolerance for disappointment has clearly diminished.
Some analysts have described the current environment as a bull market that is aging rather than dying. As this cycle moves into its fourth year, earnings expectations are rising and becoming more demanding, leaving less room for error. That shift naturally changes investor behavior Pullbacks are increasingly being viewed as opportunities, but not automatic ones. Investors are becoming more selective about where and when to add exposure.
Technically, DOW's up trend is now eye next hurdle at 78.6% projection of 41,981.14 to 48,431.57 from 45,728.93 at 50,798.97 and close to medium-term rising channel ceiling. Decisive break above that zone would suggest the uptrend is entering a new phase of acceleration, opening the way toward the 100% projection at 52,179.36. Until then, the broader bullish outlook remains intact as long as 48,459.88 support holds on any pullback.
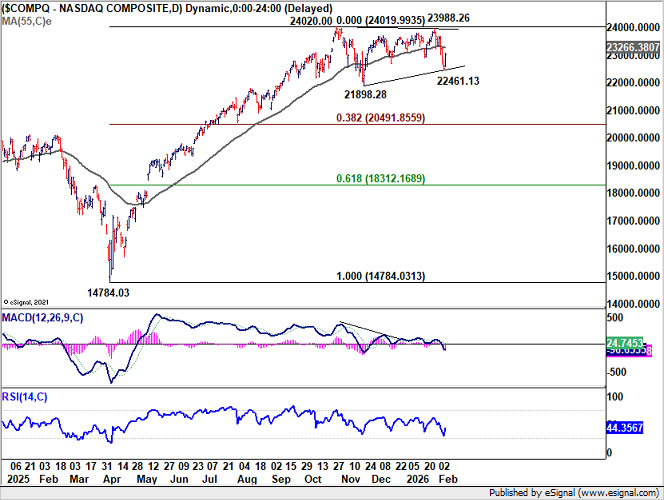
For NASDAQ, the corrective pattern from 24,020.00 remains in play. Rather than a straight decline through 21,898 support, Friday's bounce suggests that it's in for of a sideway pattern. The flat 55 D EMA (now at 23,266.38) is a focus in the coming days. Firm break there will affirm this case of sideway consolidations, and bring retest of 24,020.00 high. In this case, there is prospect of breaking through to new record if sentiment in other parts of the markets turn more positive.
Dollar Index to Face Test from 55 D EMA as Rebound Extends
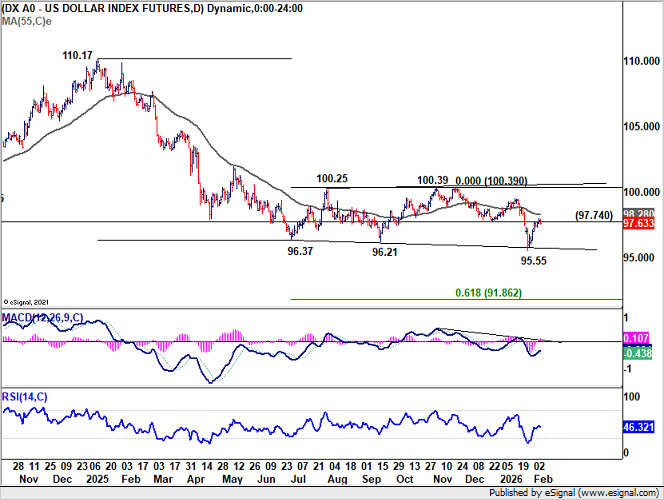
Dollar Index extended the rebound from 95.55 last week, and breached 97.74 support turned resistance.
Relief surrounding the nomination of Kevin Warsh as the next Fed chair helped calm nerves. In the near term, the development reduced tail risks and lent Dollar some stability. Risk-off sentiment also played a role, particularly as US equities wobbled midweek on renewed tech-sector stress. That environment briefly favored Dollar.
However, as equity markets stabilized into Friday, the dollar’s upside momentum slowed. A more constructive risk backdrop could quickly turn the recent rebound into nothing more than a corrective pause in the larger down trend.
Technically, Dollar Index is approaching a critical decision zone. In the more bearish scenario, 55 D EMA (now at 98.28) should act as a key barrier to reject the current rise. That would set up downtrend resumption through 95.55 quickly. Next target will be 61.8% projection of 110.17 to 96.37 from 100.39 at 91.86.
Alternatively, in the less bearish case, sustained break above 55 D EMA would suggest that corrective pattern from 96.37 is developing into a five wave expanding triangle. In this case, stronger rebound could be seen towards 100.39 first, before seeing strong resistance from there to cap upside and bring larger down trend resumption through 95.55 later.
RBA Hawkish Turn Meets Yen Weakness as AUD/JPY Hits Record
In the currency markets last week, Aussie clearly stood out as the strongest performer, while Yen sank to the bottom of the table. That divergence made AUD/JPY the top mover of the week, with the cross gaining more 2.34% and pushing decisively into record territory.
Support for the Aussie came from the RBA, which delivered a decisively hawkish rate hike. The move to lift the cash rate to 3.85% confirmed that the RBA has shifted back into inflation-fighting mode after evidence of renewed price pressures late last year. Crucially, the RBA’s messaging suggested the tightening cycle may not be finished. Stronger consumption, a still-tight labour market, and capacity constraints have all raised the risk that inflation could remain above target for longer than previously assumed.
Some economists have already moved ahead of the curve. Analysts at Westpac, among others, now expect another rate hike in May, taking the cash rate to 4.10%. That repricing of the policy path has given the Aussie a durable yield advantage.
Risk-off sentiment during the middle of the week briefly capped the Australian Dollar’s upside. However, as broader market conditions stabilized into the close, the underlying rate support reasserted itself, leaving the Aussie well positioned for further gains if risk appetite improves ahead.
On the other side of the cross, Yen’s weakness has re-emerged as intervention risks faded. Talk of coordinated action between Japan and the US has cooled, removing a key deterrent that had previously limited speculative pressure on the currency.
Election positioning has compounded that pressure. Markets are increasingly confident for a strong outcome for Prime Minister Sanae Takaichi and, more importantly, the ruling Liberal Democratic Party in this weekend’s snap election, reinforcing expectations of fiscal expansion and looser financial conditions.
Takaichi’s standing received a further boost after US President Donald Trump offered what he described as his “total endorsement,” alongside confirmation of a White House meeting scheduled for March 19. That endorsement has strengthened perceptions of political stability and external support.
Polls suggest the LDP and its coalition partner Ishin could secure around 300 seats in the 465-seat lower house, a decisive improvement from their current razor-thin majority. Such an outcome would embolden fiscal stimulus plans and add further pressure to Japanese government bonds and Yen.
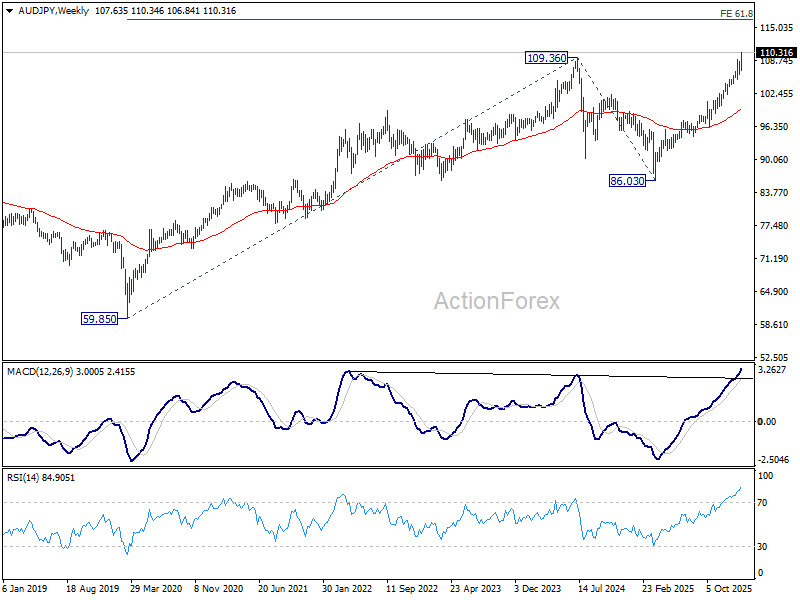
Against that backdrop, AUD/JPY surged to a fresh record high, closing the week at 110.31. Technically, D MACD point to renewed upside acceleration. Near term outlook will stay bullish as long as 106.84 support holds. Next target is 261.8% projection of 94.38 to 100.93 from 96.24 at 113.38.
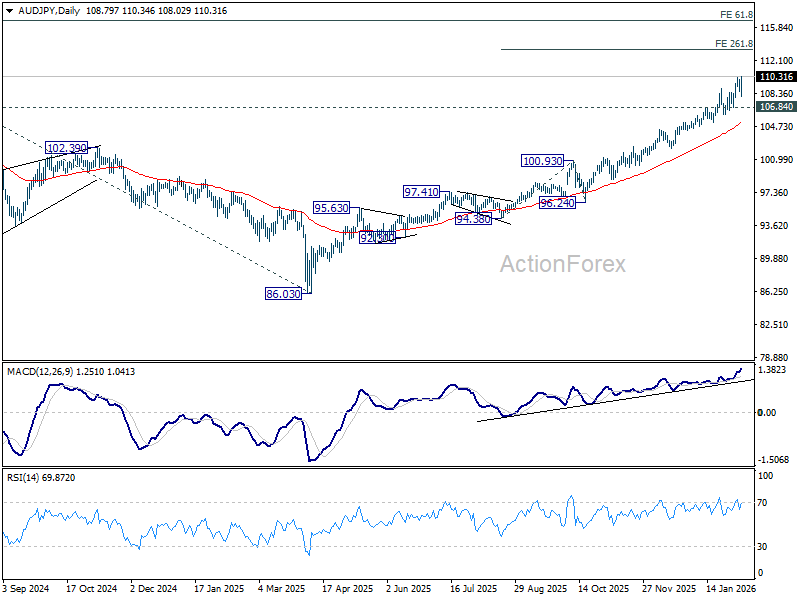
Looking further out, the medium-term technical roadmap points to a more ambitious target at 61.8% projection of 59.85 (2020 low) to 109.36 (2024 high) from 86.03 (2025 low) at 116.62.
EUR/GBP Bounces After Dovish BoE, But Faces Both Heavy Support and Resistance
EUR/GBP ended last week on a firmer footing after bouncing sharply from a key technical support area. The move disrupted bearish momentum but stopped short of delivering a decisive bullish signal, leaving the cross trapped in a mixed picture.
On the Euro side, there was little in the latest ECB meeting to justify a sustained rally. The ECB left the deposit rate unchanged at 2.00% and reiterated that policy is appropriately calibrated, with no appetite for near-term adjustments. ECB officials remain comfortable with a prolonged pause. Despite softer near-term inflation readings, policymakers continue to view medium-term price dynamics as stable, allowing them to resist pressure for either easing or tightening.
Instead, the real catalyst for EUR/GBP came from the UK side. The BoE delivered a surprise dovish hold at 3.75%, with a narrow 5–4 vote that sharply raised the perceived probability of a March rate cut.
The BoE’s updated economic outlook reinforced that dovish shift. Under the new projections, CPI inflation is expected to fall to 1.7% by the first quarter of 2027, down from 2.2% previously. Annual GDP growth has been revised 0.3 percentage points lower to 1.2%.
Even so, the timing of the next cut remains highly data-dependent. With two labor market reports and two inflation prints due before the March meeting, the MPC still has scope to reassess if incoming data surprise meaningfully.
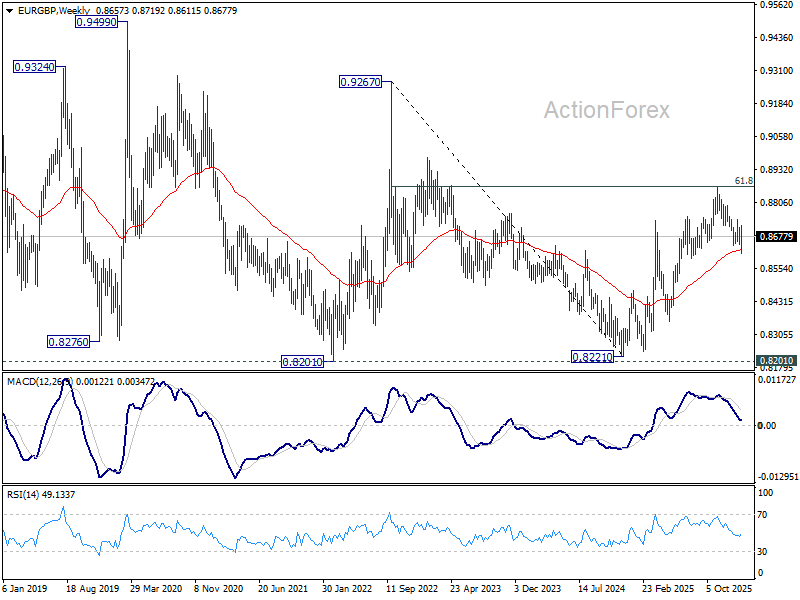
Technically, EUR/GBP is boxed in a tightly contested zone. On the upside, it's facing resistance from 61.8% retracement of 0.9267 (2022 high) to 0.8221 (2024 low) at 0.8867, a level that previously capped advances. On the downside, support is provided by rising 55 W EMA (now at 0.8624) and 38.2% retracement of 0.8221 to 0.8663 at 0.8618. These opposing forces are compressing price action and setting the stage for a directional break.
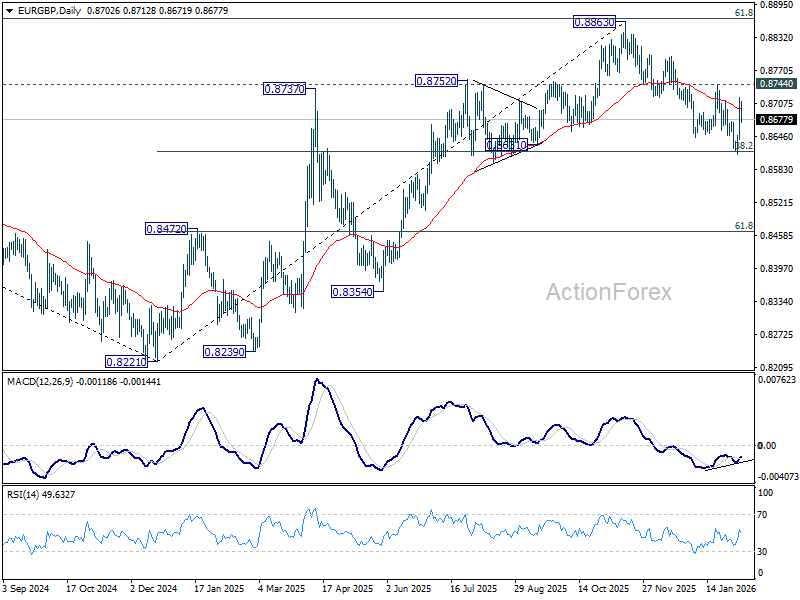
These countervailing forces have turned the current zone into a battleground. Nevertheless, break of 0.8744 resistance in the coming days would reveal that the bulls are having more underlying control. That would suggest that fall from 0.8863 has probably completed as a corrective move. And then set up the stage for resuming the rise from 0.8221 through 0.8867 key fibonacci level mentioned.
USD/CAD Weekly Outlook
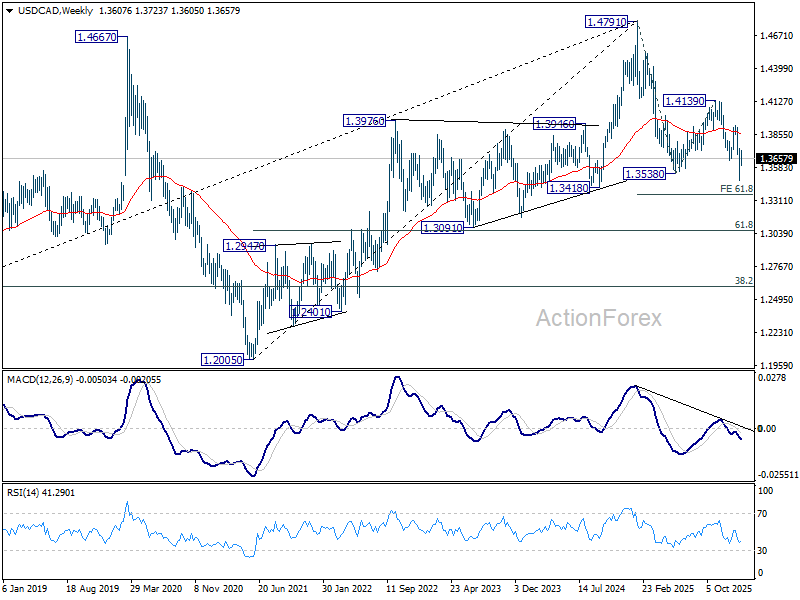
USD/CAD's rebound from 1.3480 short term bottom extended higher last week but lost momentum after hitting 1.3723. Initial bias is turned neutral this week first. In case of another rise, upside should be limited by 55 D EMA (now at 1.3791) to complete the corrective bounce. On the downside, break of 1.3625 will bring retest of 1.3480. Firm break there will resume larger down trend from 1.4791 to 61.8% projection of 1.4791 to 1.3538 from 1.4139 at 1.3365.
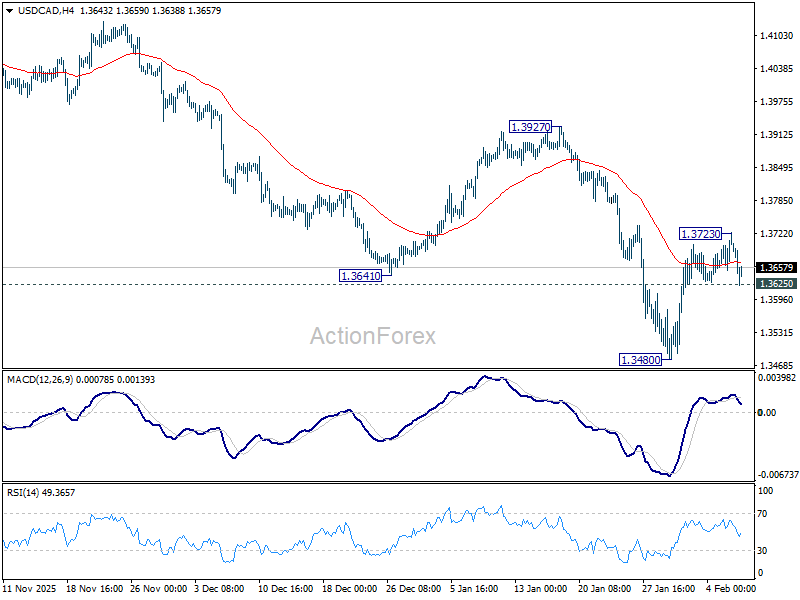
In the bigger picture, price actions from 1.4791 are seen as a corrective pattern to the whole up trend from 1.2005 (2021 low). Deeper fall could be seen as the pattern extends, to 61.8% retracement of 1.2005 to 1.4791 at 1.3069. For now, medium term outlook will be neutral at best, until there are signs that the correction has completed, or that a bearish trend reversal is confirmed.

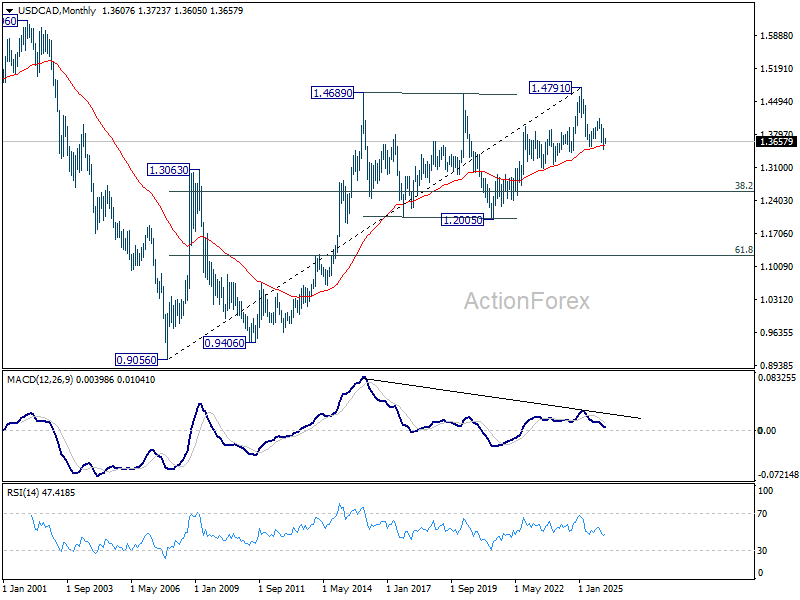
In the long term picture, rising 55 M EMA (now at 1.3569) remains intact. Thus, up trend from 0.9056 (2007 low) should still be in progress. However, considering bearish divergence condition M MACD, sustained trading below 55 M EMA will argue that the up trend has completed with five waves up to 1.4791, and turn medium term outlook bearish for correction to 38.2% retracement of 0.9056 to 1.4791 at 1.2600.