

Sample Category Title
USD/CHF Mid-Day Outlook
Daily Pivots: (S1) 0.9727; (P) 0.9762; (R1) 0.9803; More...
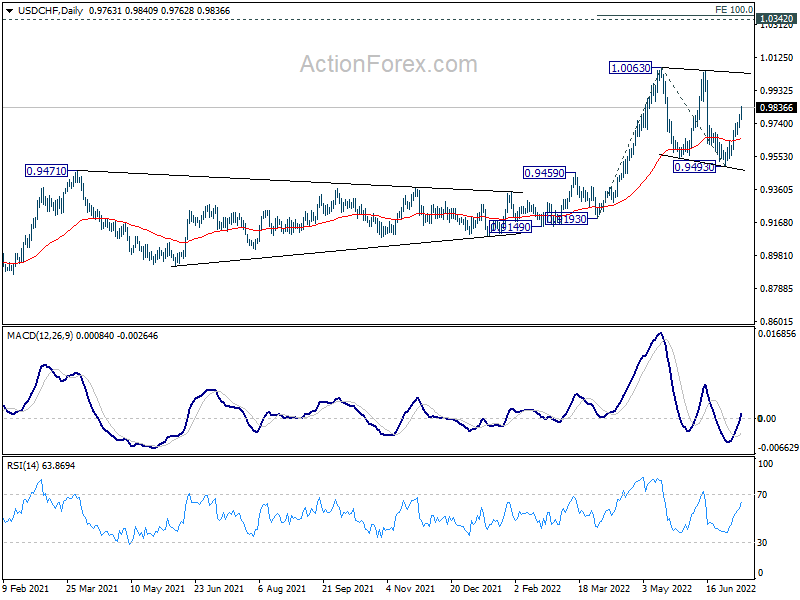
Intraday bias in USD/CHF stays on the upside for the moment. Consolidation pattern from 1.0063 should have completed with three waves down to 0.9493 already. Further rally would be seen to retest 1.0063 high first. Decisive break there will resume larger up trend. On the downside, break of 0.9670 minor support will dampen this bullish view and turn intraday bias neutral first.
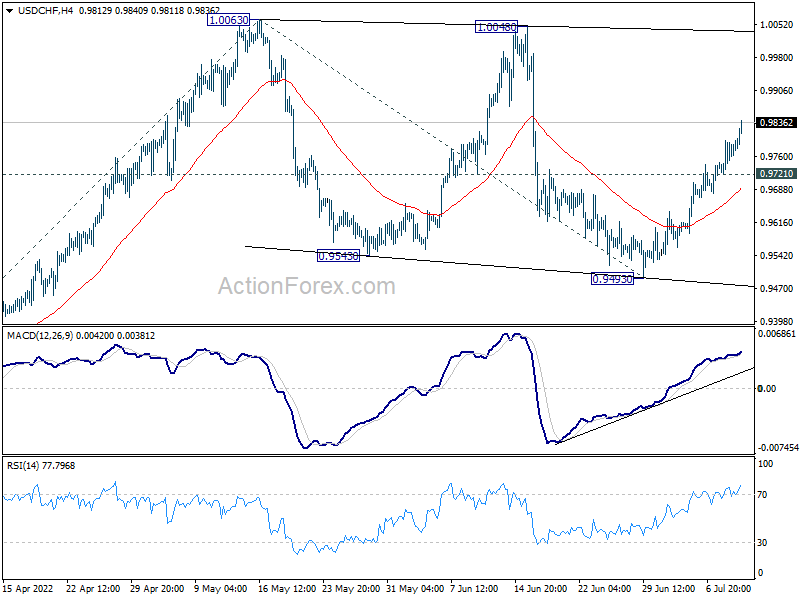
In the bigger picture, medium term up trend from 0.8756 (2021 low) is still in progress. Next target is 1.0342 (2016 high). Sustained break there will resume long term up trend from 0.7065 (2011 low). This will remain the favored case as long as 0.9471 resistance turned support holds.
USD/JPY Mid-Day Outlook
Daily Pivots: (S1) 135.42; (P) 136.00; (R1) 136.66; More...
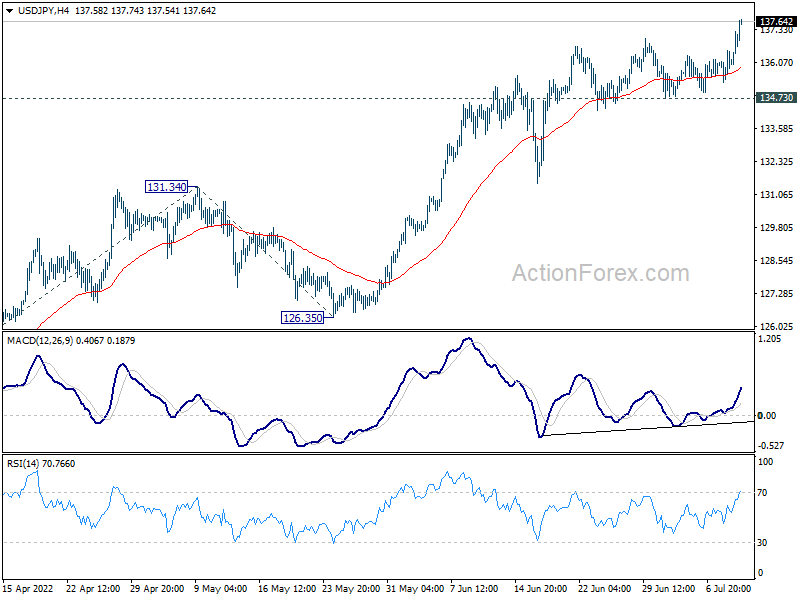
Intraday bias in USD/JPY stays on the upside for the moment. Current up trend should target 100% projection of 114.40 to 131.34 from 126.35 at 143.29. For now, outlook will remain bullish as long as 134.73 support holds, in case of retreat.
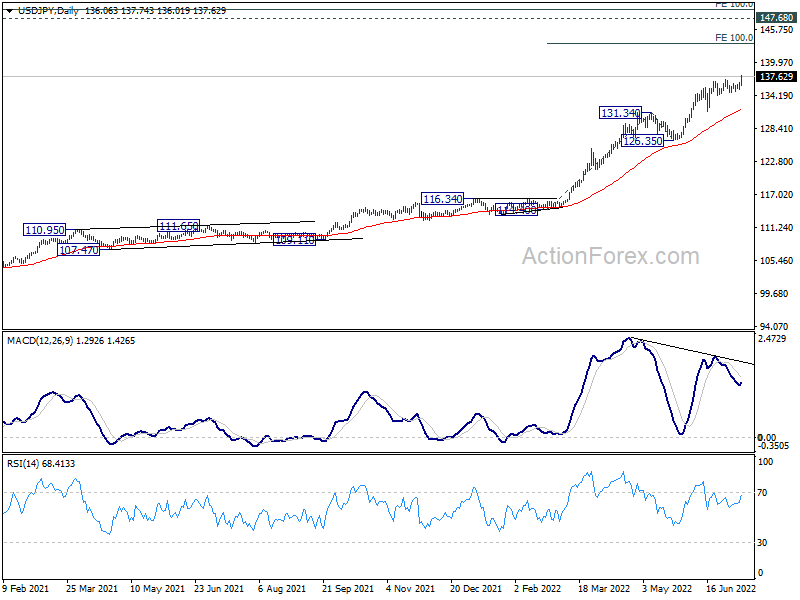
In the bigger picture, current rally is seen as part of the long term up trend from 75.56 (2011 low). Next target is 100% projection of 75.56 (2011 low) to 125.85 (2015 high) from 98.97 at 149.26, which is close to 147.68 (1998 high). This will remain the favored case as long as 126.35 support holds.
AUD/USD Mid-Day Report
Daily Pivots: (S1) 0.6809; (P) 0.6842; (R1) 0.6891; More...
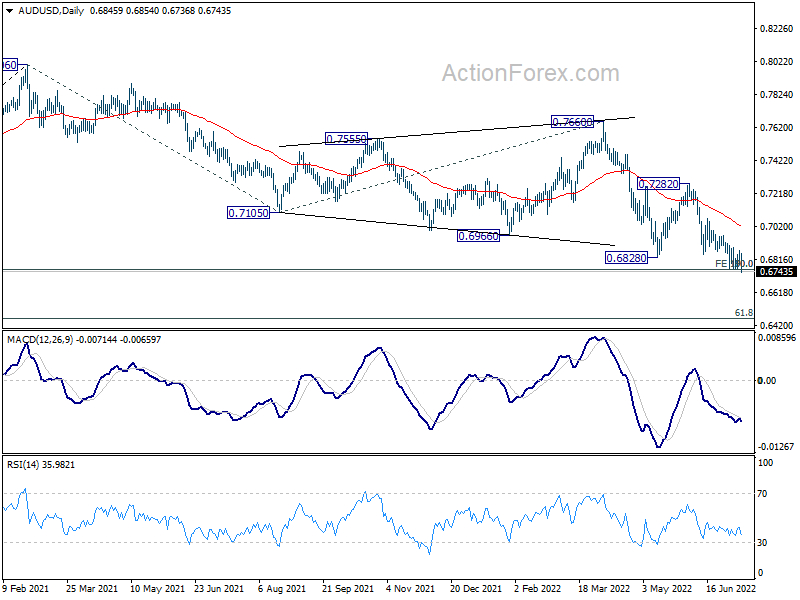
AUD/USD's down trend resumes by breaking through 0.6762 temporary low and intraday bias is back on the downside. Sustained trading below 0.6756/60 will carry larger bearish implication. Next target will be 0.6461 fibonacci level. On the upside, though, break of 0.6873 resistance will indicate short term bottoming, and turn bias back to the upside for stronger rebound.
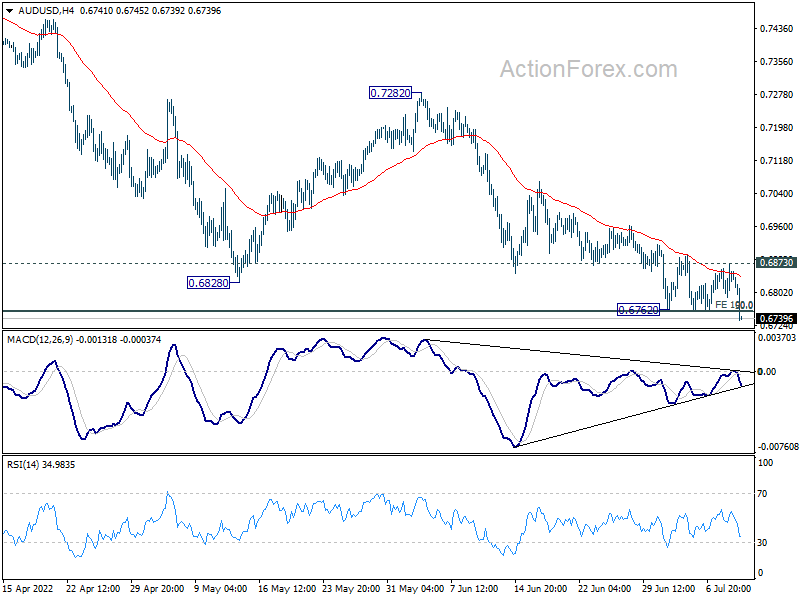
In the bigger picture, price actions from 0.8006 could still be a corrective pattern to rise from 0.5506 (2020 low). But current downside acceleration is raising the chance that it's a bearish impulsive move. Sustained trading below 0.6756/60 ( 50% retracement of 0.5506 to 0.8006 at 0.6756, 100% projection of 0.8006 to 0.7105 from 0.7660 at 0.6760), will pave the way to 61.8% retracement at 0.6461). For now, outlook will remain bearish as long as 0.7282 resistance holds, even in case of strong rebound.
Dollar Rally Accelerating, More Upside Breakouts?
Dollar's rally is accelerating as markets enter into US session. Swiss Franc and Canadian are following the greenback. But Australian Dollar is the worst, together with New Zealand Dollar. But Yen is also weak, with little help from risk off sentiment. Euro is mixed even though a market inflation gauge, the five-year, five-year forward inflation swap, fell below 2% target of ECB for the first time since March.
Technically, following upside break out in USD/JPY earlier today, AUD/USD also breaks through 0.6762 low. Attention will now be on other Dollar pairs to confirm buying. Levels to watch include 1.0700 in EUR/USD, 1.1874 in GBP/USD and 1.3082 in USD/CAD. Break of these levels will confirm underlying momentum in the greenback.
In Europe, at the time of writing, FTSE is down -0.40%. DAX is down -0.98%. CAC is down -0.78%. Germany 10-year yield is down -0.0764 at 1.270. Earlier in Asia, Nikkei rose 1.1%. Hong Kong HSI dropped -2.77%. China Shanghai SSE dropped -1.27%. Singapore Strait Times rose 0.06%. Japan 10-year JGB yield dropped -0.0011 to 0.250.
No rebound in Gold and Silver, risks heavily on the downside
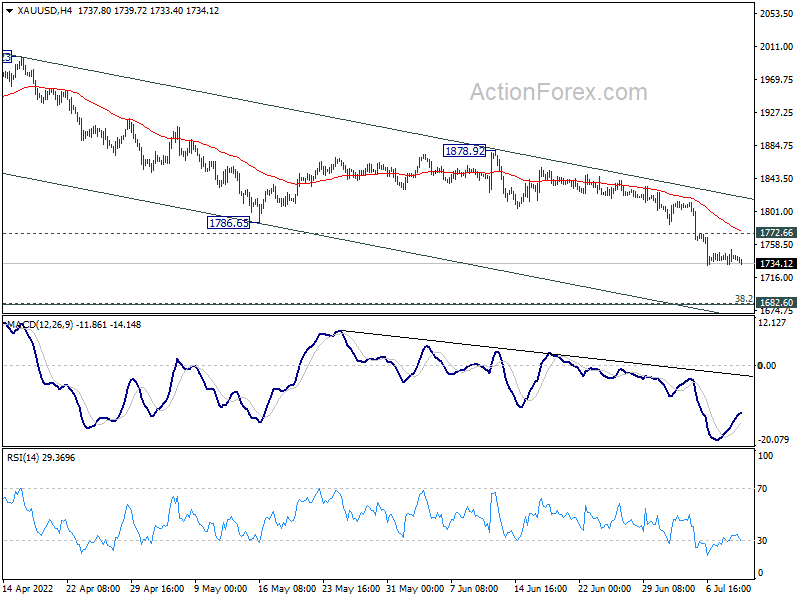
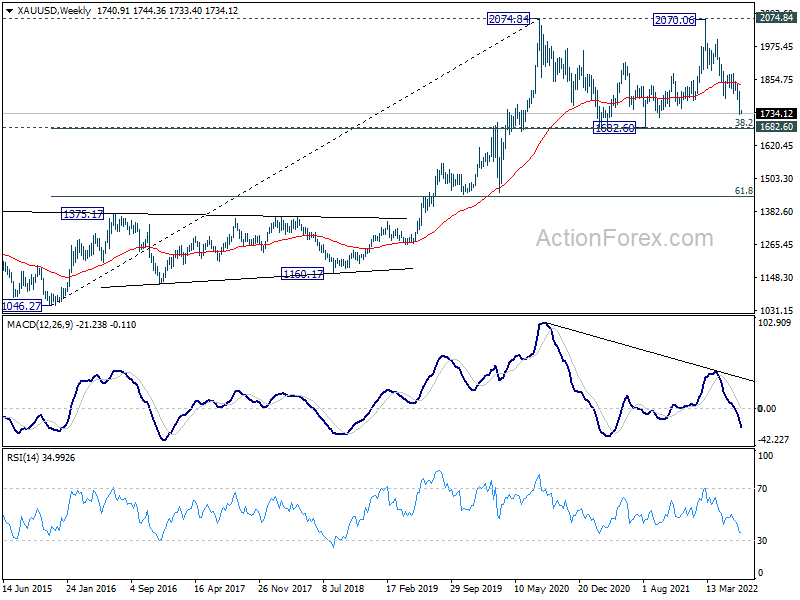
Both Gold and Silver turned into sideway trading after steep selloff last week, on the back on stronger Dollar and weak commodity prices in general. There is no sign of a sustainable bounce in both and they're vulnerable to another selloff soon.
For gold, risk will stay heavily on the downside as long as 1772.66 minor resistance holds. Current decline from 2070.06 is seen as the third leg of the sideway pattern from 2074.84 (2020 high). Further fall is likely towards 1682.60 support, which is close to 38.2% retracement of 1046.27 (2015 low) to 2074.84 at 1681.92. Strong support should be seen there to bring rebound.
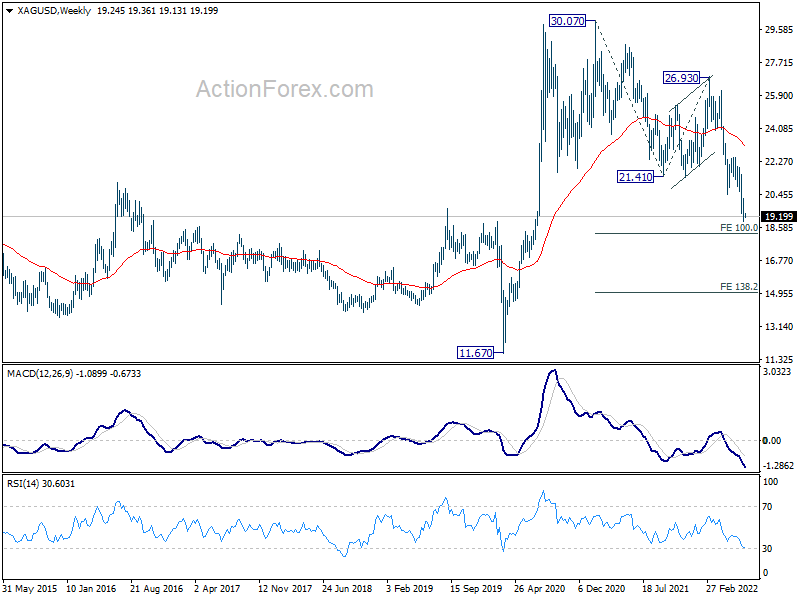
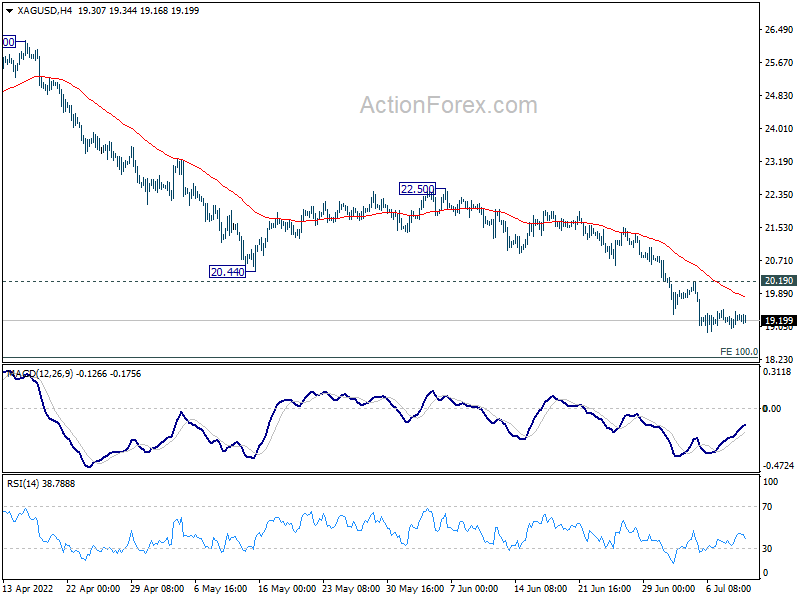
 Similarly, risk stays heavily on the downside in Silver as long as 20.19 minor resistance holds. Current down trend from 30.07 (2021 high) should target 100% projection of 30.07 to 21.41 from 26.93 at 18.27. Some support could be seen there to bring rebound. But sustained break there will pave the way to 138.2% projection at 14.96.
BoJ Kuroda: We won't hesitate to take additional monetary easing steps as necessary
BoJ Governor Haruhiko Kuroda warned of the "very high uncertainty" on economic outlook due to surging commodity prices. While the economy is showing some signs of weakness, overall it's still picking up as a trend.
"We won't hesitate to take additional monetary easing steps as necessary," he added, repeating that short- and long-term interest rate targets to "move at current or lower levels."
Released from Japan, M2 rose 3.3% yoy in June versus expectation of 3.4% yoy. Machine orders dropped -5.6% mom in May, versus expectation of -5.5% mom.
AUD/USD Mid-Day Report
Daily Pivots: (S1) 0.6809; (P) 0.6842; (R1) 0.6891; More...
AUD/USD's down trend resumes by breaking through 0.6762 temporary low and intraday bias is back on the downside. Sustained trading below 0.6756/60 will carry larger bearish implication. Next target will be 0.6461 fibonacci level. On the upside, though, break of 0.6873 resistance will indicate short term bottoming, and turn bias back to the upside for stronger rebound.
In the bigger picture, price actions from 0.8006 could still be a corrective pattern to rise from 0.5506 (2020 low). But current downside acceleration is raising the chance that it's a bearish impulsive move. Sustained trading below 0.6756/60 ( 50% retracement of 0.5506 to 0.8006 at 0.6756, 100% projection of 0.8006 to 0.7105 from 0.7660 at 0.6760), will pave the way to 61.8% retracement at 0.6461). For now, outlook will remain bearish as long as 0.7282 resistance holds, even in case of strong rebound.
Economic Indicators Update
| GMT | Ccy | Events | Actual | Forecast | Previous | Revised |
|---|---|---|---|---|---|---|
| 23:50 | JPY | Money Supply M2+CD Y/Y Jun | 3.30% | 3.40% | 3.20% | 3.10% |
| 23:50 | JPY | Machinery Orders M/M May | -5.60% | -5.50% | 10.80% | |
| 06:00 | JPY | Machine Tool Orders Y/Y Jun P | 17.10% | 23.70% | ||
| 08:00 | EUR | Italy Retail Sales M/M May | 1.90% | 0.70% | 0.00% |
No rebound in Gold and Silver, risks heavily on the downside
Both Gold and Silver turned into sideway trading after steep selloff last week, on the back on stronger Dollar and weak commodity prices in general. There is no sign of a sustainable bounce in both and they're vulnerable to another selloff soon.
For gold, risk will stay heavily on the downside as long as 1772.66 minor resistance holds. Current decline from 2070.06 is seen as the third leg of the sideway pattern from 2074.84 (2020 high). Further fall is likely towards 1682.60 support, which is close to 38.2% retracement of 1046.27 (2015 low) to 2074.84 at 1681.92. Strong support should be seen there to bring rebound.
Similarly, risk stays heavily on the downside in Silver as long as 20.19 minor resistance holds. Current down trend from 30.07 (2021 high) should target 100% projection of 30.07 to 21.41 from 26.93 at 18.27. Some support could be seen there to bring rebound. But sustained break there will pave the way to 138.2% projection at 14.96.
EURUSD Aims for Parity as Oversold Signals Not Convincing
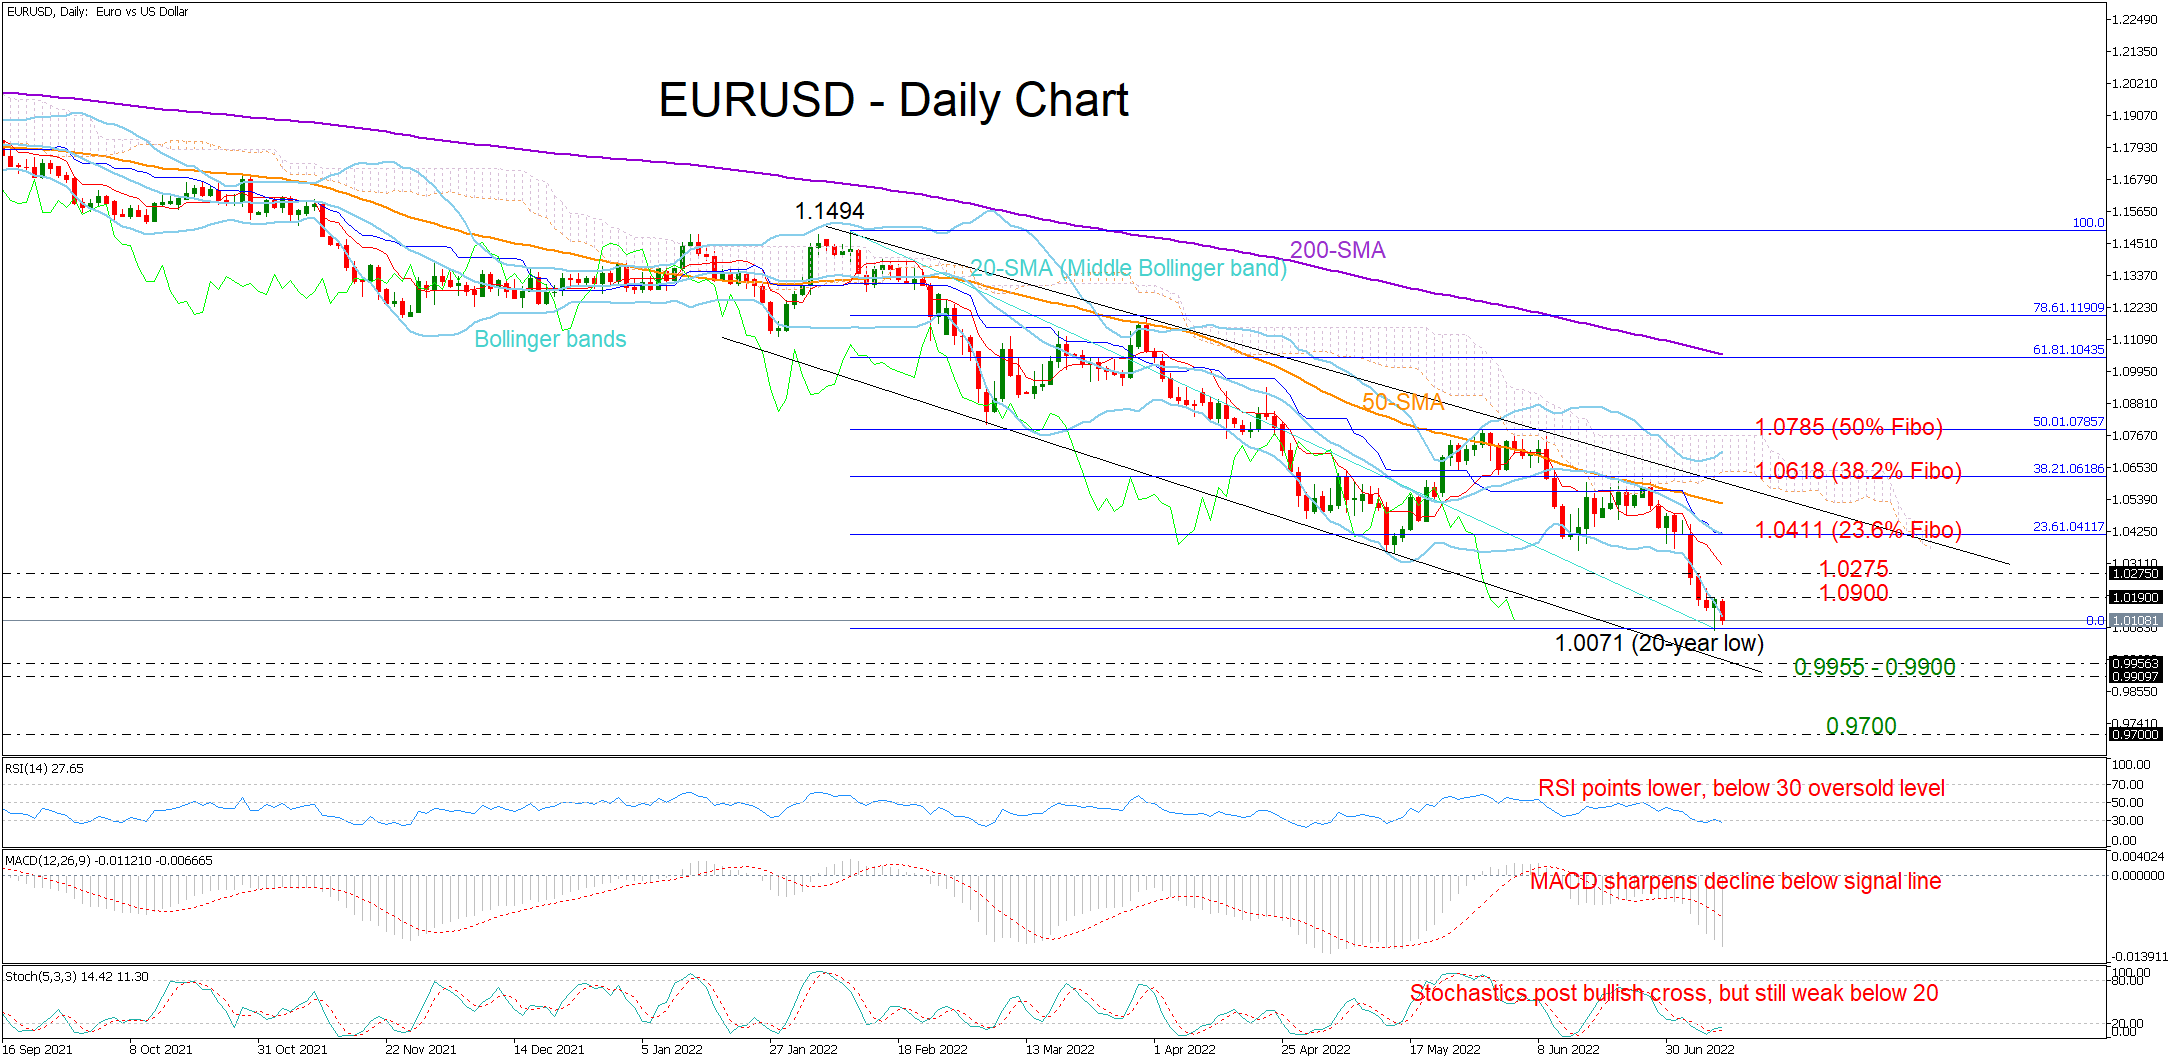
EURUSD bears returned on Monday to fight for parity after taking a quick break on Friday, which helped the price close mildly positive. The pair has also charted a bullish hammer candlestick around its 20-year low of 1.0071 in the same day, though the encouraging formation is currently getting under scrutiny.
Oversold conditions are evident as the price has been testing the lower Bollinger band for a couple of sessions now. The RSI and the Stochastics are also reflecting an overstretched decline, as they keep fluctuating below their 30 and 20 levels accordingly. That said, neither of those indicators is showing any convincing signs for a bullish reversal, suggesting that a rebound in the price could take place somewhere lower.
Given the above discouraging signals and the negative trajectory in the simple moving average (SMAs), parity will be in sight in the short term if downside forces persist below the 1999 – 2002 constraining zone of 1.0133. Failure to rotate here could bring the tentative support line seen at 0.9955 and the 0.9900 psychological mark next on the radar, while even lower, the bears may push towards the 0.9700 base last seen during the second half of 2002.
On the upside, the bulls will need to reclaim the area between 1.0190 and 1.0275, where the constraining red Tenkan-sen line is also converging, to reach the 20-day simple moving average (SMA) and the 23.6% Fibonacci retracement of the 1.1494 – 1.0071 downleg at 1.0411. Above that, the spotlight will fall on the tough resistance trendline seen at 1.0585 and the 38.2% Fibonacci of 1.0618. Notably, the price will also meet the lower boundary of the Ichimoku cloud within the same region, which has been stubbornly blocking the way higher since the end of May. Beyond that, the recovery could stabilize around the surface of the cloud and the 50% Fibonacci of 1.0785.
All in all, the technical picture foresees more weakness for EURUSD in the short term, which is expected to result in parity, especially if the price fails to bounce above 1.01900 and closes below 1.0133 instead.
NZ Dollar Slides, RBNZ in Spotlight
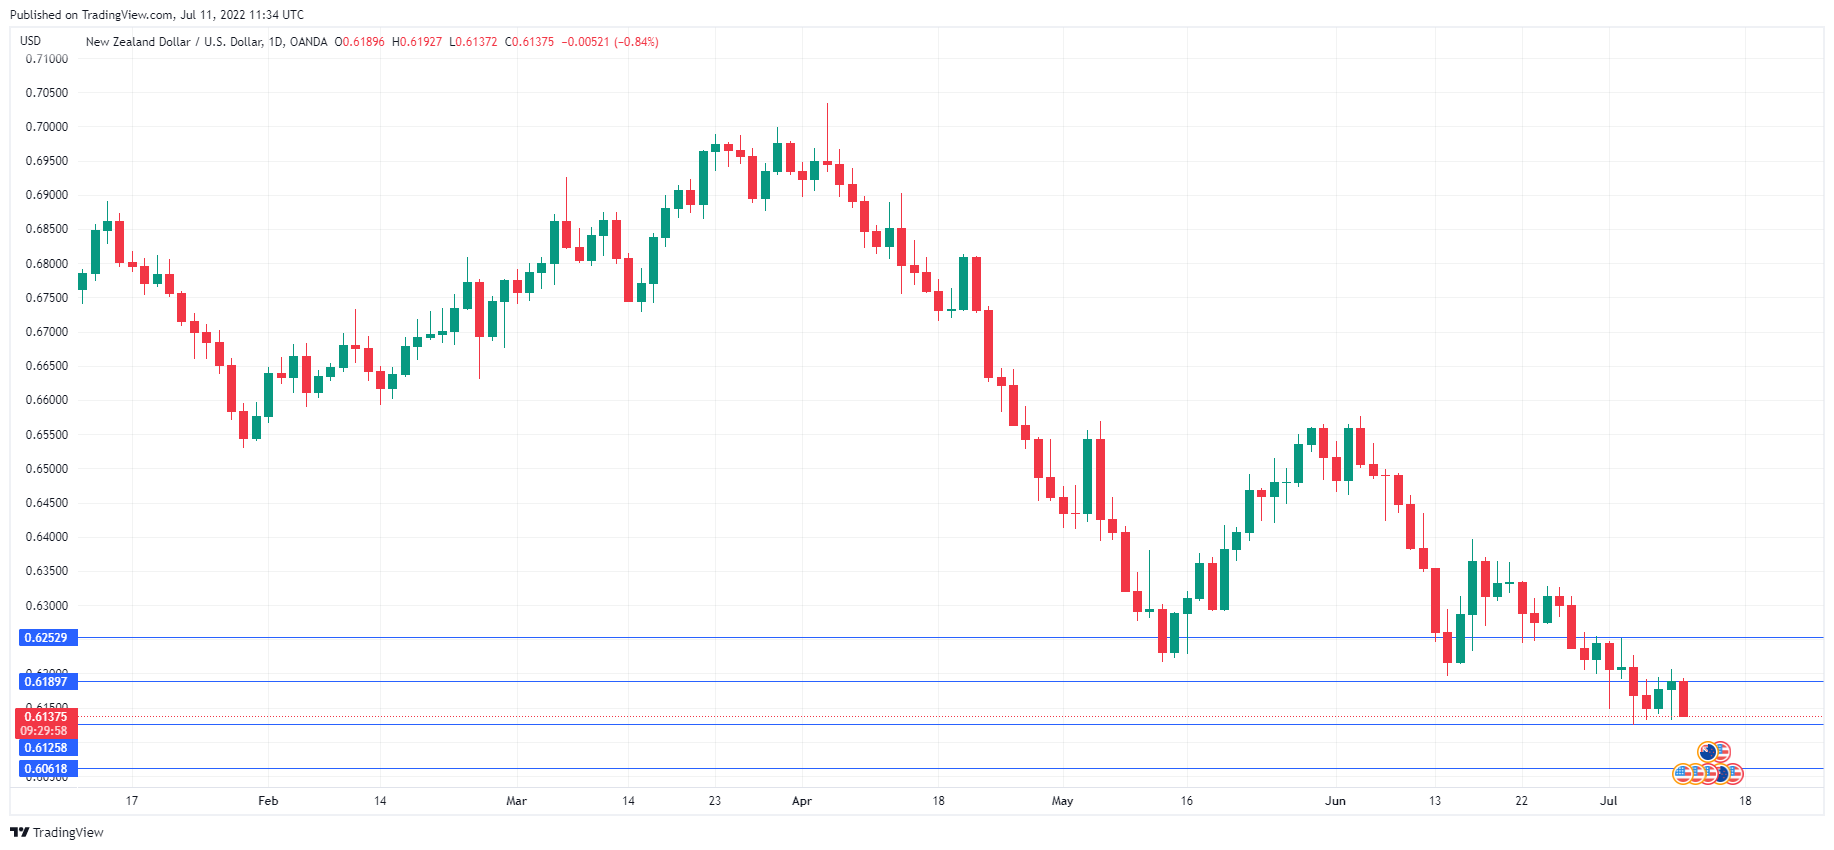
The New Zealand dollar is seeing red on Monday, as the US dollar has started the week with gains against the major currencies after a solid non-farm payrolls release on Friday. In the European session, NZD/USD is trading at 0.6142, down 0.76%.
RBNZ expected to deliver 50bp hike
The Reserve Bank of New Zealand will be in the spotlight this week. On Tuesday, the central bank is expected to release a Statement of Intent. The report will outline the central bank’s objectives over the next three years, and investors will be looking for insights regarding future monetary policy.
After the Statement of Intent, the RBNZ sets interest rates on Wednesday at its policy meeting. The RBNZ has pressed the pedal to the floor and is widely expected to deliver a third successive 50bp increase, which would bring the cash rate to 2.50%. As with the Fed and RBA, there are concerns that the aggressive rate-hike tightening will slow the economy to such an extent that the result will be a recession. The Bank has been in an aggressive mode in order in order to curb soaring inflation, which has climbed to 6.9%.
The central bank has set as its number one priority the curbing of inflation and inflation expectations, and while it would of course prefer to avoid a recession, it is unlikely to change course even if this is the price to pay. With a peak in inflation nowhere in sight, the RBNZ can be expected to remain hawkish until inflation is contained. Interest rates could hit 3% in August and rise as high as 4% if inflation does not ease lower.
Confidence indicators have been heading southward, raising concerns about the health of the economy. The NIEZR Business Confidence index fell ever deeper into negative territory last week, with a reading of -65 for Q2. Business confidence is currently at its lowest level since Q1 2020, at the start of the corona pandemic. Economic activity has been curtailed due to the acceleration of Covid cases, and businesses continue to struggle with cost pressures and higher interest rates. Earlier in July, ANZ Business Confidence in June, which fell to -62.6, down from -55.6 in May, marking a 12th straight decline and a near-record low.
Consumers are also feeling the bite of the cost of living crisis and higher interest rates have meant higher mortgage payments, leaving consumers with less disposable income and less confidence about their economic situation. The Westpac Consumer Confidence fell sharply to 78.7 in Q1, down from 92.1 in Q4 2021. If major economic indicators point to a slowdown in growth, the RBNZ may have to ease up on its aggressive rate hiking.
NZD/USD Technical
- 0.6125 is under strong pressure in support. Below, there is support at 0.6062
- There is resistance at 0.6189 and 0.6252
AUDUSD Wave Analysis
- AUDUSD reversed from resistance level 0.6850
- Likely to fall to support level 0.9870
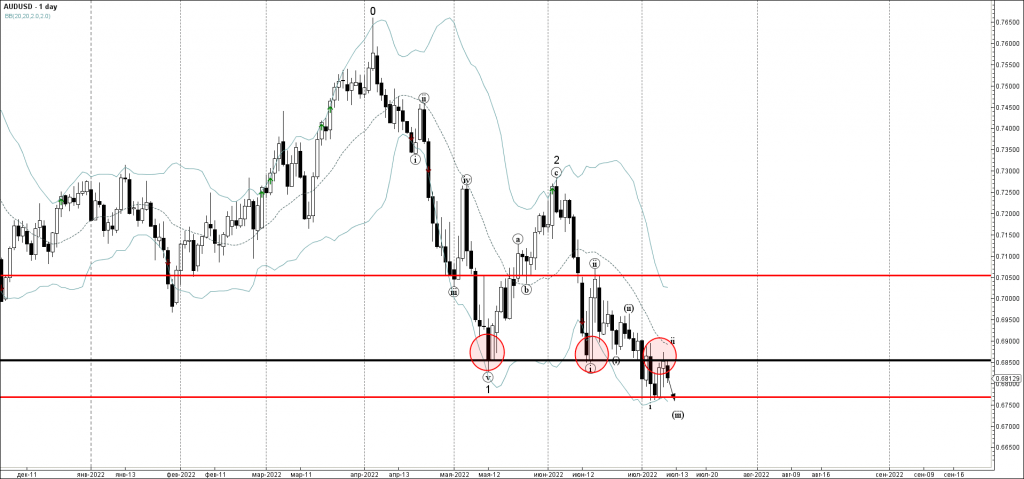
AUDUSD currency pair recently reversed down from the key resistance level 0.6850 (former strong support which reversed the pair sharply in May and June).
The downward reversal from the resistance level 0.6850 stopped the earlier minor ABC correction (ii).
Given the clear daily downtrend, AUDUSD can be expected to fall further toward the next support level 0.9870 (low of the previous minor impulse wave i).
EURCHF Wave Analysis
- EURCHF reversed from key resistance level 0.9950
- Likely to fall to support level 0.9870
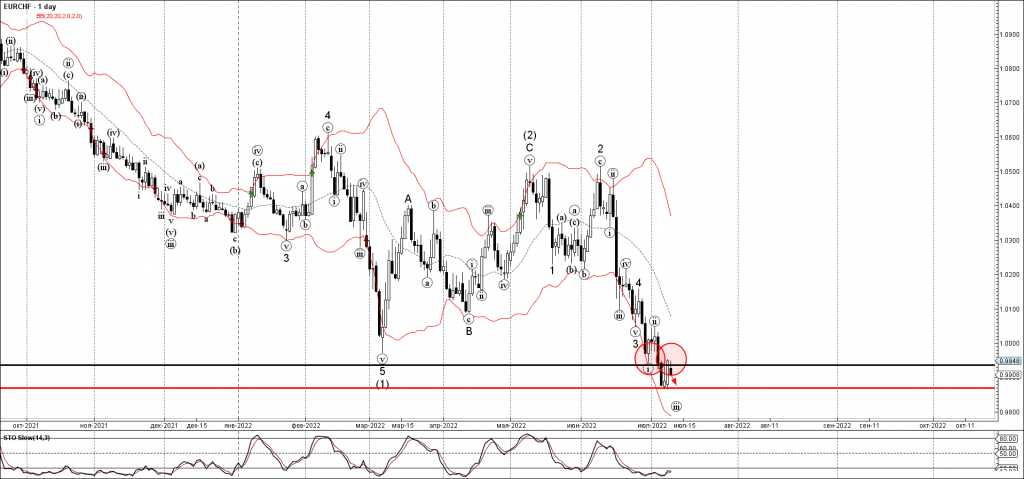
EURCHF currency pair recently reversed down from the key resistance level 0.9950 (low of the previous minor impulse wave (i) from the end of June).
The downward reversal from the resistance level 0.9950 is aligned with the active impulse waves (iii), 3 and (3).
Given the predominant weekly downtrend, EURCHF can be expected to fall further toward the next support level 0.9870 (low of the earlier Morning Star from the start of this month).
Awaiting the Last Bitcoin Mile
Bitcoin rose 12.6% last week to near $21,600 but is bouncing back from gains to the $20,500 area at the start of the day, recording a 3.9% decline in the last 24 hours. Ethereum essentially copies the dynamics of the first cryptocurrency, losing 3.8% in 24 hours to $1150. Altcoins from the top 10 are losing between 2.4% (BNB) and 5.5% (Solana).
Total crypto market capitalisation, according to CoinMarketCap, rose 5.8% over the week to $916bn. Bitcoin’s dominance index climbed 0.6 to 42.8% over the same period.
The Cryptocurrency Fear and Greed Index rose 13 points for the week to 24 but lost 2 points by Monday and remains in ‘extreme fear’.
BTC’s rise last week was halted by the 200-week moving average, now passing near $22,500. Bitcoin has continued to move sideways for three weeks near the critical $20,000 level, the high of the previous cycle.
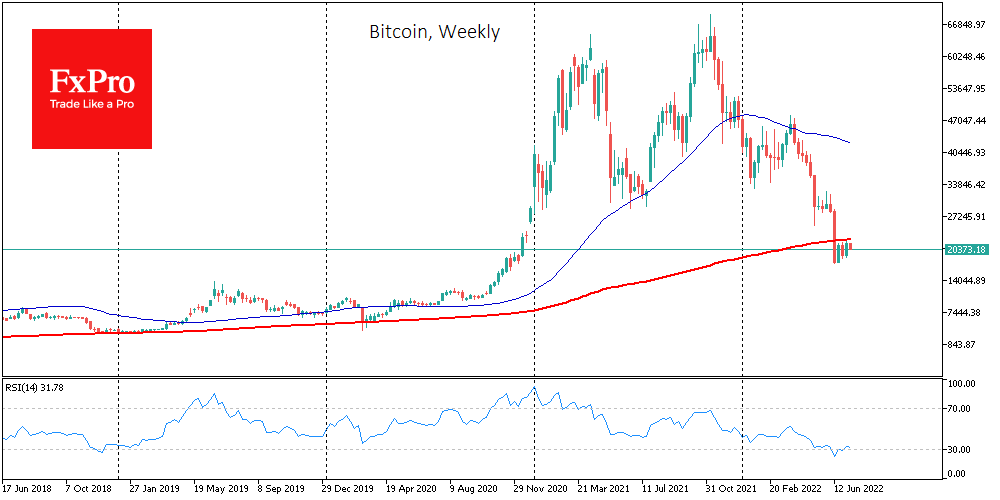
BTC has never previously fallen below such marks, so it is now getting support from buyers confident in the first cryptocurrency’s long-term growth. Another supportive factor was the rebound in financial markets, where the new half-year was met with increased buying.
However, as always in recent months, there are many questions about the sustainability of the rebound amid the Fed’s sharp interest rate rise and a slowing economy.
Rockefeller International managing director Ruchir Sharma believes the deleveraging process is not over, and BTC could still fall in the next six months as the stock market declines.
Galaxy Digital CEO Michael Novogratz said that the decline of the cryptocurrency market is close to being over. However, there could be a final “tug” from the bears shortly. He stressed that he does not believe BTC will fall to $13,000.
Cryptocurrency lending service Celsius has transferred 25,000 wBTC tokens worth $528m to the FTX exchange. The market fears Celsius will sell the tokens and crash the bitcoin exchange rate. According to Arkham, Celsius has lost $390m of client funds on investments in DeFi and NFT.
Nobuaki Kobayashi, the trustee of the bankrupt Mt.Gox exchange, has begun preparations to reimburse creditors. The situation on the market could worsen if 150,000 BTC were distributed among MtGox users and immediately flooded the market.
The US Federal Deposit Insurance Corporation (FDIC) is investigating Voyager Digital. According to the agency, the cryptocurrency broker deceived users by claiming their assets were protected by the agency’s program.