

Sample Category Title
US ADP jobs grow only 22k, but wage pressures steady
US private employment rose by just 22k in January, according to the ADP report, well below expectations of 48k increase.
Job gains were concentrated in service-providing industries, which added 21k positions, while goods-producing sectors contributed just 1k. By firm size, medium-sized businesses drove employment growth with 41k new jobs, while large employers shed -18k positions and small establishments saw no net change, pointing to uneven demand for labor.
Wage growth, however, remained resilient. Pay for job-stayers rose 4.5% yoy, little changed from prior months. Job-changer wage growth slowed modestly from 6.6% yoy to 6.4%.
As Nela Richardson, chief economist at ADP, noted, job creation has slowed sharply over the past three years, but wage growth has remained stable—highlighting a labor market that is cooling through hiring rather than pay compression.
AUD/JPY re-accelerates to new record high, 113 and then 116 next targets
AUD/JPY surged to a fresh record high this week. The move reflects renewed strength in Aussie following a hawkish turn from the RBA, alongside renewed weakness in the Yen as intervention risks fade and election looms.
On the Australian side, the catalyst has been clear. The RBA became the first major central bank to reverse course from easing, responding to a resurgence in inflation that has been building since late last year. Policymakers highlighted stronger-than-expected consumption and a labor market that remains slightly tight, reinforcing that more policy restraint is needed.
Importantly, the RBA’s own forecasts assume interest rates rise further later this year. While officials have avoided pre-committing to a sequence of hikes, the projection alone has been enough to lift Aussie, particularly against low-yielding peers.
In contrast, Yen has come back under broad-based pressure. The perceived risk of intervention—especially coordinated action between Japan and the US—has receded markedly. Conflicting messages from Japanese officials on Yen weakness suggest authorities are not yet prepared to step in directly, at least not before USD/JPY approaches the 160 area again.
Political positioning has added another pressure to Yen. Some traders are positioning ahead of Sunday’s snap election, where the ruling Liberal Democratic Party could secure an outright majority on the back of strong approval for Prime Minister Sanae Takaichi. While her policy agenda raises longer-term fiscal concerns, a decisive win would also buoy domestic equities, reinforcing risk-on sentiment and keeping the Yen under pressure.
That combination of stronger Australian fundamentals and weaker Japanese currency support has proven potent. Even without a sharp change in global risk sentiment, domestic factors alone are sufficient to sustain AUD/JPY upside.
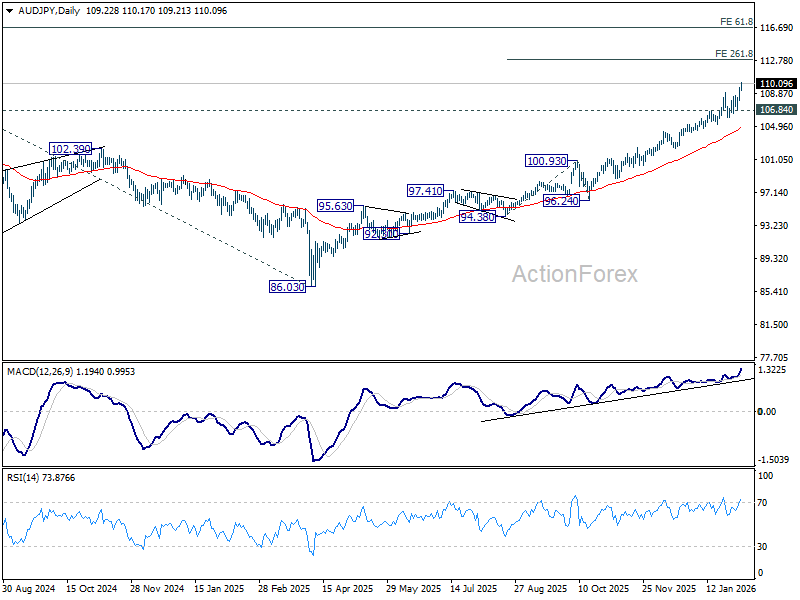
Technically, momentum has re-accelerated, with D MACD turning higher again. Near-term bias stays firmly bullish as long as 106.84 support holds. The next target sits at the 261.8% projection of 94.38 to 100.93 from 96.24 at 113.38.
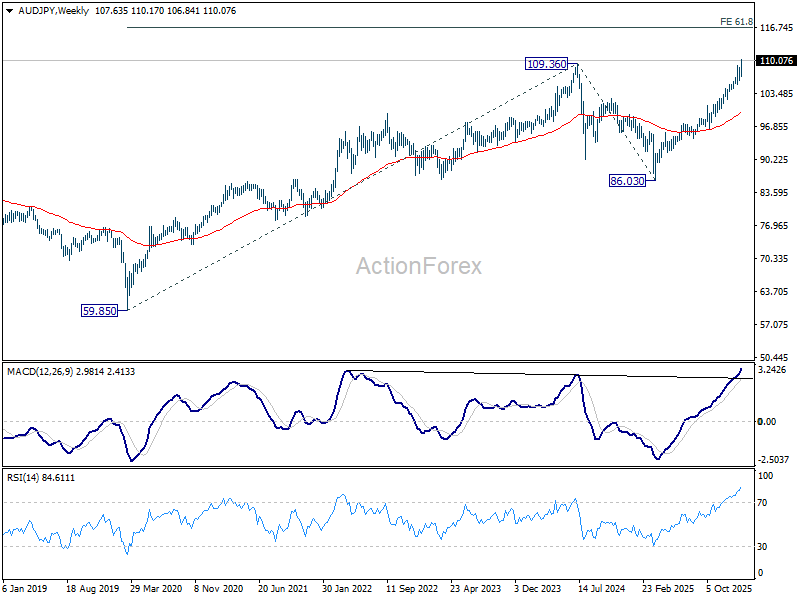
Looking further out, the next major hurdle comes in at 61.8% projection of 59.85 (2020 low) to 109.36 (2024 high) from 86.03 (2025 low) at 116.62. Price action around that zone will be key in defining whether the current rally extends into a sustained long-term breakout or pauses after an extended run.
XAU/USD: Recovery Extension Above $5,000 Improves Near-Term Picture and Boosts Optimism
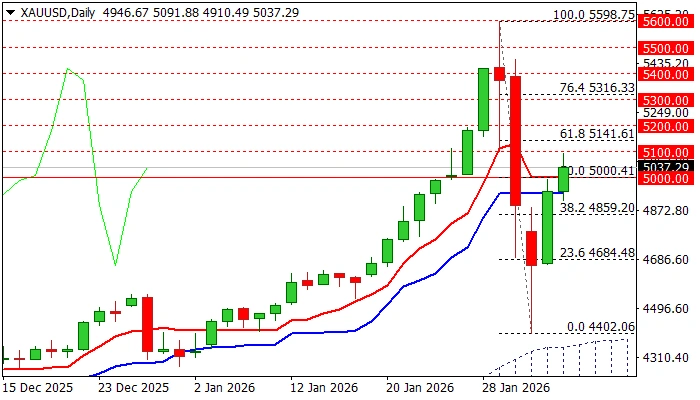
Gold regained levels above $5000 on Wednesday as strong recovery extends into second consecutive day (metal was up almost 6% on Tuesday, in the biggest daily gain in years).
Brief pause in geopolitical stage (one of gold’s key drivers nowadays) which sparked the latest correction, is likely over as renewed tensions between the US and Iran revived safe-haven demand and lifted the price from dangerous zone.
The situation on daily chart boosts optimism on signals about likely end of correction as pullback from new record high ($5598) repeatedly closed above Fibo 38.2% of $5598/$4402 ($4652) after spike lower found support above 50% retracement, reinforced by the top of ascending daily Ichimoku cloud.
This signaled a healthy correction of larger uptrend that provided better levels to re-enter bullish market, which subsequently accelerated recovery.
Technical picture improved as 14-d momentum bounced after reversal just above the centreline and RSI rose above 50 zone, while the price rose above daily Tenkan/Kijun-sen in bullish configuration.
Daily close above $5000 (psychological/50% retracement/daily Tenkan-sen) is required to confirm bullish signal and keep fresh bulls intact for attacks at initial barriers at $5100/41 (round-figure/Fibo 61.8% of $5598/$4402), guarding $5314 (Fibo 76.4%).
Failure to sustain gains above $5000 would allow dips above $4936 (daily Kijun-sen) that would keep near-term bias with bulls.
Res: 5100; 5141; 5200; 5316.
Sup: 5000; 4936; 4900; 4859.
Gold Inflates a New Bubble
- The US dollar may suffer because of Kevin Warsh
- Gold volatility remains elevated.
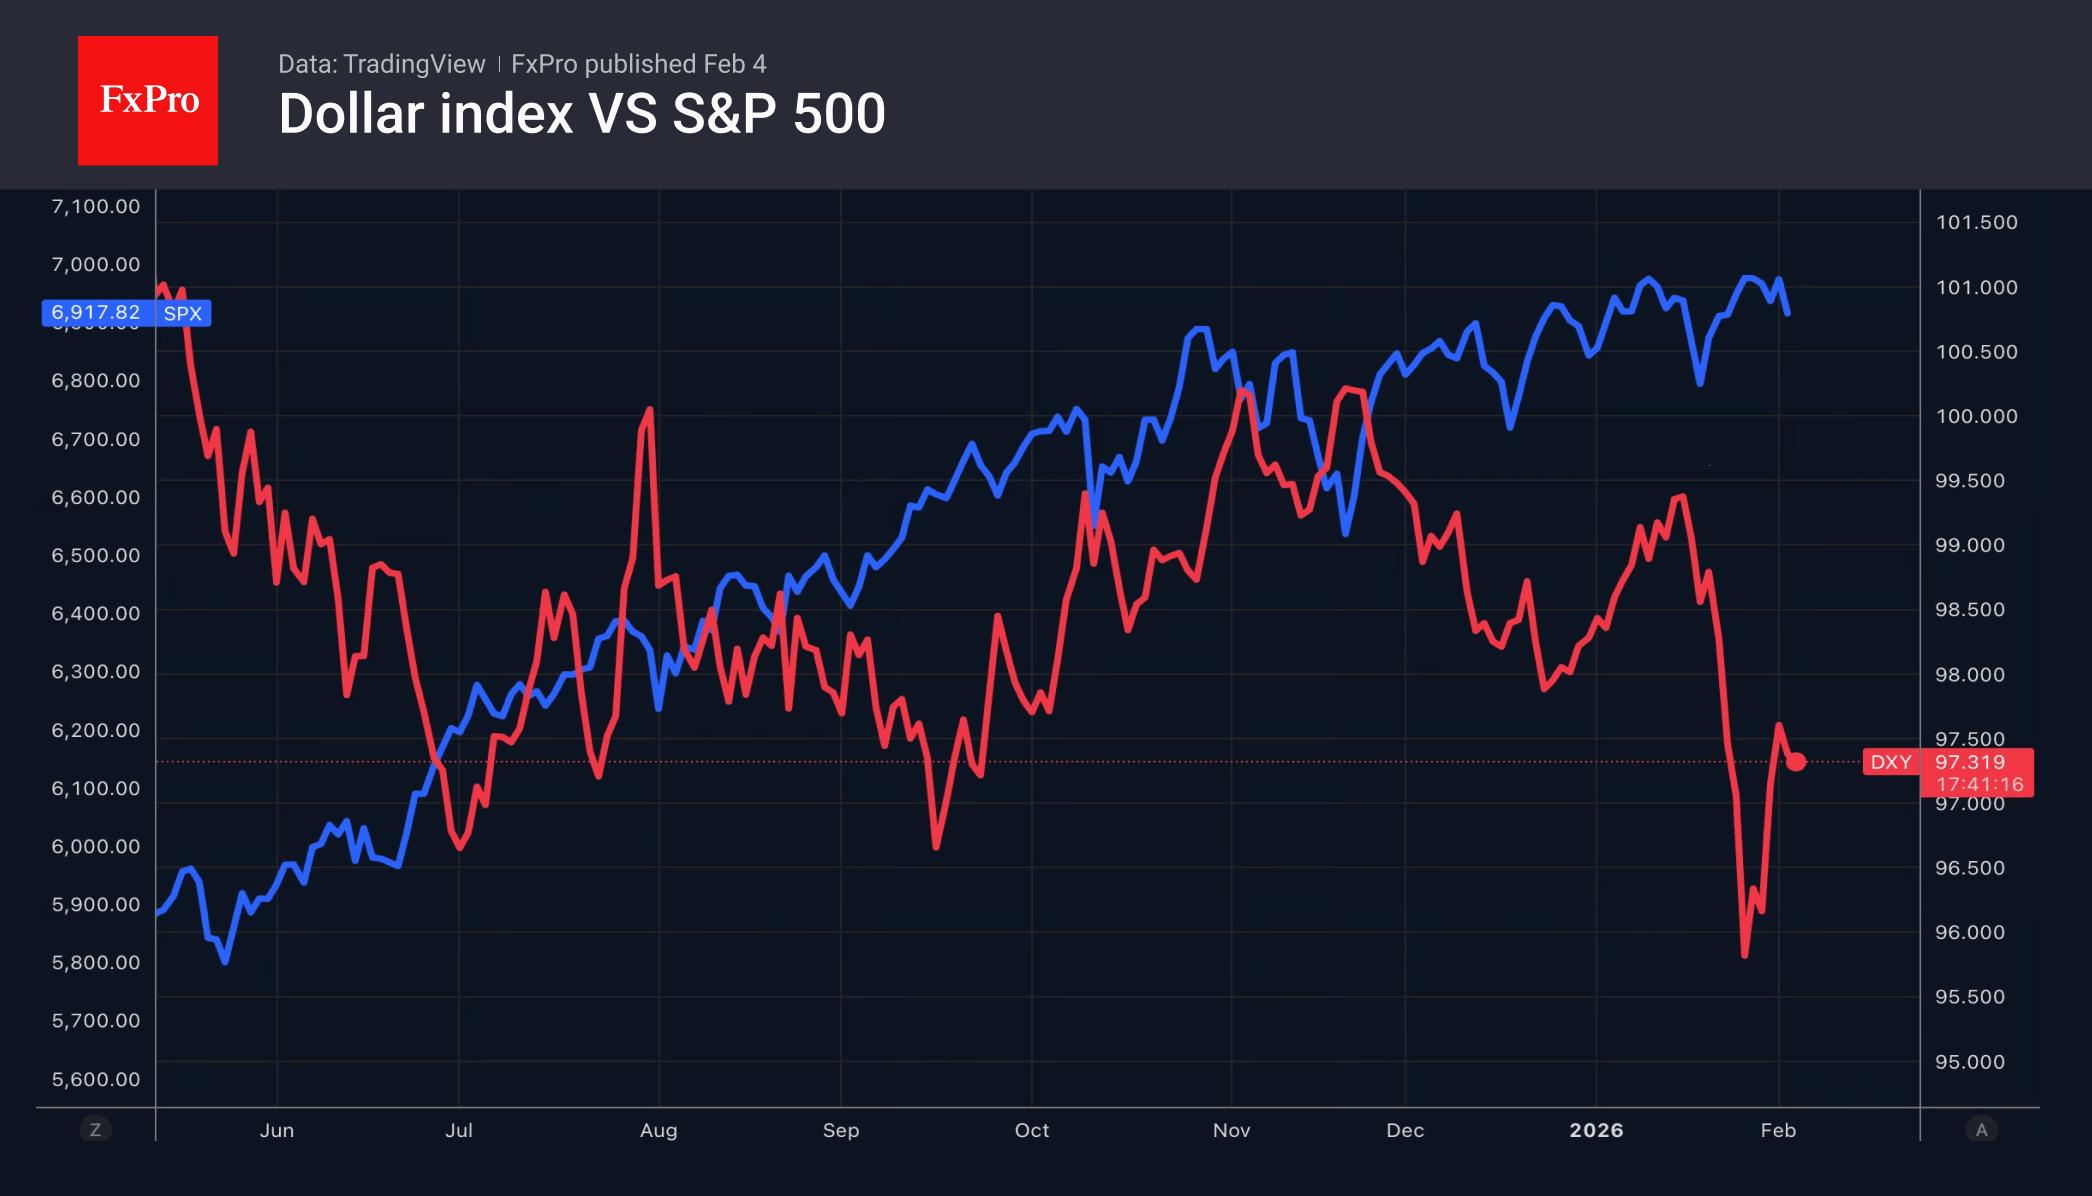
The collapse of US stock indices amid new developments in artificial intelligence has caused the US dollar to retreat. Software stocks have been hit hardest by Anthropic’s innovations. The US market no longer looks as exceptional as it once did, with investors tending to diversify their portfolios and sell off American stocks. Coupled with a reassessment of Kevin Warsh’s views as Fed chairman, this brings back interest in buying EURUSD.
The futures market gives a 59% probability of a federal funds rate cut in June and expects two acts of monetary expansion before the end of the year. MUFG Bank notes that Kevin Warsh is respected by the markets. Donald Trump’s choice in his favour has eased concerns about the Fed losing its independence and boosted confidence in the US dollar. However, the former FOMC official intends to cut rates. Rumours are growing on Forex that they will fall by 100-125 basis points.
The Fed is not a one-man show. It will require a change in the economic outlook of the majority of the Open Market Committee, and this process is already underway. According to Richmond Fed President Thomas Barkin, companies are not raising prices due to customer resistance. They are absorbing the tariffs. This is good news for inflation. The US economy is growing thanks to the artificial intelligence ecosystem and serving wealthy customers.
The retreat of the US dollar has strengthened investors’ desire to buy up gold after the slump. Political and geopolitical tensions remain high, fuelling interest in gold as a safe-haven asset. In percentage terms, the precious metal recorded its largest daily gain since March 2009. At that time, investors were actively buying it due to the global economic crisis.
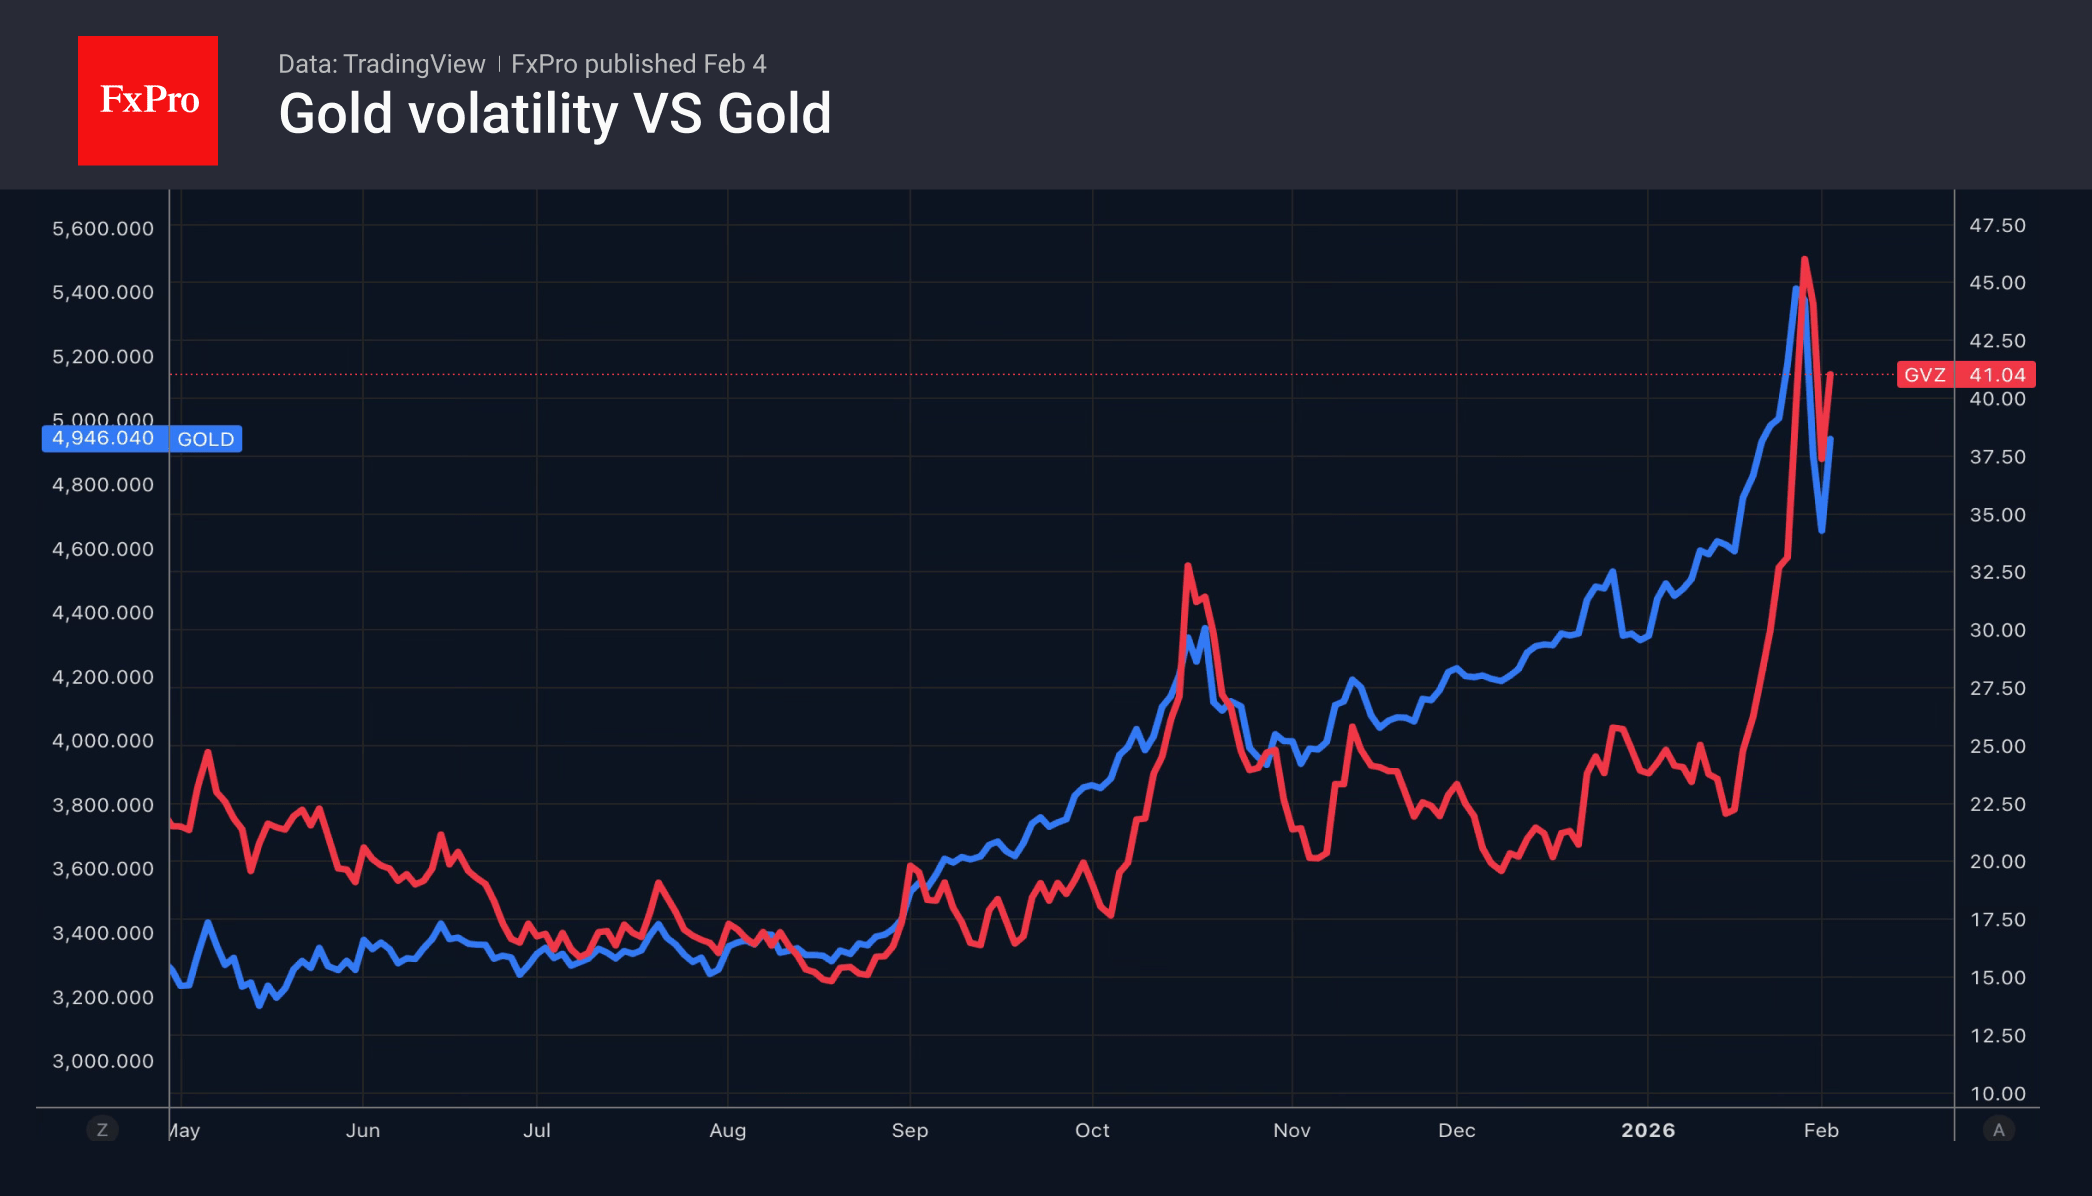
However, Bank of America warns that there was no decline in volatility after gold collapsed on Black Friday, 30 January. The indicator continues to remain at high levels, increasing the risks of a new bubble forming.
As the parliamentary elections approach, hedge funds are increasing their sales of the yen. If the Liberal Democratic Party strengthens its position in the lower house, interest in ‘Takaichi trade’ will return, inspiring USDJPY bulls.
Bitcoin Price Falls to a New Low
As the BTC/USD chart shows, prices dropped below $74,000 yesterday. This marks the lowest level since November 2024, when the cryptocurrency was rallying on news of Trump’s election victory.
At the same time, sentiment indicators are signalling “extreme fear” across the market. This was reinforced by the break below the key April 2025 low near $74,450.
The media has been circulating increasingly alarming headlines:
- → Michael Burry, well known for his bearish calls, has suggested that a drop below the $70k level could create problems for the largest coin holder, MicroStrategy (MSTR);
- → Matt Hougan, Chief Investment Officer at Bitwise, warns that the market may be heading for a “full-blown” crypto winter rather than a simple correction.
Technical Analysis of the BTC/USD Chart
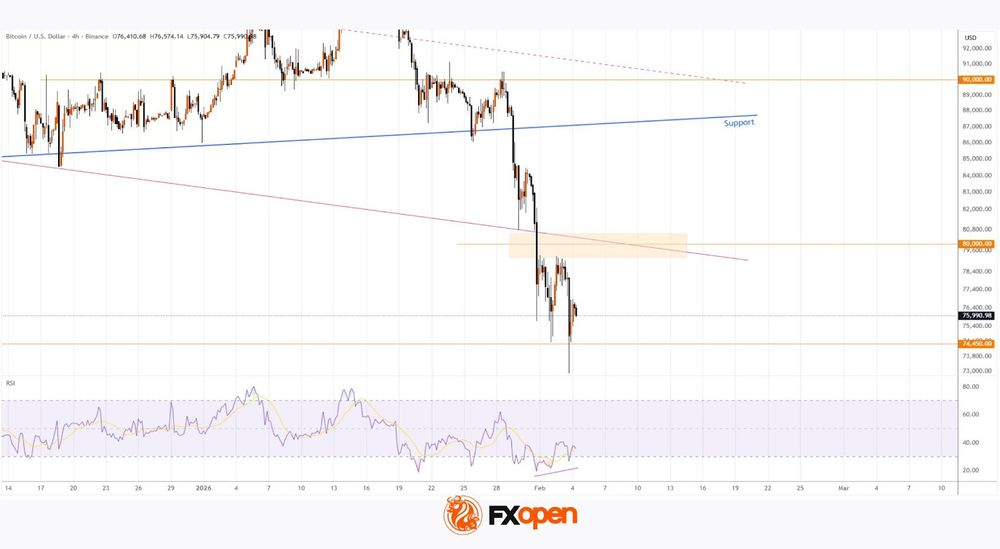
The price continues to move further away from the support level whose break we highlighted on 30 January.
At the same time, the market appears extremely oversold:
- → the price has fallen below the lower boundary of the previously drawn descending red channel;
- → the RSI indicator is forming bullish divergences.
Under these conditions, it is reasonable to assume that the market may be setting up for a technical rebound. This scenario looks particularly plausible given the scale of long position liquidations — around $2.5 billion were wiped out on 31 January alone.
If a recovery does unfold, a key test of bullish intent will be the psychological $80k area, where bears previously held clear control while breaking below the lower boundary of the descending channel.
FXOpen offers the world's most popular cryptocurrency CFDs*, including Bitcoin and Ethereum. Floating spreads, 1:2 leverage — at your service (additional fees may apply). Open your trading account now or learn more about crypto CFD trading with FXOpen.
*Important: At FXOpen UK, Cryptocurrency trading via CFDs is only available to our Professional clients. They are not available for trading by Retail clients. To find out more information about how this may affect you, please get in touch with our team.
This article represents the opinion of the Companies operating under the FXOpen brand only. It is not to be construed as an offer, solicitation, or recommendation with respect to products and services provided by the Companies operating under the FXOpen brand, nor is it to be considered financial advice.
Eurozone CPI cools to 1.7% in January, core ticks down to 2.2%
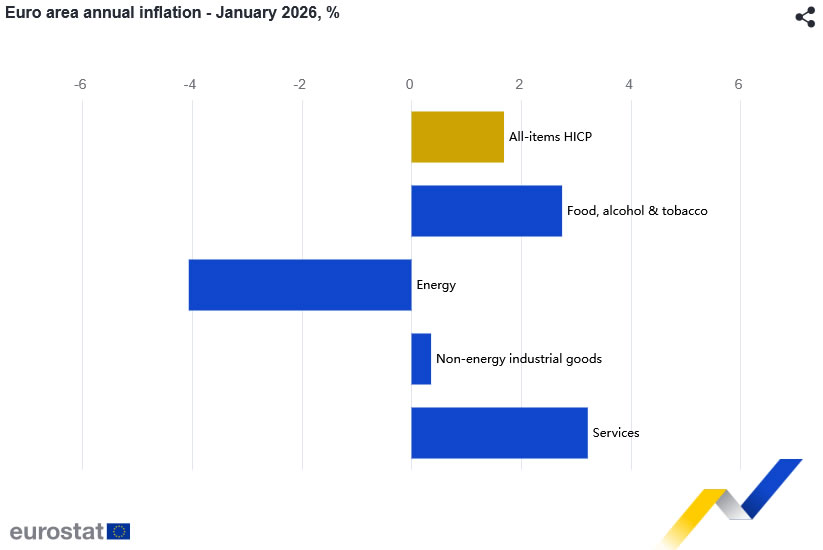
Eurozone flash CPI slowed from 1.9% yoy to 1.7% in January, in line with expectations. Underlying pressures also moderated slightly. Core CPI, which strips out energy, food, alcohol, and tobacco, edged down from 2.3% to 2.2% yoy.
By component, services inflation remained the largest contributor but slowed to 3.2% from 3.4%. Food, alcohol, and tobacco inflation picked up from 2.5% to 2.7%. Non-energy industrial goods inched higher from 0.3% to 0.4%. Energy prices was a major drag, with annual inflation falling sharply from -1.9% to -4.1%.
UK PMI services finalized at 54.0, encouraging start to the year
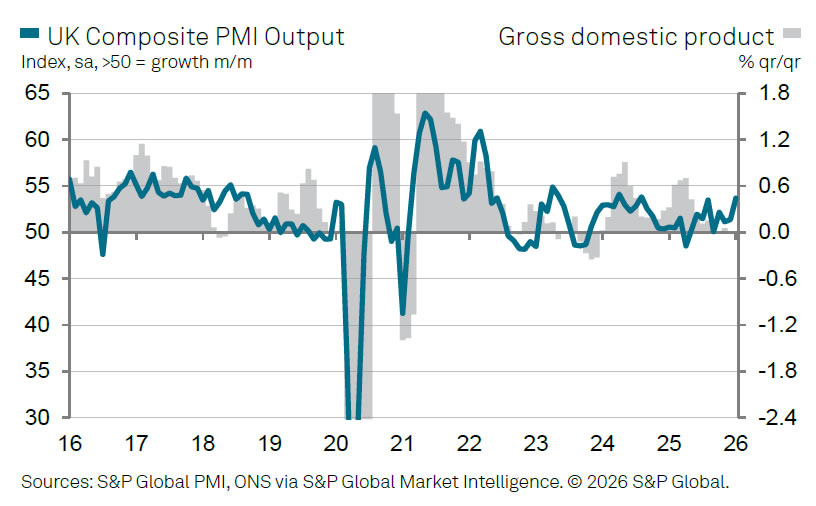
UK PMI Services was finalized at 54.0 in January, surging from December’s 51.4 and marking the strongest reading since August 2025. PMI Composite also rose sharply to 53.7 from 51.4, the highest level since August 2024,.
According to Tim Moore of S&P Global Market Intelligence, the survey points to an “encouraging start” to the year after a sluggish end to 2025. Service sector output expanded at the fastest pace in five months, supported by improved investment sentiment and stronger inflows of new work. That said, Moore noted that consumer demand remains constrained by squeezed household incomes, while geopolitical risks continue to weigh on business spending decisions.
The recovery is therefore uneven. While business confidence improved to its highest level since October 2024, firms continued to cut staff at an accelerated pace as they sought to offset rising payroll costs. At the same time, a sharp increase in input prices fed through to the fastest rise in output charges in five months.
Crypto Market Updates Local Lows
Market Overview
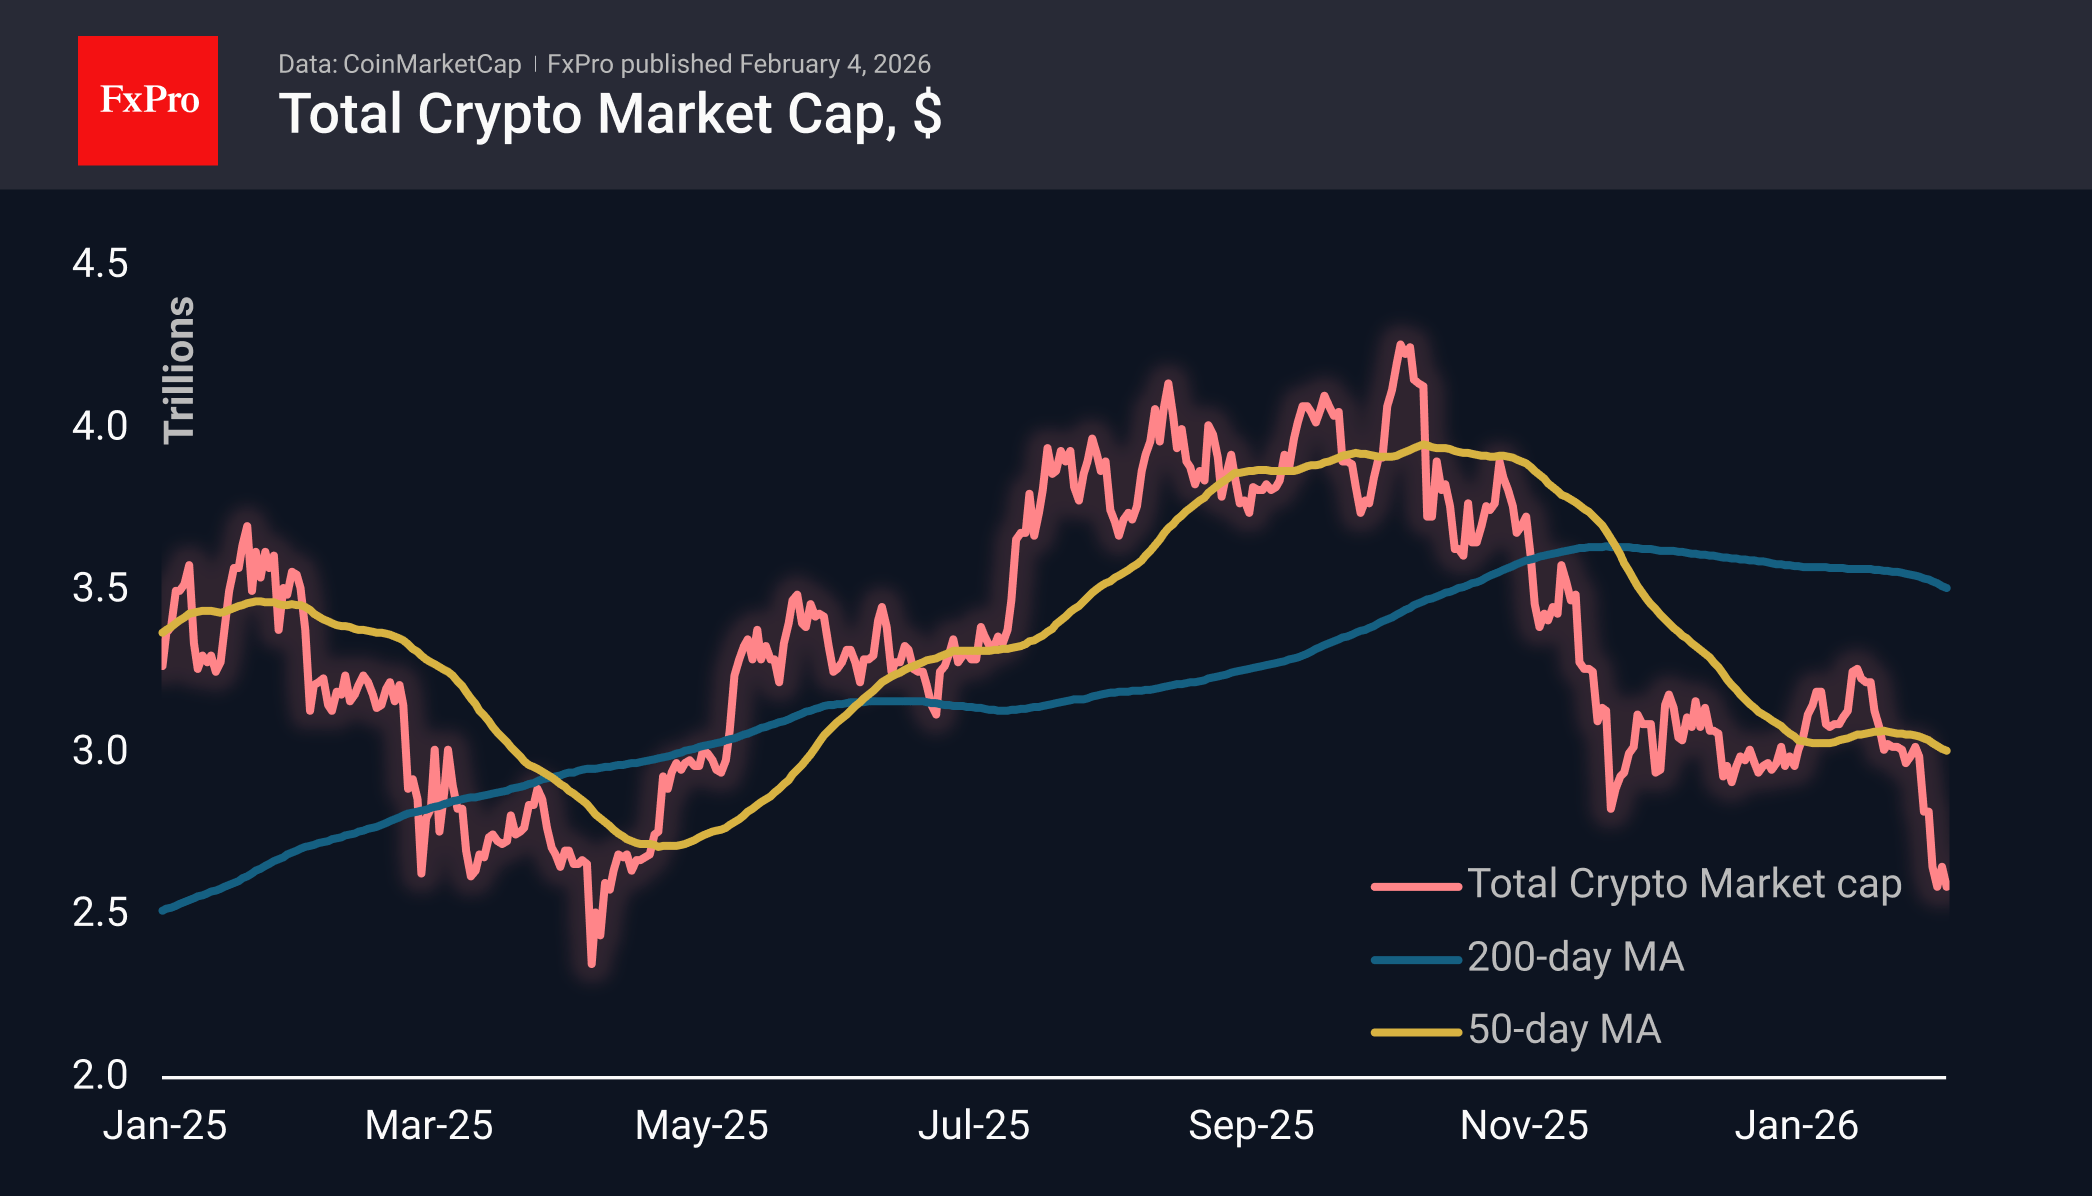
The crypto market cap fell 2.2% to $2.59 trillion, briefly touching $2.49 trillion, and is continuing its descent to last April’s lows. Solana was hit particularly hard by the sell-off among the top coins, losing 6.8% compared to 2.9% for Bitcoin and 1.6% for Ethereum. Tron outperformed the market, gaining 1% on the day and losing only 2.3% over 7 days and 2.8% over 30 days, compared to a 14.5% and 18.1% decline in total cap, respectively.
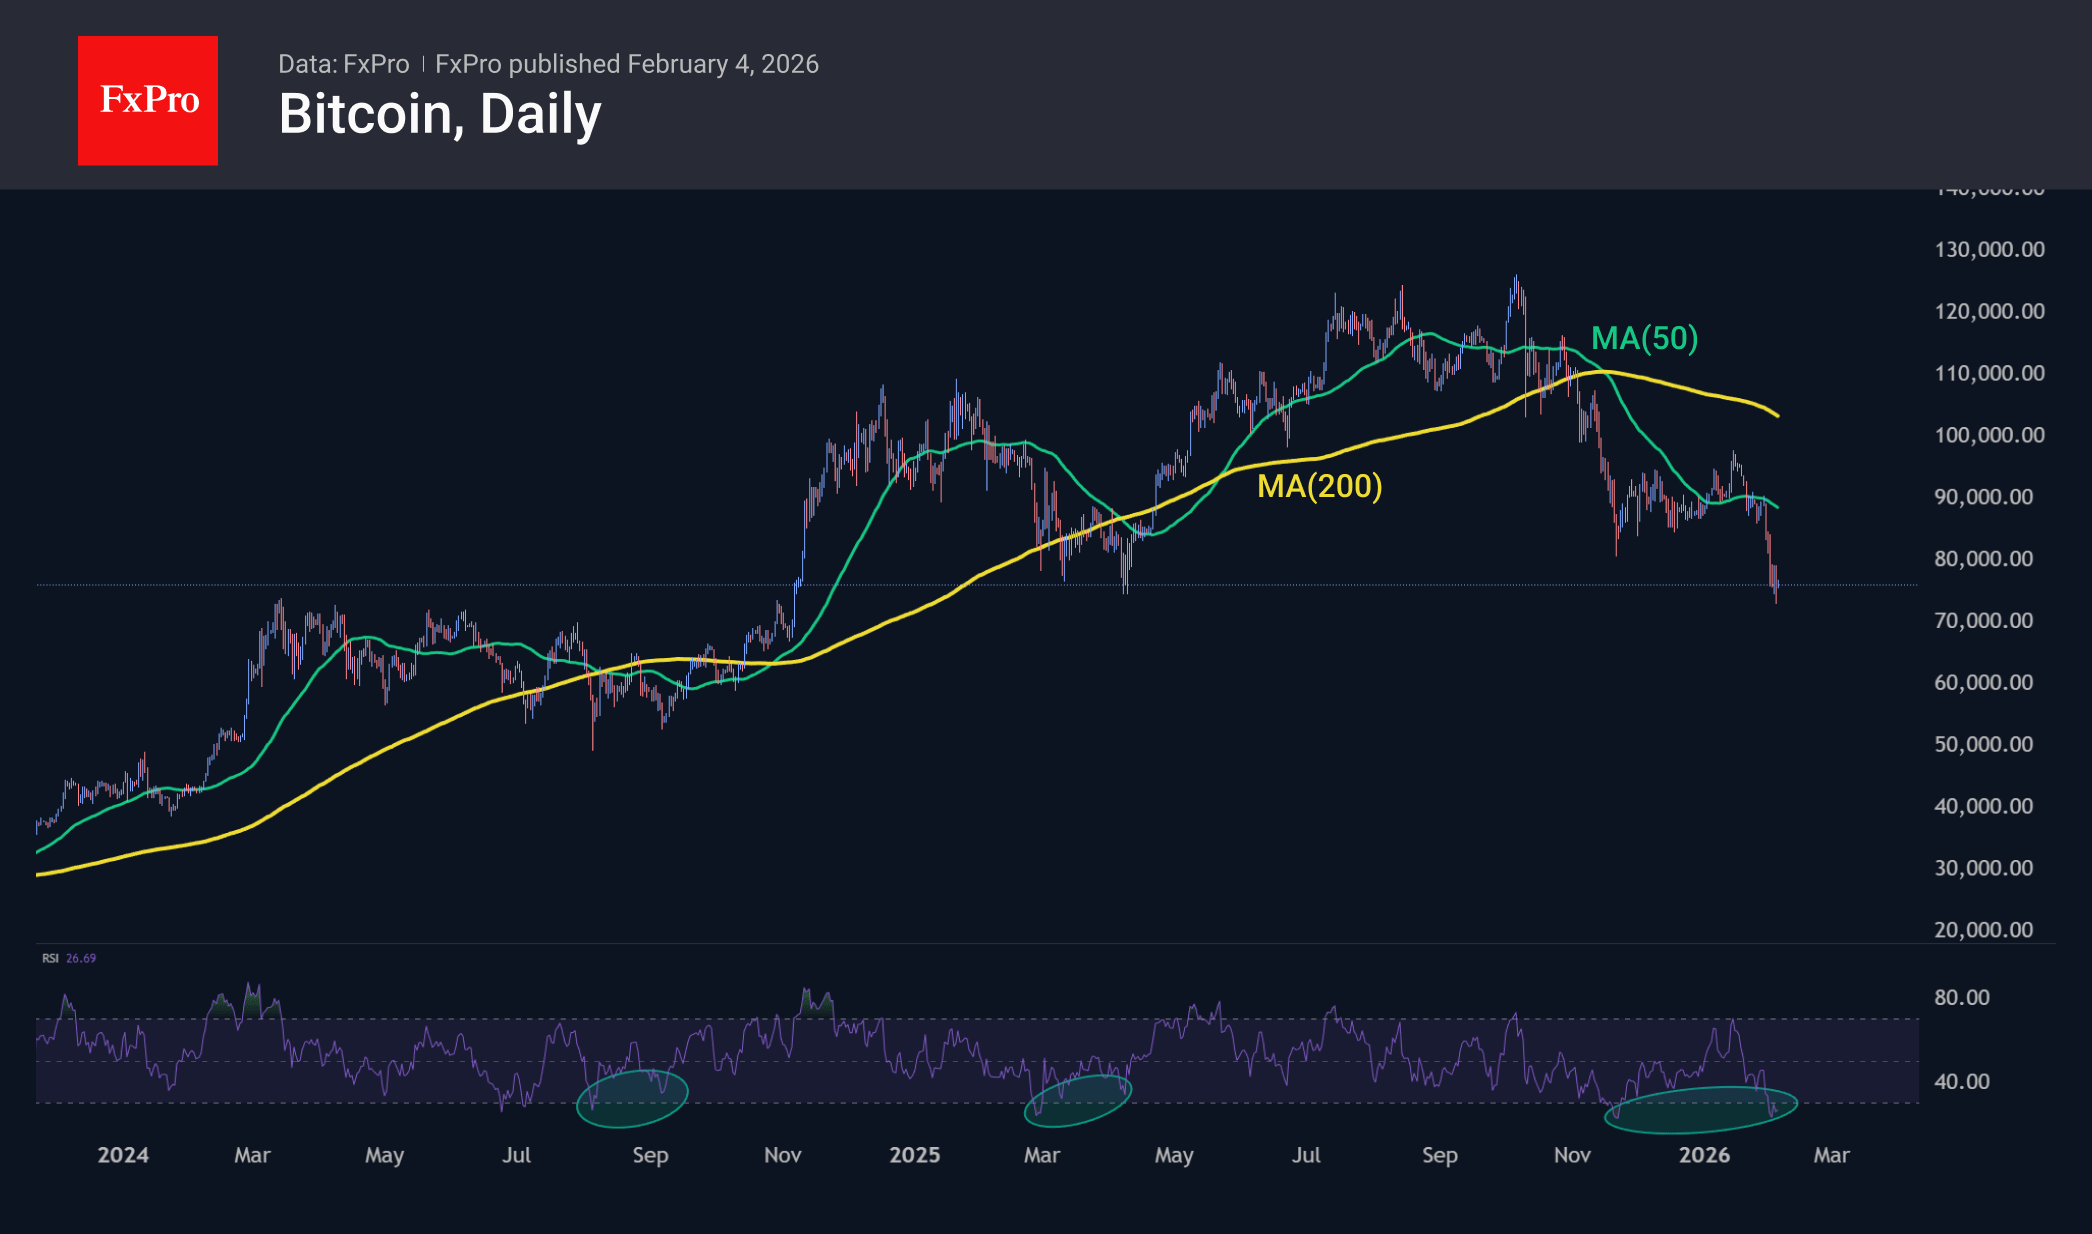
Bitcoin broke through its 2025 lows on Tuesday and briefly fell below $73,000, back to its early November 2024 lows. Although there has been some rebound since the start of Wednesday, the sequence of lower local highs and lows indicates that selling on the rise prevails in the markets. Bulls, for their part, may point to oversold conditions on the RSI and divergence, where a lower local price low corresponds to a higher local low on the relative strength index. There were two such instances in 2024 and 2025, followed by gains of more than 20% and 60%, respectively. However, during the 2020 bear market, such signals did not work.
News Background
Demand in the BTC spot market is drying up, with additional pressure from stablecoin outflows from trading platforms. Uncertainty surrounding the Fed’s policy and the possible appointment of Kevin Warsh threaten to strengthen the dollar. This has a negative impact on risky assets, according to Arctic Digital.
There are no catalysts for growth in the crypto market, and selling pressure remains. In such conditions, Bitcoin risks falling to $56,000-58,000, according to Galaxy Digital.
The current crypto winter is closer to its end than its beginning, according to Bitwise. The crypto market is nearing the end of its decline phase, according to Compass Point. The base scenario assumes that BTC will bottom out in the $60,000-68,000 range.
According to a JPMorgan survey, asset managers from 30 countries around the world are betting on artificial intelligence, leaving cryptocurrencies out of the picture. Only 17% of respondents consider digital assets to be a key topic.
The German division of ING Bank has opened access to exchange-traded notes (ETNs) focused on cryptocurrencies to retail clients. The instruments allow investors to invest in Bitcoin, Ethereum and Solana through the familiar banking interface.
Eurozone PMI services finalized at 51.6, cost pressures stay on ECB radar
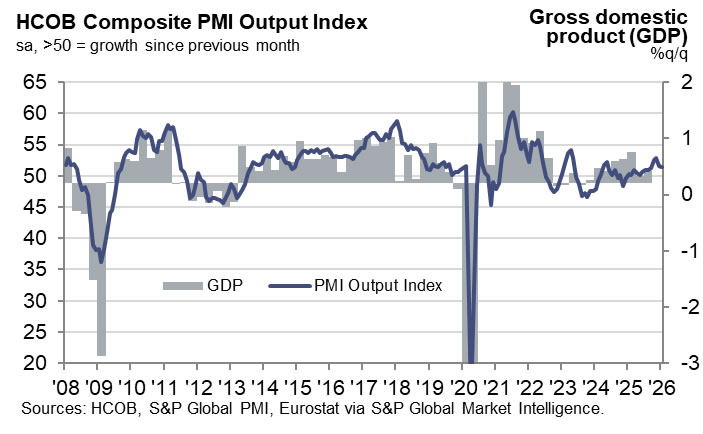
Eurozone PMI Services was finalized at 51.6 in January, easing from December’s 52.4. PMI Composite edged lower to 51.3 from 51.5. The data still point to ongoing expansion, but momentum softened slightly at the start of the year.
At the country level, the picture was mixed but broadly supportive. Spain was the strongest performer with PMI Composite at 52.9, despite slipping to a seven-month low. Germany (52.1) and Italy (51.4) both posted modest improvements. France (49.1) stood out as the laggard, with activity remaining in contraction territory.
According to Cyrus de la Rubia of Hamburg Commercial Bank, service sector growth has been “decent” but far from comfortable, with weak new business growth and limited hiring highlighting the recovery’s vulnerability.
While headline inflation is close to the ECB’s 2% target, services inflation remains sticky. Rising energy prices linked to cold weather, alongside a marked pickup in service sector input costs and selling prices flagged by the PMI, could reawaken concerns.
Gold is Back in the Black: Geopolitics Dictates Conditions Again
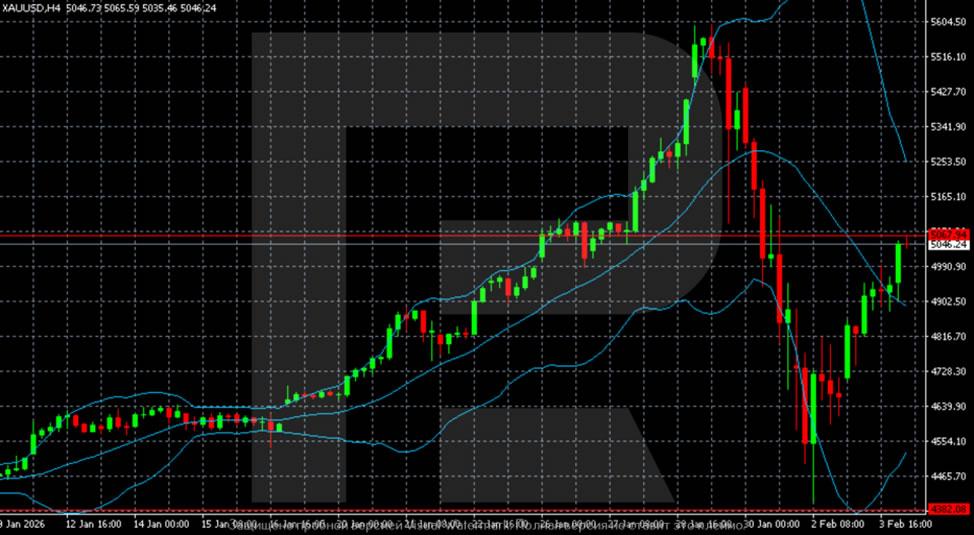
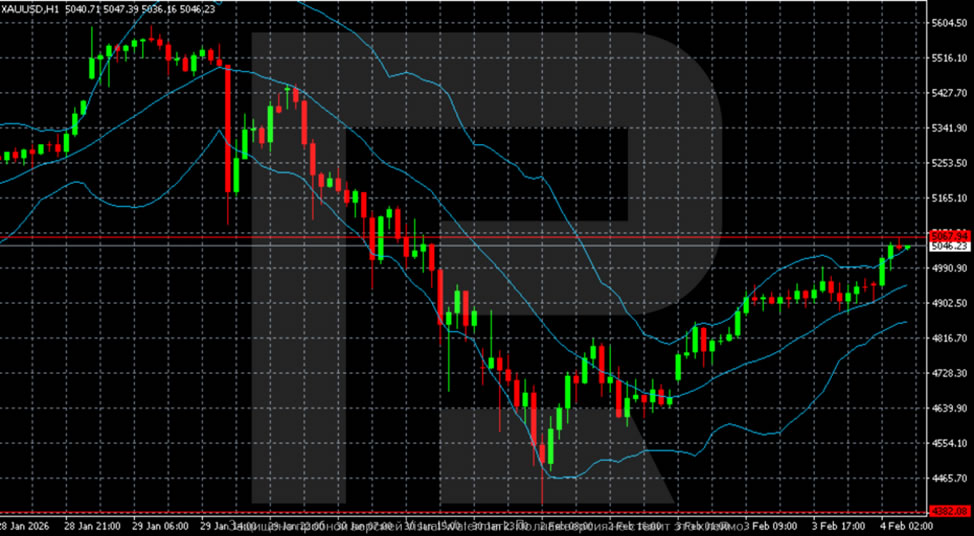
Gold, on Wednesday, returned above the key level of 5000 USD per ounce and has already approached 5067 USD. The precious metal continues to grow after jumping more than 6% in the previous session, marking the strongest daily increase since 2008. The quotes were supported by purchases following a decline after a sharp correction at the beginning of the week.
Geopolitical risks gave an additional impetus to the precious metal. After US forces shot down an Iranian drone near an aircraft carrier in the Arabian Sea, demand for defensive assets intensified. At the same time, President Donald Trump stated that diplomatic contacts continue, and the White House confirmed the US-Iran talks scheduled for Friday.
Expectations of rapid Fed rate cuts have eased somewhat since the nomination of Kevin Warsh to head the Fed. Nevertheless, the markets are still pricing in two rate cuts – probably in the middle of the year and later in 2026.
Separately, it is noted that the publication of key US labour market statistics, including JOLTS data and the monthly employment report, will be postponed due to the partial government shutdown. The House voted on Tuesday on the Senate-approved stopgap budget.
Technical Analysis
On the H4 chart for gold, after completing a powerful uptrend and reaching a peak around 5600, the market entered a sharp correction. The decline was impulsive, as evidenced by the expansion of Bollinger Bands – a sign of panic selling. The minimum was noted in the 4440–4450 zone, from where the technical rebound began. Current prices are recovering but remain below the Bollinger median line. The structure is still corrective, with increased volatility and a predominance of downside risks.
On the H1 chart, after a landslide downward movement, a base and a sequence of higher minima have formed – local stabilisation. The price is trading in a narrow upward channel and gradually moving towards the 5050-5100 resistance zone. However, the recovery looks technical. As long as the quotes are below key resistance and the median line of the higher timeframe, the rebound remains vulnerable to a resumption of selling.
Conclusion
In summary, gold's sharp recovery is primarily a technical rebound from oversold conditions, supercharged by a sudden flare-up in geopolitical tensions. While the move is significant, the technical structure across timeframes suggests it remains a corrective bounce within a larger downtrend, not a confirmed reversal. The rally is vulnerable as long as prices trade below key higher-timeframe resistance. The fundamental landscape remains mixed, with delayed US data creating uncertainty and revised, but still present, Fed easing expectations providing a floor. Near-term direction will hinge on the evolution of Middle East diplomacy and gold's ability to breach critical technical ceilings.