
Sample Category Title
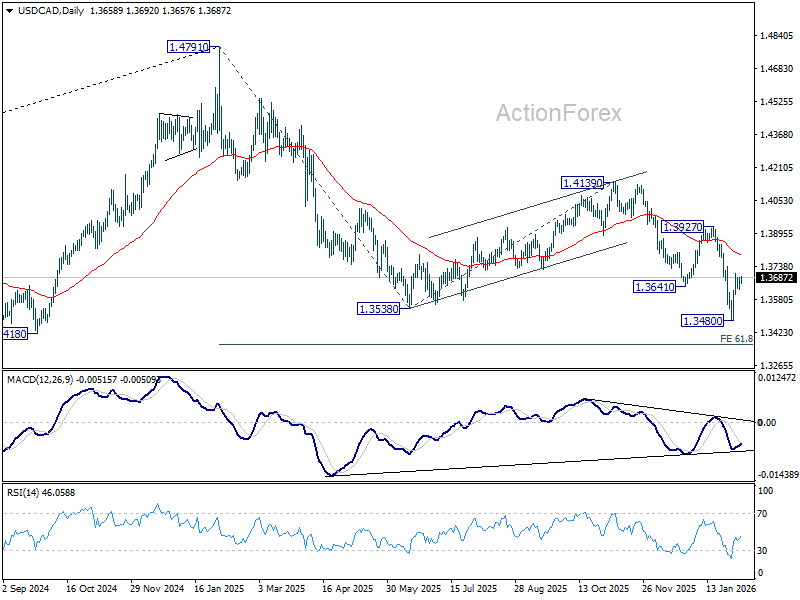
USD/CAD Daily Outlook
Daily Pivots: (S1) 1.3634; (P) 1.3659; (R1) 1.3689; More...
Intraday bias USD/CAD remains neutral at this point. On the upside, above 1.3701 will resume the rebound from 1.3480 short term bottom to 55 D EMA (now at 1.3793). On the downside, below 1.3570 minor support will bring retest of 1.3480 low. Firm break there will resume larger fall to 61.8% projection of 1.4791 to 1.3538 from 1.4139 at 1.3365.
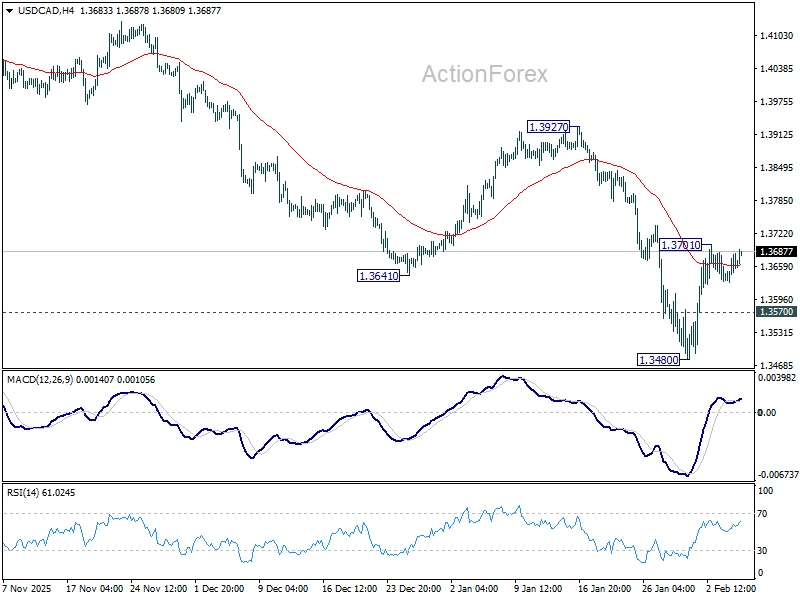
In the bigger picture, price actions from 1.4791 are seen as a corrective pattern to the whole up trend from 1.2005 (2021 low). Deeper fall could be seen as the pattern extends, and break of 1.3538 will target 61.8% retracement of 1.2005 to 1.4791 at 1.3069. For now, medium term outlook will be neutral at best, until there are signs that the correction has completed, or that a bearish trend reversal is confirmed.
AUD/USD Daily Report
Daily Pivots: (S1) 0.6966; (P) 0.7004; (R1) 0.7037; More...
AUD/USD dips mildly today as range trading continues and intraday bias stays neutral. Further rise is still in favor. On the upside, break of 0.7093 will extend larger up trend to 100% projection of 0.5913 to 0.6706 from 0.6420 at 0.7213 next. However, break of 0.6907 will bring lengthier consolidations before rally resumption. Deeper pullback would then be seen to 38.2% retracement of 0.6420 to 0.7093 at 0.6836.
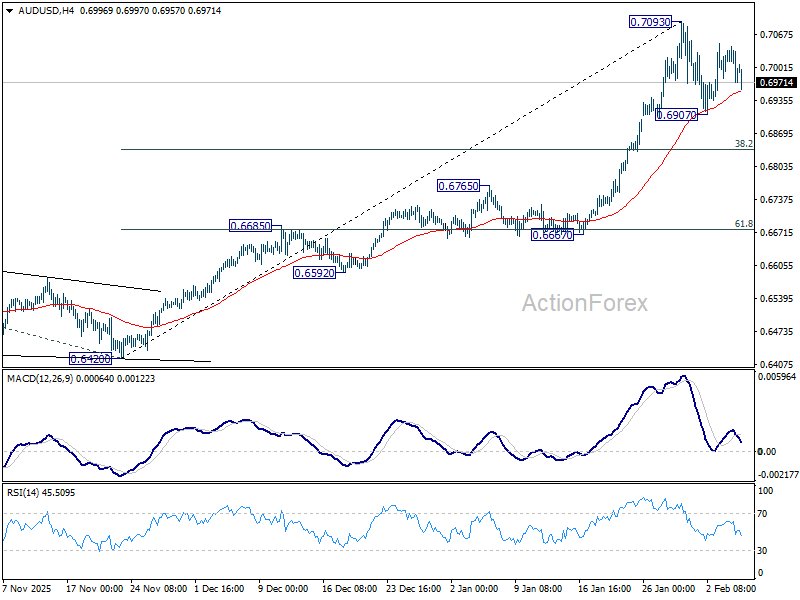
In the bigger picture, current development argues that rise from 0.5913 (2024 low) is reversing whole down trend from 0.8006 (2021 high). Further rally should be seen to 61.8% retracement of 0.8006 to 0.5913 at 0.7206. This will remain the favored case as long as 0.6706 resistance turned support holds, even in case of deep pullback.
Deepening AI Anxiety Hits Sentiment; ECB and BoE in Focus
Risk-off sentiment intensified in US tech sector overnight, with another down day in the NASDAQ. The move reflected growing unease rather than a single catalyst, as investors continue to reassess the implications of artificial intelligence for earnings, valuations, and capital discipline. That weakness carried into Asia, where Japanese and Korean equities saw steep declines.
So far, traditional and non-tech stocks have shown greater resilience. That divergence supports the narrative that markets are undergoing sector rotation rather than a full-blown risk-off episode. However, whether that insulation can hold if tech pressure persists remains an open question.
Several overlapping themes are driving the current reassessment. The first is growing concern that AI represents a competitive threat to software companies rather than a pure growth catalyst. Software firms long valued for sticky subscriptions and predictable renewals are now under scrutiny. Investors are questioning whether AI-driven automation could compress pricing, reduce switching costs, and lower barriers to entry for new competitors.
A second theme is the rapidly escalating cost of AI investment. Alphabet reported solid results, but its projected capital expenditure of USD 175–185 billion for this year came in well above expectations and rattled investors. The concern is not isolated. Alphabet and its Big Tech peers are expected to collectively spend more than USD 500 billion on AI this year. The scale of spending is forcing investors to question near-term returns. With monetization timelines uncertain, aggressive outlays are increasingly seen as a drag on free cash flow rather than a guarantee of future dominance.
A third pressure point came from the semiconductor space. AMD suffered its worst single-day decline since 2017 after delivering a lackluster forecast. Expectations had been high for a stronger outlook driven by AI demand and data center expansion. The reaction highlighted that even the chip subsector is not immune to broader market sensitivity. AI exposure alone is no longer sufficient to insulate companies from disappointment if guidance falls short.
In FX markets, the shift in sentiment has favored defensive currencies. Both Dollar and Yen found support in Asian session, while Aussie and kiwi softened. Euro and Sterling were mixed as markets awaited policy decisions from the ECB and the BOE.
Despite the daily moves, weekly performance still shows a different ranking. Aussie remains the strongest currency so far this week, followed by Dollar and Sterling. Yen continues to lag at the bottom, trailed by Swiss Franc and Kiwi, while Euro and Loonie sit in the middle.
In Asia, at the time of writing, Nikkei is down -0.86%. Hong Kong HSI is down -0.95%. China Shanghai SSE is down -0.83%. Singapore Strait Times is down -0.27%. Japan 10-year JGB yield is down -0.012 at 2.239. Overnight, DOW rose 0.53%. S&P 500 fell -0.51%. NASDAQ fell -1.51%. 10-year yield rose 0.001 to 2.750.
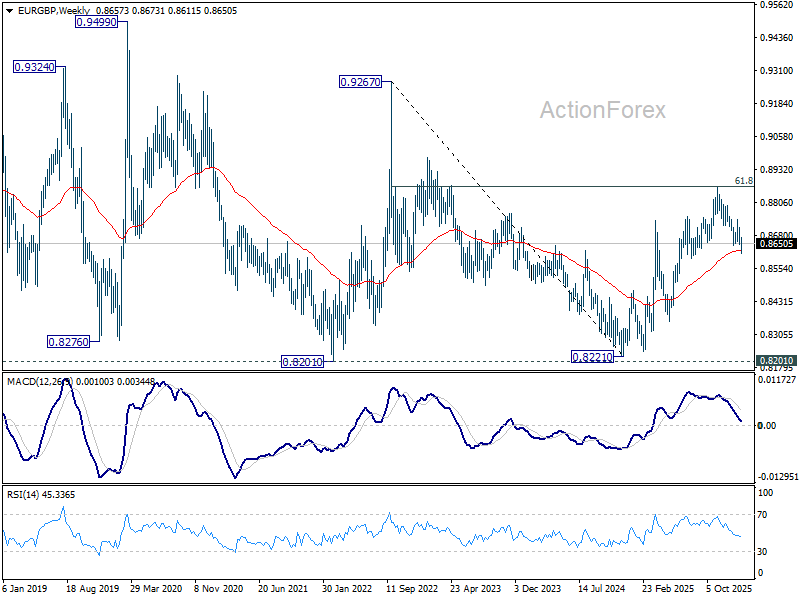
EUR/GBP sits at 0.86 key support, awaits ECB and BoE guidance
EUR/GBP is sitting at a key technical and macro junction around 0.86 level as markets head into rate decisions from the ECB and the BoE. While neither meeting is expected to deliver an immediate policy shift, both carry important signals that could shape expectations and positioning in the cross.
Both central banks are widely expected to stand pat. The ECB is set to keep the deposit rate unchanged at 2.00%, while the BoE is expected to leave Bank Rate steady at 3.75%. With these results fully priced in, the focus is firmly on guidance rather than the decisions themselves.
For the ECB, President Christine Lagarde is likely to repeat that policy is in a “good place.” There is little appetite within the Governing Council to debate changes to borrowing costs in the near term, reinforcing expectations of an extended pause.
Near-term inflation has softened, slipping to just 1.7% in January and potentially easing further in coming months. However, that downside surprise has not meaningfully altered the ECB’s broader inflation outlook. One reason is energy. The recent rebound in oil prices, if sustained, would offset much of the disinflationary impact from Euro strength. That reduces any urgency for the ECB to respond to near-term CPI weakness.
Inflation expectations also remain a concern. The ECB’s latest Consumer Expectations Survey showed five-year inflation expectations rising to 2.4% in December, the highest since the survey began. Shorter- and medium-term expectations also edged higher, supporting the ECB’s view that inflation could reaccelerate.
As a result, the ECB appears comfortable with a prolonged pause, with the next move still more likely to be a hike than a cut. One key focus today will be whether Lagarde references recent Dollar weakness and the EUR/USD exchange rate, particularly around the recently tested 1.20 level.
In the UK, the policy picture is more fractured. The BoE's December rate cut passed by a narrow 5–4 vote, underscoring deep divisions within the Monetary Policy Committee. UK inflation remains elevated, with December’s 3.4% reading the highest among G7 economies. While inflation is expected to move back toward the 2% target, some policymakers remain concerned that underlying pressures are still too strong.
Market pricing reflects that caution. Investors largely expect no move until at least April, and possibly not until July, a much slower pace of easing than seen in 2025. As usual, the MPC vote split will be closely watched for clues on the balance between hawks and doves.
Technically, EUR/GBP is testing a critical support cluster near 0.86. The favored view is that the rebound from the 0.8221 (2024 low was corrective) and may have completed at 0.8863 after failing near 61.8% retracement of 0.9267 (2022 high) to 0.8221 (2024 low) at 0.8867. Decisive break below the 0.8631 support zone (38.2% retracement of 0.8221 to 0.8663 at 0.8618, and 55 W EMA at 0.8625) would confirm bearish reversal.
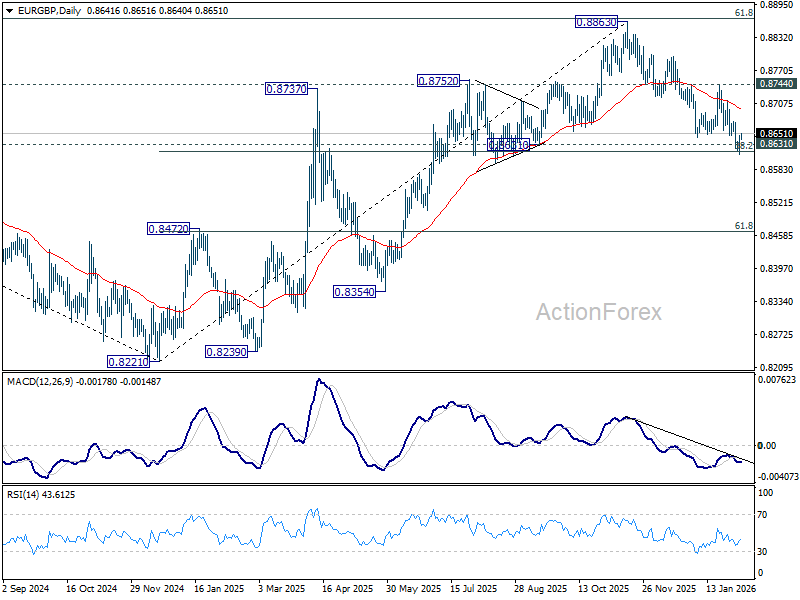
However, downside confirmation is still lacking. If EUR/GBP finds firm support around current levels and stages a convincing rebound, a break above 0.8744 resistance would suggest that the fall from 0.8863 was merely a corrective pullback. In that scenario, the rise from 0.8221 would likely be resuming, with scope to extend toward through 0.8863 towards 0.9267 in the medium term.
Fed's Cook says inflation risks skewed higher, tariffs key wildcard
Fed Governor Lisa Cook said risks are currently “tilted toward higher inflation,” explaining why she supported the FOMC’s decision to hold interest rates steady at last week’s meeting.
Cook noted in a speech that understanding why inflation leveled off in 2025 requires looking beneath the headline. Disinflation has continued in housing services, while non-housing services inflation has also eased, consistent with a labor market that is no longer as tight as before.
The area of concern, however, lies in "core good prices". Cook highlighted a notable pickup in goods inflation, largely driven by last year’s tariff increases on a wide range of imported products.
While anchored inflation expectations suggest tariff effects should amount to a "one-time rise" in the price level, Cook stressed that uncertainty remains high. The "future direction of tariff policy is unclear", and it is uncertain how quickly price increases will fully pass through or whether they risk influencing expectations.
Until clearer evidence emerges that inflation is moving sustainably back toward target, Cook said inflation is "where my focus will be", barring unexpected changes in the labor market.
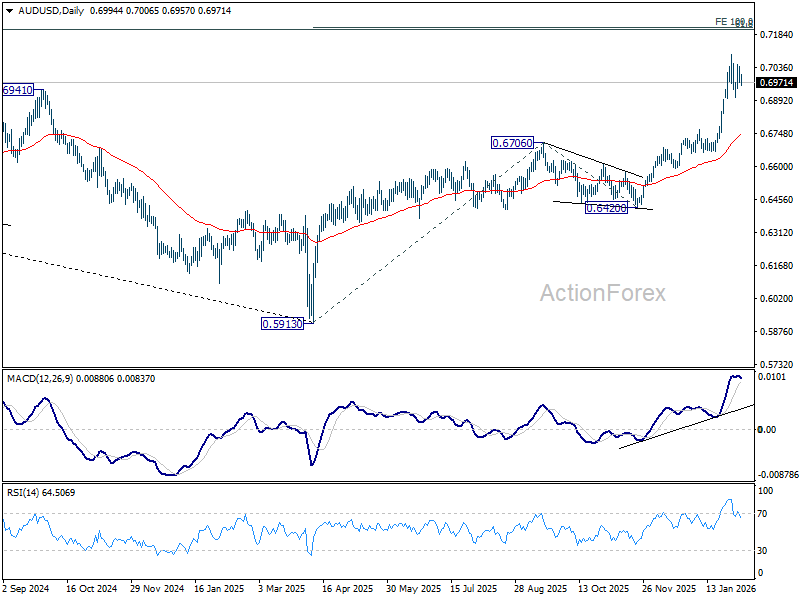
AUD/USD Daily Report
Daily Pivots: (S1) 0.6966; (P) 0.7004; (R1) 0.7037; More...
AUD/USD dips mildly today as range trading continues and intraday bias stays neutral. Further rise is still in favor. On the upside, break of 0.7093 will extend larger up trend to 100% projection of 0.5913 to 0.6706 from 0.6420 at 0.7213 next. However, break of 0.6907 will bring lengthier consolidations before rally resumption. Deeper pullback would then be seen to 38.2% retracement of 0.6420 to 0.7093 at 0.6836.
In the bigger picture, current development argues that rise from 0.5913 (2024 low) is reversing whole down trend from 0.8006 (2021 high). Further rally should be seen to 61.8% retracement of 0.8006 to 0.5913 at 0.7206. This will remain the favored case as long as 0.6706 resistance turned support holds, even in case of deep pullback.
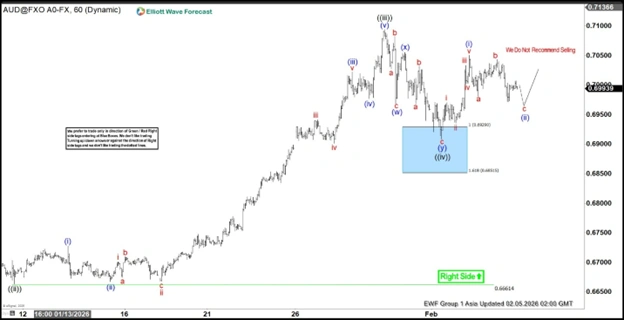
AUD/USD Sequence Points Toward 0.7200
The AUD/USD pair continues to display an incomplete bullish sequence from the April 7, 2025 low, suggesting further upside potential. The structure favors continuation toward the 100% Fibonacci extension target at 0.72. In the short term, the cycle from the November 21 low remains in progress, unfolding as a five-wave Elliott Wave impulse. This development provides a clear framework for traders monitoring the pair’s near-term trajectory.
From the November low, wave ((i)) advanced and concluded at 0.6766. A corrective pullback in wave ((ii)) followed, ending at 0.666 as illustrated in the one-hour chart. The pair then resumed its upward momentum in wave ((iii)), which itself subdivided into a smaller impulsive structure. Within this sequence, wave (i) terminated at 0.6727, while wave (ii) retraced to 0.6667. The subsequent rally in wave (iii) reached 0.7022, before a modest pullback in wave (iv) settled at 0.6976. Finally, wave (v) advanced to 0.7094, completing wave ((iii)) in full alignment with Elliott Wave guidelines.
Afterward, the pair corrected in wave ((iv)), which ended at 0.6908. It then turned higher again, beginning wave ((v)). Looking ahead, the expectation remains for AUDUSD to extend further gains. Any pullback should ideally find support within a three- or seven-swing corrective structure, provided the pivot at 0.666 stays intact. This condition preserves the bullish outlook and keeps the path open toward the projected 0.72 target.
AUD/USD 60-minute chart
AUD/USD Elliott Wave [Video]
https://www.youtube.com/watch?v=7IZphGjkD0g
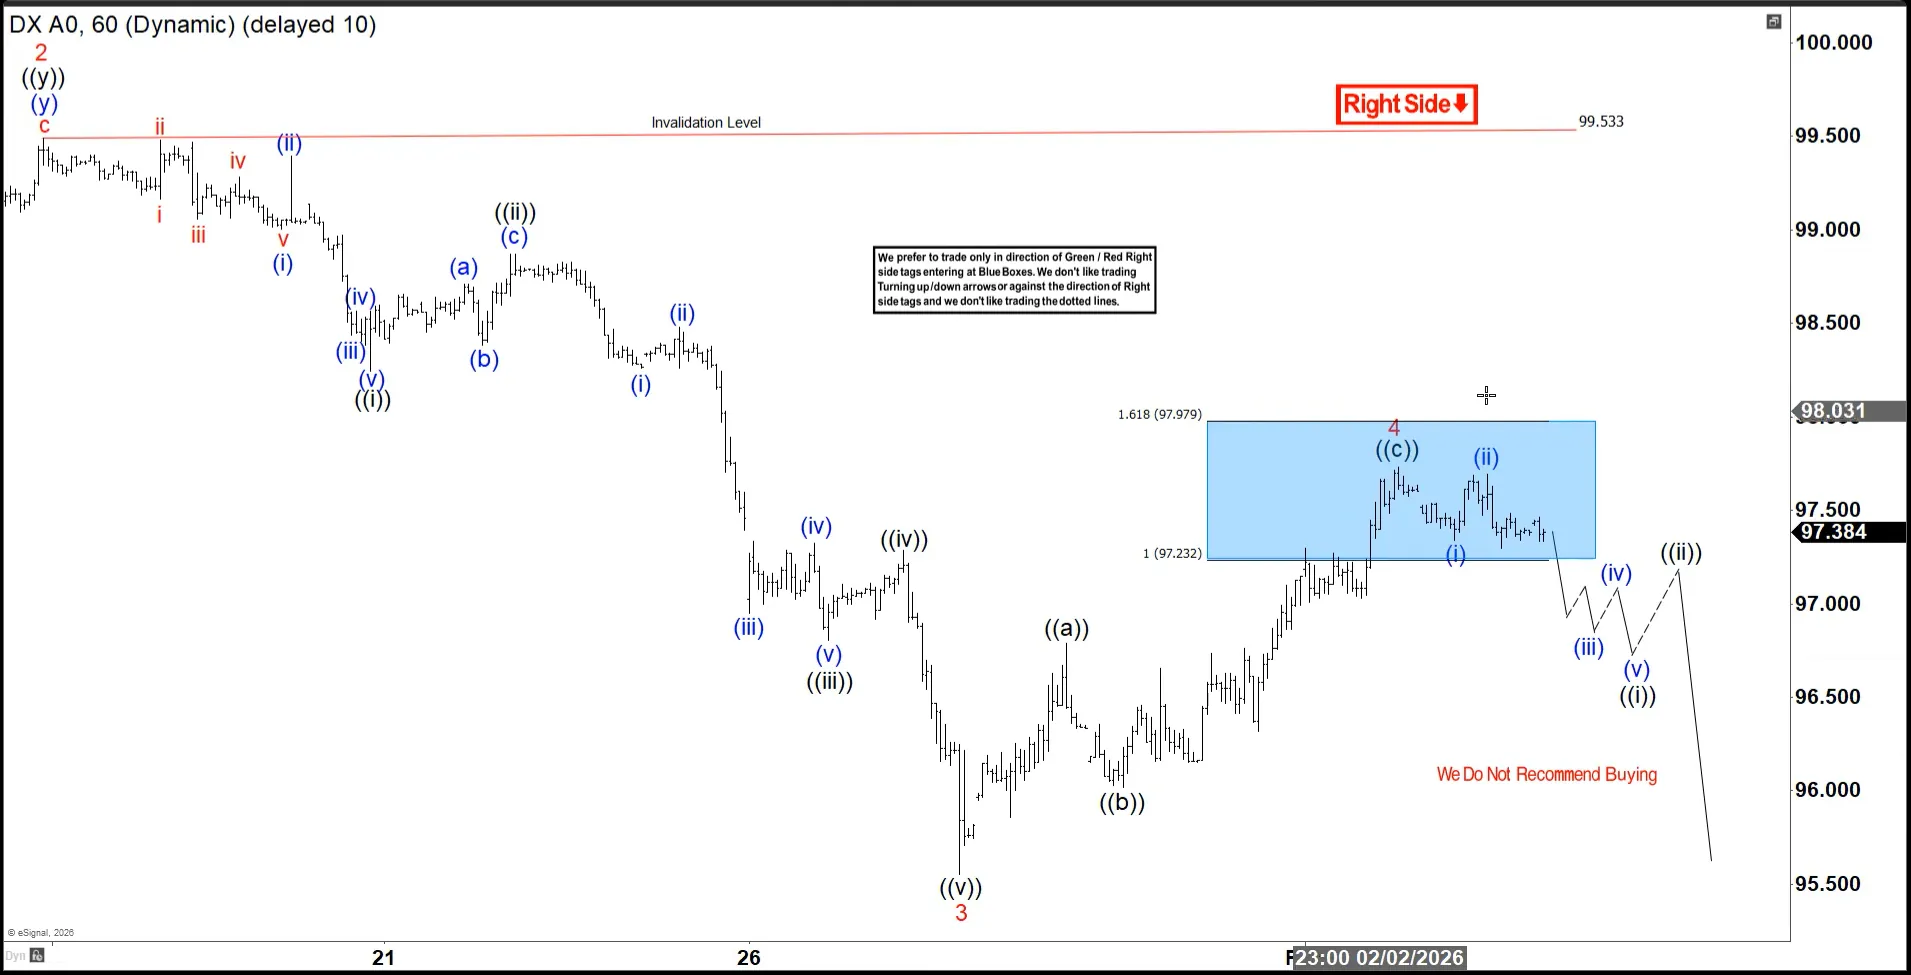
Dollar Index (DXY) Progressing Toward Final Stages of Wave 5
The Dollar Index (DXY) continues to unfold from the September 2022 peak as a five‑wave cycle, with the structure now approaching the conclusion of wave ((5)). Wave ((4)) of this impulse move ended at 100.395 on November 21, 2025, after which the Dollar resumed its decline. The Index currently displays only a clear three‑swing sequence down from the November 21 high, which strongly suggests that the downside remains incomplete. From wave ((4)), wave 1 terminated at 97.75, while wave 2 retraced higher to 99.53, as reflected in the one‑hour chart. The Index then resumed lower in wave 3.
Within wave 3, wave ((i)) ended at 98.24, followed by a rally in wave ((ii)) that peaked at 98.86. The decline continued with wave ((iii)) reaching 96.8, while wave ((iv)) recovered modestly to 97.28. Wave ((v)) then pushed lower to 95.55, completing wave 3 at a higher degree. The Index corrected in wave 4, which unfolded as a zigzag structure. From the wave 3 low, wave ((a)) advanced to 96.78, wave ((b)) pulled back to 96.01, and wave ((c)) rose to 97.73, completing wave 4. The Dollar has since resumed its decline in wave 5.
Near term, as long as the pivot at 99.53 remains intact, the expectation is for the Dollar to extend lower. The potential target lies within the 123.6% to 161.8% external retracement zone, which aligns at 94.2–95.5. This projection reinforces the view that the bearish cycle is still in progress and that further weakness is likely before the larger structure completes.
Dollar Index (DXY) 60 minute chart
DXY Elliott Wave video:
https://www.youtube.com/watch?v=Kr__vGDItPY
EUR/GBP sits at 0.86 key support, awaits ECB and BoE guidance
EUR/GBP is sitting at a key technical and macro junction around 0.86 level as markets head into rate decisions from the ECB and the BoE. While neither meeting is expected to deliver an immediate policy shift, both carry important signals that could shape expectations and positioning in the cross.
Both central banks are widely expected to stand pat. The ECB is set to keep the deposit rate unchanged at 2.00%, while the BoE is expected to leave Bank Rate steady at 3.75%. With these results fully priced in, the focus is firmly on guidance rather than the decisions themselves.
For the ECB, President Christine Lagarde is likely to repeat that policy is in a “good place.” There is little appetite within the Governing Council to debate changes to borrowing costs in the near term, reinforcing expectations of an extended pause.
Near-term inflation has softened, slipping to just 1.7% in January and potentially easing further in coming months. However, that downside surprise has not meaningfully altered the ECB’s broader inflation outlook. One reason is energy. The recent rebound in oil prices, if sustained, would offset much of the disinflationary impact from Euro strength. That reduces any urgency for the ECB to respond to near-term CPI weakness.
Inflation expectations also remain a concern. The ECB’s latest Consumer Expectations Survey showed five-year inflation expectations rising to 2.4% in December, the highest since the survey began. Shorter- and medium-term expectations also edged higher, supporting the ECB’s view that inflation could reaccelerate.
As a result, the ECB appears comfortable with a prolonged pause, with the next move still more likely to be a hike than a cut. One key focus today will be whether Lagarde references recent Dollar weakness and the EUR/USD exchange rate, particularly around the recently tested 1.20 level.
In the UK, the policy picture is more fractured. The BoE's December rate cut passed by a narrow 5–4 vote, underscoring deep divisions within the Monetary Policy Committee. UK inflation remains elevated, with December’s 3.4% reading the highest among G7 economies. While inflation is expected to move back toward the 2% target, some policymakers remain concerned that underlying pressures are still too strong.
Market pricing reflects that caution. Investors largely expect no move until at least April, and possibly not until July, a much slower pace of easing than seen in 2025. As usual, the MPC vote split will be closely watched for clues on the balance between hawks and doves.
Technically, EUR/GBP is testing a critical support cluster near 0.86. The favored view is that the rebound from the 0.8221 (2024 low was corrective) and may have completed at 0.8863 after failing near 61.8% retracement of 0.9267 (2022 high) to 0.8221 (2024 low) at 0.8867. Decisive break below the 0.8631 support zone (38.2% retracement of 0.8221 to 0.8663 at 0.8618, and 55 W EMA at 0.8625) would confirm bearish reversal.
However, downside confirmation is still lacking. If EUR/GBP finds firm support around current levels and stages a convincing rebound, a break above 0.8744 resistance would suggest that the fall from 0.8863 was merely a corrective pullback. In that scenario, the rise from 0.8221 would likely be resuming, with scope to extend toward through 0.8863 towards 0.9267 in the medium term.
Bitcoin Lingers In Red With Recovery Efforts Losing Steam
Key Highlights
- Bitcoin failed to recover above $80,000 and remains at risk of another decline.
- BTC/USD faces hurdles near $78,750 and $82,400 on the 4-hour chart.
- Ethereum also dipped below $2,300 and $2,250.
- Gold started another increase and traded above $5,000.
Bitcoin Price Technical Analysis
Bitcoin price attempted a recovery wave from $72,800 against the US Dollar. BTC failed to climb above $78,000 and remained in the red zone.
Looking at the 4-hour chart, the price dipped below $76,000 and remained well below the 23.6% Fib retracement level of the key decline from the $97,944 swing high to the $72,826 low. The price is also well below the 100 simple moving average (red, 4-hour) and the 200 simple moving average (green, 4-hour).
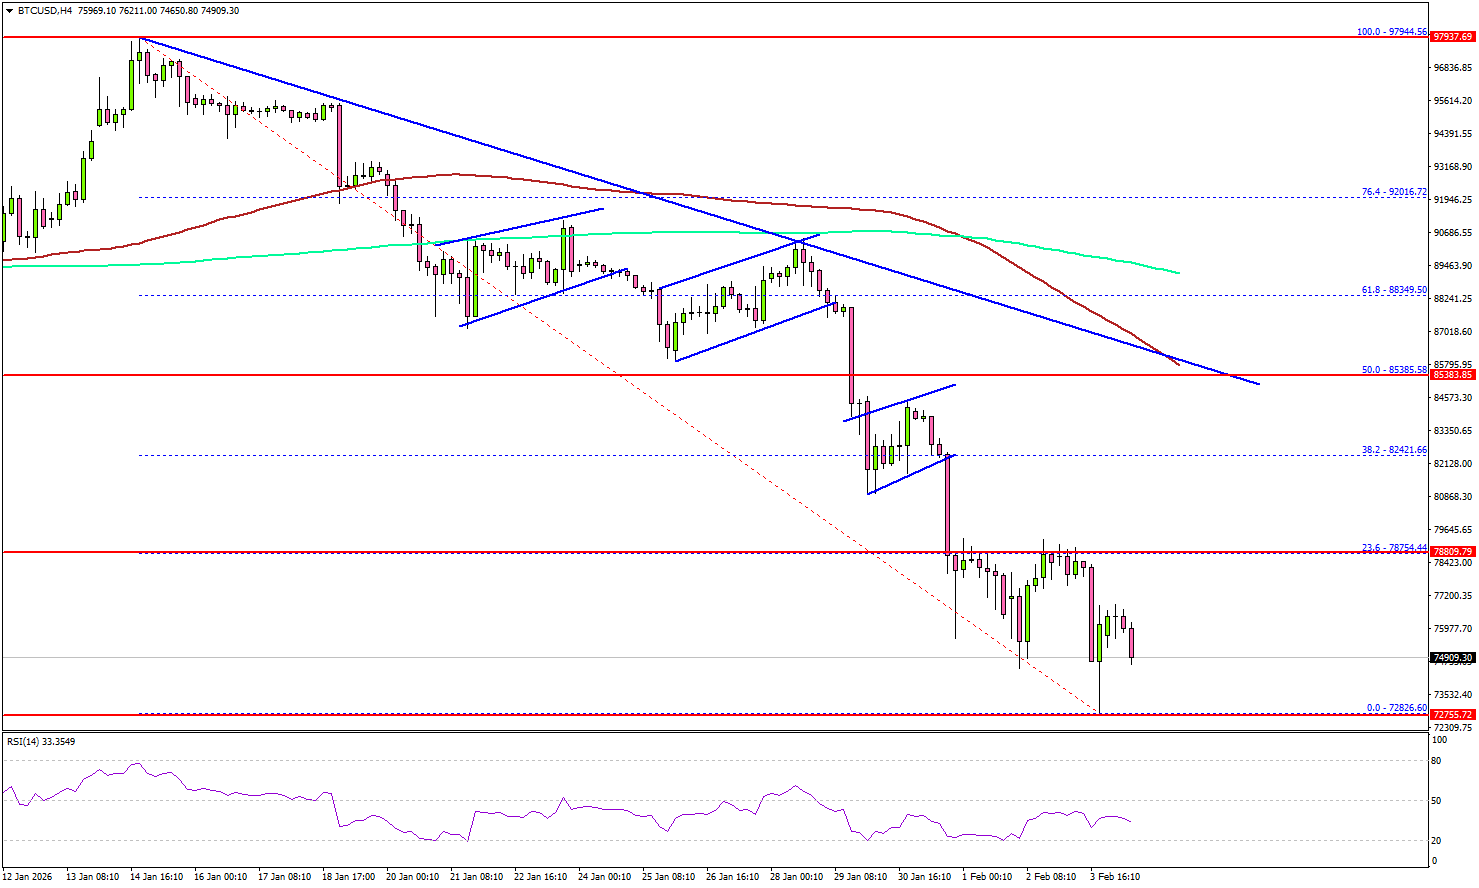
Immediate support sits at $73,200. The first key support could be $72,500. A downside break below $72,500 might start another decline. The next major support is $70,000, below which BTC could decline toward $68,000.
If there is a recovery wave, the price could face resistance at $77,500. The first key hurdle is $78,750. A close above $78,750 could send the price toward $82,400.
The main resistance could be $85,350 or the 50% Fib retracement level of the key decline from the $97,944 swing high to the $72,826 low. A close above $85,350 and then the 100 simple moving average (red, 4-hour) could start a steady increase. In the stated case, the price may perhaps rise toward the $90,000 level. Any more gains might call for a test of $95,000.
Looking at Ethereum, the price also reacted to the downside below $2,300. The bears might now aim for a drop below $2,120.
Today’s Key Economic Releases
- BoE Interest Rate Decision - Forecast 3.75%, versus 3.75% previous.
- ECB Interest Rate Decision - Forecast 2%, versus 2% previous.
- US Initial Jobless Claims - Forecast 212K, versus 209K previous.
Fed’s Cook says inflation risks skewed higher, tariffs key wildcard
Fed Governor Lisa Cook said risks are currently “tilted toward higher inflation,” explaining why she supported the FOMC’s decision to hold interest rates steady at last week’s meeting.
Cook noted in a speech that understanding why inflation leveled off in 2025 requires looking beneath the headline. Disinflation has continued in housing services, while non-housing services inflation has also eased, consistent with a labor market that is no longer as tight as before.
The area of concern, however, lies in "core good prices". Cook highlighted a notable pickup in goods inflation, largely driven by last year’s tariff increases on a wide range of imported products.
While anchored inflation expectations suggest tariff effects should amount to a "one-time rise" in the price level, Cook stressed that uncertainty remains high. The "future direction of tariff policy is unclear", and it is uncertain how quickly price increases will fully pass through or whether they risk influencing expectations.
Until clearer evidence emerges that inflation is moving sustainably back toward target, Cook said inflation is "where my focus will be", barring unexpected changes in the labor market.
WTI in Focus with US-Iran Talks Cancelled – US Oil Outlook
- Oil rallies to $65 from the latest new: Iran-US talks cancelled.
- WTI lost some ground after talks were announced but tensions are coming back.
- Exploring an in-depth Technical Analysis of the commodity.
WTI Oil is facing renewed volatility following the latest geopolitical developments:
US–Iran talks scheduled for Friday in Turkey have been cancelled.
Disagreements had emerged between Iranian and US demands. Washington continued to insist on Iran abandoning its ballistic missile program, while Tehran only signaled openness on the nuclear issue.
Markets had initially rallied on the prospect of talks, while oil shed much of its geopolitical premium after the weekend break, gapping lower from $66.00 to $61.50.
But in the current environment, it was unlikely to remain that simple for long.
Iranian officials have reiterated that they remain open to discussions, yet the US now appears to be weighing its options, including preparations for potential intervention.
The core debate centers on whether an intervention could realistically lead to regime change and how escalation might be avoided to prevent a prolonged conflict.
Since the cancellation headline, WTI has jumped back toward $65 and is holding near its relative highs as traders brace for a possible worsening of the conflict.
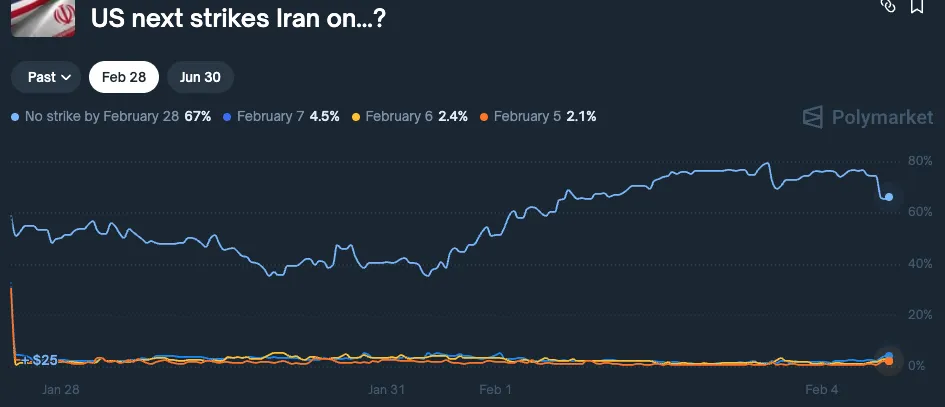
Odds for a US strike in Iran – Source: Polymarket. February 4, 2026
Polymarket-based odds for a strike before February 28 are just below 30%.
Let's dive into a bottom-up multi-timeframe analysis of WTI (US) Oil to determine whether technicals point to continued upside or if we are reaching a maximum.
We will commence with intraday charts to explore the latest action and see how it develops to Daily charts.
US Oil Bottom-Up Multi-Timeframe Analysis
1H Chart
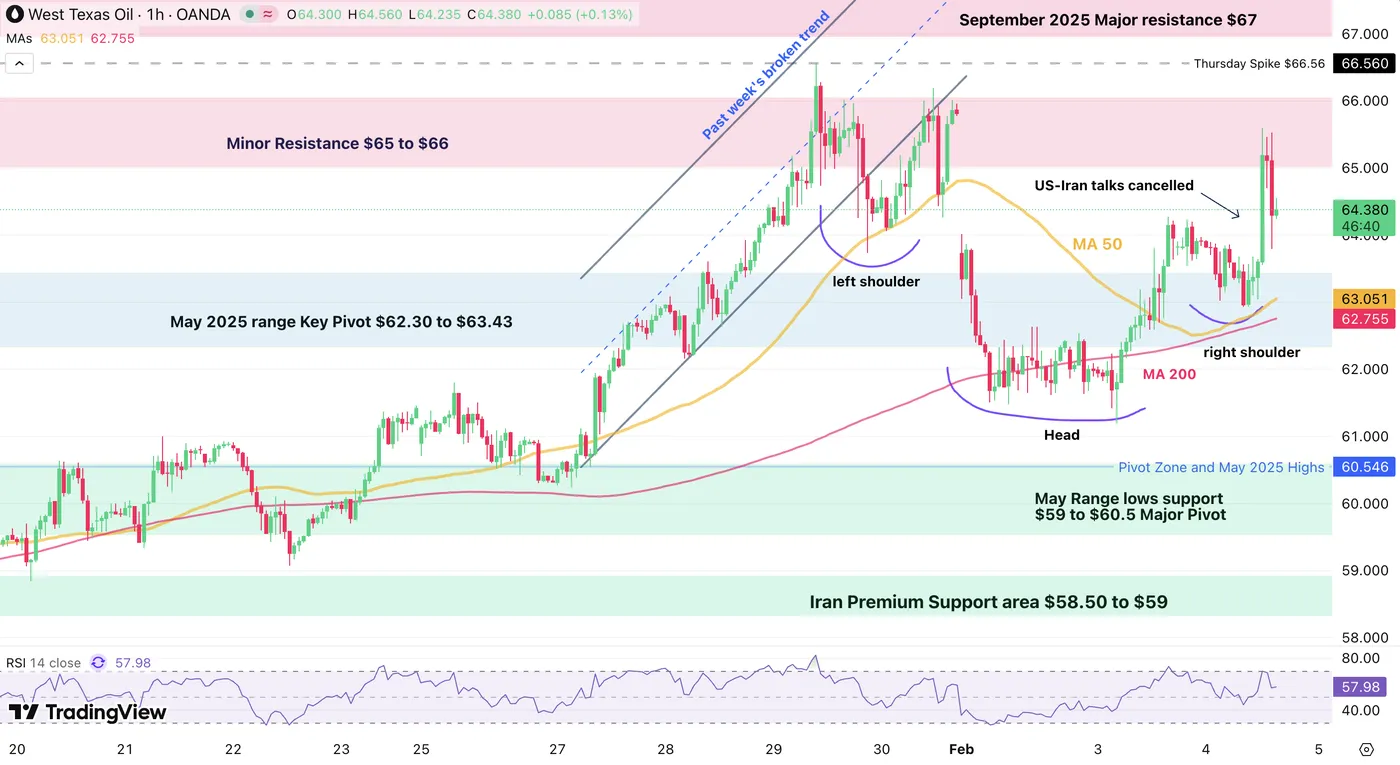
WTI Oil 1H Chart – February 4, 2026. Source: TradingView
Oil just bounced higher by 3% on the headlines but got rejected right in the middle of its $65 to $66 Key resistance.
Despite the rejection, bears aren't for now able to bring back the commodity to the pre-headline levels so the current pullback just looks like profit-taking.
Some warning signs are arising however with the formation of an inverted Head & Shoulders pattern which could hint to $70 in WTI (see more on the 4H chart just below)
As long as the tensions don't aggravate, expect a $63 to $66 range.
Any close above $66 will be accompanied with some war headlines (particularly if the past week's $66.56 highs break).
WTI 4H Chart and Technical Levels
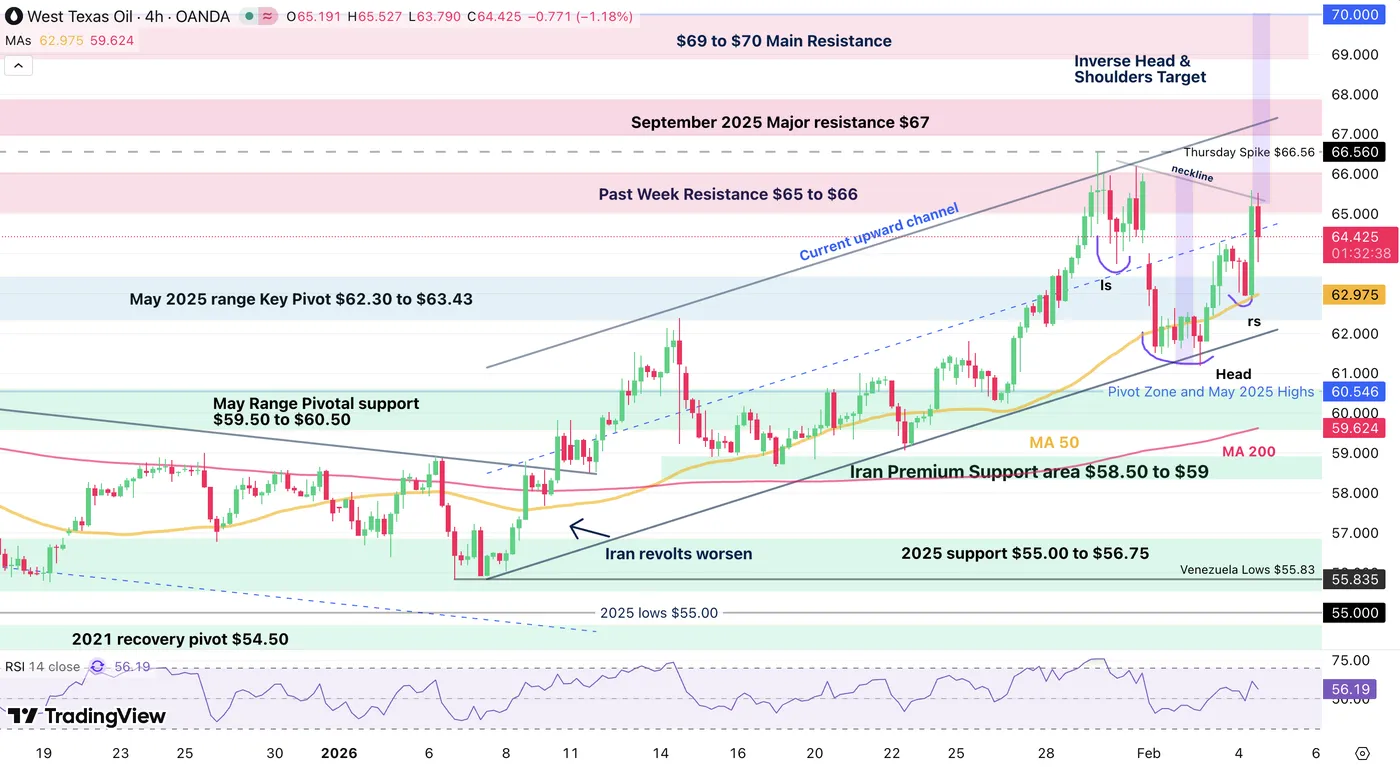
WTI Oil 4H Chart – February 4, 2026. Source: TradingView
It is difficult to discern momentum in Oil when up and down spikes are so common.
Two things are clear from that timeframe:
- WTI bulls are following closely the 4H 50-period MA to push prices higher
- The action is holding within an upward channel, but any news could lead to an upside breakout
The measured move target from the inverted Head & shoulders is shown in purple.
WTI Technical Levels
Levels to place on your WTI charts:
Resistance Levels
- Past week Spike $66.56
- Minor Resistance $65 to $66 (daily highs $65.55)
- September 2025 Major resistance $67 (could get breached if US attacks)
- Psychological Resistance $70 and Inverted H&S target
- $78.43 12-Day War highs
Support Levels
- $64.00 Key psychological support
- $63.00 4H-50 MA
- May 2025 range Key Pivot $62.30 to $63.43
- May Range lows support $59 to $60.5 Major support
- Iran Premium Support area $58.50 to $59
WTI Daily Chart
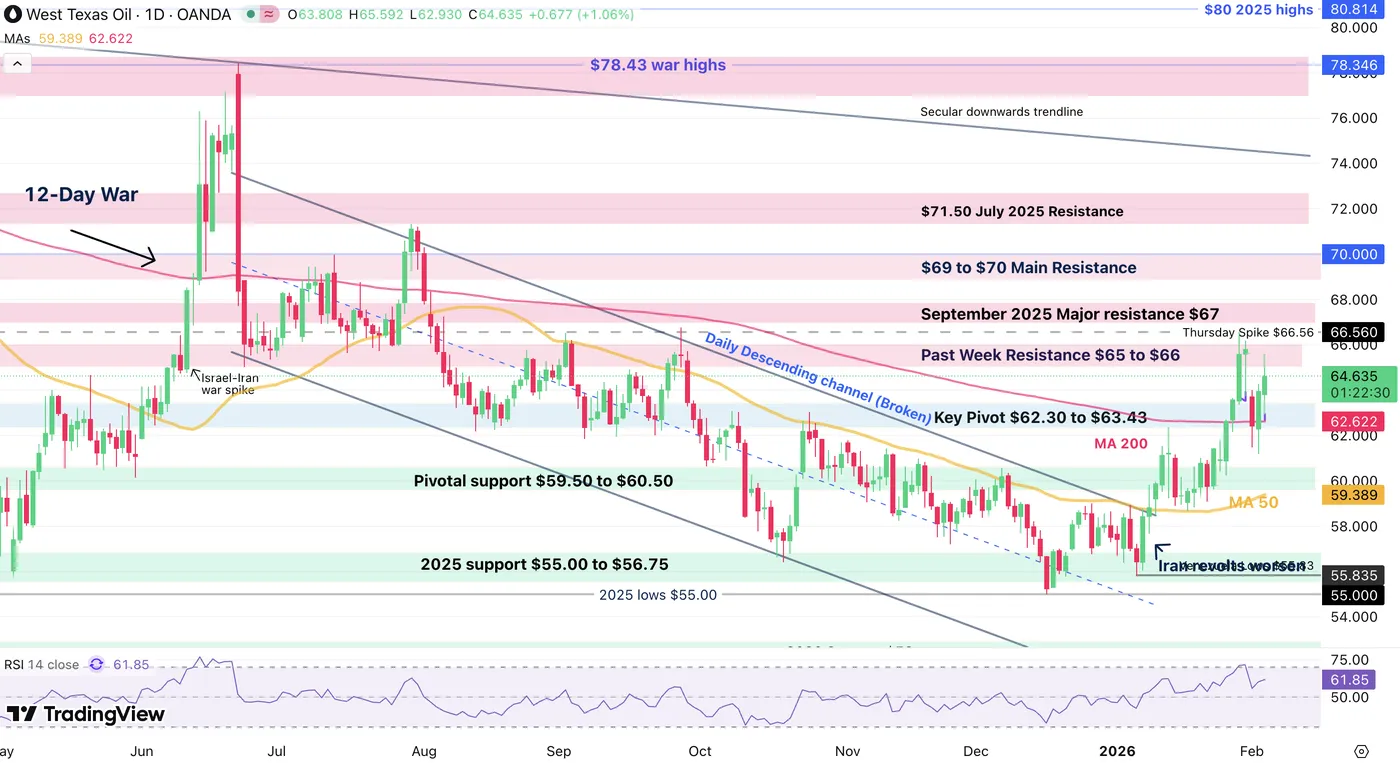
WTI Oil Daily Chart – February 4, 2026. Source: TradingView
Now trading well above its 200-Day Moving Average, Oil is turning increasingly bullish.
Fundamental factors over greener energy are still weighing on the long-run trajectory for the commodity, but geopolitical factors say otherwise.
Trader are pushing the commodity towards the 50% retracement of the 12-Day War from June 2025.
Any close above $66.60 would look at high-paced continuation. This would of course be contingent on tensions remaining elevated.
Eco Data 2/5/26
| GMT | Ccy | Events | Act | Cons | Prev | Rev |
|---|---|---|---|---|---|---|
| 00:30 | AUD | Trade Balance (AUD) Dec | 3.37B | 3.45B | 2.94B | 2.60B |
| 07:00 | EUR | Germany Factory Orders M/M Dec | 7.80% | -1.30% | 5.60% | 5.70% |
| 07:45 | EUR | France Industrial Output M/M Dec | -0.70% | 0.10% | -0.10% | 0.10% |
| 09:30 | GBP | Construction PMI Jan | 46.4 | 42 | 40.1 | |
| 10:00 | EUR | Eurozone Retail Sales M/M Dec | -0.50% | -0.20% | 0.20% | |
| 12:00 | GBP | BoE Interest Rate Decision | 3.75% | 3.75% | 3.75% | |
| 12:00 | GBP | MPC Official Bank Rate Votes | 0--4--5 | 0--2--7 | 0--5--4 | |
| 13:15 | EUR | ECB Main Refinancing Rate | 2.15% | 2.15% | 2.15% | |
| 13:15 | EUR | ECB Rate On Deposit Facility | 2.00% | 2.00% | 2.00% | |
| 13:30 | USD | Initial Jobless Claims (Jan 30) | 231K | 210K | 209K | |
| 13:45 | EUR | ECB Press Conference | ||||
| 15:30 | USD | Natural Gas Storage (Jan 30) | -360B | -379B | -242B |
| 00:30 | AUD |
| Trade Balance (AUD) Dec | |
| Actual | 3.37B |
| Consensus | 3.45B |
| Previous | 2.94B |
| Revised | 2.60B |
| 07:00 | EUR |
| Germany Factory Orders M/M Dec | |
| Actual | 7.80% |
| Consensus | -1.30% |
| Previous | 5.60% |
| Revised | 5.70% |
| 07:45 | EUR |
| France Industrial Output M/M Dec | |
| Actual | -0.70% |
| Consensus | 0.10% |
| Previous | -0.10% |
| Revised | 0.10% |
| 09:30 | GBP |
| Construction PMI Jan | |
| Actual | 46.4 |
| Consensus | 42 |
| Previous | 40.1 |
| 10:00 | EUR |
| Eurozone Retail Sales M/M Dec | |
| Actual | -0.50% |
| Consensus | -0.20% |
| Previous | 0.20% |
| 12:00 | GBP |
| BoE Interest Rate Decision | |
| Actual | 3.75% |
| Consensus | 3.75% |
| Previous | 3.75% |
| 12:00 | GBP |
| MPC Official Bank Rate Votes | |
| Actual | 0--4--5 |
| Consensus | 0--2--7 |
| Previous | 0--5--4 |
| 13:15 | EUR |
| ECB Main Refinancing Rate | |
| Actual | 2.15% |
| Consensus | 2.15% |
| Previous | 2.15% |
| 13:15 | EUR |
| ECB Rate On Deposit Facility | |
| Actual | 2.00% |
| Consensus | 2.00% |
| Previous | 2.00% |
| 13:30 | USD |
| Initial Jobless Claims (Jan 30) | |
| Actual | 231K |
| Consensus | 210K |
| Previous | 209K |
| 13:45 | EUR |
| ECB Press Conference | |
| Actual | |
| Consensus | |
| Previous | |
| 15:30 | USD |
| Natural Gas Storage (Jan 30) | |
| Actual | -360B |
| Consensus | -379B |
| Previous | -242B |