Sample Category Title
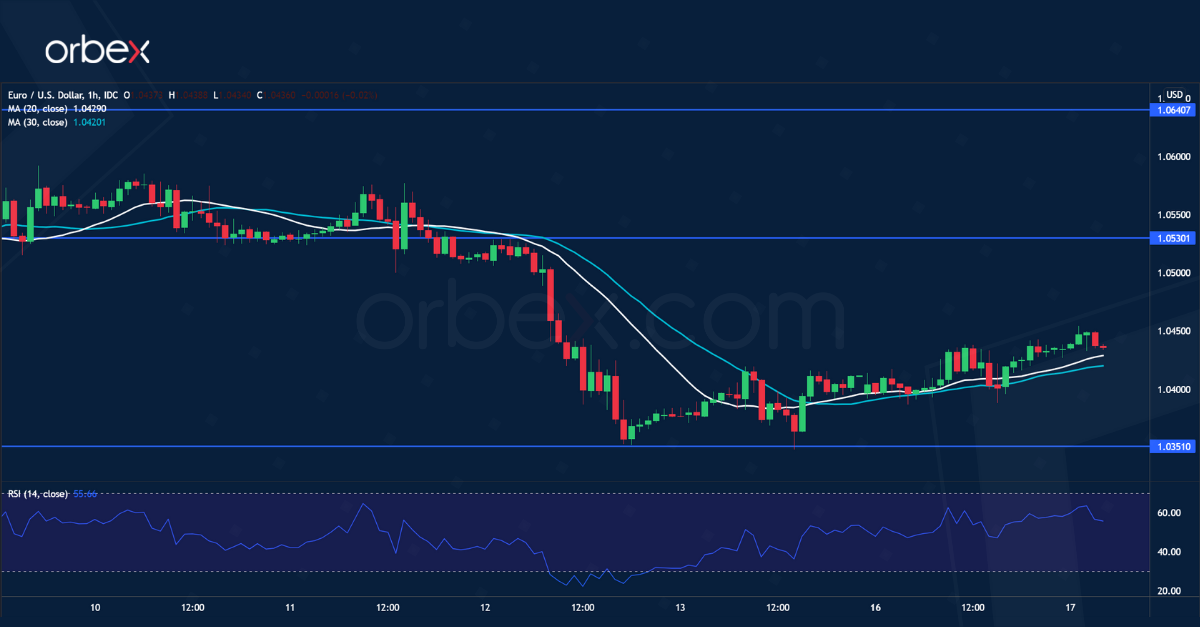
EUR/USD Goes Sideways
The euro edged higher after an ECB official supported the idea of a stronger currency to combat inflation. The pair is bouncing off December 2017’s lows at 1.0350. The RSI’s oversold situation on both daily and hourly charts led some sellers to cover as a wave of profit-taking could help the euro snap back from this demand zone. The bias remains down unless the bulls lift the first hurdle (1.0530) from the latest sell-off. 1.0640 on the 30-day moving average is a major resistance to clear before a bullish reversal could happen.
GBPUSD Gains Momentum Near 1.2400 in Very Short-Term
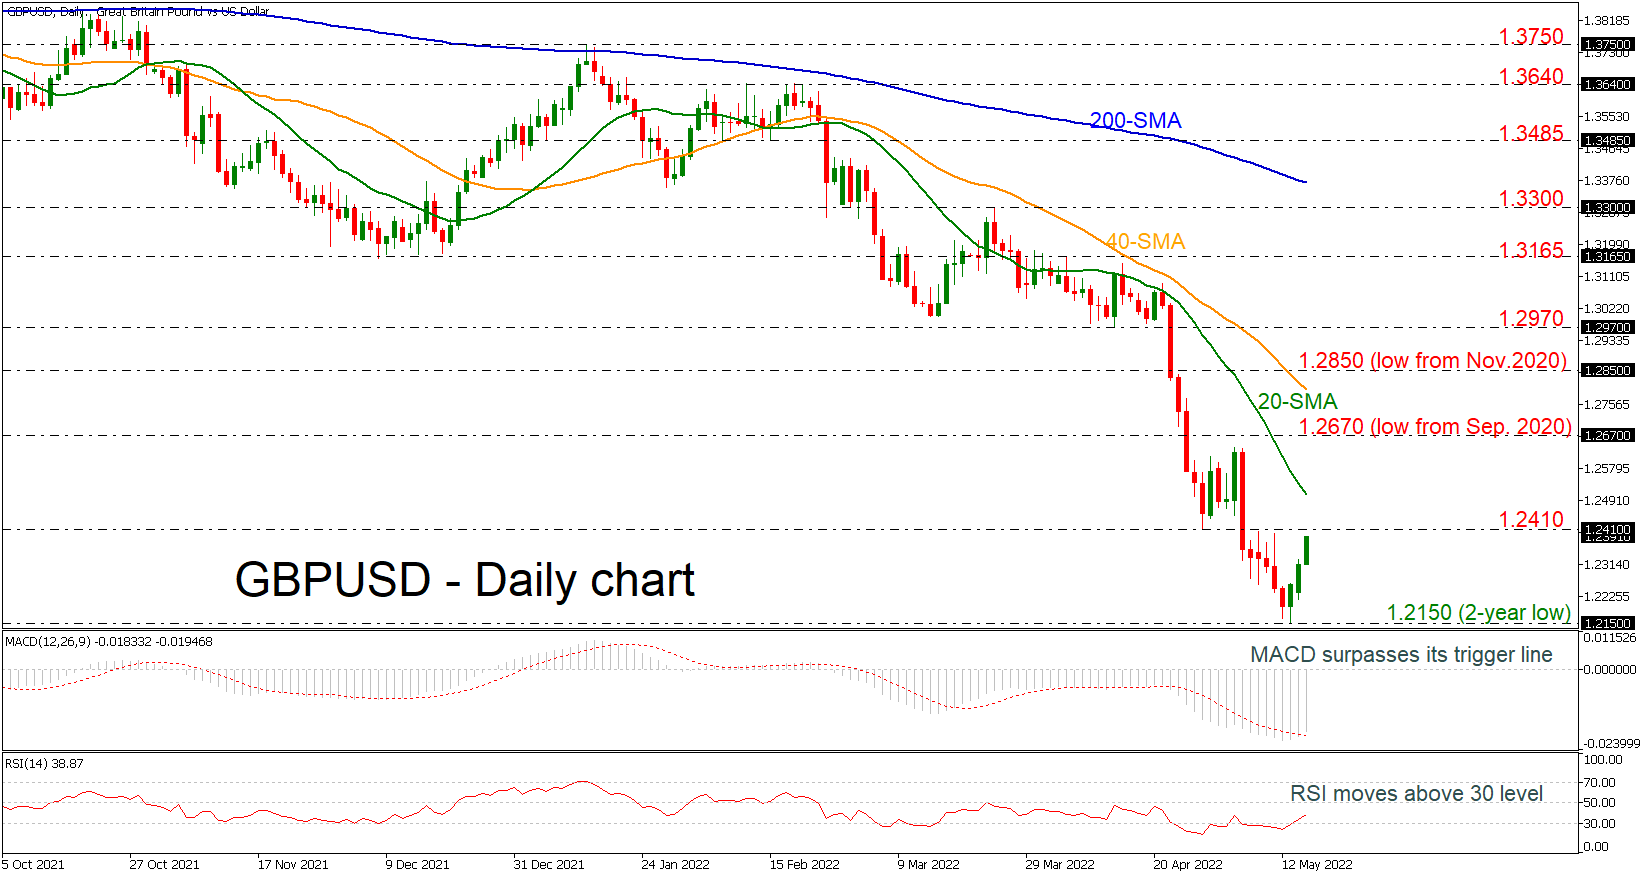
GBPUSD is gaining ground after the sell-off towards the two-year low of 1.2120 and is moving towards the inside swing low from April 28 at 1.2410. The technical indicators are mirroring the current bullish bias in the very short-term, as the MACD is jumping above its trigger line in the negative region, while the RSI is pointing up from the oversold territory.
A decisive close above the immediate resistance could reduce negative risks, producing a bullish extension towards the 20-day simple moving average (SMA) at 1.2507. Beyond that, traders will target the low from September 2020 at 1.2670 ahead of the 40-day SMA at 1.2795 and the bottom from November 2020 at 1.2850.
Otherwise, if sellers take the lead again, the pair may pull back to test the nearby support of the two-year trough of 1.2150. Falling lower, the 1.2070 support, taken from the low in May 2020 may be the next target for sellers.
In brief, GBPUSD is strengthening its bullish move in the very short-term, but some caution is warranted as the price is swiftly approaching the crucial boundary set around 1.2400.
EUR/USD Daily Outlook
Daily Pivots: (S1) 1.0402; (P) 1.0422 (R1) 1.0455; More...
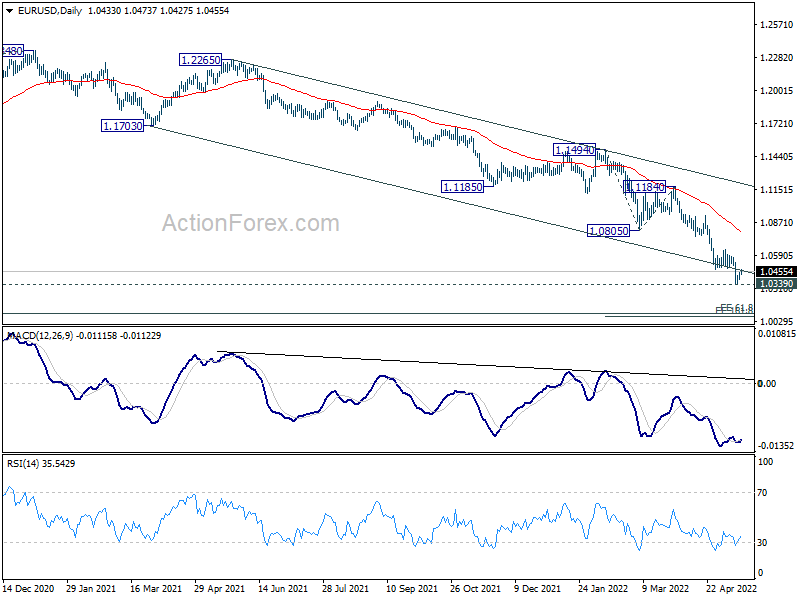
Intraday bias in EUR/USD remains neutral as consolidation from 1.0348 is extending. Outlook also stays bearish as long as 1.0641 resistance holds. Decisive break of 1.0339 will carry larger bearish implication and target 161.8% projection of 1.1494 to 1.0805 from 1.1184 at 1.0069. Nevertheless, break of 1.0641 will indicate short term bottoming and turn bias back to the upside for rebound.
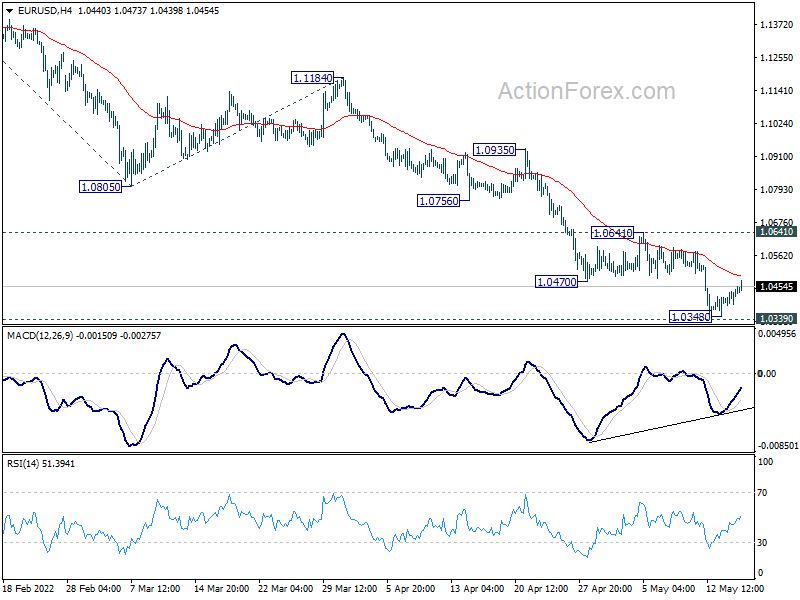
In the bigger picture, break of medium term channel support suggests downside acceleration. Current decline from 1.2348 (2021 high) is probably resuming long term down trend from 1.6039 (2008 high). Decisive break of 1.0339 will confirm this bearish case. Next target is 61.8% projection of 1.3993 to 1.0339 from 1.2348 at 1.0090. This will now remain the favored case as long as 1.0805 support turned resistance holds.
GBP/USD Daily Outlook
Daily Pivots: (S1) 1.2250; (P) 1.2290; (R1) 1.2362; More..
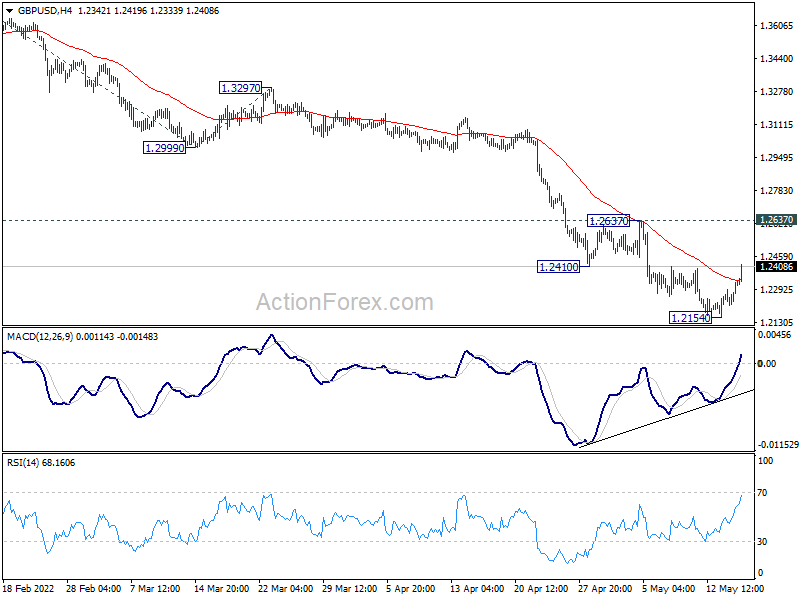
GBP/USD's recovery from 1.2154 extends higher today but stays below 1.2637 resistance. Intraday bias remains neutral first and outlook remains bearish. On the downside, break of 1.2154 will resume the down trend from 1.4248 to 200% projection of 1.3641 to 1.2999 from 1.3297 at 1.2013 next. Nevertheless, considering bullish convergence condition in 4 hour MACD, break of 1.2637 will confirm short term bottoming, and turn bias back to the upside for stronger rebound.
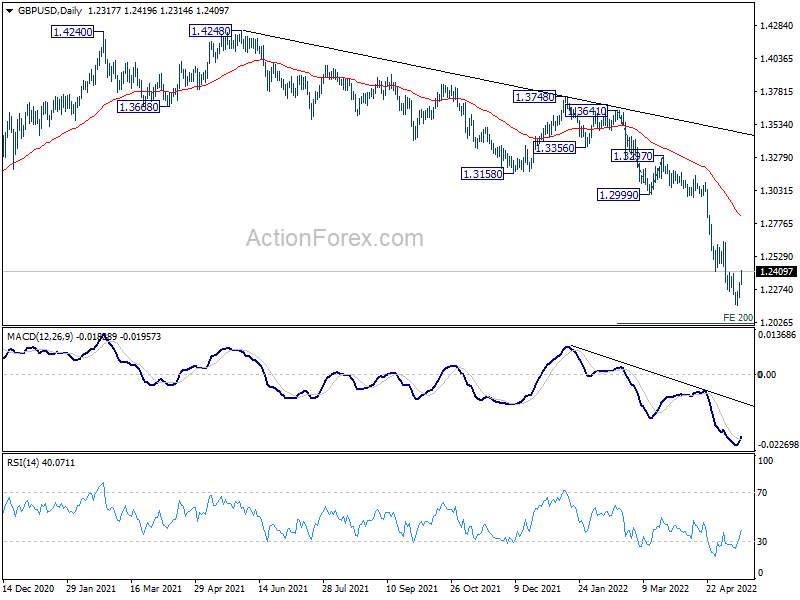
In the bigger picture, based on current momentum, fall from 1.4248 (2018 high) at least at the same degree as the rise from 1.1409 (2020 low). That is, fall from 1.4248 could be a leg inside the pattern from 1.1409, or resuming the longer term down trend. In either case, deeper decline is expected as long as 1.2999 support turned resistance holds. Next target is 1.1409 low.
USD/CHF Daily Outlook
Daily Pivots: (S1) 0.9997; (P) 1.0030; (R1) 1.0053; More....
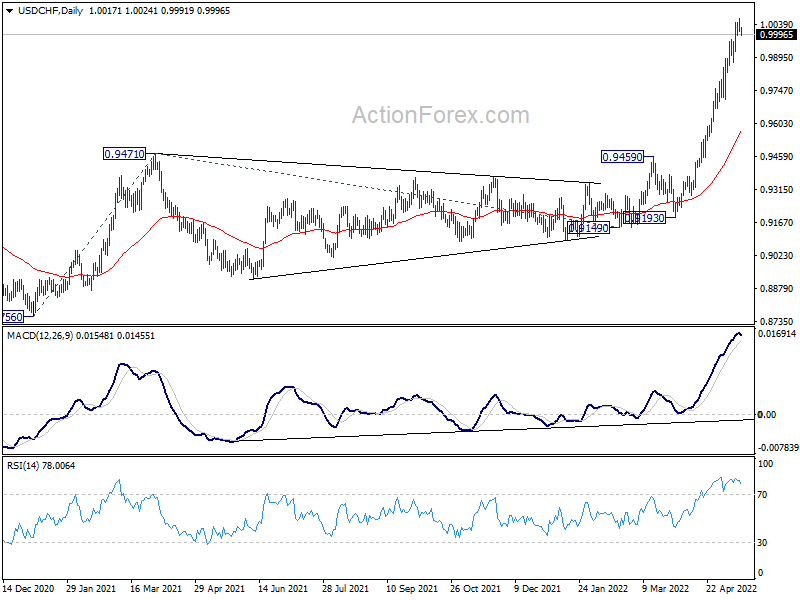
Intraday bias in USD/CHF is turned neutral first with current retreat. But further rally is expected with 0.9871 support intact. Above 1.0063 will start next medium term projection level at 1.0306. However, considering bearish divergence condition in 4 hour MACD, break of 0.9871 support will indicate short term topping, and turn bias to the downside for pull back.
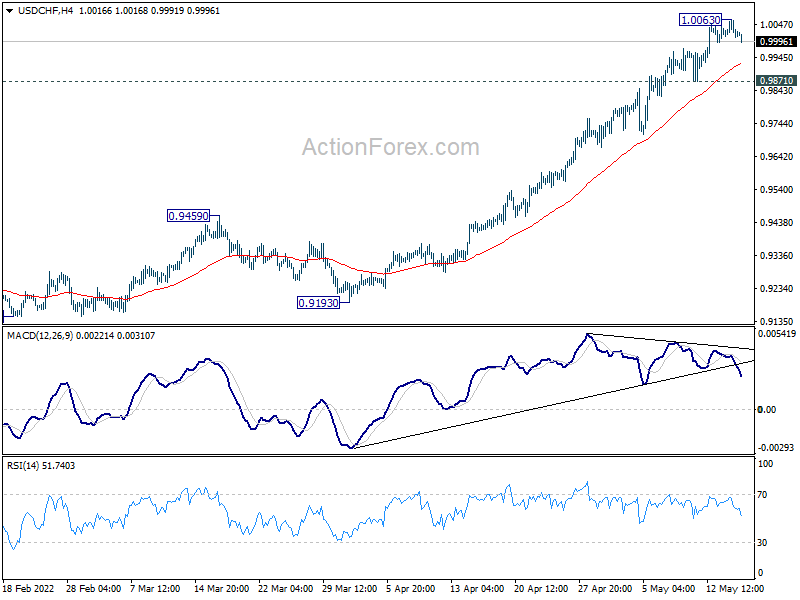
In the bigger picture, down trend from 1.0342 (2016 high) should have completed with three waves down to 0.8756 (2021 low) already. Rise from 0.8756 is likely a medium term up trend of its own. Next target is 161.8% projection of 0.8756 to 0.9471 from 0.9149 at 1.0306, which is close to 1.0342 (2016 high). This will remain the favored case as long as 0.9459 resistance turned support holds.
USD/JPY Daily Outlook
Daily Pivots: (S1) 128.68; (P) 129.15; (R1) 129.59; More...
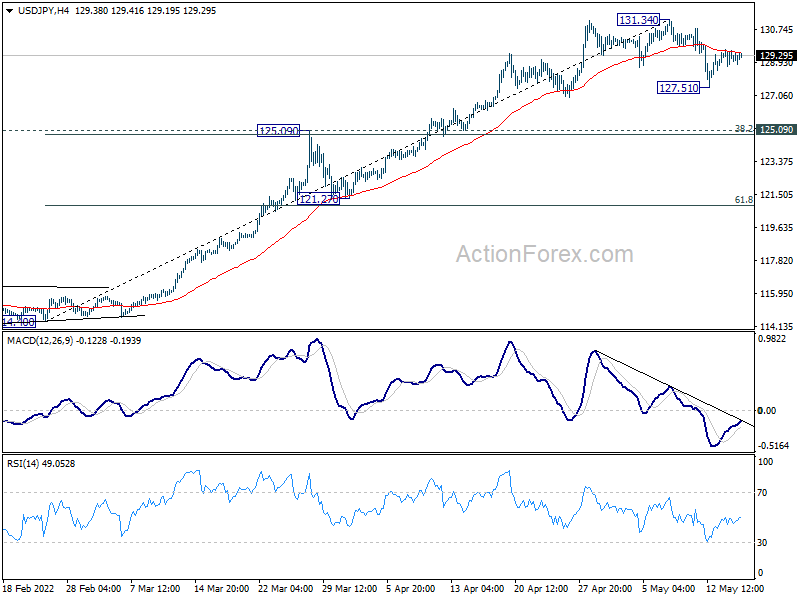
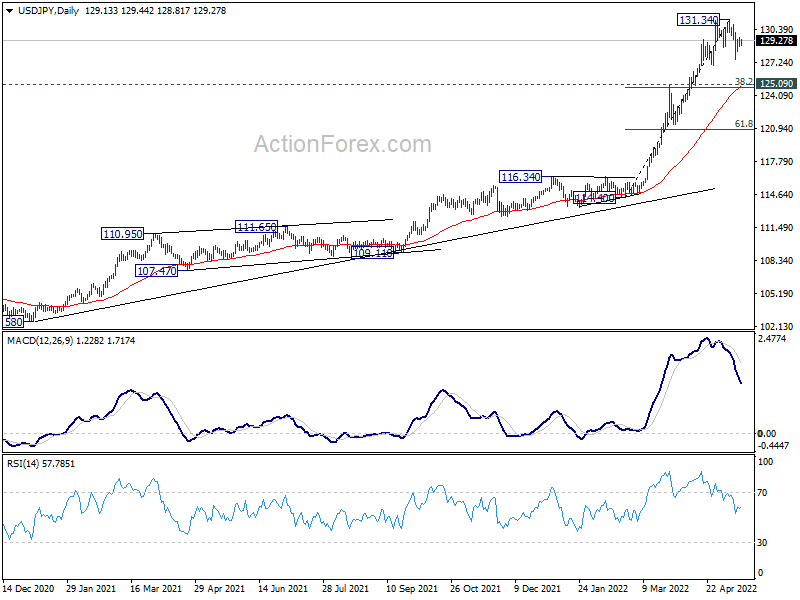
Intraday bias in USD/JPY remains neutral as consolidation from 131.34 extends. Another fall fall but ruled out and below 127.51 will target 125.09 cluster support (38.2% retracement of 114.40 to 131.34 at 124.86). On the upside, firm break of 131.34 will resume larger up trend.
In the bigger picture, current rally is seen as part of the long term up trend form 75.56 (2011 low). Sustained trading above 61.8% projection of 75.56 (2011 low) to 125.85 (2015 high) from 98.97 at 130.04 will pave the way to 100% projection at 149.26, which is close to 147.68 (1998 high). For now, this will remain the favored case as long as 121.27 support holds.
AUD/USD Daily Report
Daily Pivots: (S1) 0.6901; (P) 0.6942; (R1) 0.7010; More...
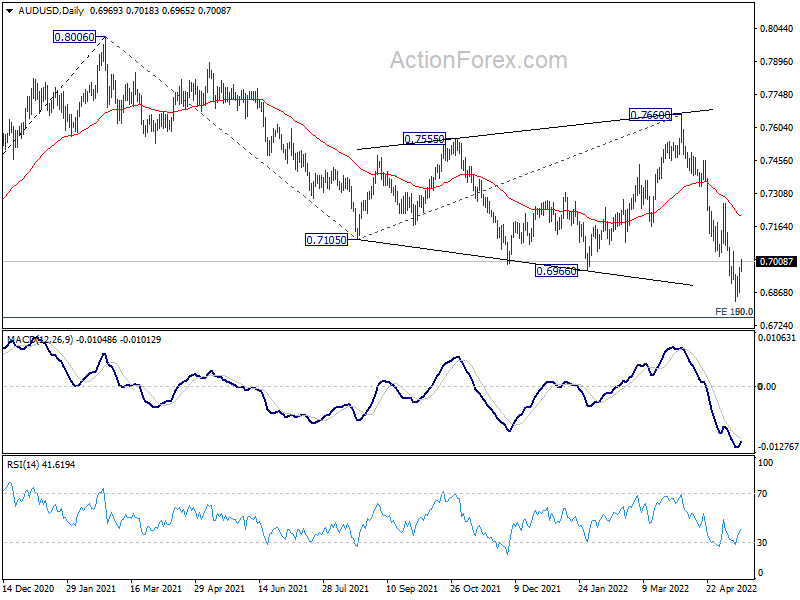
Intraday bias in AUD/USD remains neutral at this point. Risk stays mildly on the downside as long as 0.7029 support turned resistance holds. Break of 0.6828 will resume larger fall from 0.8006, and target 0.6756/60 medium term fibonacci level next. On the upside, however, firm break of 0.7029 will indicate short term bottoming, and bring stronger rebound back to 0.7265 resistance instead.
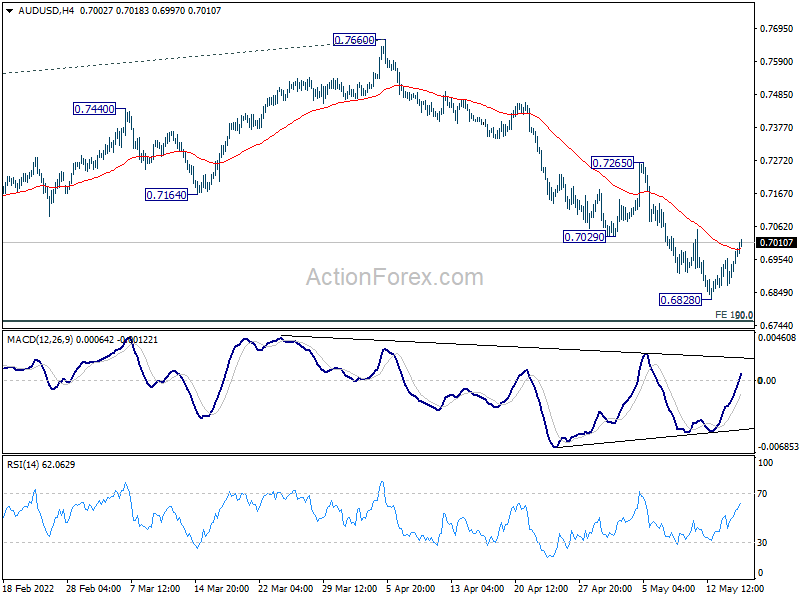
In the bigger picture, price actions from 0.8006 are seen as a corrective pattern to rise from 0.5506 (2020 low). Deeper fall should be seen to 50% retracement of 0.5506 to 0.8006 at 0.6756. This coincides with 100% projection of 0.8006 to 0.7105 from 0.7660 at 0.6760. Strong support is expected from 0.6756/60 cluster to contain downside to complete the correction. However, sustained break of 0.6756/60 would argue that AUD/USD is indeed already in a medium term down trend.
USD/CAD Daily Outlook
Daily Pivots: (S1) 1.2795; (P) 1.2888; (R1) 1.2940; More...
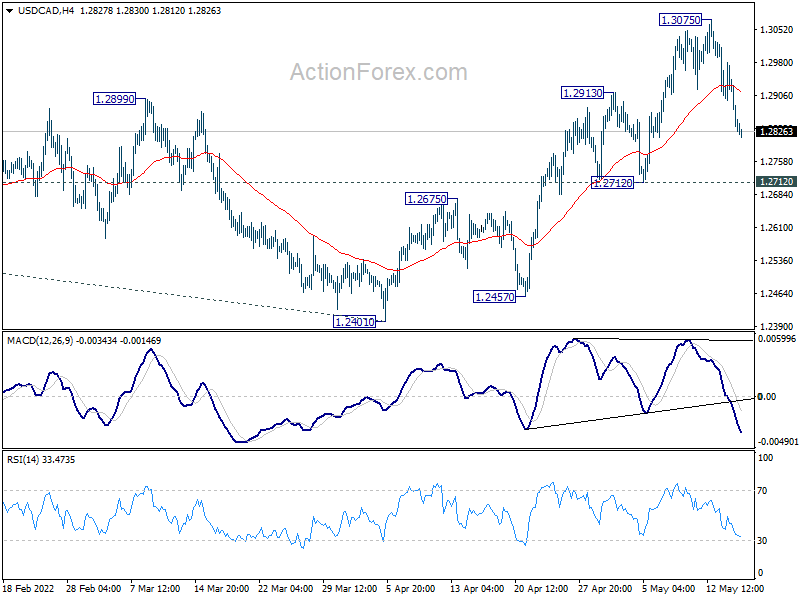
Intraday bias in USD/CAD remains neutral first and correction from 1.3075 could extend lower. On the upside, break of 1.3075 will resume the rise from 1.2401. Sustained trading above 1.3022 fibonacci level will carry larger bullish implications. Next target will be 100% projection of 1.2005 to 1.2947 from 1.2401 at 1.3343. On the downside, however, break of 1.2712 support will indicate rejection by 1.3022 key fibonacci resistance, and bring deeper decline.
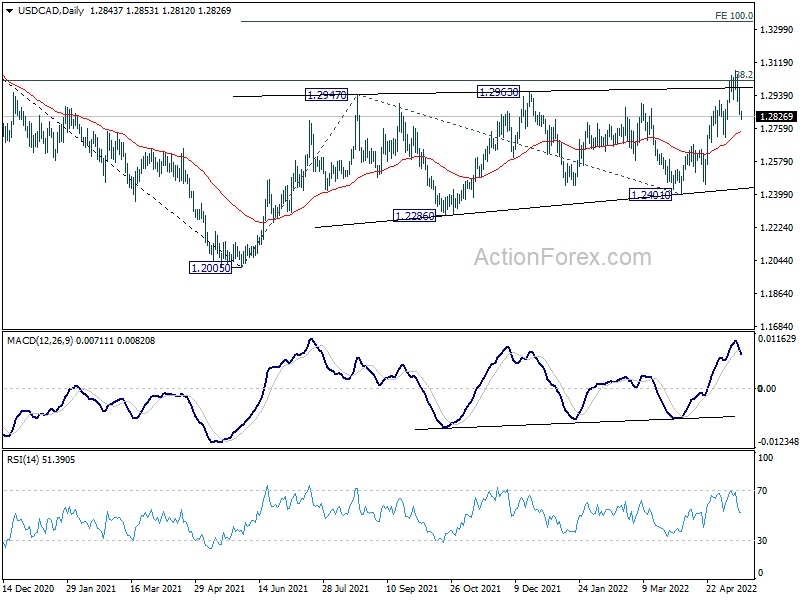
In the bigger picture, focus stays on 38.2% retracement of 1.4667 (2020 high) to 1.2005 (2021 low) at 1.3022. Sustained break there should confirm that the down trend from 1.4667 has completed after defending 1.2061 long term cluster support. Further rise would then be seen towards 61.8% retracement at 1.3650. However, rejection by 1.3022 will maintain medium term bearishness. Break of 1.2005 will resume the down trend from 1.4667 and that carries larger bearish implications too.
EUR/CHF Daily Outlook
Daily Pivots: (S1) 1.0415; (P) 1.0453; (R1) 1.0492; More....
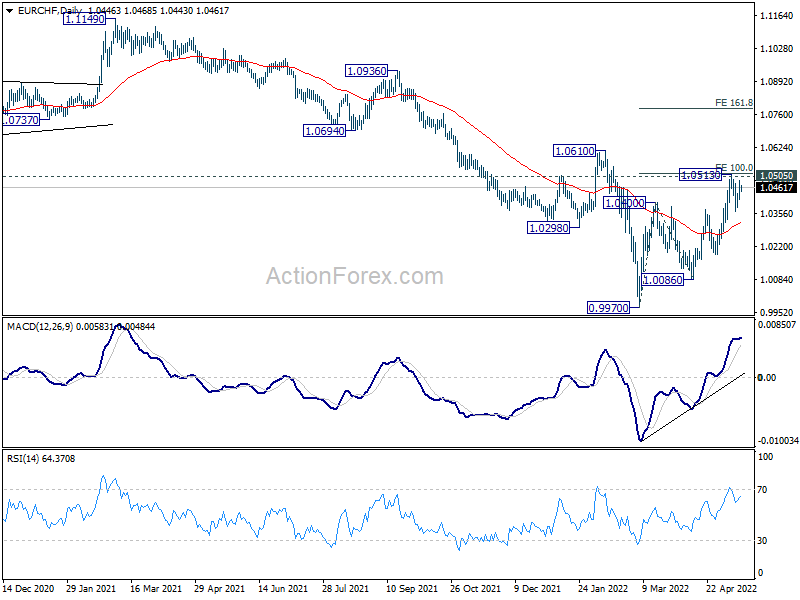
Intraday bias in EUR/CHF remains neutral for the moment. On the downside, break of 1.0360 will suggest that rebound from 0.9970 has completed as a three-wave corrective move at 1.0513. That came after rejection by 100% projection of 0.9970 to 1.0086 from 1.0400 at 1.0516 and 1.0505. Intraday bias will be turned back to the downside for 1.0186 support first. On the upside, however, sustained break of 1.0505 long term resistance will carry larger bullish implications. Next target is 161.8% projection at 1.0782.
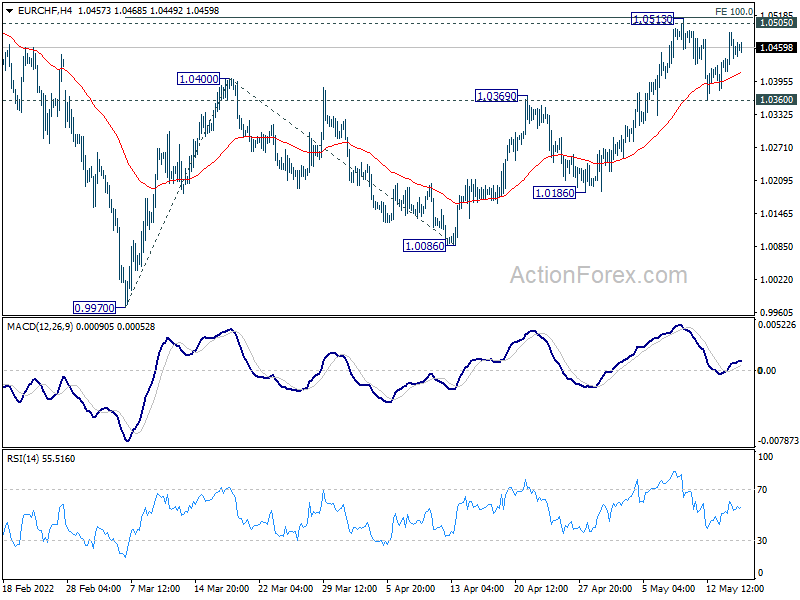
In the bigger picture, as long as 1.0505 support turned resistance (2020 low) holds, long term down trend from 1.2004 (2018 high) is expected to continue. Next target is 100% projection of 1.2004 to 1.0505 to 1.1149 at 0.9650. However, firm break of 1.0505 will suggest medium term bottoming, and bring stronger rebound towards 1.1149 structural resistance.
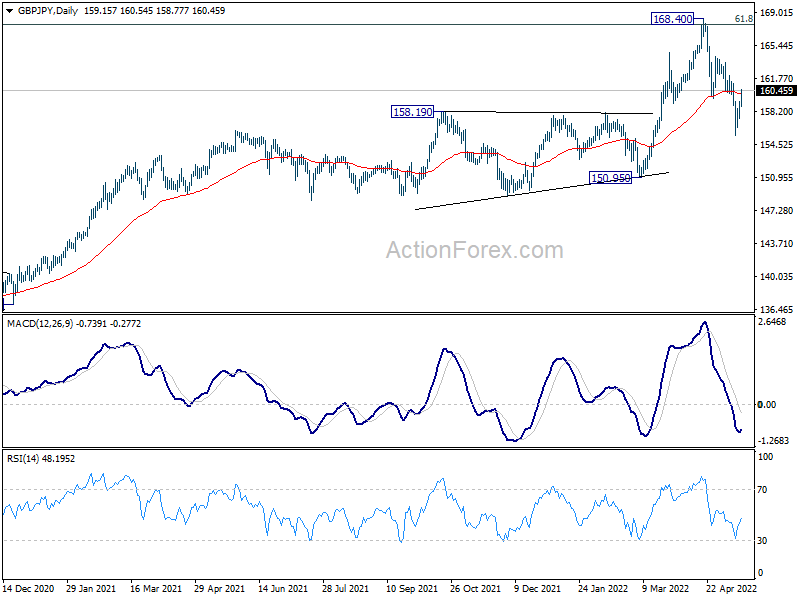
GBP/JPY Daily Outlook
Daily Pivots: (S1) 157.95; (P) 158.61; (R1) 159.77; More...
GBP/JPY's price actions from 168.40 are seen as a corrective move. Risk will stay on the downside as long as 162.16 minor resistance holds, as correction from 168.40 could extend. On the downside, below 155.57 will target 150.95 key structural support next. Nevertheless, firm break of 162.16 will indicate that the correction has completed, and bring retest of 168.40 high next.
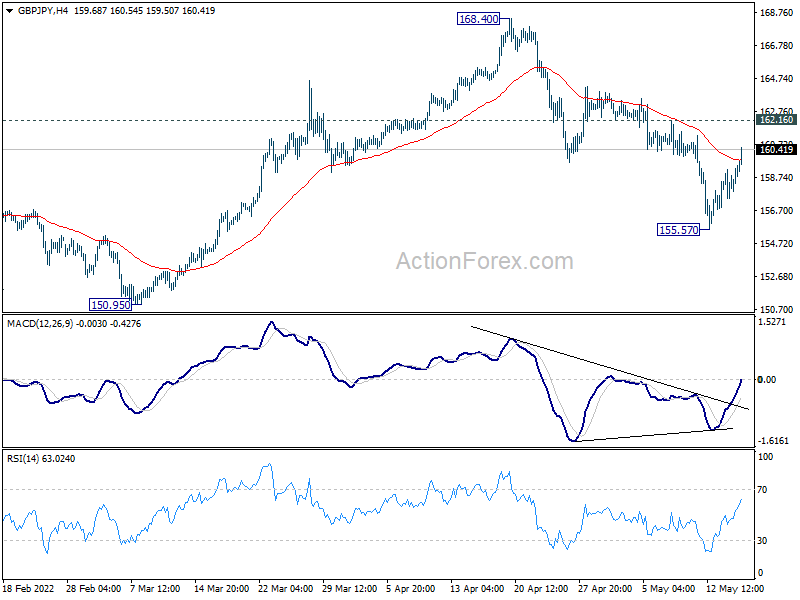
In the bigger picture, up trend from 123.94 (2020 low) is still in progress. Sustained break of 61.8% retracement of 195.86 (2015 high) to 122.75 (2016 low) at 167.93 will be a long term bullish signal, and could pave the way back to 195.86 high. This will now remain the favored case as long as 150.95 support holds, even in case of deep pull back. However, firm break of 150.95 will indicate rejection by 167.93, and bearish trend reversal.