

Sample Category Title
Technical Outlook and Review
DXY:
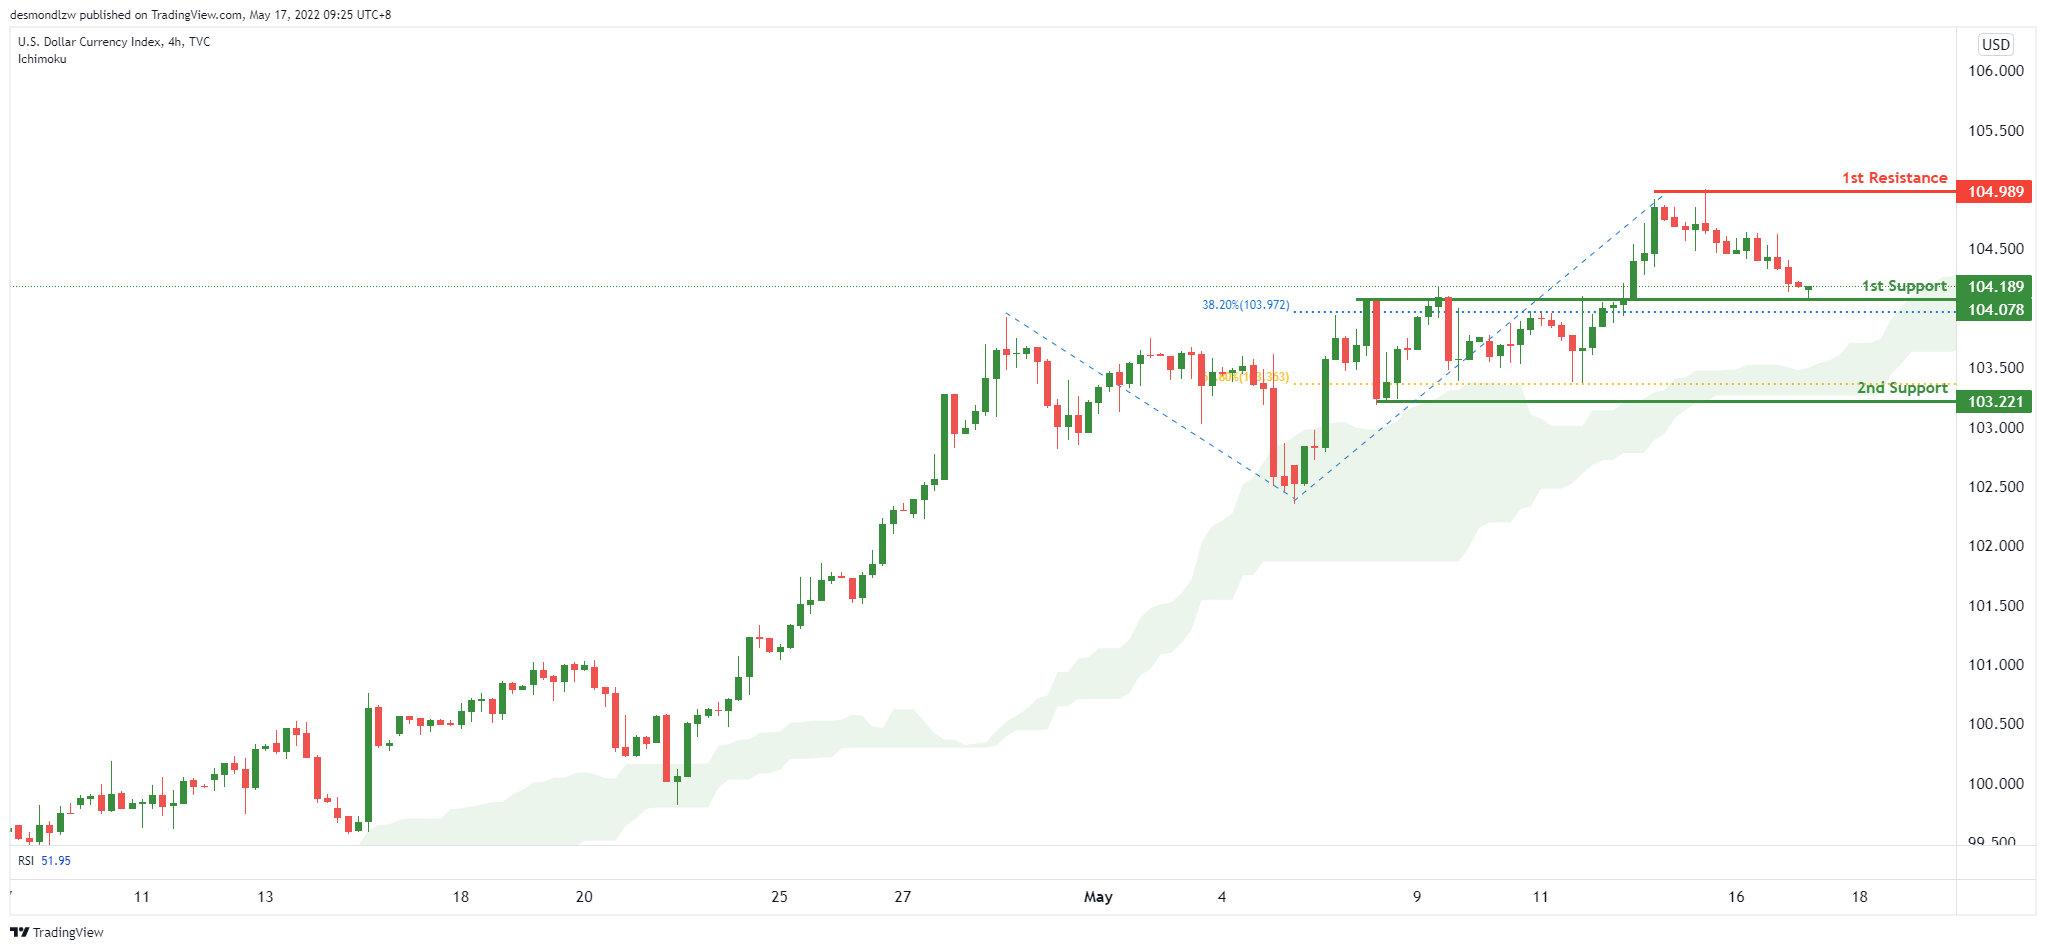
On the H4, with price moving above the ichimoku cloud, we have a bullish bias that price will rise to our 1st resistance at 104.989 where the swing high resistance is from our 1st support at 104.078 in line with the horizontal pullback support and 38.2% Fibonacci retracement. Alternatively, price may break 1st support structure and head for 2nd support where the horizontal swing low support is.
Areas of consideration:
- H4 time frame, 1st resistance at 104.989
- H4 time frame, 1st support at 104.078
XAU/USD (GOLD):
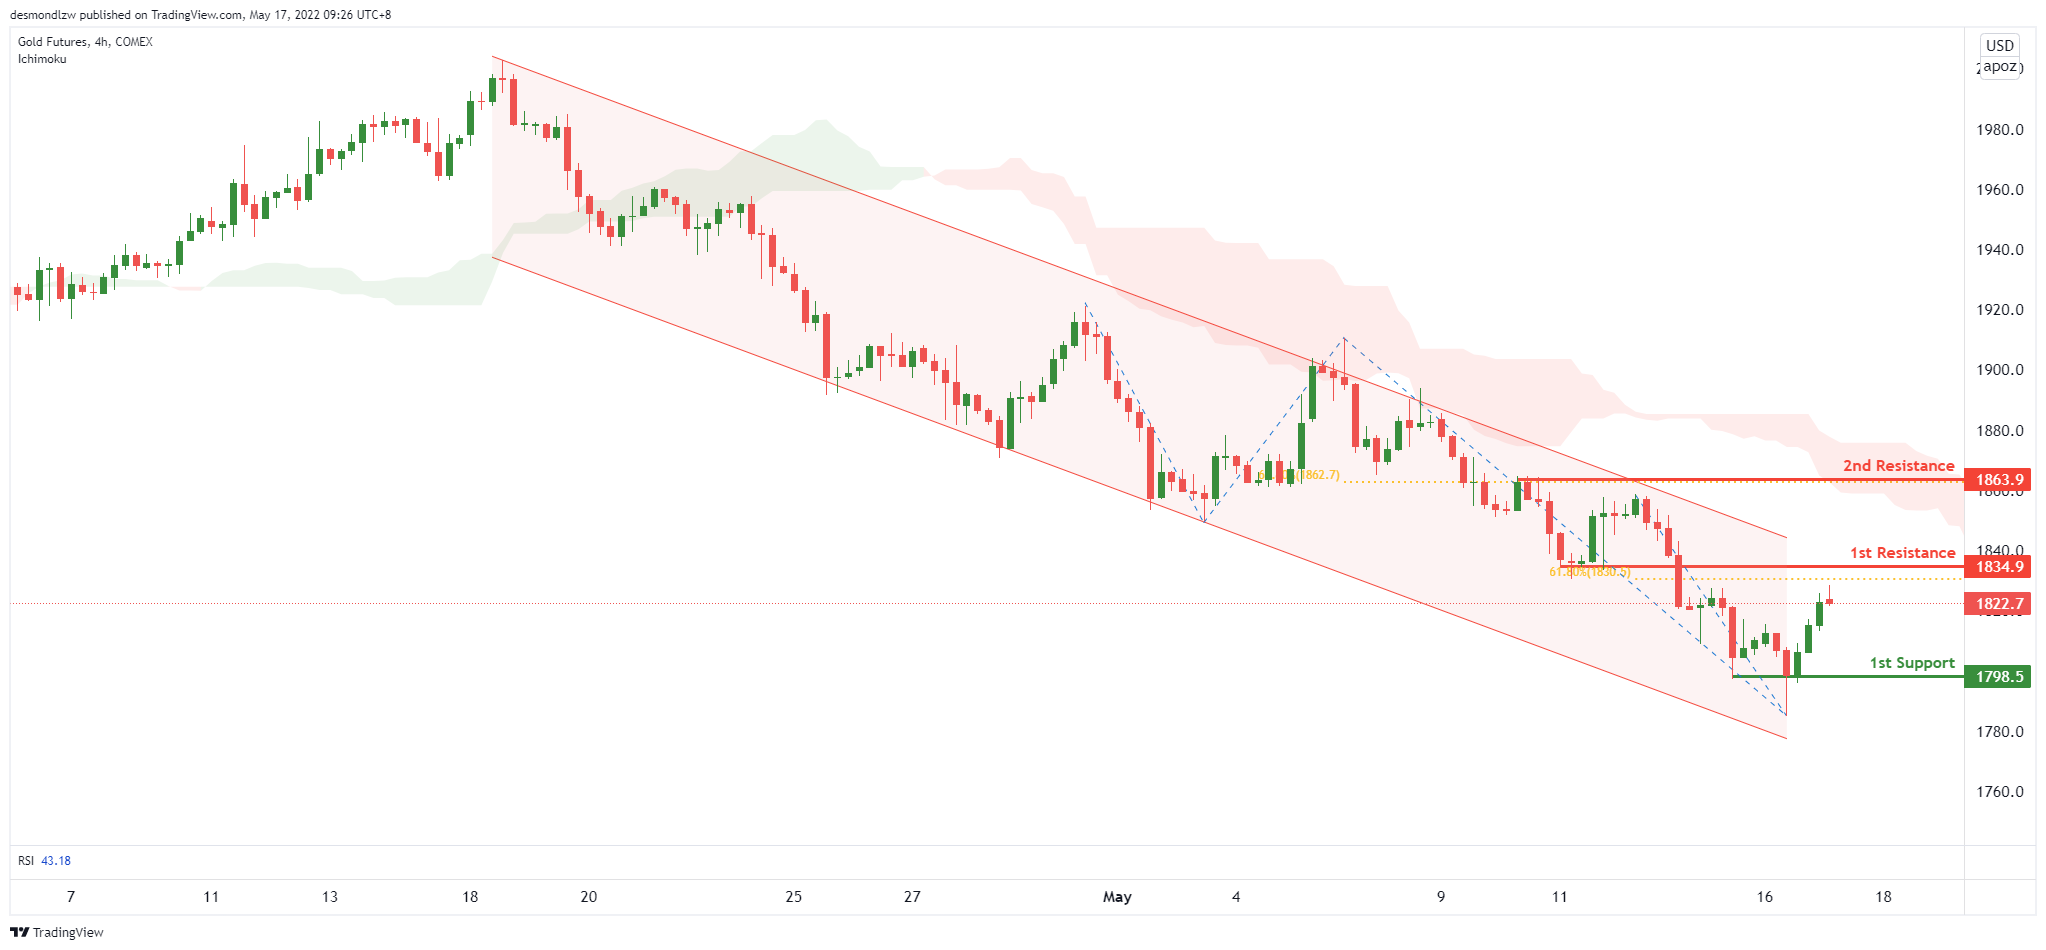
On the H4, with price moving below the ichimoku, we have a bearish bias that price will drop from our 1st resistance at 1834 where the horizontal pullback resistance and 61.8% Fibonacci retracement is to our 1st support at 1798 in line with the swing low support. Alternatively, price may break 1st resistance structure and head for 2nd resistance where the horizontal pullback resistance is.
Areas of consideration:
- H4 time frame, 1st Resistance at 1834
- H4 time frame, 1st Support at 1798
GBP/USD:
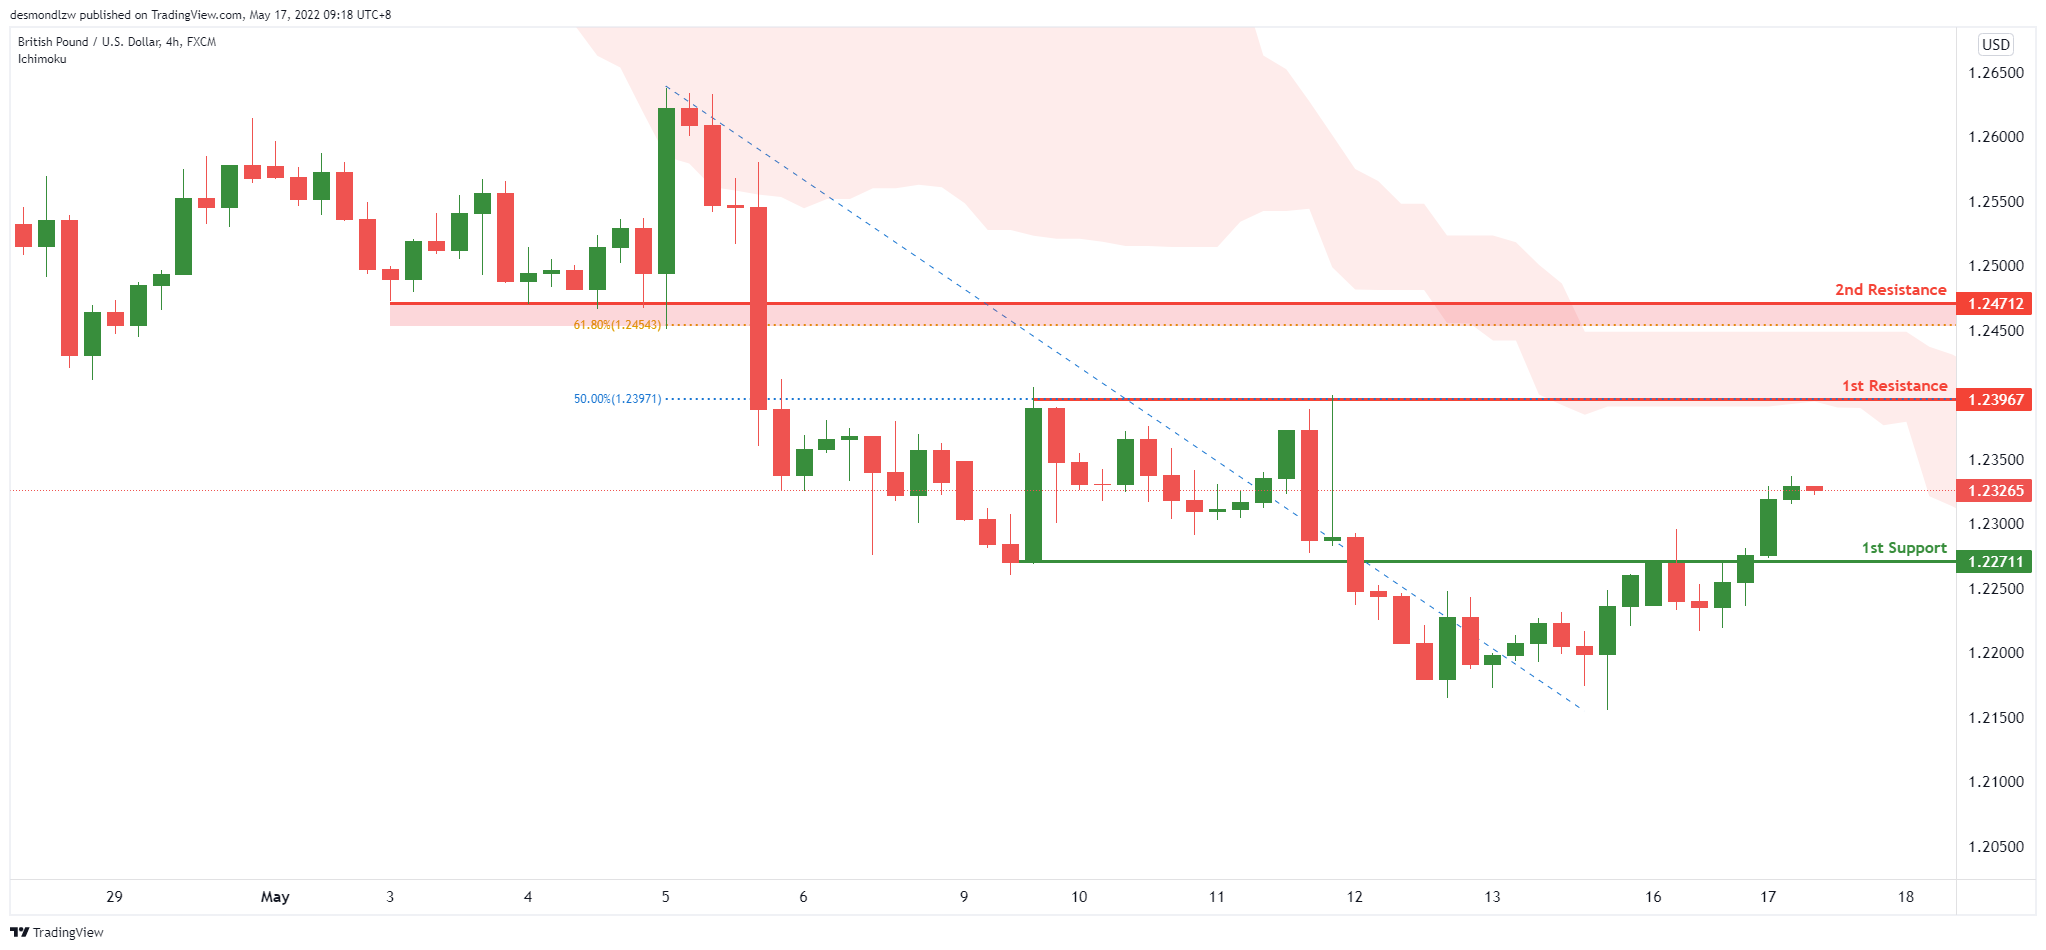
On the H4, with price moving below the ichimoku, we have a bearish bias that price will drop from our 1st resistance at 1.23967 where the 50% Fibonacci retracement and swing high resistance is to our 1st support at 1.21711 in line with the horizontal overlap support. Alternatively, price may break 1st resistance structure and head for 2nd resistance where the horizontal pullback resistance is.
Areas of consideration:
- H4 1st resistance at 1.23967
- H4 1st support at 1.21711
USD/CHF:
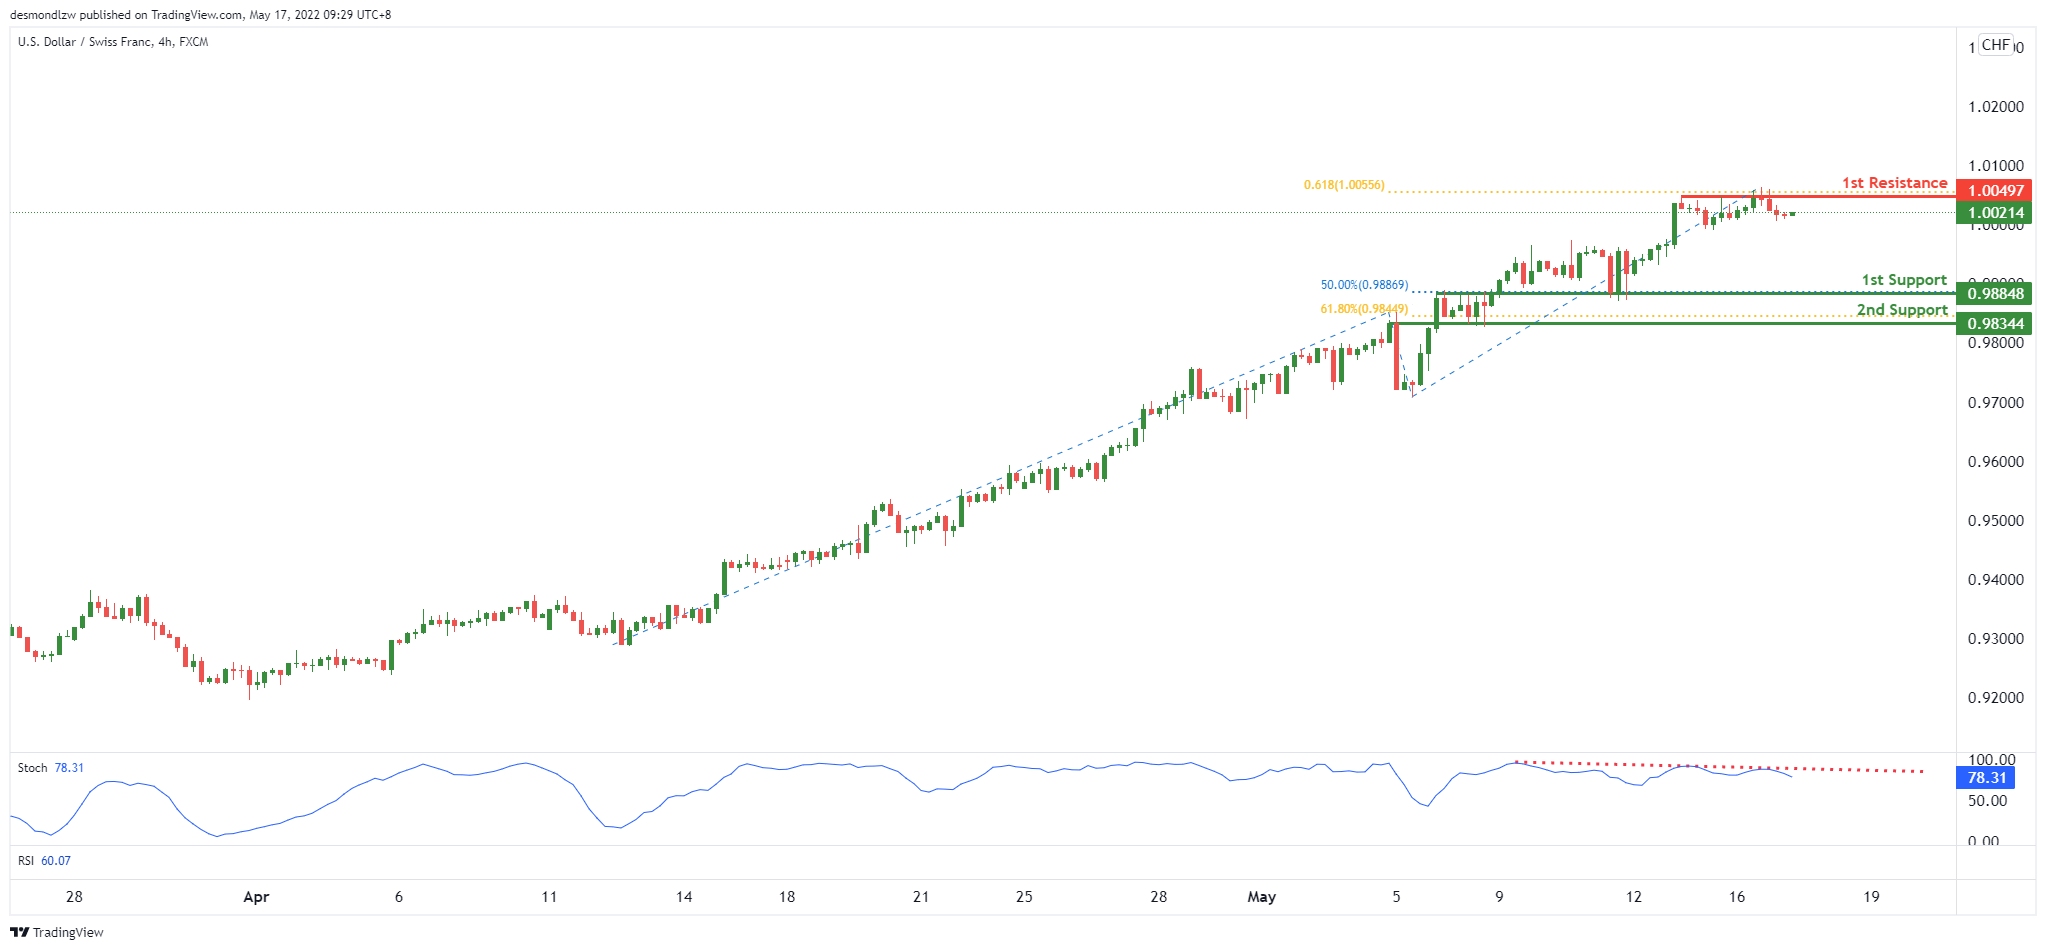
On the H4, with price expected to reverse off the stochastics indicator, we have a bearish bias that price will drop from our 1st resistance at 1.00497 where the 61.8% Fibonacci projection and swing high resistance is to our 1st support at 0.98848 in line with the horizontal overlap support and 50% fibonacci retracement. Alternatively, price may break 1st support structure and head for 2nd support where the horizontal pullback resistance is.
Areas of consideration
- 1st support level at 0.98848
- 1st resistance level at 1.00497
EUR/USD :
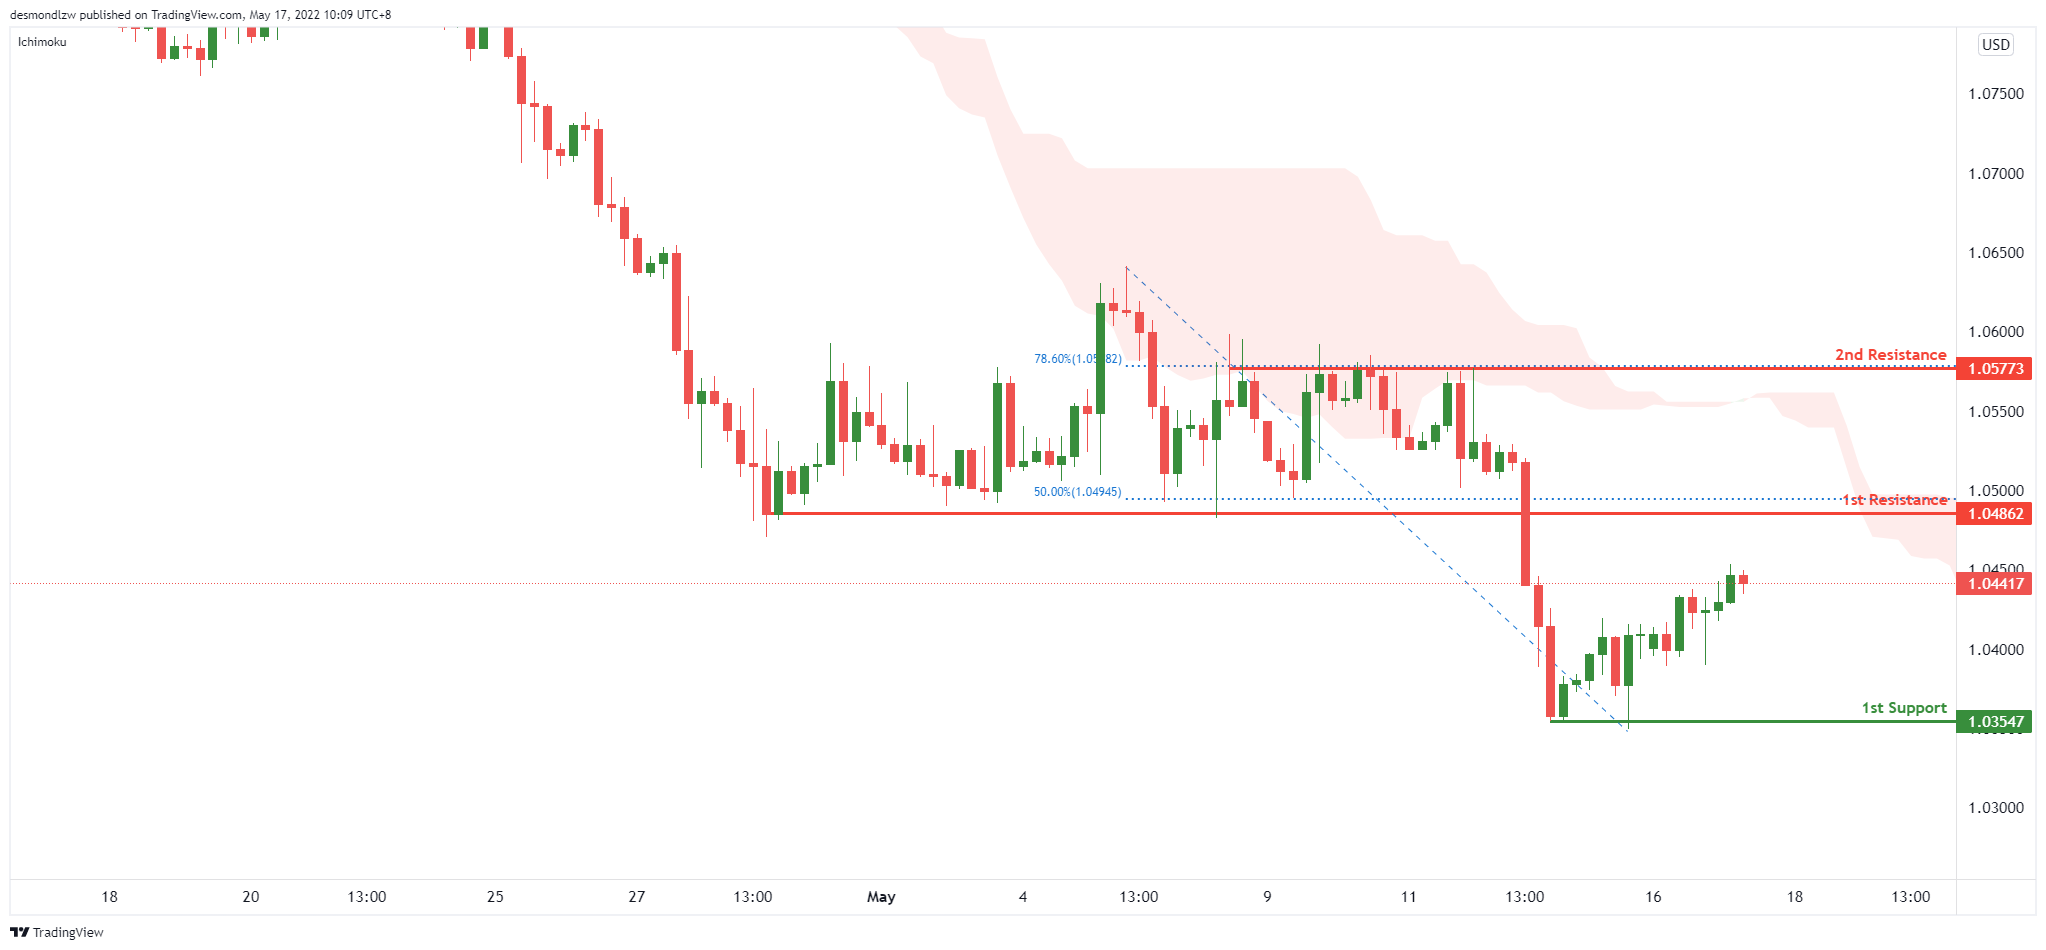
On the H4, with price moving below the ichimoku, we have a bearish bias that price will drop from our 1st resistance at 1.04862 where the horizontal pullback resistance and 50% Fibonacci retracement is to our 1st support at 1.03547 in line with the swing low support. Alternatively, price may break 1st resistance structure and head for 2nd resistance where the horizontal swing high resistance is.
Areas of consideration :
- H4 1st resistance at 1.04862
- H4 1st support at 1.03547
USD/JPY:
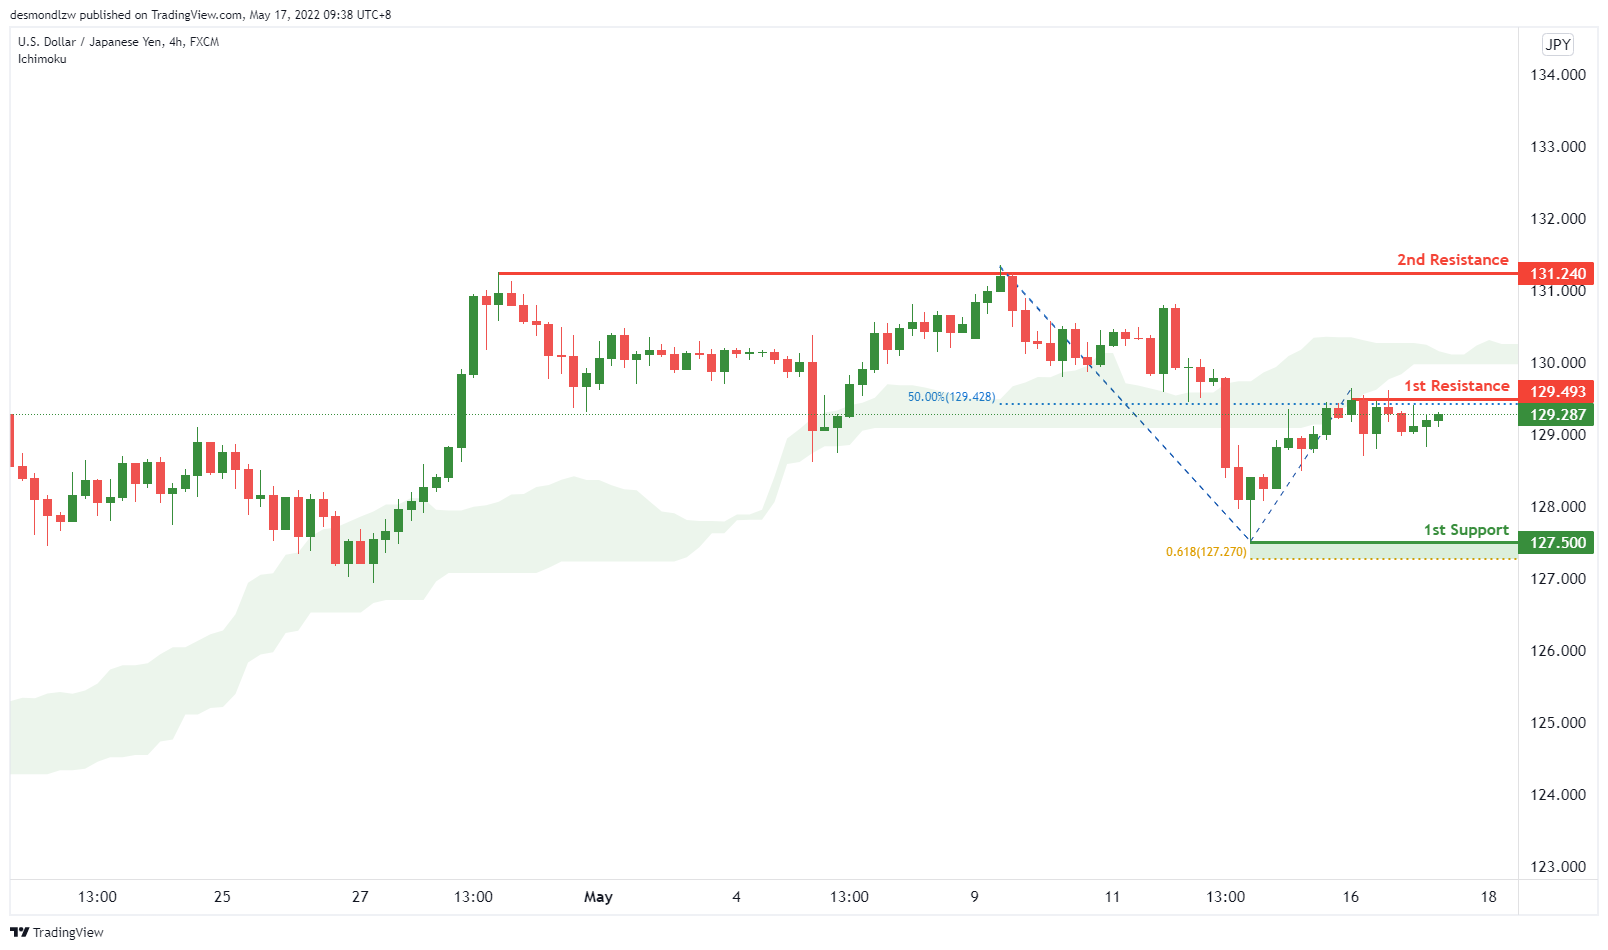
On the H4, with price moving below the ichimoku cloud, we have a bearish bias that price will drop from our 1st resistance at 129.493 where the 50% Fibonacci projection and swing high resistance is to our 1st support at 127.500 in line with the horizontal swing low support and 61.8% fibonacci projection. Alternatively, price may break 1st support structure and head for 2nd support where the horizontal swing high resistance is.
Areas of consideration:
- H4 time frame, 1st resistance at 129.493
- H4 time frame, 1st support at 127.500
AUD/USD:
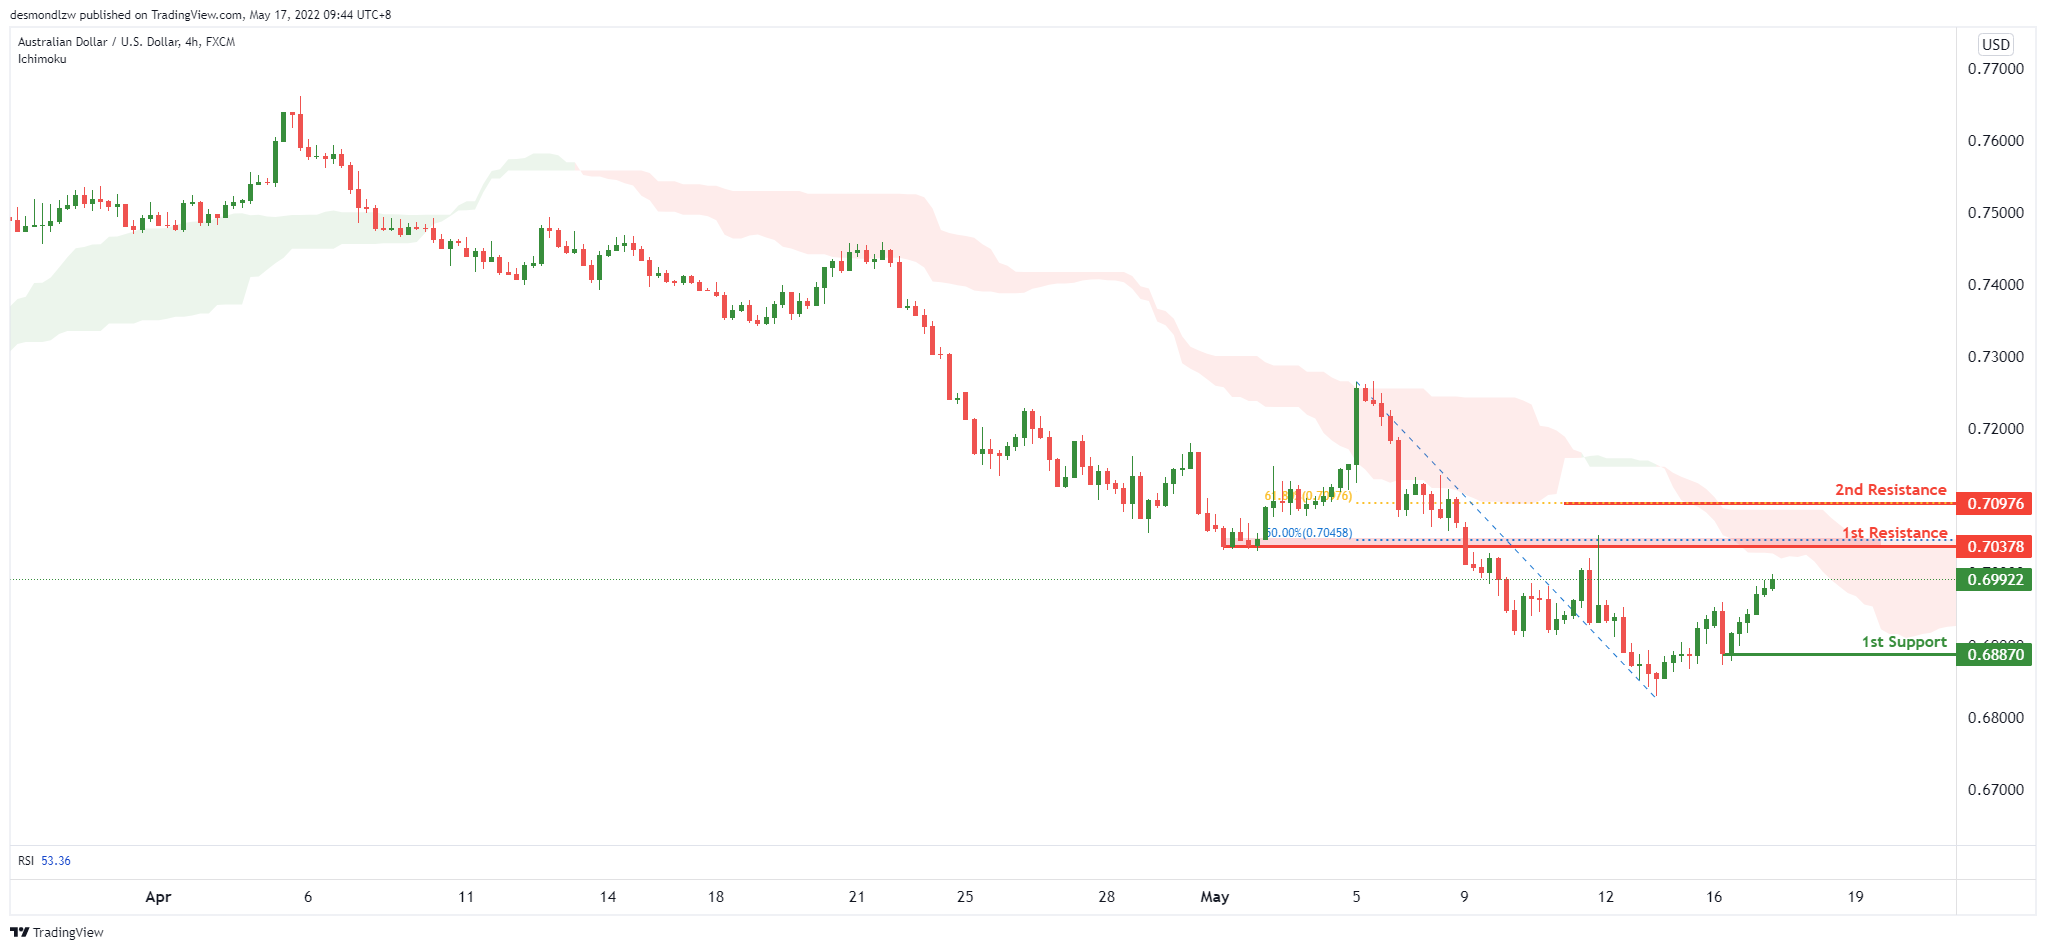
On the H4, with price moving below the ichimoku, we have a bearish bias that price will drop from our 1st resistance at 0.70378 where the pullback resistance and 50% Fibonacci retracement is to our 1st support at 0.68870 in line with the swing low support. Alternatively, price may break 1st resistance structure and head for 2nd resistance where the 61.8% Fibonacci retracement is.
Areas of consideration
- H4 1st resistance at 0.70378
- H4 1st support at 0.68870
NZD/USD:
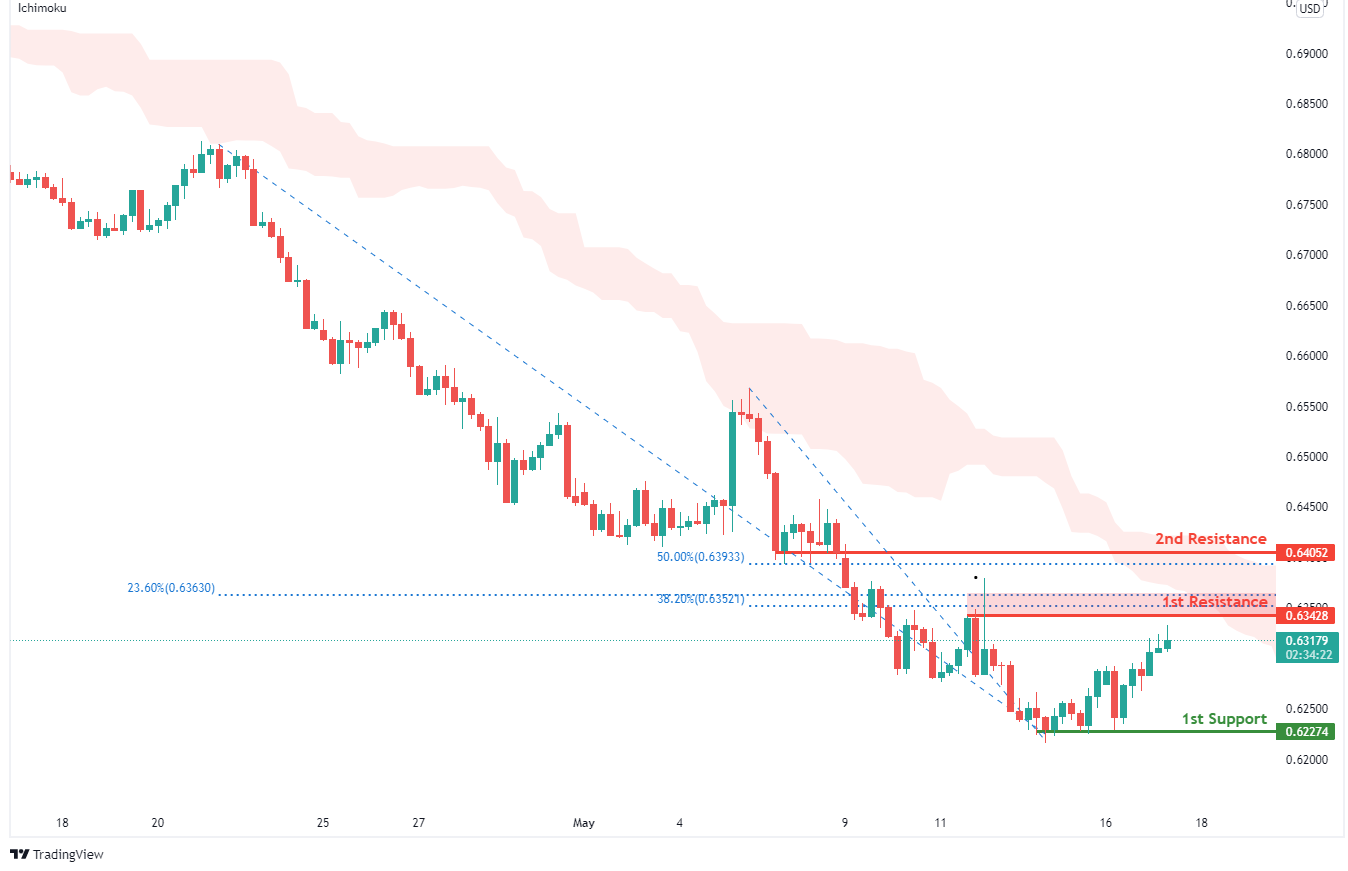
On the H4, with price moving below the ichimoku cloud, we have a bearish bias that price will drop from our 1st resistance at 0.63428 where the 23.6% Fibonacci retracement, 38.20% Fibonacci retracement and horizontal swing high resistance is to our 1st support at 0.62274 in line with the horizontal swing low support. Alternatively, price may break 1st resistance structure and head for 2nd resistance at 0.64052 in line with 50% Fibonacci retracement and horizontal pullback resistance.
Areas of consideration:
- H4 time frame, 1st support at 0.62274
- H4 time frame, 1st resistance at 0.63428
USD/CAD:
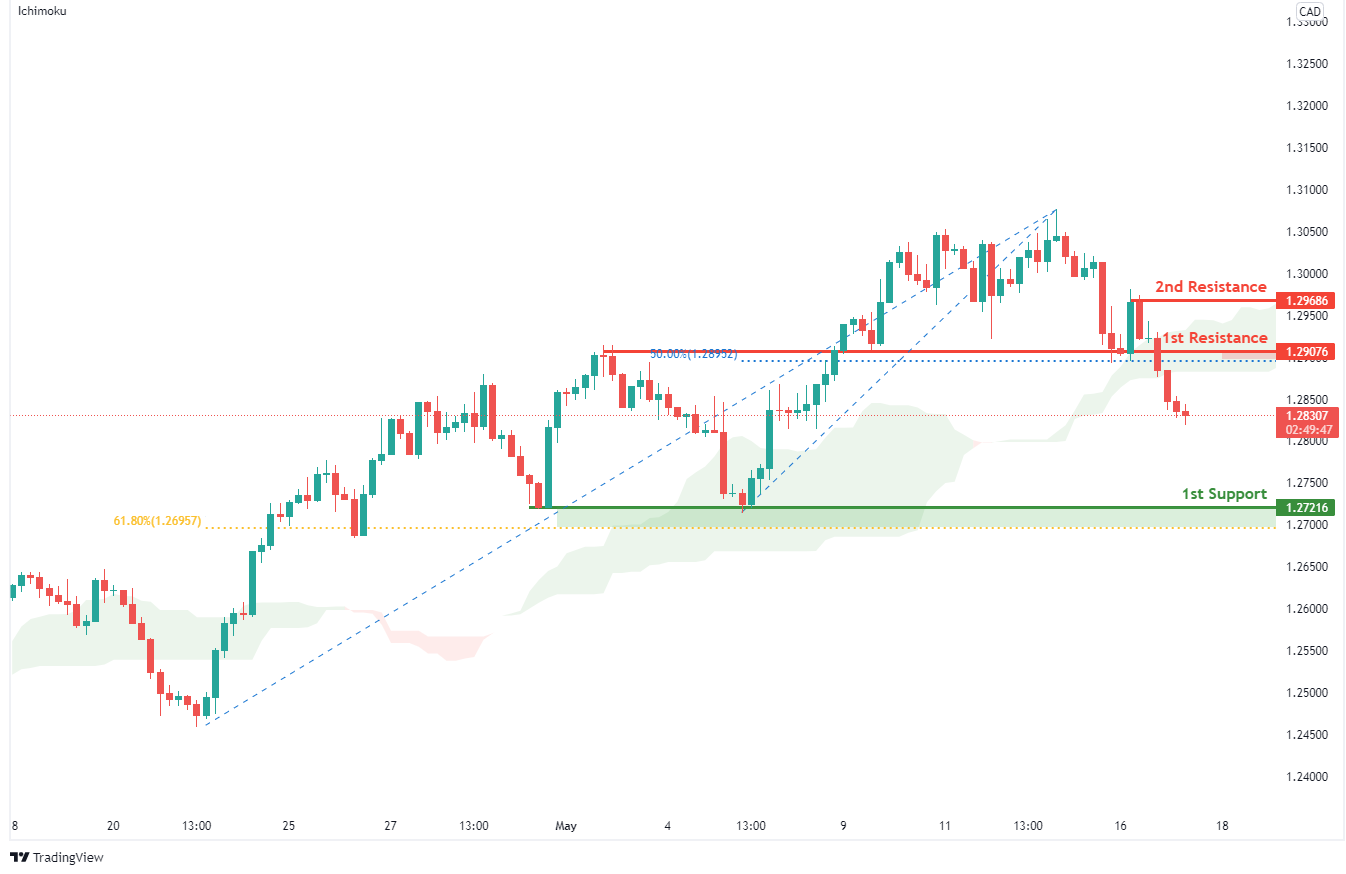
On the H4, with price moving below the ichimoku, we have a bearish bias that price will drop from our 1st resistance at 1.29076 where the horizontal pullback resistance and 50% Fibonacci retracement is to our 1st support at 1.27216 in line with the swing low support. Alternatively, price may break 1st resistance structure and head for 2nd resistance where the horizontal pullback resistance is.
Areas of consideration:
- H4 time frame, 1st resistance at 1.29076
- H4 time frame, 1st support at 1.27216
OIL:
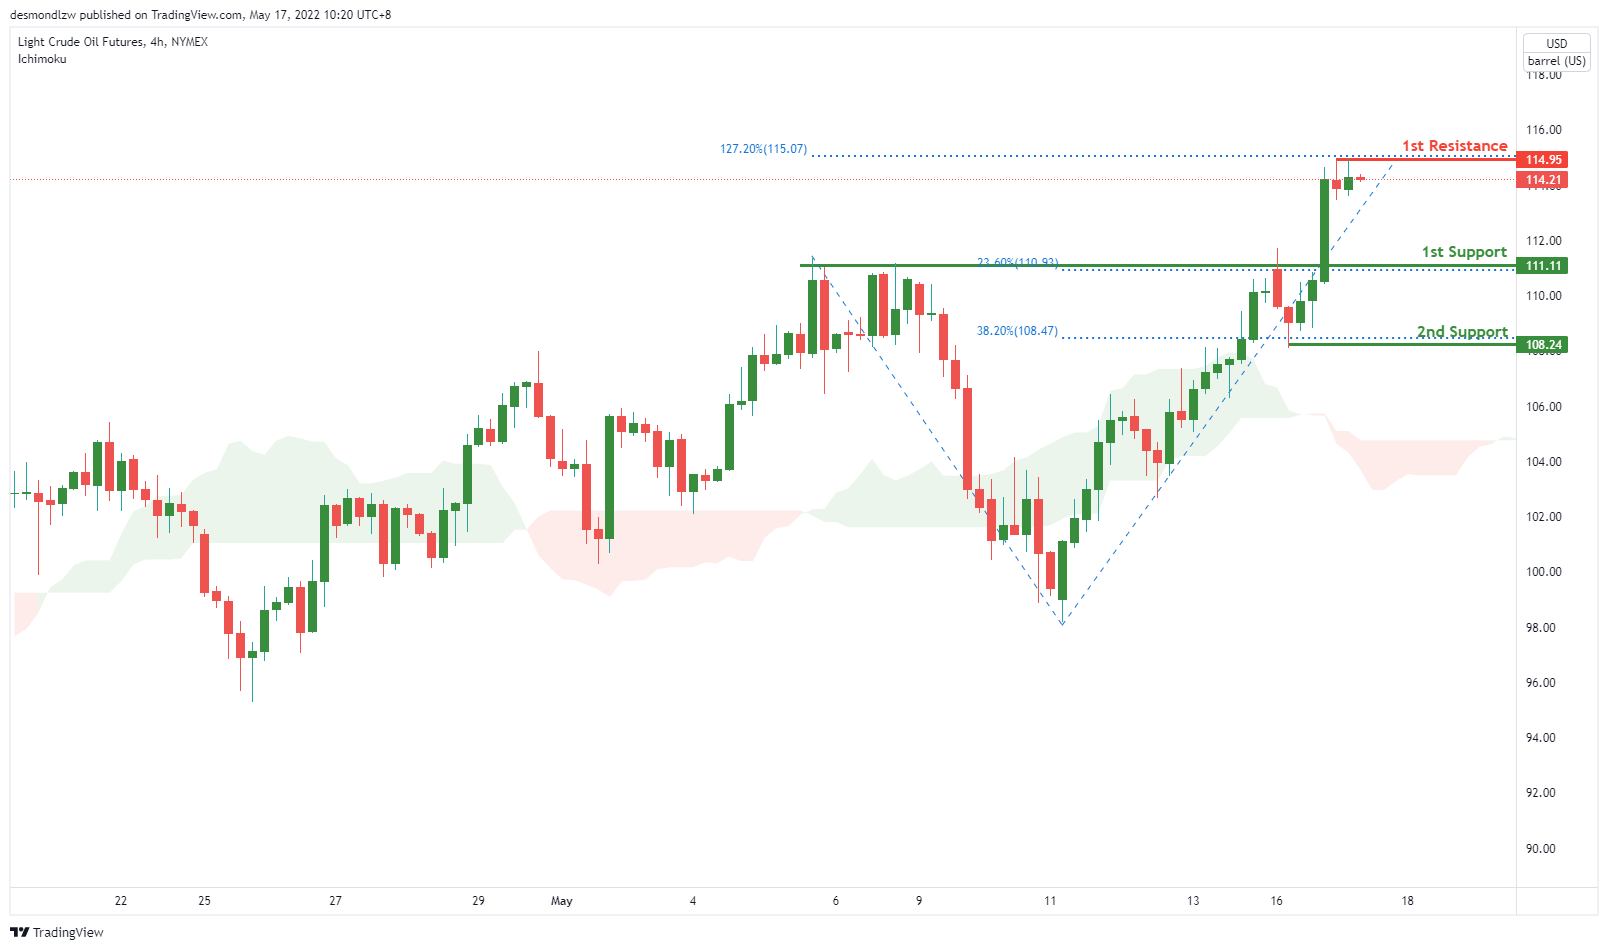
On the H4, with price expected to reverse off the stochastics indicator resistance, we have a bearish bias that price will drop from our 1st resistance at 114.39 where the 127.2% Fibonacci extension is to our 1st support at 111.11 in line with the 23.6% Fibonacci retracement. Alternatively, price may break 1st resistance structure and head for 2nd resistance where the 38.2% Fibonacci retracement.
Areas of consideration:
- H4 time frame, 1st resistance of 114.39
- H4 time frame, 1st support of 111.11
Dow Jones Industrial Average:
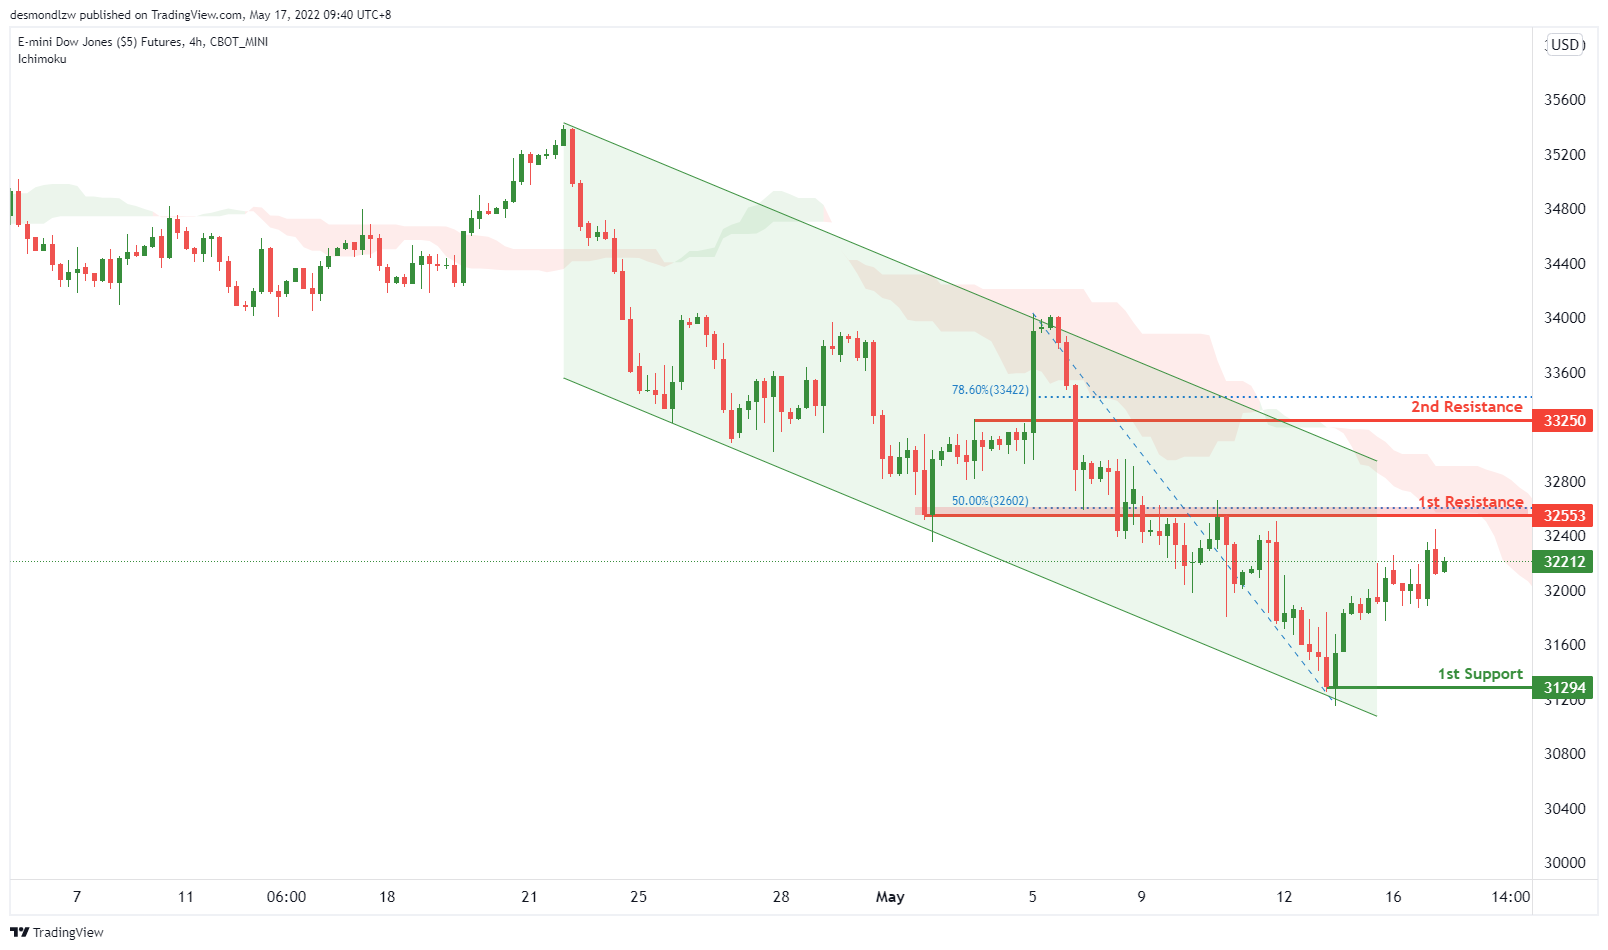
On the H4, with price moving below the ichimoku cloud, we have a bearish bias that price will drop from our 1st resistance at 114.39 where the 127.2% Fibonacci extension is to our 1st support at 111.11 in line with the 23.6% Fibonacci retracement. Alternatively, price may break 1st resistance structure and head for 2nd resistance where the 38.2% Fibonacci retracement.
Areas of consideration :
- H4 time frame, 1st resistance at 32553
- H4 time frame, 1st support at 31753
Elliott Wave View: EURJPY Rallying from Support Area
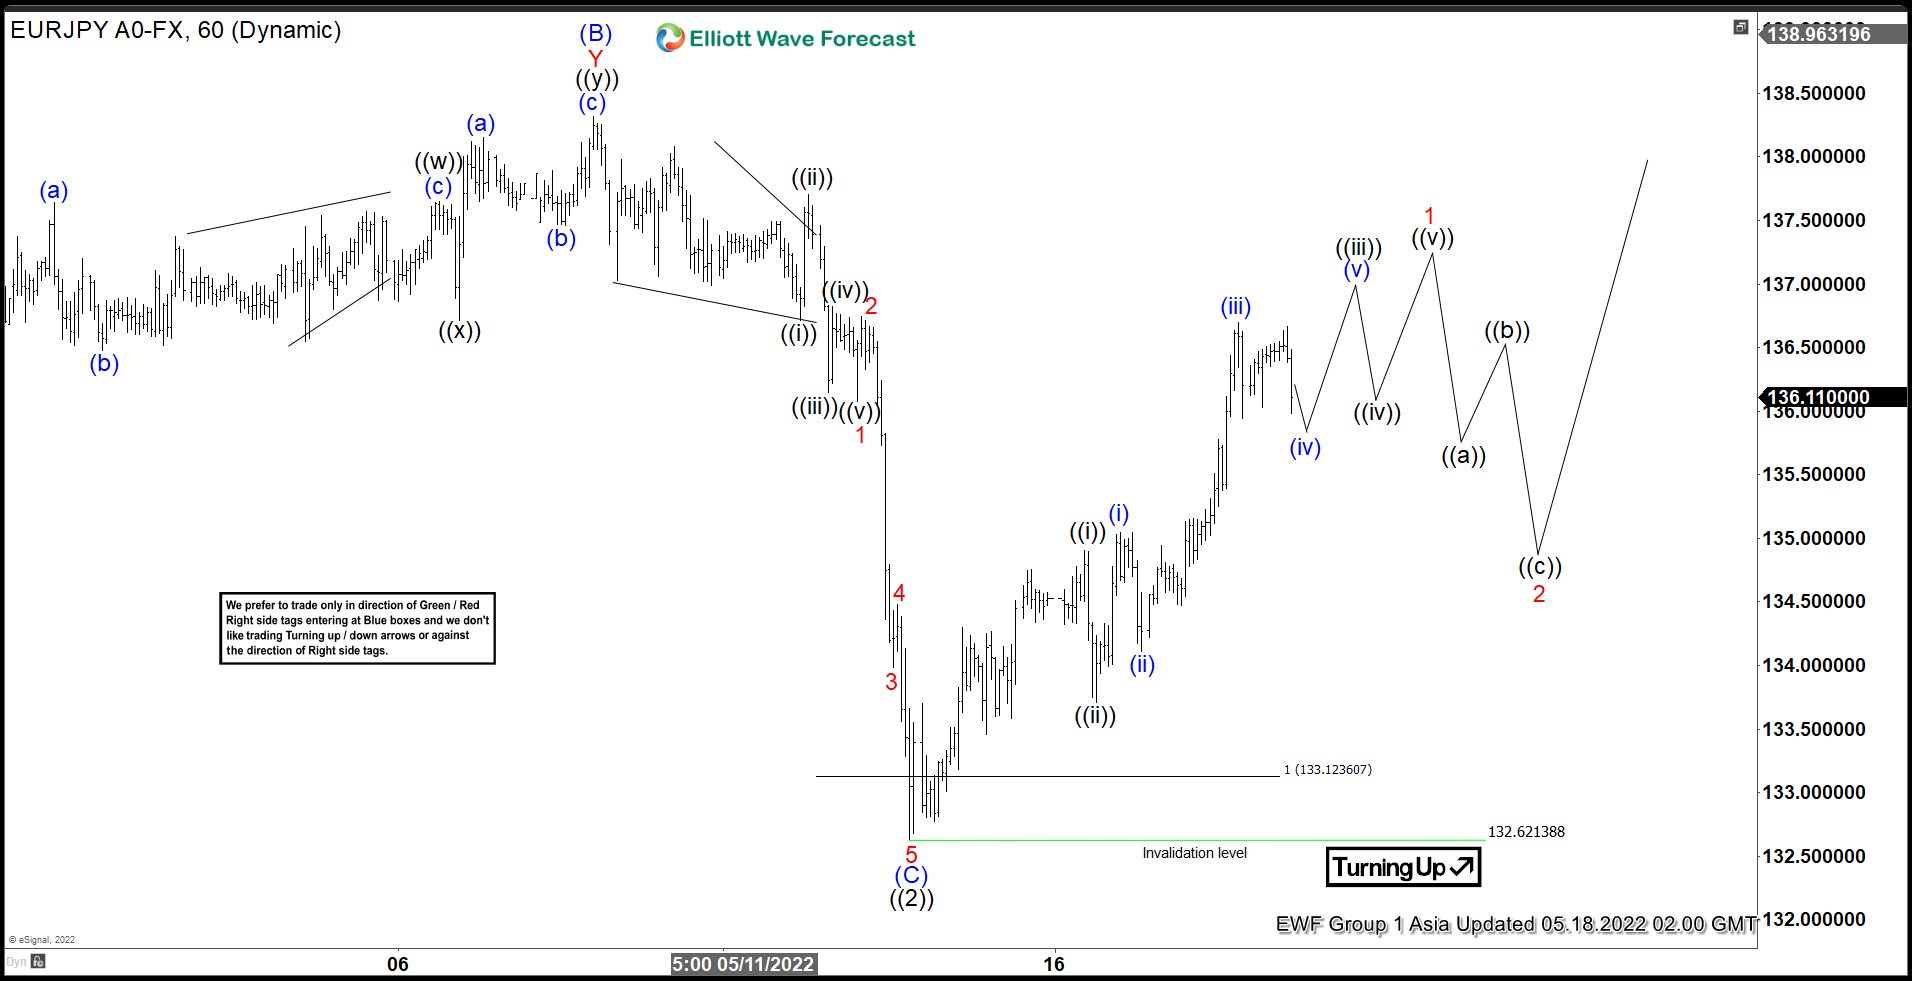
Short Term View in EURJPY suggests cycle from 04.21.2022 peak is completed as a 3 waves zig zag Elliott Wave Structure. Down from April 21 peak, wave (A) ended at 134.75 and rally in wave (B) ended at 138.32. Pair then resumes lower in wave (C) with internal subdivision as an impulse in lesser degree. Down from wave (B), wave 1 ended at 136.08 and pullback in wave 2 ended at 136.74. Pair then resumes lower in wave 3 towards 133.98, wave 4 ended at 134.48. Final wave 5 ended at 132.62 which completed wave (C) and wave ((2)).
Blue box started at 133.12. It was hit for the market and began a new cycle. This new cycle is unfolded as a motive wave structure. Up from wave ((2)), wave ((i)) ended at 134.90, wave ((ii)) ended at 133.70. Then wave (i) in lesser degree ended at 135.05, wave (ii) ended at 134.11 and continue with the rally. Wave (iii) ended at 136.69 and curretly we are bulding wave (iv). After complete wave (iv), pair should resume higher in wave (v) and wave ((iii)). Then we should see a new pullback as wave ((iv)) and higher again to complete wave ((v)) and wave 1 to finish the impulse. Near term, as far as pivot at 132.62 low stays intact, expect pullback to find support in 3, 7, or 11 swing for further upside.
EURJPY 60 Minutes Elliott Wave Chart
Eco Data 5/18/22
[php_everywhere instance="1"]
Natural Gas Wave Analysis
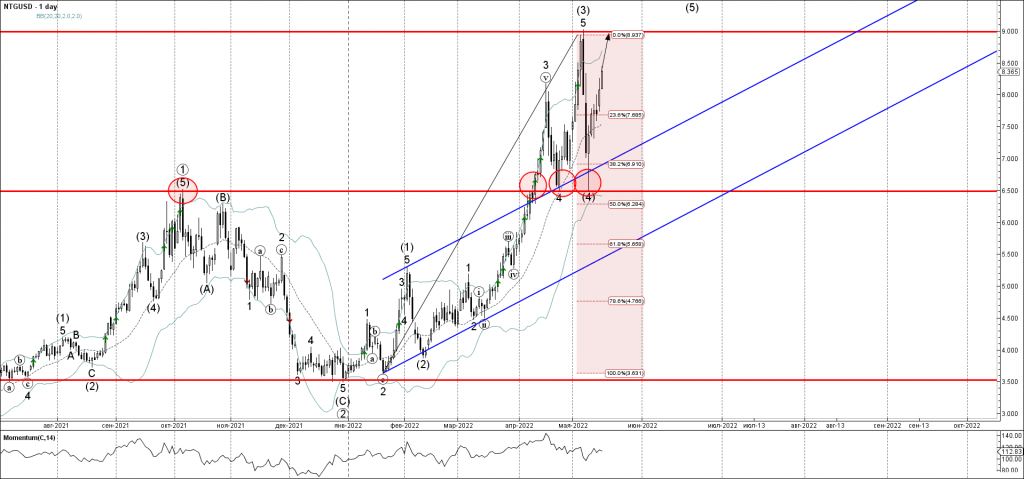
- Natural gas reversed from support level 6.500
- Likely to rise to 9.000
Natural gas recently reversed up from the strong support level 6.500, coinciding with the 20-day moving average and the 50% Fibonacci correction of the upward impulse wave (3) from February.
The support zone near the support level 6.500 was further strengthened by the upper trendline of the recently broken up channel from January.
Given the clear daily uptrend – Natural gas can be expected to rise in the active impulse wave (5) toward the next resistance level 9.000 (top of the previous wave (3)).
EURCAD Wave Analysis
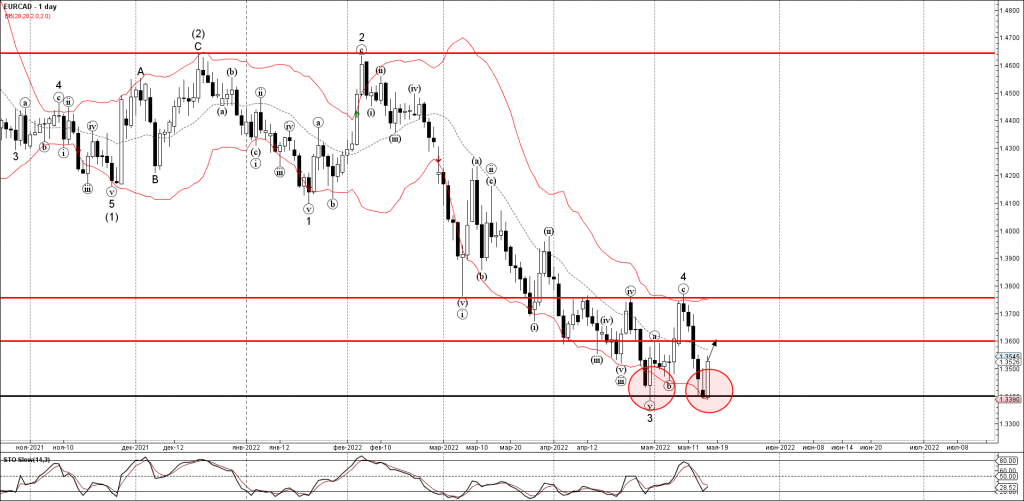
- EURCAD reversed from support level 1.3400
- Likely to rise to 1.3600
EURCAD today reversed up from the strong support level 1.3400 (which stopped the previous sharp downward impulse wave 3 at the end of last month).
The upward reversal from the support level 1.3400 will most likely form the daily candlesticks reversal pattern Morning Star.
Given the moderate euro bullishness seen today – EURCAD can be expected to rise further toward the next resistance level 1.3600.
British Pound Soars on Strong Jobs Data
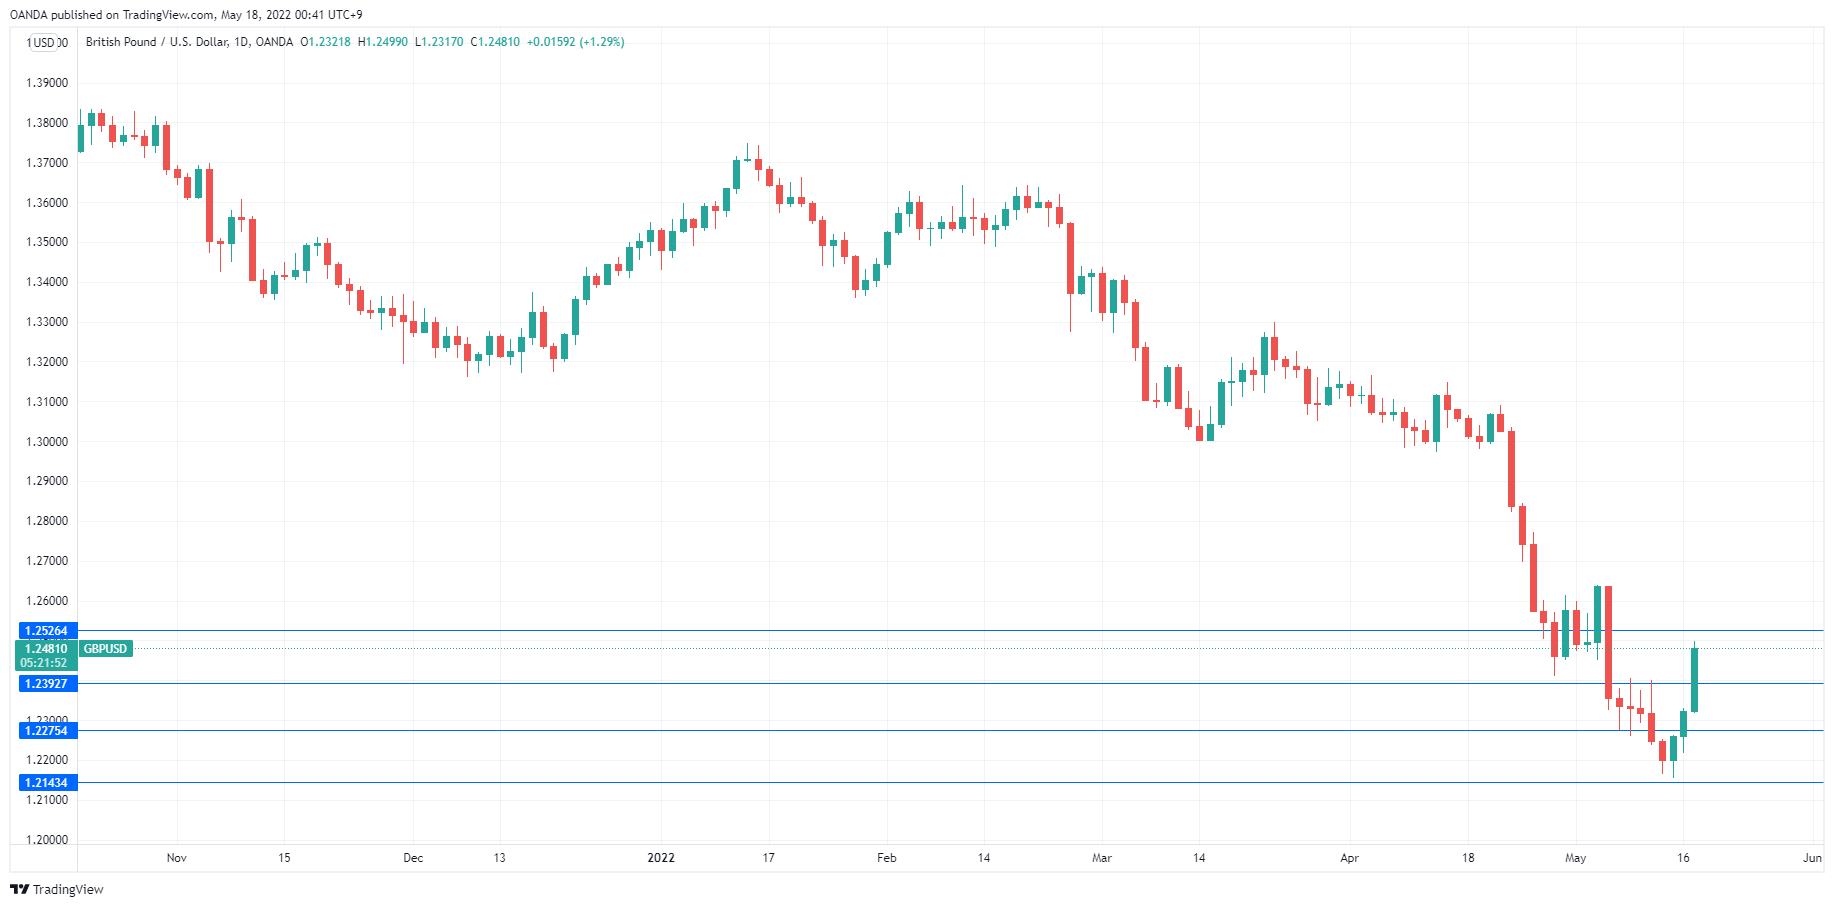
The British pound continues to rally on Tuesday. GBP/USD is trading at 1.2463 in the European session, up 1.15% on the day.
UK employment numbers sparkle
The tight UK labor market is getting even tighter, as reflected in the March employment report. The unemployment rate fell to 3.7% (3.8% prior), below the 3.8% forecast and its lowest level since 1974. Employment change jumped by 83 thousand, smashing the estimate of 5 thousand. Wage growth in Q1 was up 7%, but without bonuses, the gain was only 4.2%. This means that inflation is far outstripping wage growth and exacerbating the cost of living crisis for UK households.
The UK continues to grapple with a severe shortage of workers, as Covid resulted in some 500 thousand workers leaving their jobs, and many continental European workers left the UK after Brexit. For the first time on record, there are more job vacancies than unemployed persons in the UK.
This economic landscape leaves the Bank of England stuck between a rock and a hard place. The central bank must raise rates to contain soaring inflation, but this could tip the economy into a recession if the BoE is unable to guide it to a ‘soft landing’. Governor Bailey didn’t pull any punches on Monday in his testimony before lawmakers, saying that he was extremely concerned about inflation. We’ll get a look at UK inflation on Wednesday, with the markets bracing for a reading of 9.1% in April. I expect the inflation report to be a market-mover for the pound – a stronger than expected release will likely send the pound higher, while a weak release would put strong pressure on the currency.
Today’s employment report has raised expectations that the BoE will have to remain aggressive with its rate cycle, which has pushed UK yields and the British pound sharply higher. If the US/UK rate differential continues to narrow, the pound should be able to make up ground against the dollar.
GBP/USD Technical
- 1.2275 is providing support. Below, there is support at 1.2143
- GBP/USD has broken above resistance at 1.2393. Above, there is resistance at 1.2525
US 500 Index Faces Headwinds as Advances Engage
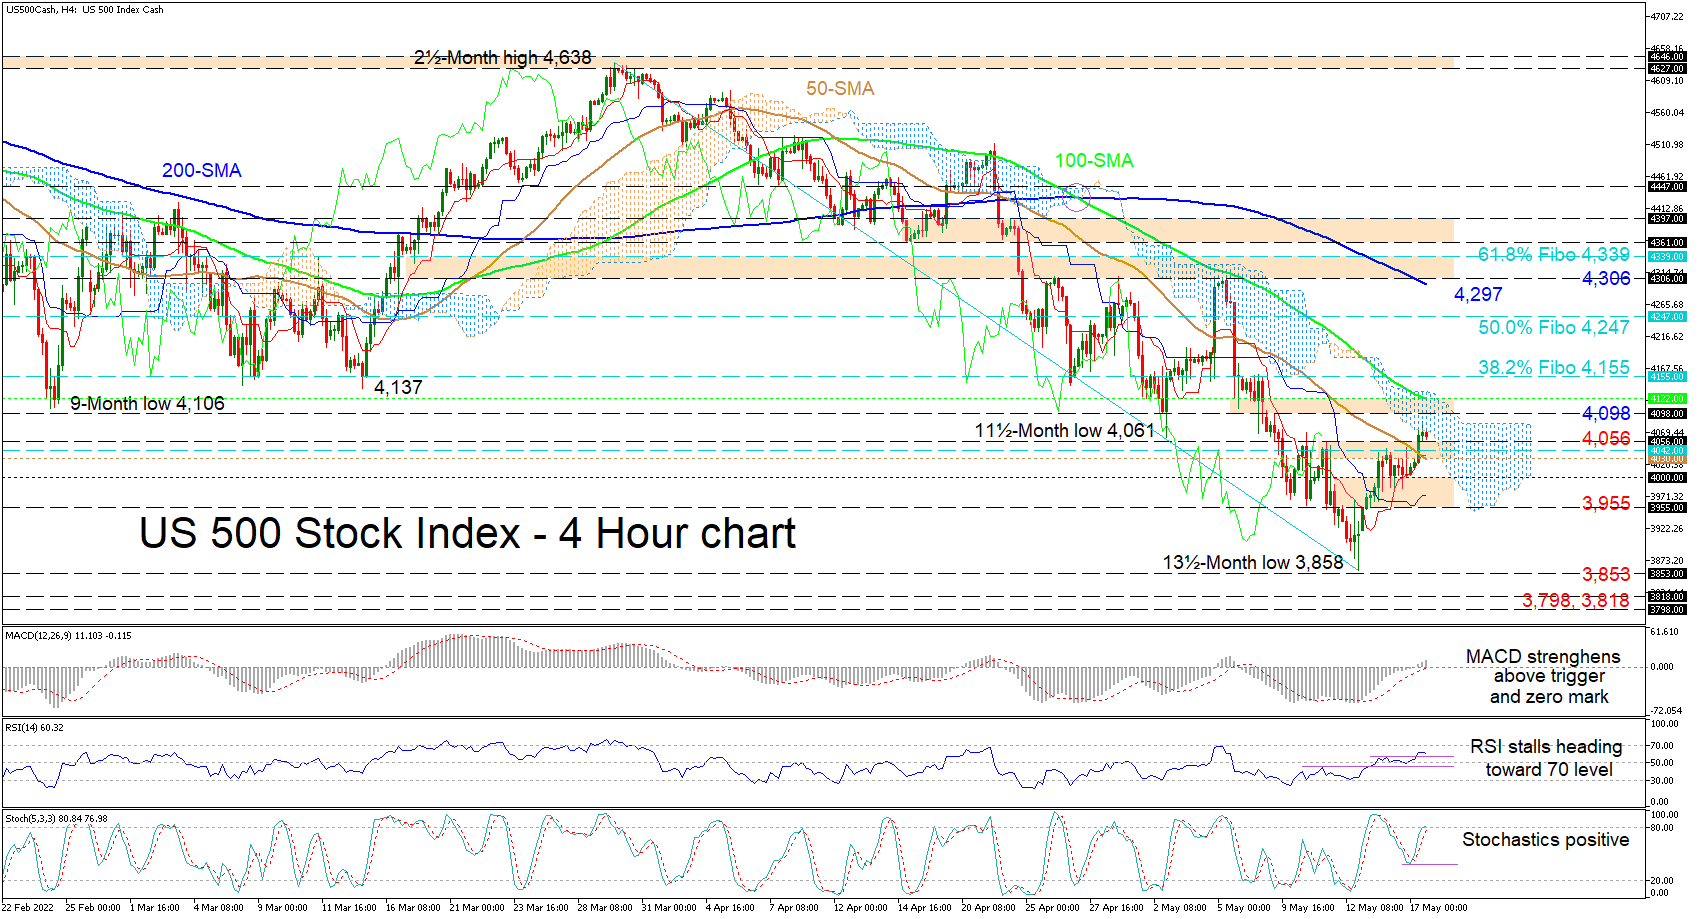
The US 500 stock index (Cash) is being curbed by the Ichimoku cloud after the index unearthed positive traction around a 13½-month low of 3,858, just shy of the March 2021 trough of 3,853. The diving simple moving averages (SMAs) are defending the more than six-week decline in the benchmark index.
Currently, the Ichimoku lines are reflecting the struggle buyers are encountering to extend push beyond the cloud. This is also being mirrored in the short-term oscillators. The MACD and the stochastic oscillator are promoting further upside impetus, while the RSI is implying positive momentum has become weak.
As things stand, the rebound in the index is facing upside constraints from the cloud and the resistance area between the 4,098 barrier and the falling 100-period SMA at 4,122. In the event the price overcomes the cloud, the 4,155 border, which is the 38.2% Fibonacci retracement level of the down leg from 4,638 until 3,858, could hinder additional gains in the index. Yet, persistent bullish backing may drive the price to test the 50.0% Fibo of 4,247 prior to confronting the dipping 200-period SMA at 4,297, adjacent to a key resistance section linking the 4,306 high with the 61.8% Fibo of 4,339.
Alternatively, if the cloud dampens positive forces, a nearby fortified support region from 4,056 until the 50-day SMA at 4,030 could test sellers’ efforts to reignite the bearish trajectory. However, a successful push lower may bring into play the 3,955-4,000 boundary before sellers navigate for the 13½-month trough of 3,858. Sinking past the 3,853 border may rekindle negative tendencies of a deeper correction with the bears aiming for the 3,818 and 3,798 lows from the early part of March 2021.
Summarizing, the US 500 index is suggesting a snag in risk-appetite. For sentiment to bolster, the price would need to steer north of the cloud.
Fed Bullard: We have a good plan for now
St. Louis Fed president James Bullard reiterated that "we have a good plan for now", in raising interest rate by 50bps at the next couple of meetings. He hoped that could bring inflation down with "the least amount of disruption we can get."
Bullard also said growth in range of 2.5-3.0% is " "fast compared to the long run potential rate of growth" of the economy, which may be just below 2%. Also, "labor markets are super strong...Household consumption is expected to hold through this year.".
People "want to put the pandemic behind them and they have lots of plans about spending," Bullard added.
Sunset Market Commentary
Markets
Market sentiment is subject to quite some wild swings. Last week, investors panicked that aggressive CB (especially Fed) rate hikes to address elevated (core) inflation would inevitably slow growth, triggering a sharp risk-off correction annex decline in core bond yields. Both factors currently are again moving the opposite way. Equities, European indices in particular, are rebounding. The Eurostoxx50 today gains another 1.4%. US indices open up to 1.9% higher (Nasdaq). We see this mainly as a corrective rebound. Recent eco data were mixed. Today, US April retail sales were much stronger than expected with core/control group sales rising 1.0% M/M and with March sales sharply upwardly revised. However, US consumer confidence (Friday) and the Empire manufacturing (yesterday) recently missed consensus by a wide margin. Whatever, markets see the glass again half full rather than half empty. Despite a mixed outlook on growth, central bankers reiterate that they can’t but give priority to prevent a de-anchoring of inflation expectations. This was one of the key take-aways from yesterday’s hearing of BoE members before a Treasury committee. Their view was supported by solid UK labour market data and higher than expected wages published this morning. In EMU, Q1 growth was upwardly revised from 0.2% Q/Q to 0.3% Q/Q. This is a backward looking indicator and won’t change the ECB’s assessment in any profound way. Even so, it gives some comfort for ECB policy makers who cautiously joined the scenario of a July rate hike of late. Dutch ECB member Knot, a well-known hawk, estimated the time ripe to air the idea of 50 bps ECB step if necessary. Both in EMU and the UK, the curve bear flattens. German are rising between 13 bps (2-y, corrected for a benchmark change) and 9 bps (30-y). 10-y intra-EMU spreads hardly change, with Greece the exception to the rule (-7 bps). UK yields are jumping between 19 bps (2-y) and 10 bps (30-y). US bond markets outperform the UK and Germany with yields rebounding between 9 bps (5-y/10-y) and 6 bps (30-y). As said, panic on growth (temporarily) subsided. Inflation is again in focus. However, it wouldn’t surprise us to see new pockets of uncertainty on growth resurface in the (near) future. Later today, ECB’s Lagarde and Fed Chair Powell are still scheduled to speak.
We haven’t seen it for a while, but FX markets today show a combination of both euro strength and a USD weakness, or at least correction. After a rejected test of the 105 area end last week, the DXY trade-weighted index (103.50) eases further. USD/JPY is the exception to the USD correction (129.75 from an open of 129.16). However, the risk-on and the comments from ECB’s Knot finally give the single currency some breathing space. The pair regains the 105 handle. To call off the downside alert EUR/USD needs to regain 1.0642 early May top. Sterling had a strong start this morning supported by solid labour market data including higher than expected wage growth. This supported BoE Bailey’s case to continue to raise rates, even given the risk for a sharp cooling of growth further down the road. EUR/GBP tested the 0.84 area. However, during the day, the euro strength also came in play. In addition, UK foreign Secretary Lizz Truss formally revealed UK plans to unilaterally change parts of the Northern Ireland protocol also didn’t help sterling. EUR/GBP currently trades again in the 0.8450 area. News Headlines
Hungarian first quarter GDP was stronger than expected, printing at 2.1% q/q (1.5% expected), matching almost the upwardly revised 2.2% of Q4 last year. The economy is now 8.2% bigger in yearly terms. The flash reading only provides details on the sector level. All sectors contributed to the increase, the Hungarian statistical office said, but mostly industry and market services. The strong growth probably received a boost from PM Orban’s pre-election spending spree and may be unsustainable for coming quarters. Hungary’s forint strengthens today though that is at least equally as much inspired by the broad risk-on. EUR/HUF eases from near-record lows at 390 to 386.86. GDP in Poland added a lofty 2.4% q/q in Q1 to be up 9.1% compared to the same quarter last year. There are no decomposition tables available yet. The zloty appreciates in lockstep with other CE currencies. EUR/PLN drifts to 4.64, the lowest level since end April.
U.S.: Retail Sales Gain Momentum in April
Retail sales started the second quarter on a strong footing with an increase of 0.9% month-on-month (m/m), in line with the consensus estimate. Moreover, March's reading was revised up to 1.4% m/m from 0.5% m/m reported previously, which makes today's number stronger than the headline appears.
Sales at autos & parts dealers rose by 2.2% m/m, while March's first estimate was revised up to -1.6% (vs. the 1.9% decline reported earlier). Solid growth and upward revisions were seen in both auto dealers and automotive parts & tire stores, where sales increased by 2.2% m/m and 2.0% m/m, respectively. Excluding autos, retail sales were up 0.6% m/m in April.
Sales at gasoline stations were down by 2.7% m/m, while building materials retailers reported a modest pullback of 0.1% m/m.
Sales in the "control group", which excludes the above categories and are used in calculating personal consumption expenditures (and GDP), were up by 1.0% m/m. Previous month's sales were revised to a much stronger 1.1% m/m from the advance reading of -0.1% m/m.
Within the group, the only categories in the red were sporting goods & music stores and food & beverage stores where sales declined by 0.5% and 0.2% m/m, respectively.
The rest of the categories reported gains with miscellaneous stores retailers (+4.0% m/m) leading the pack, followed by non-store retailers (+2.1% m/m), and food services & drinking places (+2.0% m/m). March's sales at all of these categories were revised up.
Key Implications
March's upward revisions helped retail sales finish the first quarter of 2022 at 3.4% – higher than we originally expected, which will push Q1 spending a bit higher than what was initially reported (2.7% q/q ann.) in the advanced estimate of GDP. Combined with decent growth in April, real consumption is on track to grow at 2.3% (annualized) in the second quarter. This means that consumer spending will continue to prime the economy.
Drilling down to details, adjusted for inflation, demand for "going out" categories continued to increase with sales at clothing stores and food services & drinking places each growing by 1.5%. Meantime, despite the slump in nominal terms, our real estimates of sales at gas stations are showing growth of almost 4%, which suggests that a modest decline in April's gas prices was enough for drivers to fill up their tanks.
Indeed, while elevated prices continue to reduce consumer purchasing power, consumers have no plans on cutting back. According to New York Fed's April Household Spending Survey, expected growth in monthly expenditures was the highest since the survey began in August 2015. Growth in essential spending remains the biggest driver, while the median expected growth in nonessential spending remained unchanged and above the historical trend. When making plans for large purchases, consumers reported that they are more likely to splurge on vacations, supporting our expectations for a further acceleration in services spending.