Sample Category Title
Elliott Wave Analysis: EUR/USD Turns Up for a Corrective Rally
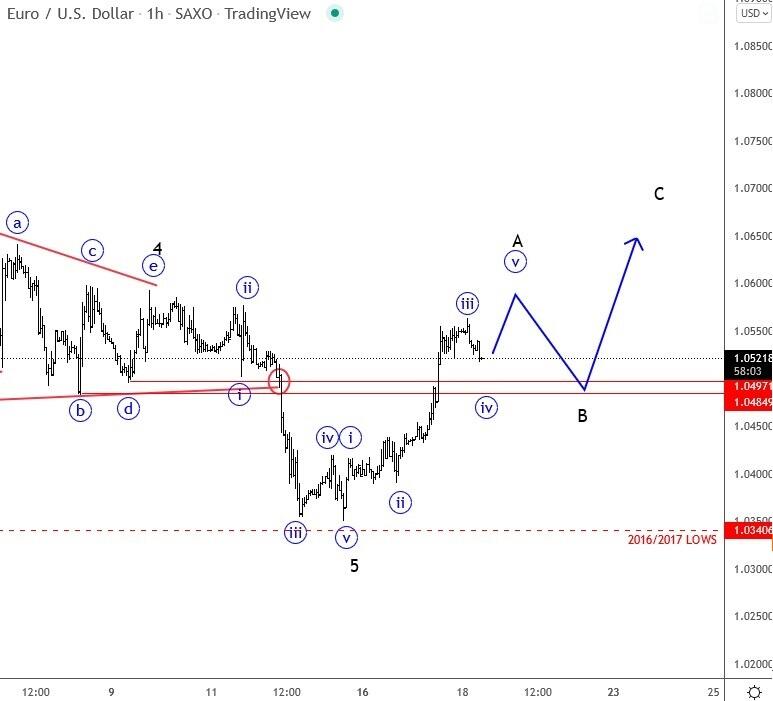
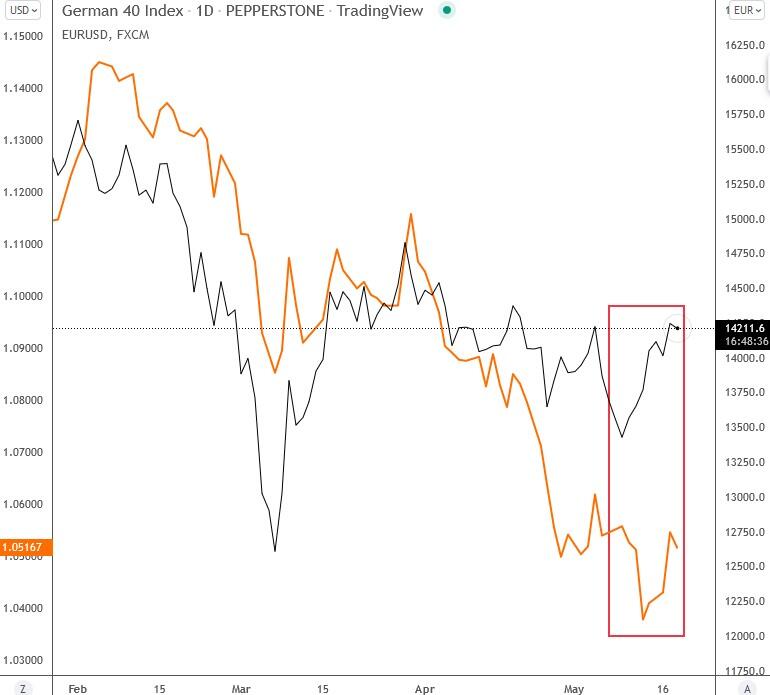
Shanghai city’s authorities allowed some institutions to resume work after no new coronavirus cases. So that's positive for stocks that were higher recently. Also, FED and ECB are ready for higher rates if data will be good in the upcoming months. ECB specifically mentioned that they will make the first rise this summer and that they are ready to move from negative rates quickly. So in my view, I think EUR can be more interesting for a bullish run than USD as ECB still has to take some actions while FED is already in process of hikes. So the gap between CB policies can narrow and that can take a pair higher. From an Elliott wave perspective we see pair recovering in wave A, the first leg of a higher degree correction, so be aware of more gains in sessions ahead. EUR is also catching up the DAX after that divergence last week.
Nasdaq 100 Relief Rally Continues as Investors Buy the Dip
American stocks rose on Tuesday as the recovery rally continued. The Dow Jones rose by more than 175 points while the tech-heavy Nasdaq 100 index rose by more than 1.1% as the tech rally continued. The latest catalyst for the rally was the strong American retail sales numbers. According to the Commerce Department, retail sales rose for the fourth straight month. Sales rose by 0.9% in April from the previous month. Still, since retail sales are not adjusted for inflation, it means that consumers are getting less due to high prices. Also, results by leading companies like Walmart and Home Depot showed that their margins are struggling.
The British pound rose sharply in the overnight session as the US dollar retreated. The currency rose after data revealed that the UK unemployment rate declined to the lowest level since 1975. Additional data revealed that wages continued growing as the labor market tightened. The currency will be in the spotlight as the Office of National Statistics (ONS) publishes the latest inflation data. Economists expect the data to reveal that the headline CPI rose from 7.0% to 9.1% in April. Similarly, they believe that the core CPI rose from 5.7% to 6.2%. If analysts are correct, these will be the highest numbers in more than three decades.
The euro rose also rose after hawkish sentiment from European Central Bank (ECB) officials. In an interview, the Dutch Central Bank president said that the ECB should implement a 0.50% in the July meeting. In another statement, Christine Lagarde also hinted that the bank would start hiking rates. Later today, Eurostat will publish the latest consumer price index (CPI) data. Economists expect the numbers to show that the headline CPI rose by 7.5% in April while core CPI rose by 3.5%. The other important economic data to watch today will be the latest US building permits and housing starts and crude oil inventories data.
EURGBP
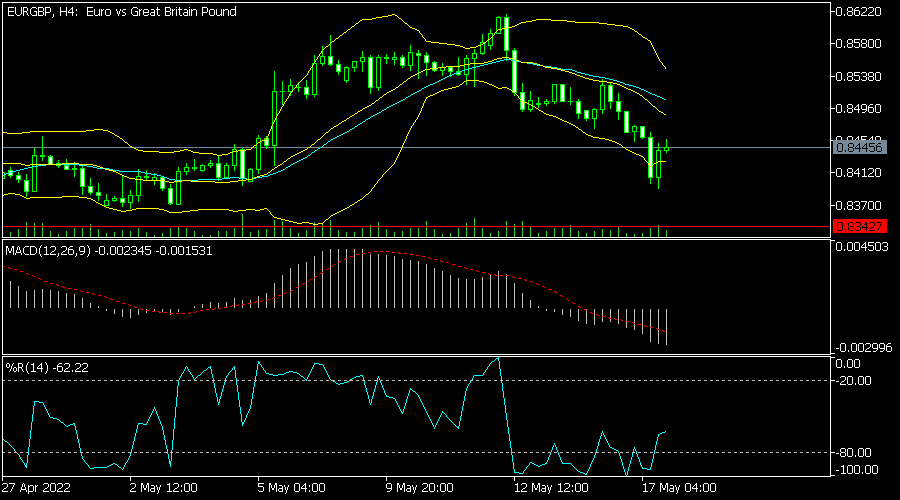
The EURGBP pair declined to a low of 0.8390 on Tuesday and then pulled back to the current 0.8445. On the four-hour chart, the pair moved between the middle and lower lines of the Bollinger Bands. It also declined below the 25-day moving average while the MACD moved below the neutral line. The Williams % Range moved above the oversold level. The pair will likely keep be volatile as investors react to the latest UK and EU inflation data.
NAS100
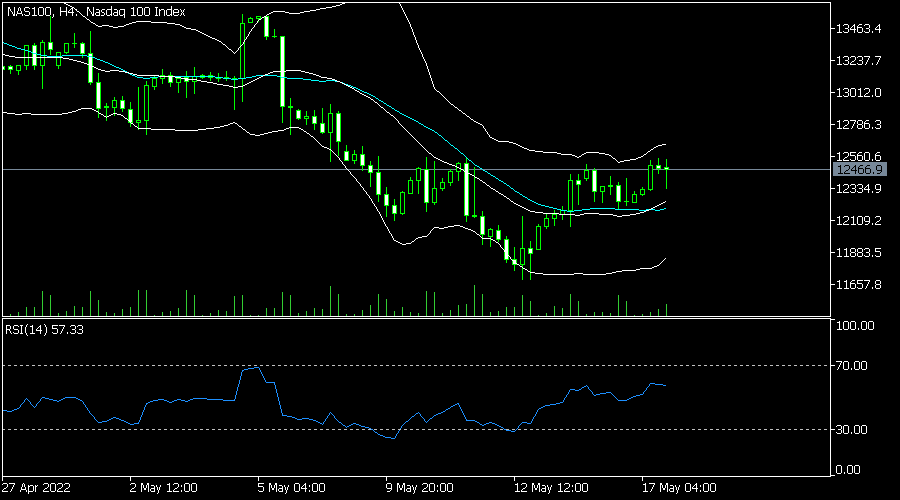
The Nasdaq 100 index continued its recovery as investors bought the dip. The index rose to a high of $12,475, which was significantly higher than this month’s low of $11,700. On the four-hour chart, the pair moved between the middle and the lower lines of Bollinger Bands. It has also moved above the 25-day moving average while the Relative Strength Index (RSI) continued rising. Therefore, the index will likely keep rising, with the next key resistance being at $12,600.
EURUSD
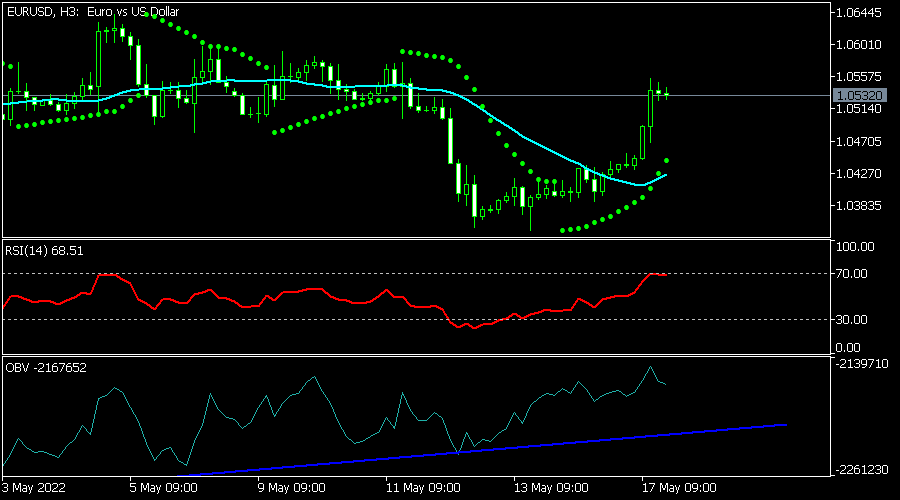
The EURUSD pair rose to the highest point since May 12 ahead of the upcoming EU inflation data. On the four-hour chart, the pair moved above the dots of the Parabolic SAR indicator. It has moved above the 25-day moving average. The Relative Strength Index has moved to the overbought level while the On-Balance-Volume (OBV) has been rising. Therefore, the pair will likely keep rising.
USDJPY Struggles Near 20-Day SMA and Marginally Above 129.00
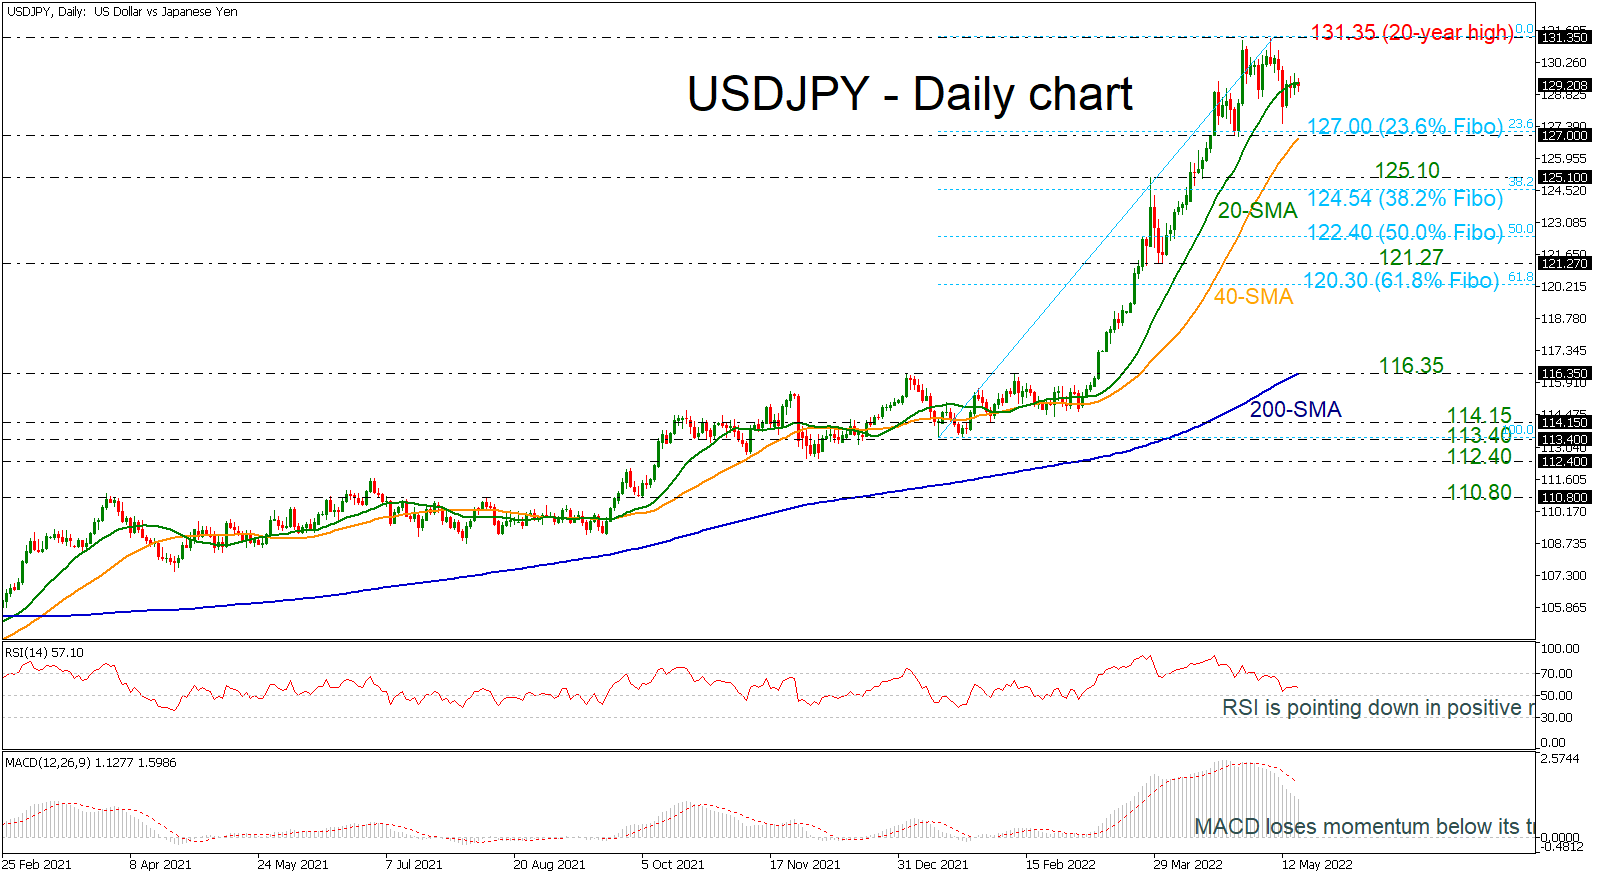
USDJPY is heading sideways, back and forth of the 20-day simple moving average (SMA) slightly above the 129.00 round number. The weak momentum is mirroring in the technical indicators as well, as the RSI is pointing slightly lower in the positive region, while the MACD is moving lower below its trigger line.
In the event the bulls take control again, the 20-year high of 131.35 will come first into view. A violation at this point may see another challenge battle around the 135.20, taken from the high in January 2002.
Should the bears dominate, driving the price below the 20-day SMA, the spotlight will shift to the 23.6% Fibonacci retracement level of the up leg from 113.40 to 131.35 around 127.00, which overlaps with the 40-day SMA. Any step lower will put the pair in a neutral mode, testing 125.10. Slightly lower, the 38.2% Fibonacci of 124.54 and the 50.0% Fibonacci of 122.40 may attract traders’ attention.
In brief, USDJPY continues to be in positive territory, but only a climb above the previous peak of 131.35 could endorse the bullish outlook.
Daily Technical Analysis
EUR/USD
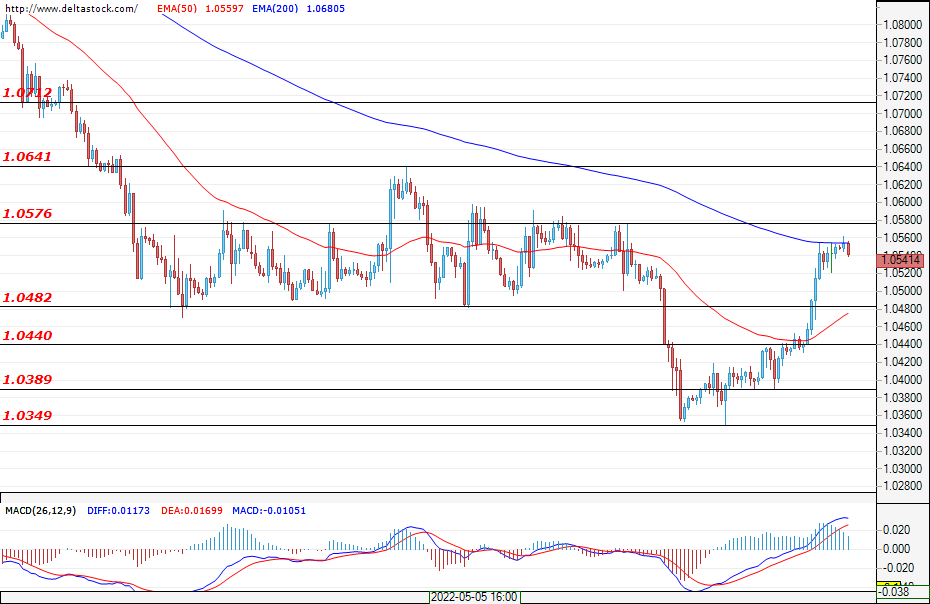
The pair marked а third consecutive day of gains as yesterday's session ended near the highs for the day. Trading has again resumed in the range between the support at 1.0482 and the resistance at 1.0576. Recent moves suggest a test of this resistance, however, and the expectations are for an initial pullback towards 1.0482 or 1.0440. The bulls would expect better levels before they could enter the market, in order to prepare for a test and a possible breach of the resistance. With a breach of the 1.0576 zone, a more substantial rally, with targets of 1.0760 and even 1.0920, can be expected. If this scenario fails, then the bearish pressure can be expected to persist and the annual support at 1.0350 could eventually be disrupted. Today, increased activity can be expected around the announcement of the CPI data for the eurozone at 09:00 GMT.
USD/JPY
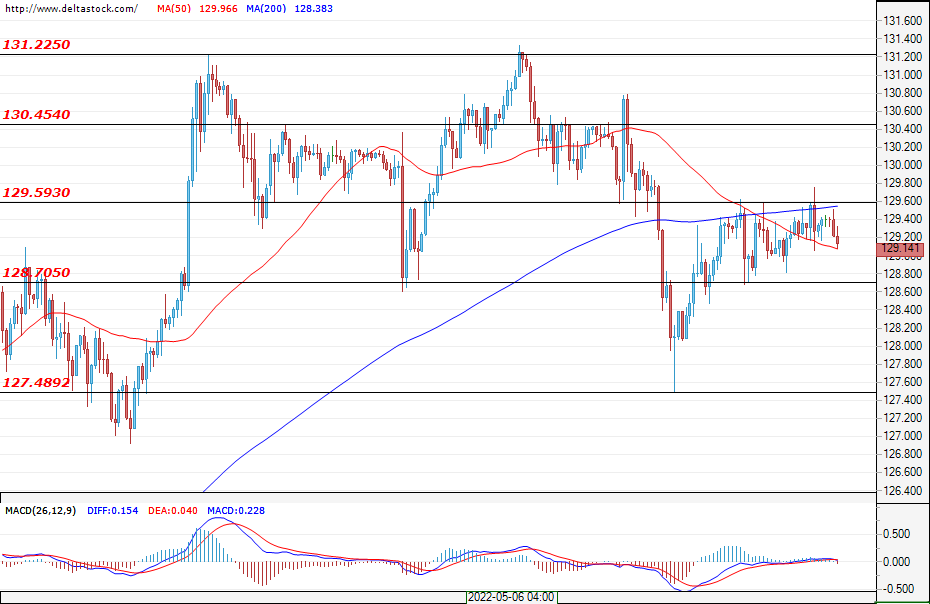
As expected, prices below 128.70 attracted the attention of the bulls and they entered aggressively at the support of 127.48. At the moment, the market is consolidating and growth has slowed due to the weaker U.S. dollar. The first significant resistance for the bulls is 129.60. It is expected to hold or, if violated, to be short-lived. It is possible that the pair has begun sliding in a downtrend belonging to the lower time frames, but this will become clear at the end of the current consolidation. An alternative scenario is for the pair to continue trading in the wide range between 127.50 and 131.20.
GBP/USD
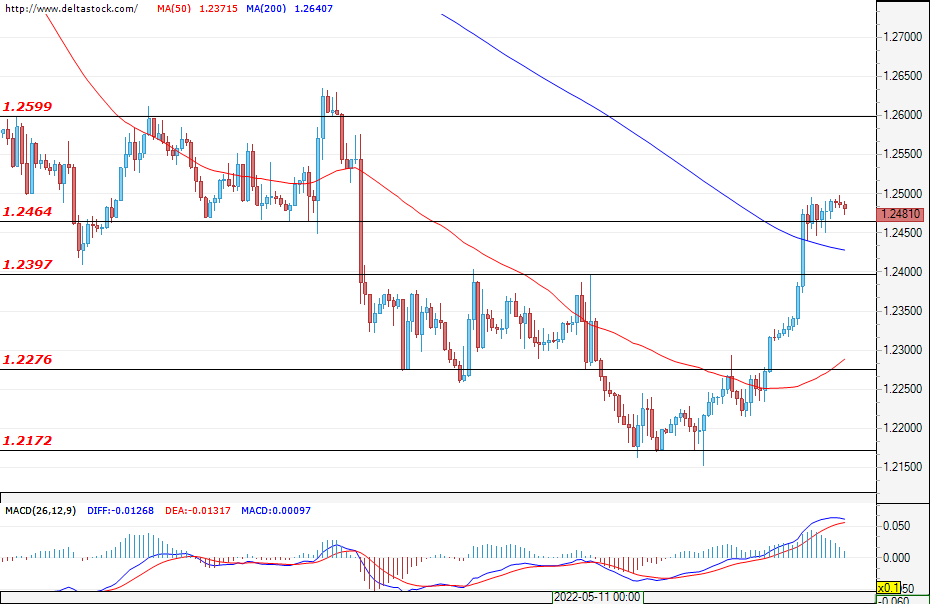
The situation of the Cable resembles that of the EUR/USD. The area at around 1.2170 offered serious support to the bulls, and yesterday the rally gained momentum. It is likely that prices will retrace towards 1.2400, where the bearish pressure should remain limited. This would confirm the bullish attitudes and the change in market sentiment. The stability of the movement would be revealed after the first correction, and if the rally continues, then a test of 1.2600 can be expected. There is still no confirmation of a trend reversal and the recent gains may simply turn out to be a short position squeeze.
EUGERMANY40
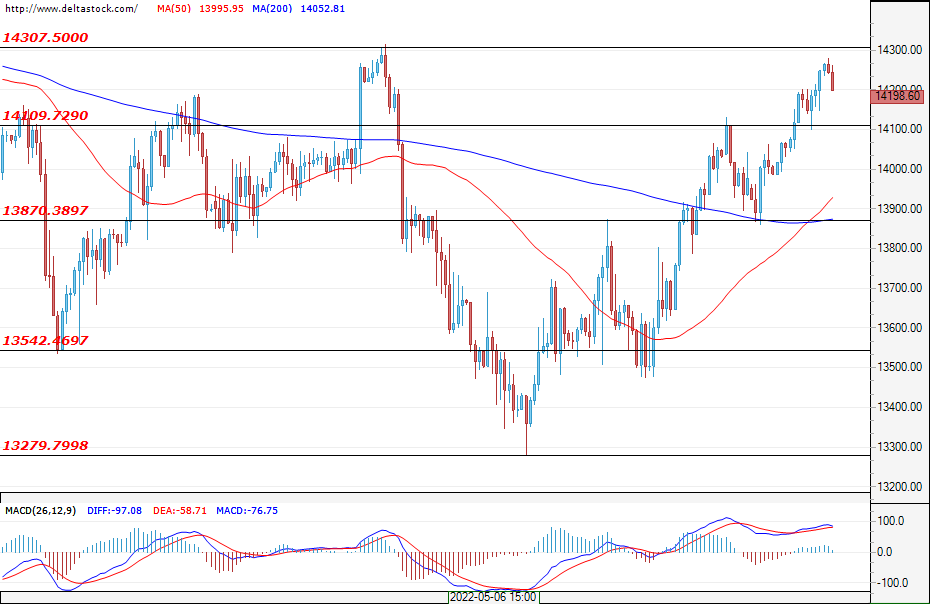
The German index continued to rise since the beginning of the week and prices approached the key resistance at 14315. Around this area, the bears could take action and the market might retrace towards 14110. If the bulls still manage to take over this area, then the index could extend its gains towards 14550. Significant support the bulls can currently expect at around 13870.
US30
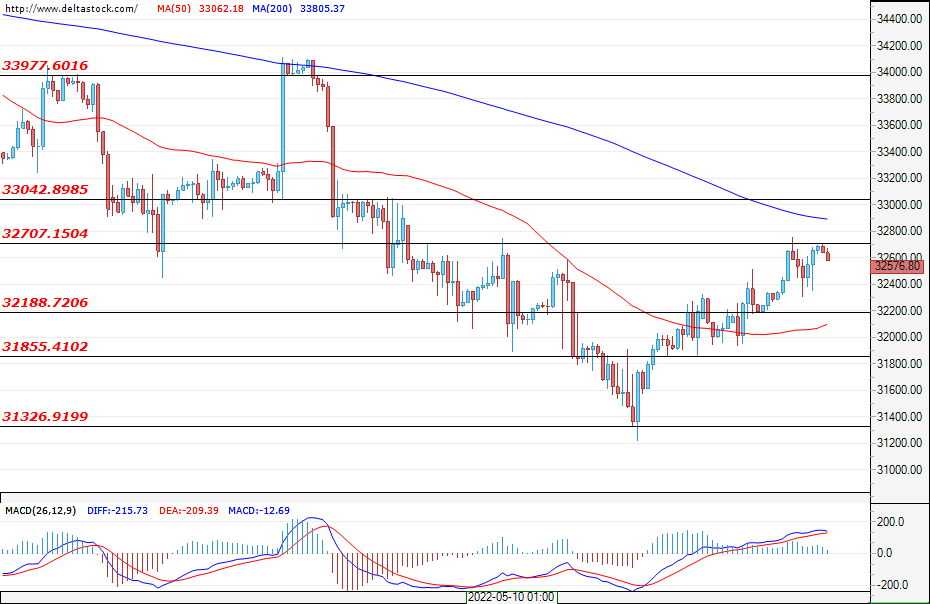
The U.S. blue chips tested the resistance at 32700 and a deeper pullback can be expected here. Substantial support is likely to be found at around 32190 and the bulls can expect better entry levels below 32400. If the 32700 is successfully breached, then the next target would be 33050. The market is still under bearish control and so any growth here may prove unstable. The zones at 33100 and at 34100 that belong to the higher time frames, can be noted as serious obstacles for the bulls.
XAU/USD Tests Critical Floor
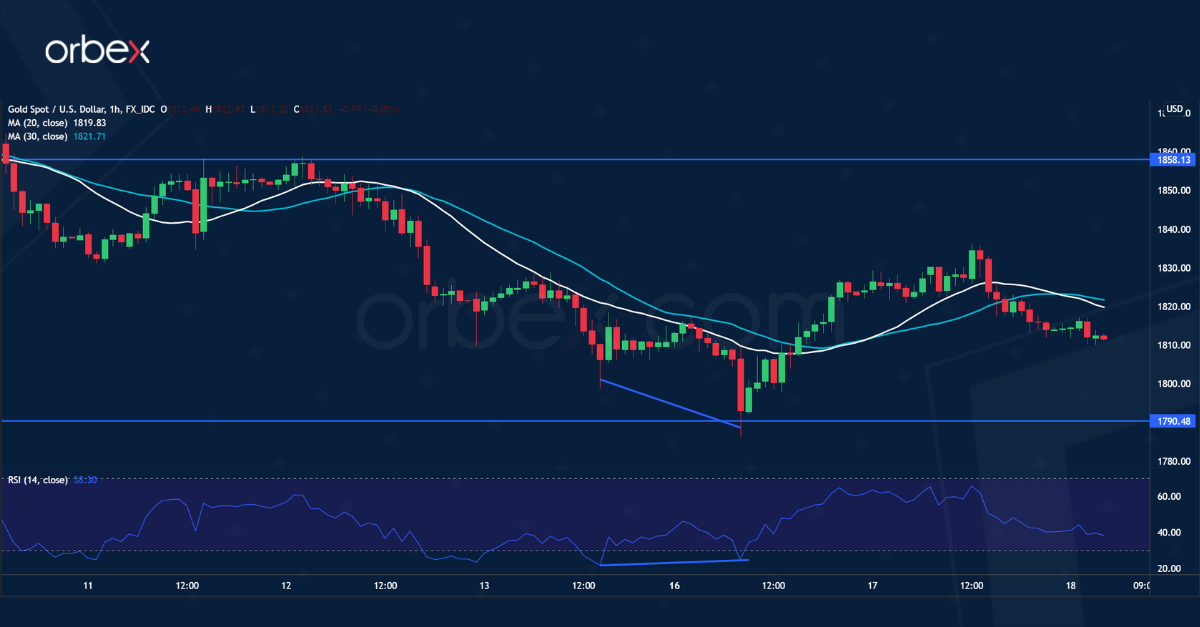
Gold inched higher as the US dollar index pulled back from a two-decade high. The price action has stabilised near January’s lows at 1790. A bullish RSI divergence indicates a loss of bearish momentum in this critical demand area, triggering a buy-the-dip behaviour. Sellers’ profit-taking could drive the precious metal higher. A bounce above 1858 may trigger an even broader short-covering. On the downside, a fall below 1790 would send the price into bearish territory with December’s lows (1750) as the next stop.
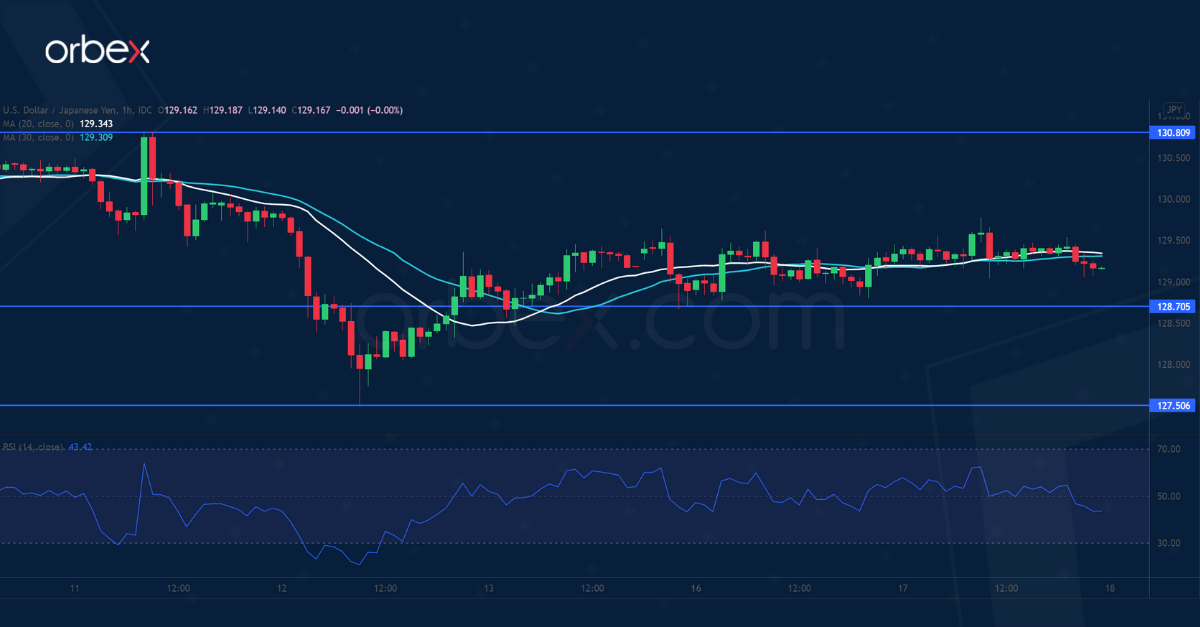
USD/JPY Enters Narrowing Consolidation
The yen recouped some losses after Japan’s GDP growth beat expectations in Q1. The US dollar is taking a breather after a prolonged rally. The latest retreat has found support at 127.50 over the 30-day moving average. Medium-term sentiment would stay upbeat as long as the price remains above this demand zone. 130.80 from a previously faded rebound is a key resistance and a bullish breakout could resume the rally towards 133.00. 128.70 is the immediate support for the current consolidation.
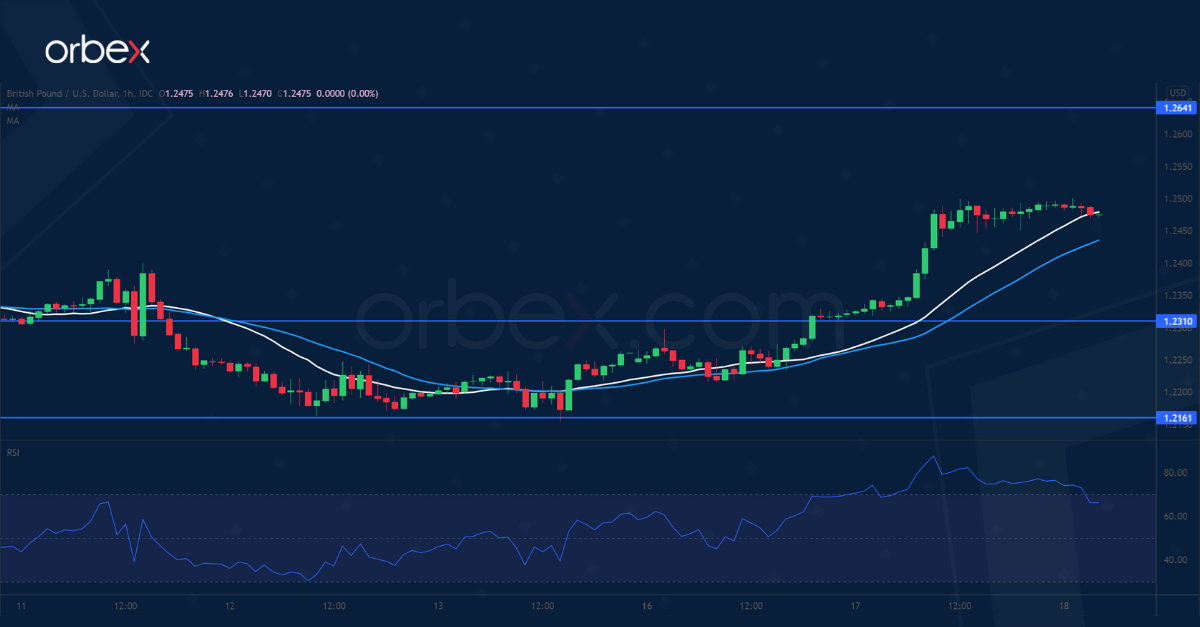
GBP/USD Tests Daily Resistance
The pound surged after the UK saw a jump in average earnings over the past three months. Solid bullish momentum above 1.2400 has prompted sellers to cover their positions, exacerbating volatility in the process. The daily resistance at 1.2640 coincides with the 30-day moving average and is an important supply zone. Its breach could pave the way for a bullish reversal in the weeks to come. In the meantime, an overbought RSI may cause a pullback as intraday buyers take profit. 1.2310 is the closest support.
GBP/JPY Daily Outlook
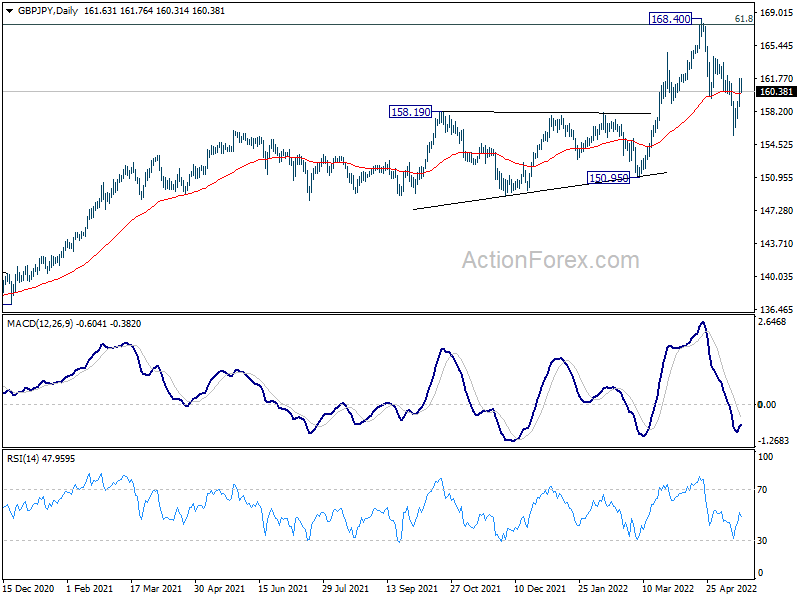
Daily Pivots: (S1) 159.65; (P) 160.75; (R1) 162.70; More...
Intraday bias in GBP/JPY remains neutral first. Risk will stay on the downside as long as 162.16 minor resistance holds, as correction from 168.40 could extend. On the downside, below 155.57 will target 150.95 key structural support next. Nevertheless, firm break of 162.16 will indicate that the correction has completed, and bring retest of 168.40 high next.
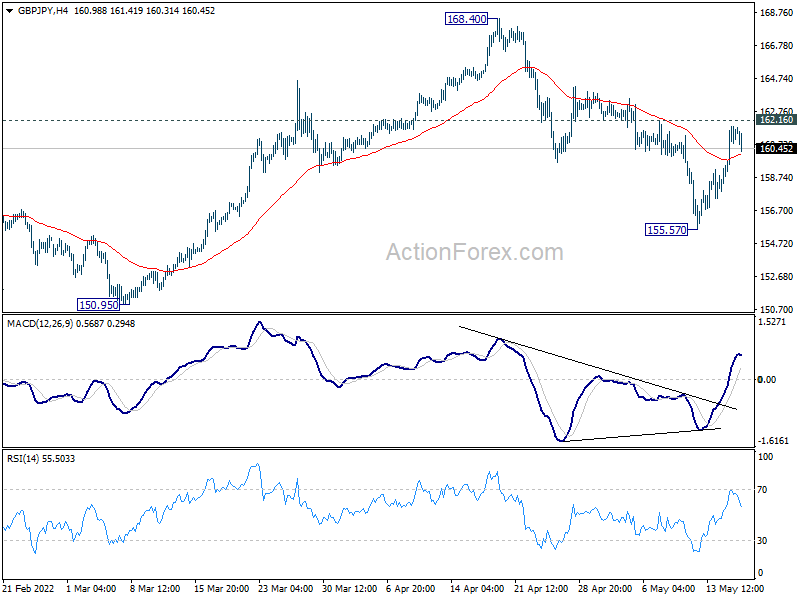
In the bigger picture, up trend from 123.94 (2020 low) is still in progress. Sustained break of 61.8% retracement of 195.86 (2015 high) to 122.75 (2016 low) at 167.93 will be a long term bullish signal, and could pave the way back to 195.86 high. This will now remain the favored case as long as 150.95 support holds, even in case of deep pull back. However, firm break of 150.95 will indicate rejection by 167.93, and bearish trend reversal.
EUR/JPY Daily Outlook
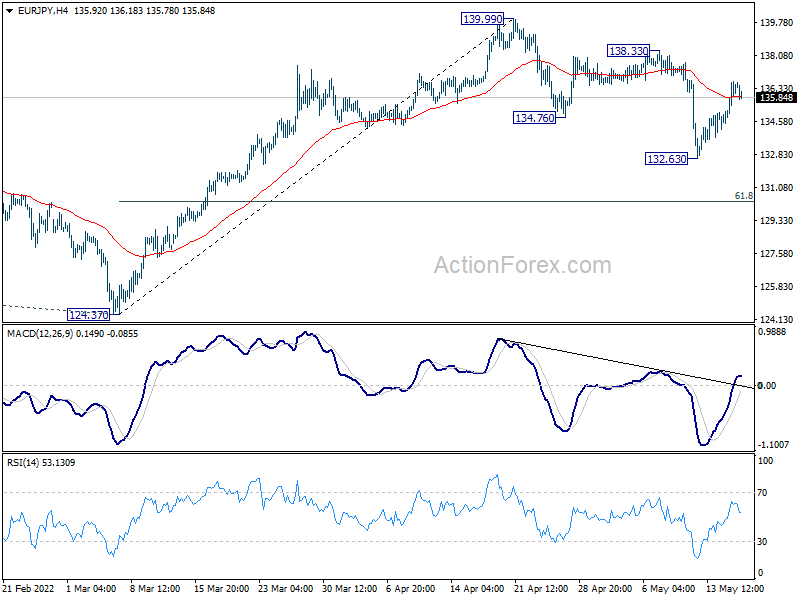
Daily Pivots: (S1) 135.09; (P) 135.89; (R1) 137.28; More....
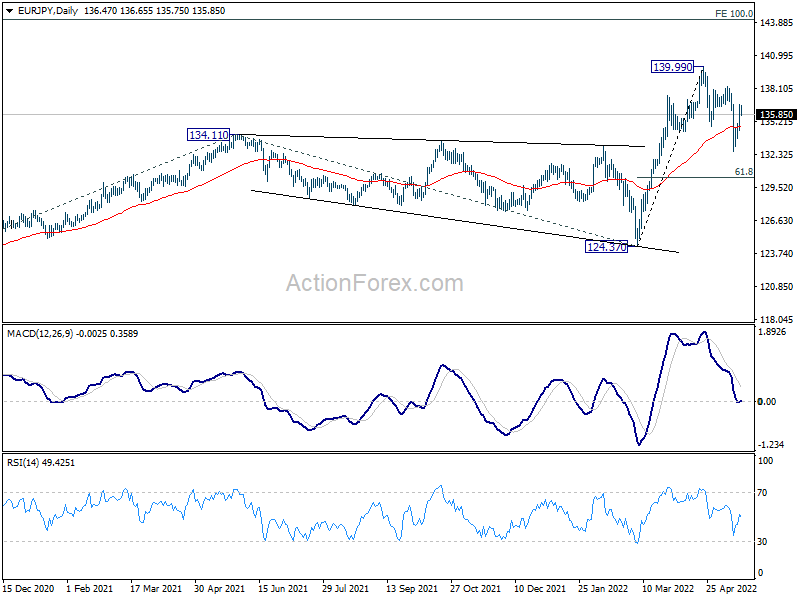
Intraday bias in EUR/JPY remains neutral first. Corrective fall from 139.99 could still extend lower. Below 132.63 will target 61.8% retracement of 124.37 to 139.99 at 130.33. Nevertheless, break of 138.33 will indicate that the correction has completed, and bring retest of 139.99 high next.
In the bigger picture, up trend from 114.42 (2020 low) is in progress. Such rise is seen as the third leg of the pattern from 109.30 (2016 low). Next target will be 100% projection of 114.42 to 134.11 from 124.37 at 144.06. In any case, outlook will now remain bullish as long as 124.37 support holds, in case of deep pull back.
EUR/GBP Daily Outlook
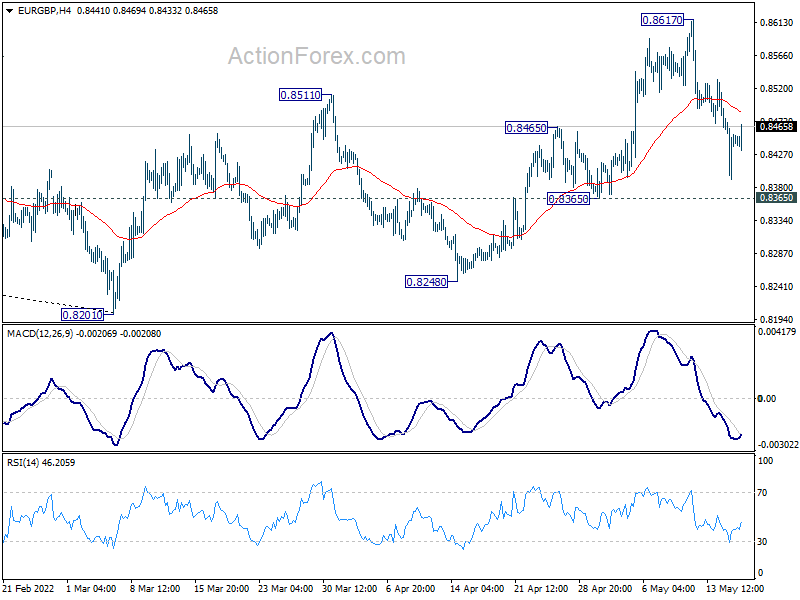
Daily Pivots: (S1) 0.8402; (P) 0.8438; (R1) 0.8484; More...
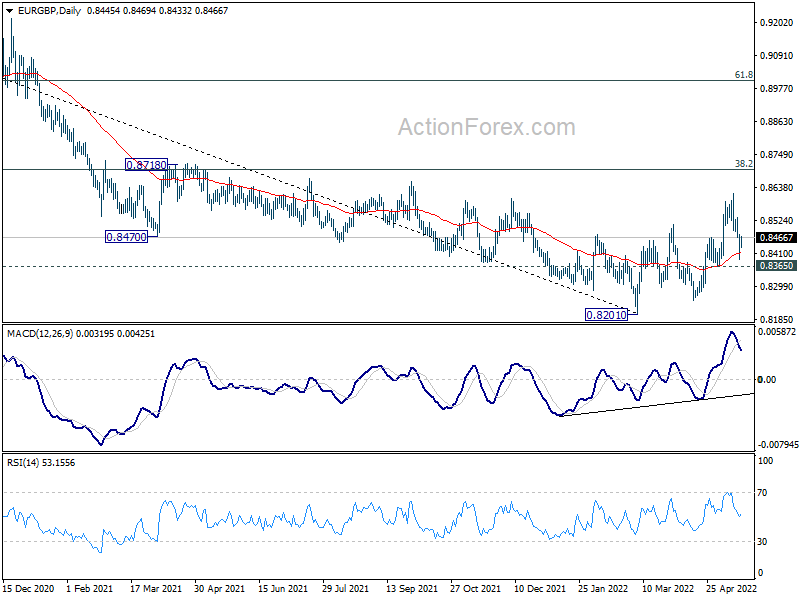
Intraday bias in EUR/GBP remains neutral for the moment. With 0.8365 support intact, further rise is still in favor. On the upside, break of 0.8617 will resume rise from 0.8201 medium term bottom to 0.8697 medium term fibonacci level. However, break of 0.8365 will dampen this bullish view, and turn bias back to the downside instead.
In the bigger picture, a medium term bottom could be in place at 0.8201, on bullish convergence condition in daily and weekly MACD. Rise from there could either be a correction to the down trend from 0.9499 (2020 high), or a medium term up trend itself. In either case, further rise should be seen to 38.2% retracement of 0.9499 to 0.8201 at 0.8697. Sustained break there will target 61.8% retracement at 0.9003.