Sample Category Title
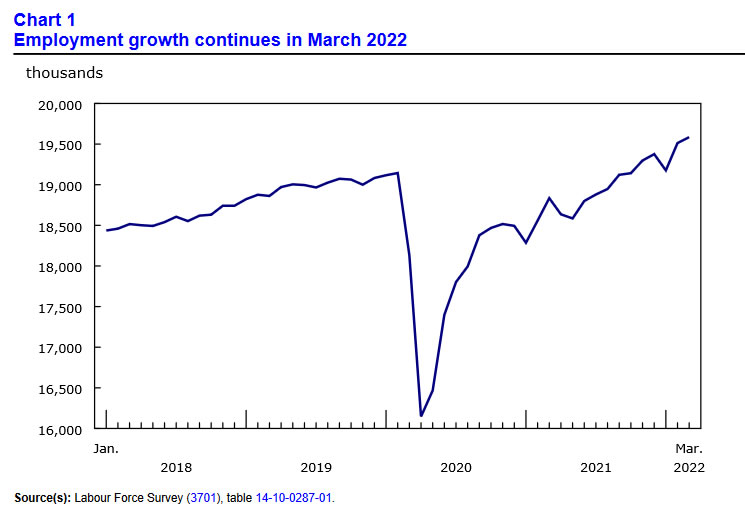
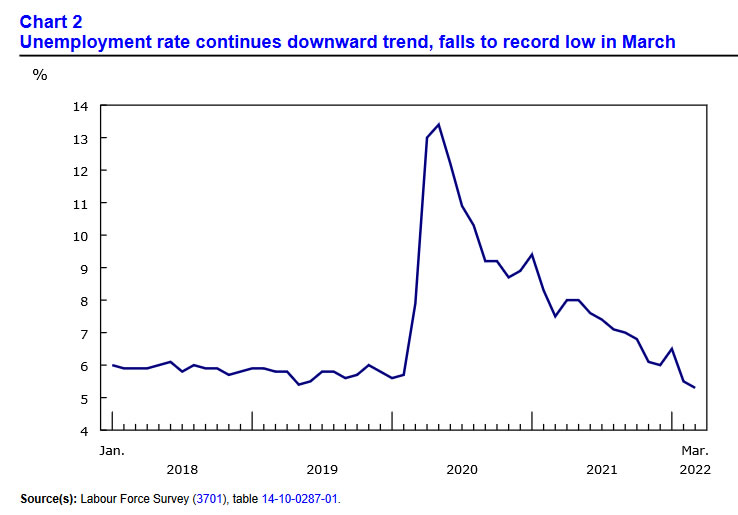
Canada employment grew 73k in Mar, unemployment rate dropped to record low 5.3%
Canada employment grew 73k, or 0.4% mom, in March, slightly below expectation of 78k. The growth was driven by 93k rise in full-time jobs. Services-producing jobs rose 42k while goods-producing jobs rose 31k.
Unemployment rate dropped -0.2% to 5.3%, lowest on record since 1976. Total hours worked rose 1.3% mom. Average hourly wages rose 3.4% yoy.
Canadian Dollar Steadies, Job Data Next
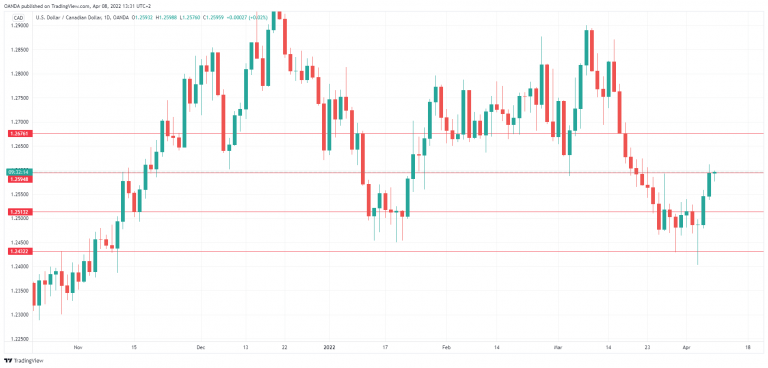
The currency markets are in calm waters today, with one eye on the weekend. The Canadian dollar is no exception, as USD/CAD is unchanged, trading just shy of the 1.26 line.
The Federal Reserve continues to send out hawkish feelers to the markets. On Thursday, Fed member James Bullard weighed in, saying that the Fed is behind in its battle with inflation and needs to increase rates by another 300 points by the end of the year. This would translate into 0.50% hikes at each of the Fed’s six remaining meetings in 2022. Bullard’s stance is more aggressive than the markets, which expect the Fed to raise rates to a range between 2.50% and 2.75% by year’s end.
The Fed minutes indicated that “many” FOMC members are ready to increase rates by 0.50% at upcoming meetings, and we’re seeing this stance in comments from both hawkish and dovish members. Bullard is a hawk, so his comments didn’t move the needle on the US dollar. In contrast, Lael Brainard’s comments about accelerating balance sheet reductions and putting 0.50% hikes on the table sent the dollar higher, since she has been very dovish in her stance.
Canada expected to post strong job numbers
Canada will wrap up the week with the March employment report. The economy added 336 thousand jobs in February, an outstanding performance. The economy is expected to add another 80 thousand jobs, and unemployment is forecast to fall from 5.5% to 5.3%. If today’s report points to a stronger labor market, it will put further pressure on the BoC to raise rates at next week’s meeting. Investors will also be eyeing the possibility that the BoC may follow the Fed’s lead and consider reducing its balance sheet, which would be bullish for the Canadian dollar.
USD/CAD Technical
- USD/CAD is pressing on resistance at 1.2595. Above, there is resistance at 1.2676
- There is support at 1.2513 and 1.2432
Ending a Bad Week on a Positive Note
The stock market recovery has stalled this week despite indices ending on a positive note as investors digest the latest speak from central banks.
Naturally, front and centre on this is the Fed which has notably become more hawkish, something the minutes confirmed is not just a knee-jerk response to the latest economic reports.
We all expect James Bullard at this point to be at the more hawkish end of the spectrum, so his call this week for rates to hit 3.5% this year didn't cause the shock and awe it would have had they come from certain other members. Lael Brainard's admission on rates and the balance sheet caused more of a shudder, despite being less aggressive, and were later confirmed by the minutes themselves.
But as ever, investors are taking the prospect of high inflation and rapid rate hikes in their stride and appear relatively undeterred. The yield curve has normalised a little over the course of the week which means the dreaded 2/10 inversion has reversed which may be providing some light relief. I imagine there'll be plenty more wild swings over the coming weeks.
CBR cuts rates and eyes more
The Bank of Russia is seemingly buoyed by recent actions from the Kremlin despite severe sanctions continuing to be imposed by the West. The capital controls that have been imposed have helped to shore up the rouble which appears to have given the CBR confidence that interest rates no longer need to be so high.
It cut the Key Rate by 3% and left the door open to further cuts depending on financial and economic conditions. At 17%, the rate remains extremely high as inflation is still expected to spike and the economy severely contract. Given how markets have responded, the CBR may well follow up with further easing later this month.
Oil hovers around $100
A second weekly decline in oil prices has eased some of the pressures on the global economy going forward, thanks to a combination of factors including huge SPR releases and Chinese lockdowns. Still, at around $100 a barrel, prices are very high and there remain significant upside risks going forward.
How prolonged and widespread Chinese lockdowns become could be a key factor in the short-term, with it being such a large consumer and some cities with very few cases already imposing harsh restrictions. The zero-Covid approach in Beijing could weigh heavily on economic activity, with the hope being that a quick eradication can once again see it rapidly spring back. If not, it could help keep a lid on oil prices.
Gold consolidates further
Gold is trading around the same level it was yesterday, the day before that, the day before that and so on. Despite the spike in volatility seen elsewhere this week as a result of the hawkish Fed shift, gold has been unmoved. We continue to see consolidation in the yellow metal, with the daily ranges tightening rather than widening as you may have expected. There are multiple forces at play here but traders are seemingly clinging to their traditional inflation hedge and safe haven.
Bitcoin seeing support but missing out on risk rebound
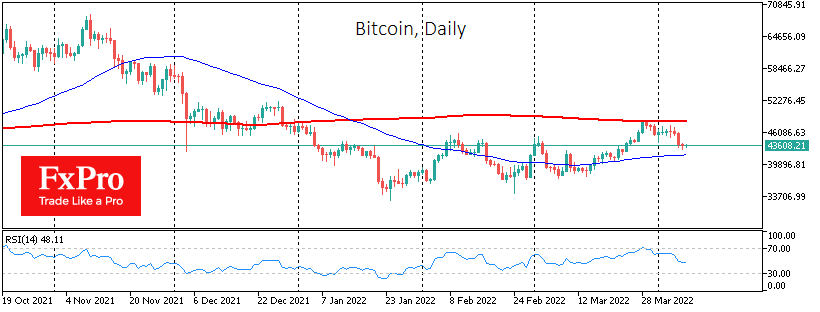
It's been a rough week for bitcoin which has been hammered by deteriorating risk appetite just after it broke through a major resistance level. The recovery of risk has only seen it stabilise which is interesting given the momentum it had prior to this period. It has found some support around $43,000 which is the 50% retracement of the March lows to highs and also coincides with the pre-breakout resistance. Maybe just a coincidence but certainly a level to watch.
Oil Price Moved into a Short-Term Bearish Zone Below $100
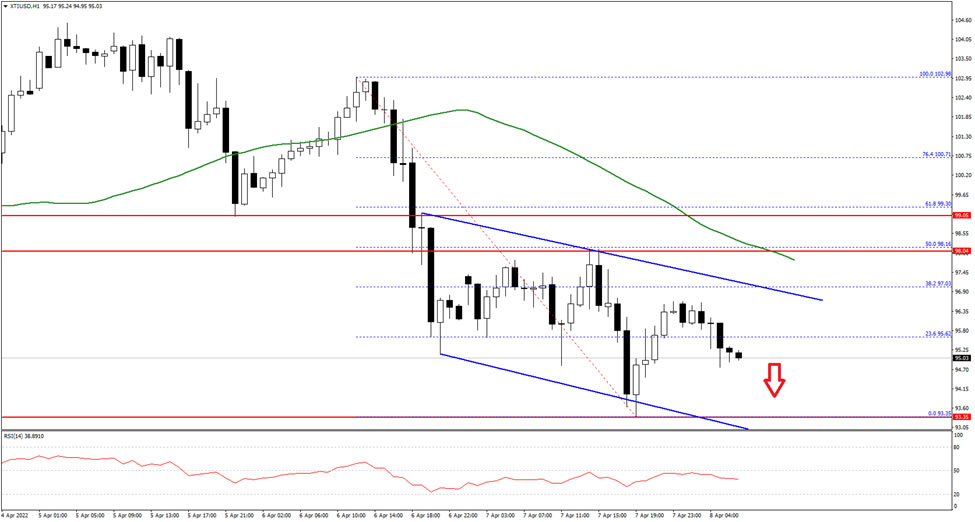
Crude oil price started a downward move from well above the $105 level against the US Dollar. The price declined below the $100 level to move into a short-term bearish zone.
The price even settled below the $98 level and the 50 hourly simple moving average. It traded as low as $93.35 and is currently showing bearish signs. There is also a key bearish trend line forming with resistance near $97 on the hourly chart.
An immediate resistance is near the $96.50 level. The next key resistance is near the $97.00 level and the trend line, above which the price might rise steadily towards the $100 resistance level.
If not, the price might continue to move down towards the $93.35 low. If there is a downside break below $93.35, the price might accelerate lower to $91.20. Any more losses might call for a test of $90.00 on FXOpen.
Pound Retreats ahead of Dollar; Could Fall to 1.2500
The US dollar works its way up against European currencies, including the British Pound.
After a corrective bounce from March 15th to the 23rd, GBPUSD has returned to the downside. Most worryingly, this decline is coming very evenly. It is no longer a speculative flight of capital to safe havens in response to frightening news.
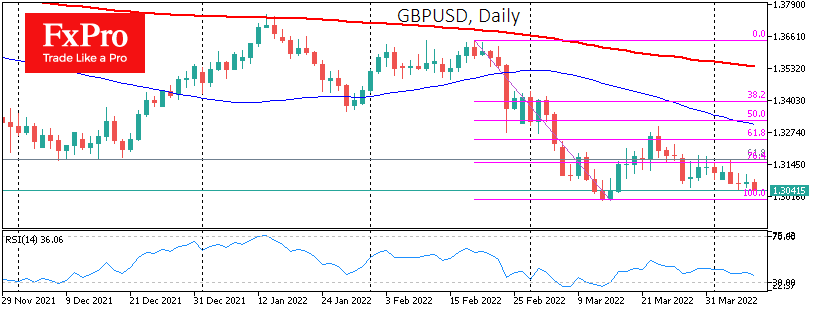
The flat downtrend with a succession of lower local highs indicates a capital flight out of European countries.
Britain is much less dependent on energy supplies from Russia but still bears an evident loss of economic growth due to the current situation. In addition, as the money hub for Europe, the UK is taking a hit due to worsening business sentiment and tighter financial conditions.
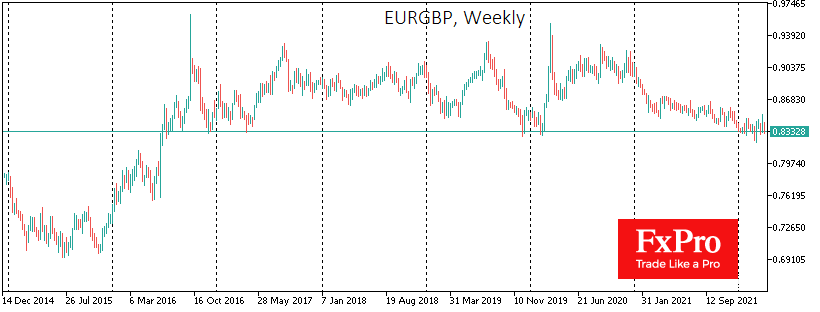
The Bank of England’s more determined move to raise the bank rate and cut QE is fueling the Pound’s rise against the euro. The EURGBP pair is close to 0.8300, near the lower bound of an almost 6-year trading range. And so far, it isn’t easy to find a reason to reverse the trend.
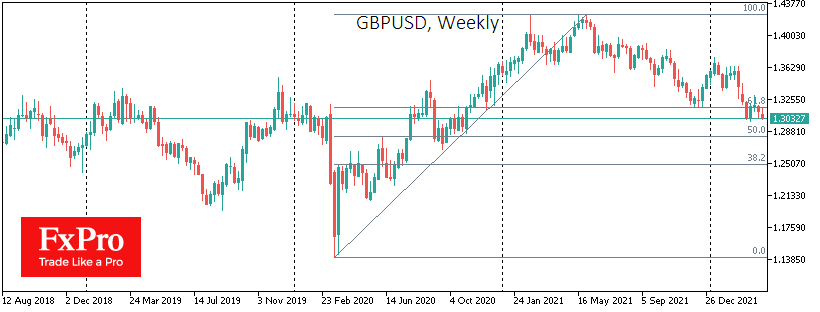
In the meantime, the Pound still has too little strength to withstand a rising Dollar, whose economy is much less affected by the war in Europe.
The inability of GBPUSD to develop a rebound above 1.3160 (61.8% of covid amplitude) sets up for further drawdown with near-term support near 1.2830 (50% of the rally) with the potential for a more profound decline at 1.2500 in the next few weeks.
GBPJPY Improvements Curbed by March-May 2016 Highs
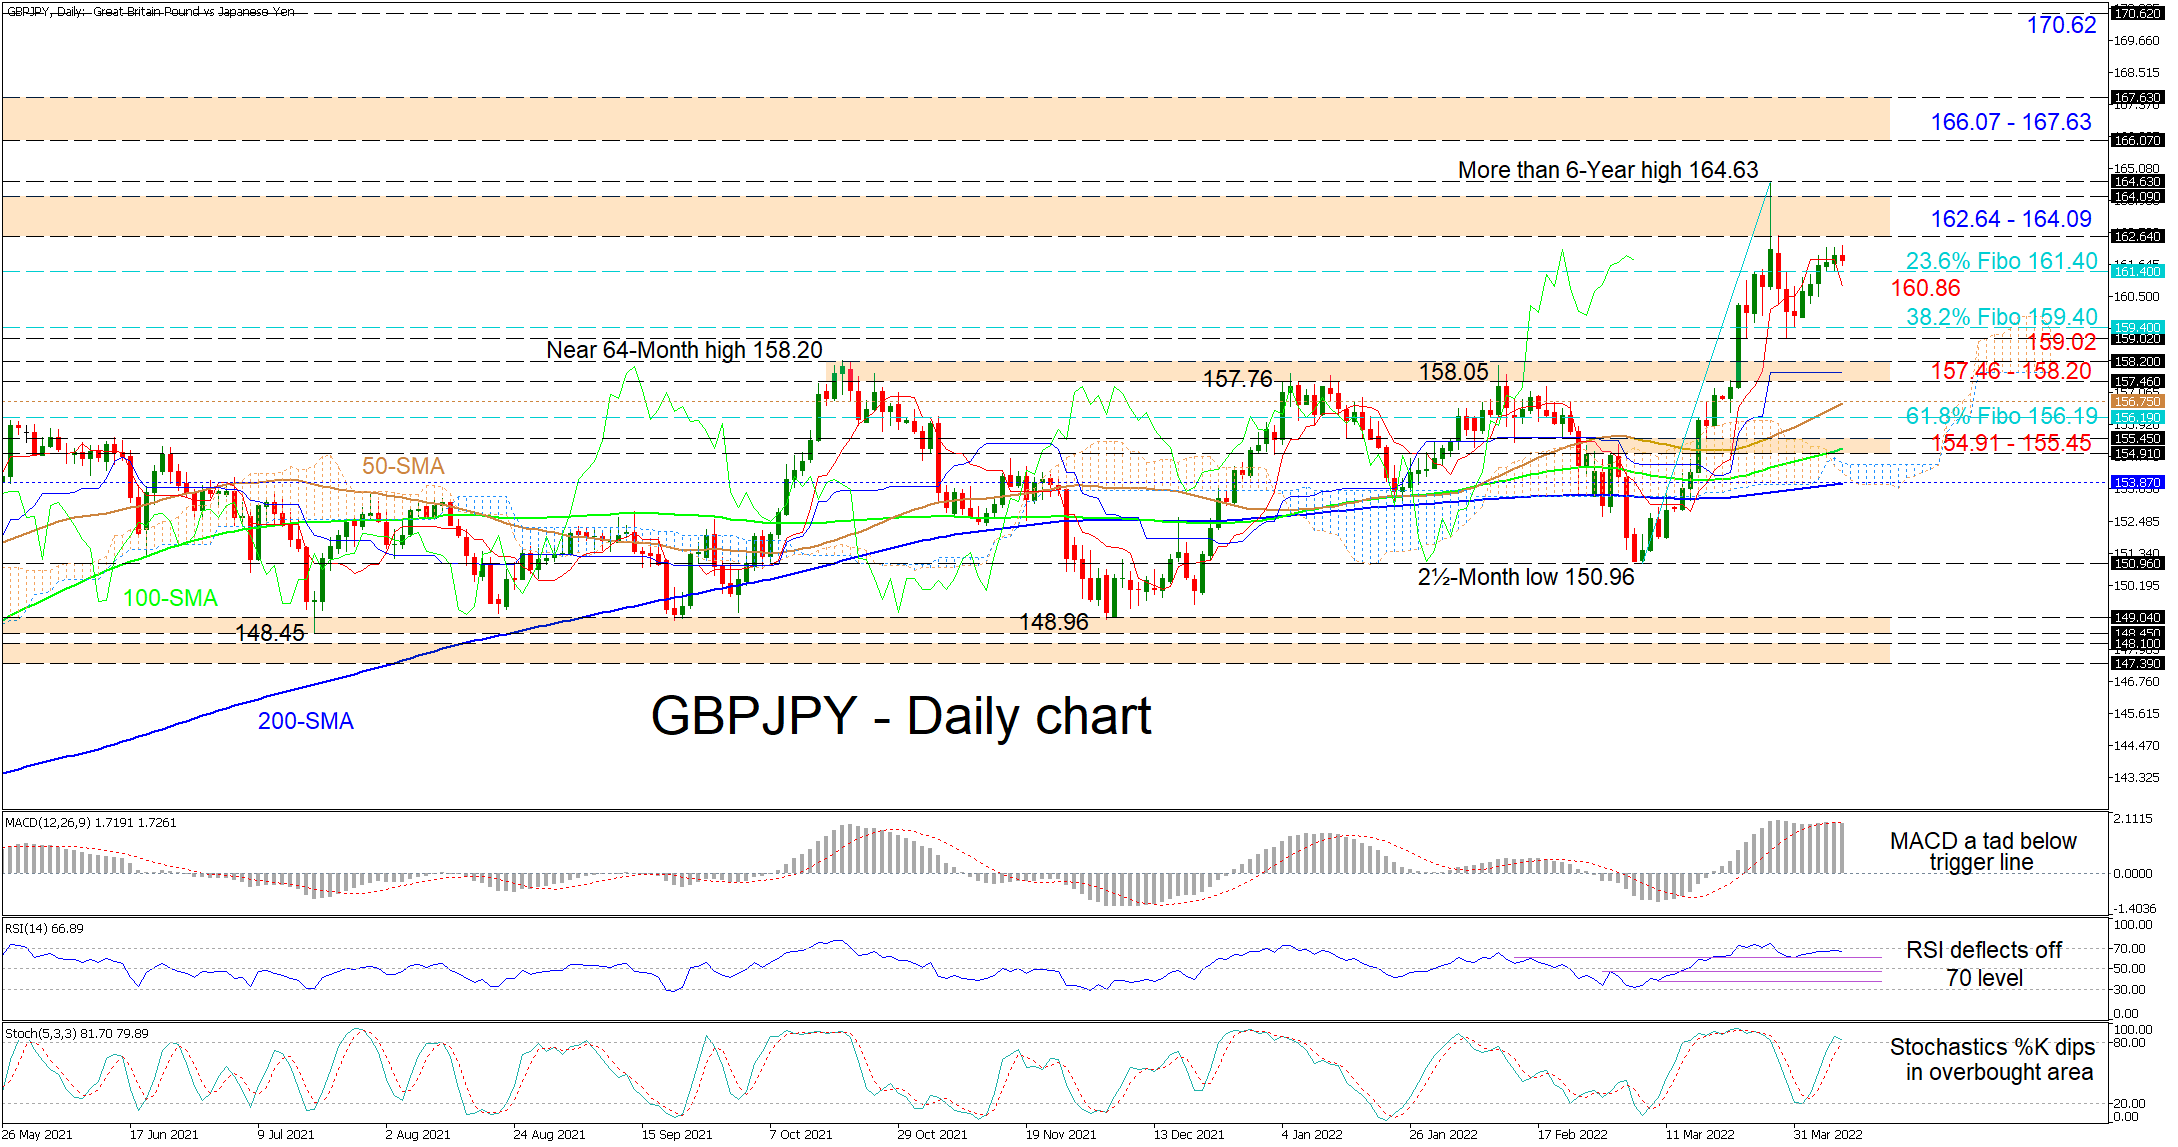
GBPJPY has overstepped the 161.40 level, which is the 23.6% Fibonacci retracement of the up leg from 150.96 until the more than six-year high of 164.63, with a weakened upward drive. Though, on a positive note, the bullish bearing of the simple moving averages (SMAs) is promoting the broader positive structure.
However, the pair’s positive momentum generated around the 159.02 low and the 38.2% Fibo of 159.40 appears to be fading ahead of the crucial 162.64-164.09 barricade, something also being reflected in the dipping slope of the red Tenkan-sen line. Nevertheless, the flattened blue Kijun-sen line has yet to confirm that negative pressures have gained any convincing advantage.
Meanwhile, the short-term oscillators are also reflecting this minor waning in upward drive. The MACD, far north of the zero mark, has marginally slid underneath its red signal line, while the RSI has deflected off the 70 overbought barrier. Moreover, the dive in the stochastic %K line in the overbought territory, is hinting that upside forces are feeble for now.
In the negative scenario, initial support could emanate from the 23.6% Fibo of 161.40 and the nearby red Tenkan-sen line at 160.86. Retreating under the red Tenkan-sen line, the pair may then target the 38.2% Fibo of 159.40 and the adjacent low of 159.02. In the event buyers’ recent efforts become offset by the price sinking even below the crucial 157.46-158.20 support border, the bear’s focus could then shift towards a support area, linking the 50-day SMA at 156.75 with the 61.8% Fibo of 156.19.
Alternatively, if the pair creates positive impetus off the 23.6% Fibo of 161.40, the bulls may rechallenge the obstructing 162.64-164.09 resistance section, shaped by the March-May 2016 highs. Should the price overpower this key boundary and pilot beyond the more than six-year high of 164.63, the buyers may then be encouraged to confront the specific highs of 166.07 and 167.63 from February 2016, which form the next resistance band. From here, upside momentum could lift the price towards the 170.62 level.
Summarizing, GBPJPY’s advances continue to struggle ahead of the 162.64-164.09 key resistance obstacle. That said, if the price sinks below the 157.46-158.20 base, positive pressures could take a hit. Moreover, an extended price dive - breaching the 154.91-155.45 barrier - that also overwhelms the Ichimoku cloud and the 200-day SMA may stifle the near-term positive outlook. Keep in mind, the broader positive structure remains intact above the congested foundations spanning from 147.39 until 149.04.
Japanese Yen Drifting at 124
USD/JPY continues to trade sideways and looks like it may drift right into the weekend. In the European session, USD/JPY is trading just above the 124 line.
Japanese data mixed
Japan released a data dump on Friday, but the yen wasn’t biting and has shown little change. Consumer Confidence slowed for a third straight month in March, dropping from 35.2 to 32.8. To a large extent, the decline can be attributed to strict Covid restrictions, which were in place for most of March and weighed on consumers’ moods. The outlook is a bleak one for consumers, as real incomes have stagnated due to Covid curbs and higher prices. This has led consumers to cut down on spending, which is bad news for the economy.
There was better news from Japan’s Current Account, which jumped in February to JPY 0.52 trillion, up from JPY 0.18 trillion a month earlier. Japanese exports are booming, with timely assistance from the weak Japanese yen, which flirted with the 125 line last week. However, this data precedes the Ukraine war, which has triggered soaring commodity prices and made imports into Japan more expensive. This will likely have a negative impact on the next Current Account release.
BoJ Governor Kuroda has said that he supports a weak yen, but apparently not “too weak a yen”. The central bank intervened last week after the yen fell sharply, with Kuroda expressing concerns about rapid moves in the exchange rate. The yen subsequently recovered but has once again resumed its downward movement. I expect USD/JPY to retest 125 shortly, but when that happens, traders should be prepared for Kuroda to again make statements designed to curb the yen’s decline. US Treasury yields continue to move higher, and the widening US/Japan rate differential will continue to weigh on the yen.
USD/JPY Technical
- USD/JPY has support at 121.25 and 119.16
- 123.25 is under pressure resistance. Above there is resistance at 124.67
Elliott Wave Update: Aussie Forming a Top
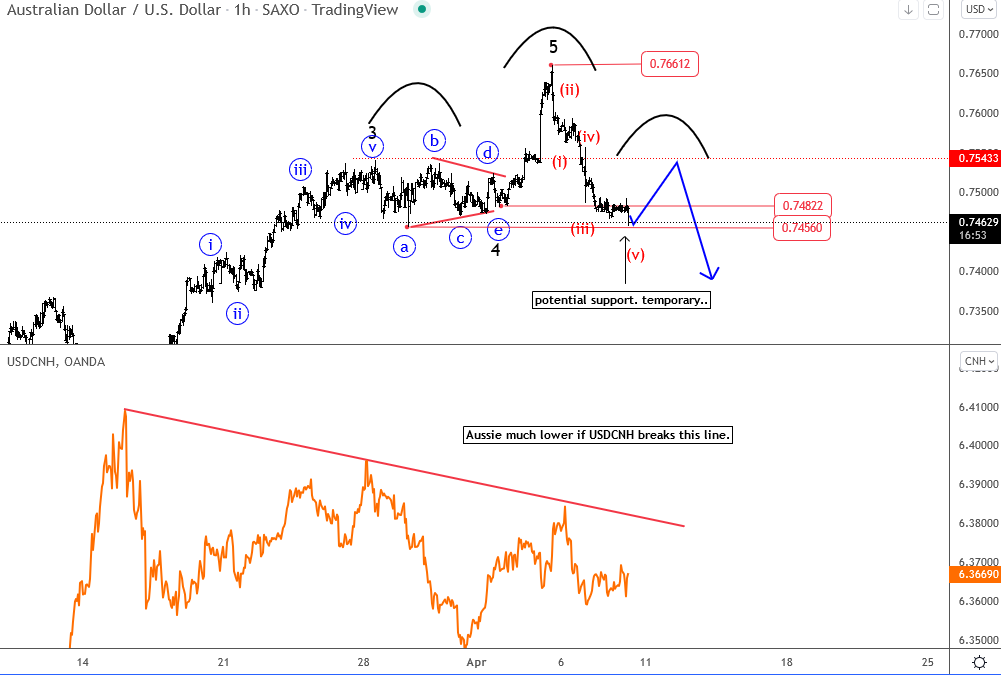
In this article I want to update you on Aussie which I posted earlier this week HERE and highlighted a break higher into wave five, which was seen in final stages of an impulse after RBA. We know that moves out of a triangle are final in a seuqunce and that they will most likely cause a shift in trend. What is interested and important at the moment is that reversal is strong back to previous supports, so its still only first leg of a minimum three wave drop from the recent high. RBA also reported that the household debt-to-income ratio is high, which increases sensitivity to rising interest rates. They are much more careful then the FED, so it can be bearish case for the AUDUSD pair going into next week.
Also, keep an eye on USDCNY; break above the trendline can cause more weakness on Aussie.
Ukraine Conflict Will Accelerate Adoption of Crypto
Bitcoin rose slightly, by 0.6%, to $43.6K. Ethereum added 1.6%, while other leading altcoins from the top 10 showed mixed dynamics: a 3% decline (Terra) to 6.2% growth (Solana).
Total crypto market capitalisation, according to CoinMarketCap, rose 1.2% to $2.02 trillion overnight. Bitcoin’s dominance index declined 0.4% to 40.9%.
The cryptocurrency Fear and Greed Index was up 3 points to 37 by Friday but did not come out of the “fear” state.
Bitcoin briefly dipped below $43K on Thursday but, by the end of the day, had offset most of the decline, remaining near Thursday’s closing levels amid a rebound in US stock indices.
According to Bloomberg, a renewed slide in stock indices could hit bitcoin hard. Short-term risks are rising as the US Federal Reserve intensifies its fight against inflation and rising interest rates and intends to embark on aggressive balance sheet cuts.
In contrast, Galaxy Digital CEO Michael Novogratz believes bitcoin is gradually losing its correlation with stock indices. He believes lower inflation and a stabilising economy will push bitcoin up.
Meta is exploring the possibility of creating a cryptocurrency for the meta-universe to boost revenues due to the decline in popularity of their cash cow apps, Facebook and Instagram.
Russian Prime Minister Mikhail Mishustin said that 10 million Russians have over 10 trillion roubles ($128 billion) in crypto wallets, which is just under $1,000 per Russian resident. He also called for regulation of cryptocurrencies, although he rejected their recognition as a means of payment.
The Economist Intelligence Unit believes that the war will accelerate Ukraine’s cryptocurrency adoption. From examples in Africa, the Middle East, and Latin America, we have previously seen that the use of cryptocurrencies increases dramatically when national economies and local currencies weaken.
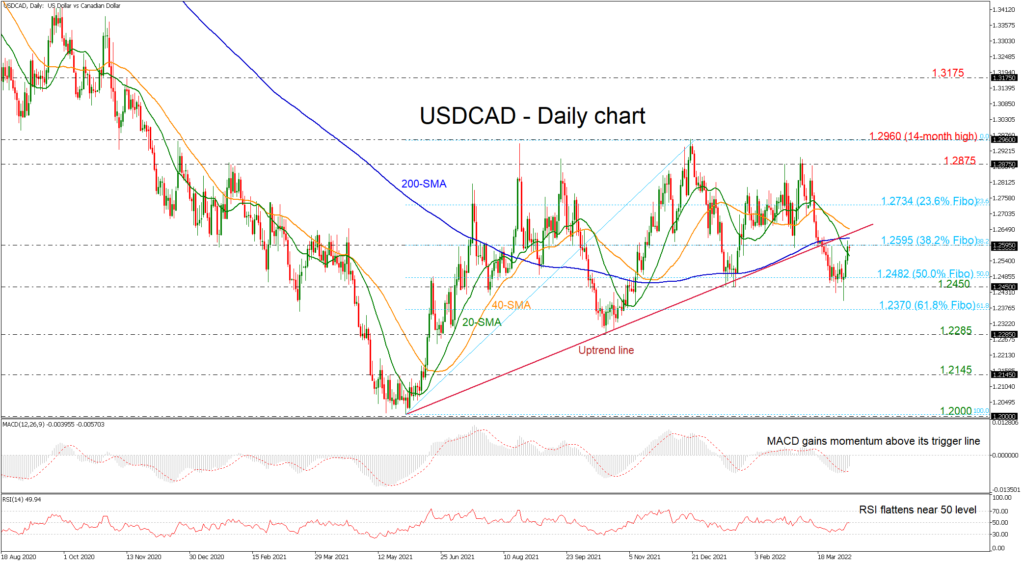
USDCAD Struggles to Surpass 38.2% Fibo Around 1.2600
USDCAD created an impressive bullish rally after the rebound off the 50.0% Fibonacci retracement level of the up leg from 1.2000 to 1.2960 at 1.2485 and is now struggling to surpass the 38.2% Fibonacci of 1.2595 and the 200-day simple moving average (SMA). The RSI indicator is moving sideways at the moment around the neutral threshold of 50, while the MACD is heading north above its trigger line.
In case the pair changes its short-term direction to the upside, the bulls will probably challenge the 200-day SMA at 1.2620 and the broken uptrend line. A break higher could last until the 23.6% Fibonacci of 1.2734 before meeting the 1.2875 resistance level.
Alternatively, any declines may drive the price towards the 50.0% Fibonacci of 1.2482 before the 1.2450 support comes into view. Beneath the latter, the 61.8% Fibonacci of 1.2370 could be another level in focus which, if penetrated, would endorse the bearish outlook.
Turning to the medium-term picture, the pair switched to a negative mode after the drop below the ascending trendline. However, in the short-term view, the pair is showing some improvement and may return to positive movements again.