Sample Category Title
Nasdaq 100 Sinks as Fed and China Covid Fears Rise
US equities continued their struggle as the market weighed the change of tone by the Federal Reserve. The Dow Jones, Nasdaq 100, S&P 500, and Russell 2000 all declined by over 0.50% while bond yields rose. On Wednesday, minutes by the Fed showed that the bank will continue increasing rates in May and in the next few meetings. Another change is that the bank will start implementing quantitative tightening by selling bonds worth $75 billion every month. The report came a day after Lael Brainard, an advocate for low rates, said that she was supportive of these policies. Data from the US showed that initial jobless claims dropped to 166k last week.
Volatility in the market also happened as concerns about the manufacturing sector continued. Data published this week by Markit revealed that the sector was underperforming. Part of this concern is the ongoing Covid-19 crisis in China. The government has implemented stringent measures to curb the pandemic such as locking down Shanghai. As a result, companies like Tesla and Apple have been forced to slow down their production. Tesla shut down its plant in Shanghai in March and has not set a date for reopening. Other firms that have been affected are Volkswagen and Thyssenkrupp.
The Canadian dollar declined against the US dollar ahead of the latest jobs data. Economists expect these numbers to show that the country’s job market remained tight in March as the recovery continued. Analysts are hoping that the economy will have added over 80k jobs during the month. They see the unemployment rate falling to 5.3% while the participation rate rose to 65.4%. The Canadian dollar also declined because of the falling oil prices. Brent declined to $99.35.
XBRUSD
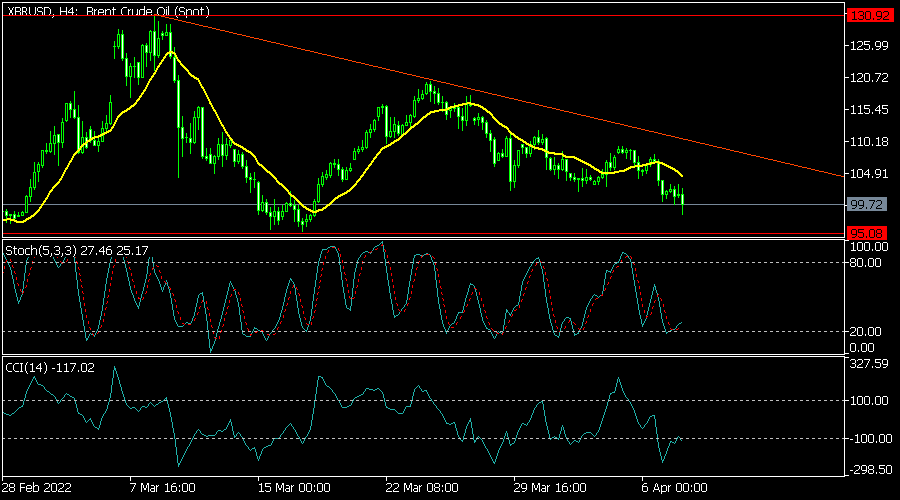
The XBRUSD pair declined to a low of 99.35, which was substantially lower than the year-to-date high of 134. On the four-hour chart, the price has moved below the 25-day moving average. It is also below the descending trendline shown in red. The Stochastic SAR and the Commodity Channel Index have tilted lower. Therefore, the pair will likely keep falling as bears target the support at 95.
EURUSD
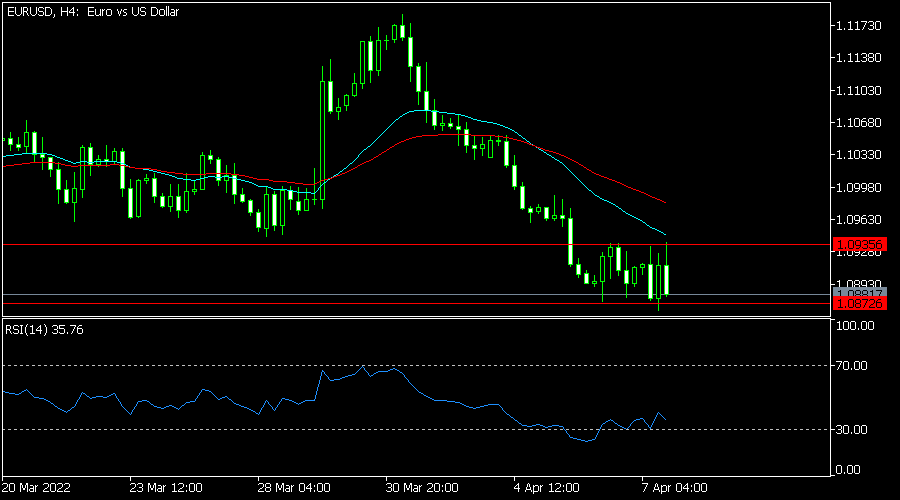
The EURUSD pair continued falling as global risks rose. The pair moved to a low of 1.0872, which is slightly above the key support at 1.0850. The pair has moved below the 23.6% Fibonacci retracement level. It also moved below the short and longer-term moving averages. Therefore, it seems like bears are prevailing, meaning that it will likely keep falling in the near term.
USDCAD
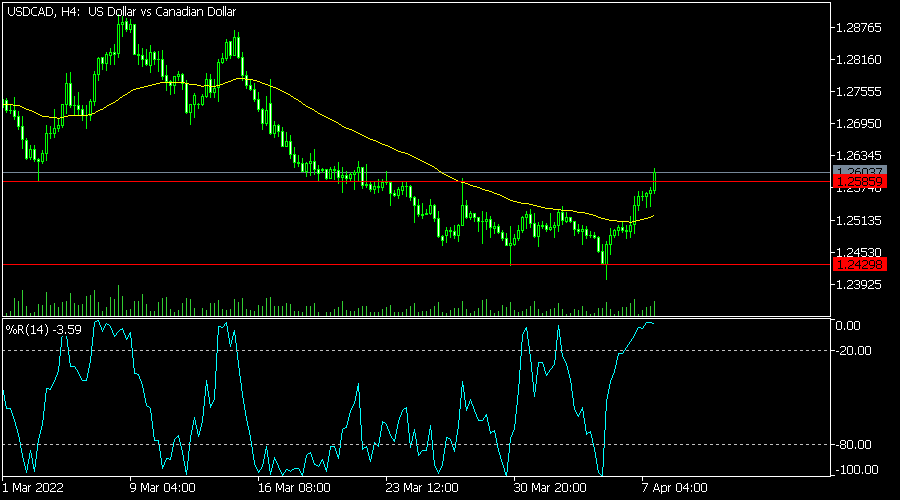
The USDCAD pair rose to a high of 1.2600, which was the highest point since March 22. The pair moved above the key resistance at 1.2585, which was the highest level on March 29. The William % Range rose to the overbought level. The pair is also above the 25-day moving average. Therefore, there is a likelihood that the pair will hold steady ahead of the upcoming Canada jobs data.
Hawkish Elements in ECB Minutes Will Turn into Reality at Next Week’s Meeting
Markets
Minutes of the March ECB meeting kickstarted the countdown to next week’s ECB meeting. In line with FOMC Minutes, they surprised markets in a hawkish manner. The key takeaway was some ECB members already argued in favour of a firm end date (in Summer) for asset purchases. Eventually the ECB decided to accelerate the tapering of its asset purchases to €40bn in April, €30bn in May and €20bn in June. Ceteris paribus, they will end in Q3.
We believe that the hawkish elements in the March minutes will turn into reality at next week’s meeting given that the March inflation numbers (7.5% Y/Y) already pale the March ECB staff projections. By labelling June the firm end date for asset purchases, the ECB creates a window of opportunity to stat hiking policy rates faster than expected. Copying the Fed’s playbook suggests a potential first rate hike in the month when net asset purchases end (ie June). However, the ECB’s updated forward guidance (first hike some time after net asset purchases end) suggests that the earliest lift-off date is probably July.
European bonds underperformed US Treasuries following the Minutes in a bear flattening move. German yields closed 2.1 bps (30-yr) to 3.7 bps (3-yr) higher. Intraday yield rises had been bigger. Yields started retreating around the start of the US trading session as oil prices slipped away. Brent crude dipped below $100/b for the first time since mid-March after the International Energy Agency announced that they would bump global supply by 240 million barrels.
The US yield curve continued its pre- and post-FOMC Minutes steepening trend on the Fed’s stealth quantitative tightening plans. Daily changes on the US yield curve ranged between -1.1 bp (2-yr) and +5.9 bps (10-yr). We retain comments from St. Louis Fed Bullard who argued in favour of lifting the policy rate to 3-3.25% by the end of this year. US weekly jobless claims dropped to 166k, their lowest level since 1968.
The euro attempted to regain the 1.09 big figure in the wake of ECB Minutes, but the single currency couldn’t hold on to this gain. Return action eventually pulled the pair lower to close at 1.0879. The trade-weighted dollar extended its gains and has the 100 big figure in sight.
Today’s eco calendar is completely empty in the US and EMU. It gives way for risk sentiment to direct intraday gyrations. In general, we expect ruling market trends to continue: core bonds and stock markets are in dire straits just like the euro unless the ECB provides some additional verbal backing at next week’s policy meeting.
News Headlines
Canada presented a much more conservative 2022 budget than expected. The net costs of 2022 budget measures (new spending minus new revenue from taxes) will be over C$31bn whereas some were anticipating a number closer to C$100bn. Finance minister Freeland chose not to deliver on some election promises to keep spending in check while banking on additional levies on financial institutions, the elimination of loopholes and tax avoidance strategies and a review of overall existing spending. The new plan sees Canada’s finances nearly in balance within five years with cumulative deficits through 2027 estimated C$50bn lower compared to the December update. The budget gap for this fiscal year is projected at C$52.8bn vs almost C$60bn in December. Total bond issuance for this year is seen at C$212bn, down from C$255 in the previous fiscal year. France is headed for the first round of the presidential election on Sunday. A recent Ipsos poll (Apr 5 -7) showed Macron’s lead over far-right candidate Le Pen narrowed to just 3.5 ppts, continuing a trend that has been visible for some weeks now. According to the Ipsos poll, Macron would have 26.5% (-0.5 ppts) of the votes on Sunday while Le Pen would score 23% (+1 ppt). Far-left candidate Melenchon may come in third with 16.5%. Some analysts have attributed the rise of Le Pen in the polls to the recent euro weakness - even though abandoning the euro is no longer in Le Pen’s programme - and OAT underperformance.
Advancing ECB Rate Hike Expectations
Market movers today
A quiet end to the week, with no key data releases or central bank speeches scheduled for today. Focus remains on the outlook for central bank policy tightening and further details on EU's next round of sanctions on Russia.
The 60 second overview
Advanced ECB rate hike expectations: We revise our ECB call slightly after the recent Governing Council (GC) comments, hawkish minutes (more below) and inflation surprises. We now look for a 25bp rate hike in both September and December 2022. Beyond that, we do not look for a prolonged hiking cycle into 2023 at the current stage as inflation falls back to target and Fed tightening will also have contributed to a significant tightening of financing conditions globally - thereby worsening the economic outlook, see more in our ECB Preview - Lagarde to bring September into play - we revise our ECB call, 8 April.
ECB minutes: The ECB minutes of the March meeting released yesterday were hawkish as also noted by rates markets. Concerns about second-round effects and unanchored inflation expectations seem to gain traction in the GC as the March minutes showed, with the hawks becoming increasingly vocal about the risk of a wage-price spiral if monetary policy did not act in a timely manner. The minutes show that the ECB do not see stagflation, but call it slowflation. Already in March, a large number of GC members thought that the persistently high inflation rates called for further steps towards monetary policy normalisation, as the three forward guidance conditions for interest rates increases had either already been met or were very close to being met. Similarly to the Fed, the uncertain economic outlook following Russia's invasion of Ukraine was the main factor leading the GC to refrain from a more accelerated policy tightening at the current stage, with lingering doubts about the role of temporary, pandemic-related factors and the indirect effects of higher energy prices.
Fed: Fed's Bullard was confirming his general hawkish views by favouring that the 'committee to get to 3-3.25% on the policy rate in the second half of this year', hence above their own perceived neutral rate. He would also support a 50bp rate hike in May. Markets are currently pricing in another 215bp worth of rate hikes this year.
Equities: Global equities flat yesterday after a rollercoaster session in both US and Europe. While US ended close to day high, Europe ended close to day low. Hence no surprise to see European futures stronger than the US futures this morning. Defensives in another massive outperformance yesterday as investors are not willing to go into bonds but at the same time too worried about the economic outlook to buy cyclicality. Value outperformed growth for the third day in a row as yields drifted higher. In US yesterday Dow +0.3%, S&P 500 +0.4%, Nasdaq +0.1%, Russell 2000 -0.4%. Asian markets are mostly higher this morning with China underperforming as Covid and weak macro data are pressuring relative performance.
FI: European rates traded mostly sideways until the release of surprisingly hawkish ECB minutes covering the March meeting, which sent German yields some 6bp higher, before some retracement was observed. The intra-euro area spreads moves were relatively benign in this regard and ended broadly unchanged on the day. The European curves pivoted around the 5-10y point which has been relatively exposed recently to changes in economic outlook and to policy signals. The clear underperformer of EGB spreads was France which ahead of Sunday's first round French election had a poll putting Le Pen ahead of Macron in a head-to-head second round election on the 24 of April. A Le Pen victory would send EGB spreads wider to Germany on outlook of a stall to further EU integration to which Macron has generally been a wide supporter.
FX: A hawkish ECB may be a mild positive for EUR/USD on the day of the upcoming ECB meeting but not a long-term game changer for our view of spot going towards 1.05. For EUR/CHF, FX currency reserves data out yesterday suggested no signs of SNB intervention.
Credit: Sluggish market sentiment on Thursday carried over to credit, which saw a slight widening in the synthetic Investment Grade and High Yield indices. Itraxx main widened 0.9bp to close at 76.6bp, while Xover was 6.0bp wider, closing the day at 365.5bp.
Daily Technical Analysis
EUR/USD
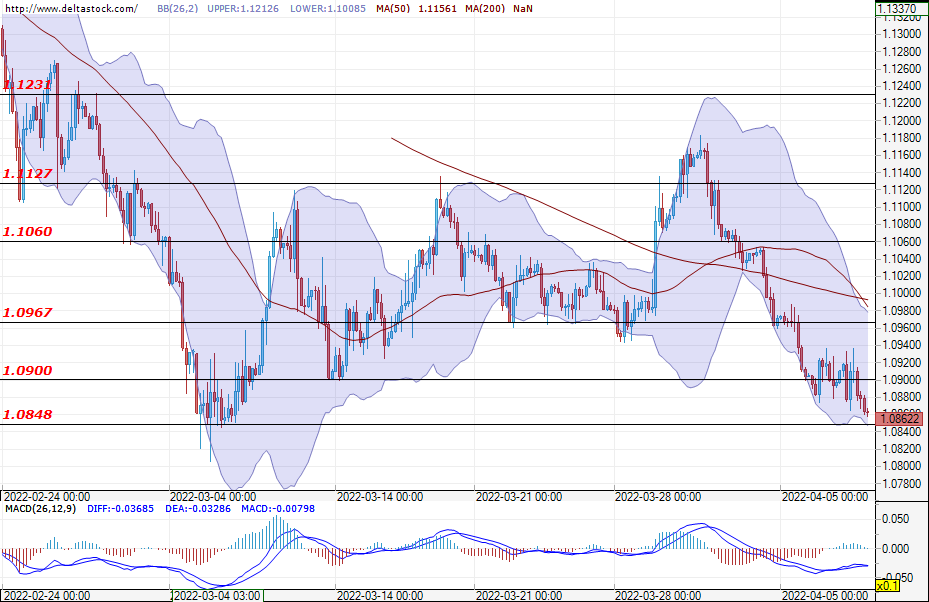
The euro lost some ground against the dollar, and during the early hours of today`s trading, the pair headed for a test of the support zone at 1.0848. A successful violation of the aforementioned level of support would strengthen the negative expectations for the future path of the EUR/USD for a move towards the levels at around 1.0820. If the bearish momentum fades and the bulls re-enter the market, then their first target would be the zone at 1.0900, followed by the resistance at 1.0967. However, only a successful breach of the higher level at 1.1060 would paint a more bullish picture for the common European currency.
USD/JPY
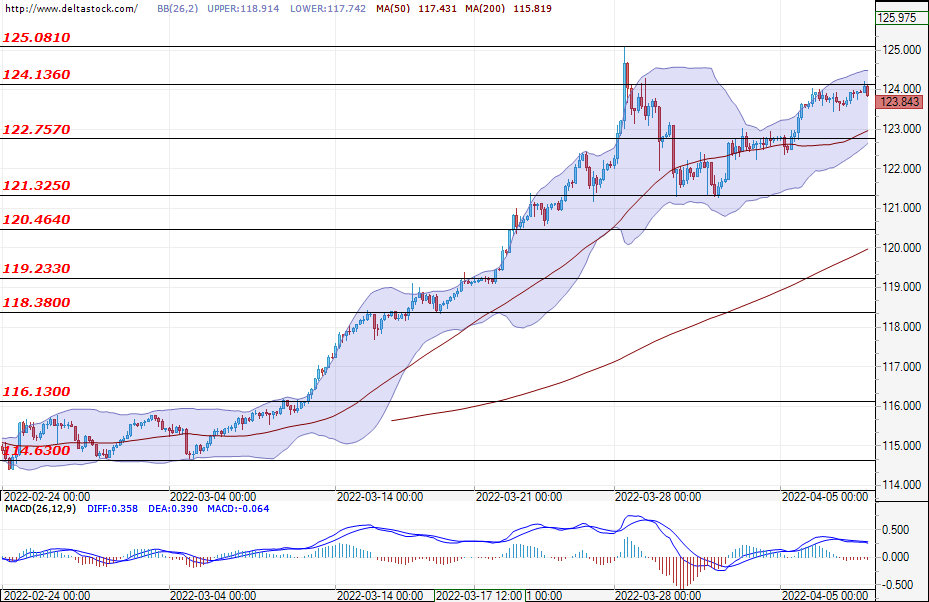
The positive sentiment remains unchanged despite the unsuccessful attack on the resistance zone at 124.13. The currency pair is trading closely under the mentioned level and a new breach attempt is the most probable scenario for today's trading session. If the bulls are successful in their endeavour, then the rally will most likely continue towards the local high at 125.08. If a correction develops, then it should be limited to the level at 122.75 before the uptrend continues.
GBP/USD
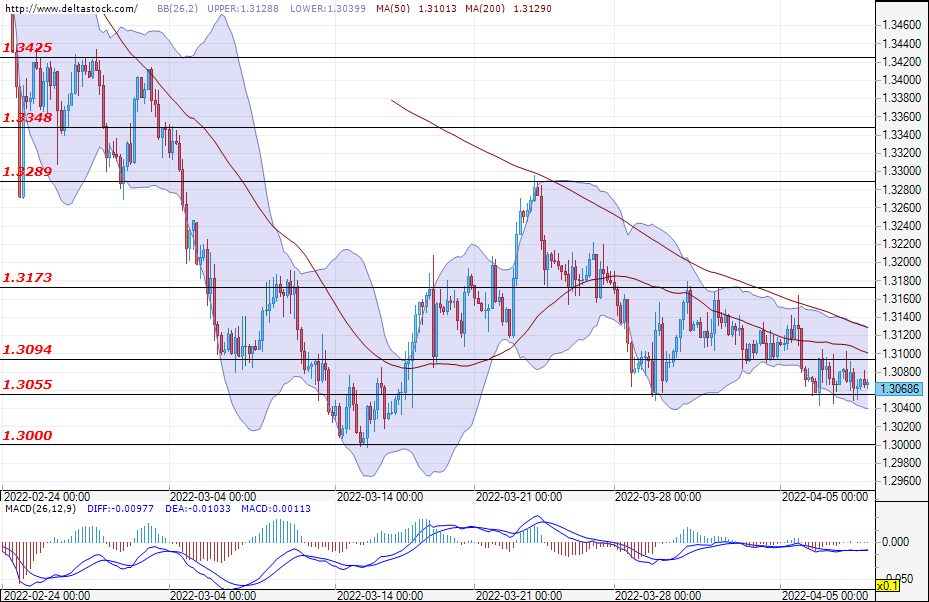
Neither the bears, nor the bulls managed to gain enough momentum and lead the Cable out of the zone between 1.3055 and 1.3094. At the time of writing, the pair is hovering just above the support at 1.3055 and the expectations are for a new test of the mentioned level. If the bears manage to breach this support, then the depreciation of the sterling will most likely continue towards 1.3000.. However, if the bulls manage to prevail and successfully breach the resistance at 1.3094 and the one at 1.3173, then we might see the Cable recover towards the level at 1.3289.
EUGERMANY40
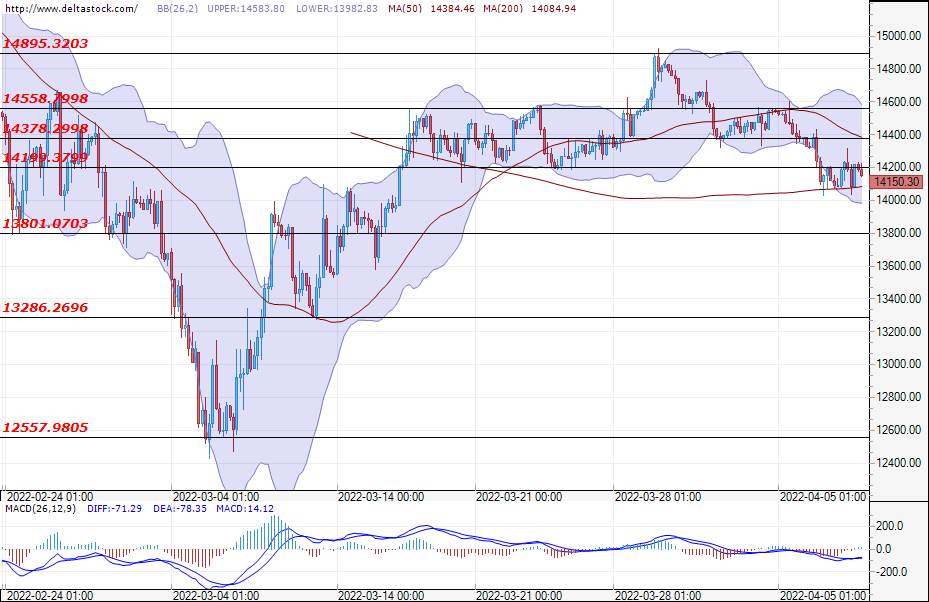
The bears managed to prevail and the German index lost some ground during yesterday's session. In the early hours of today, the EUGERMANY40 is consolidating under the zone at 14200, and if the bearish attack continues, then the expectations are for a move towards the support zone at 13801. If the sellers manage to take the index below the mentioned level, then we will most likely witness the index trade at around 13600.. If, on the other hand, the bulls take the reins and violate the zone at 14400 and the target at 14558, then the current market sentiment will grow more positive.
US30
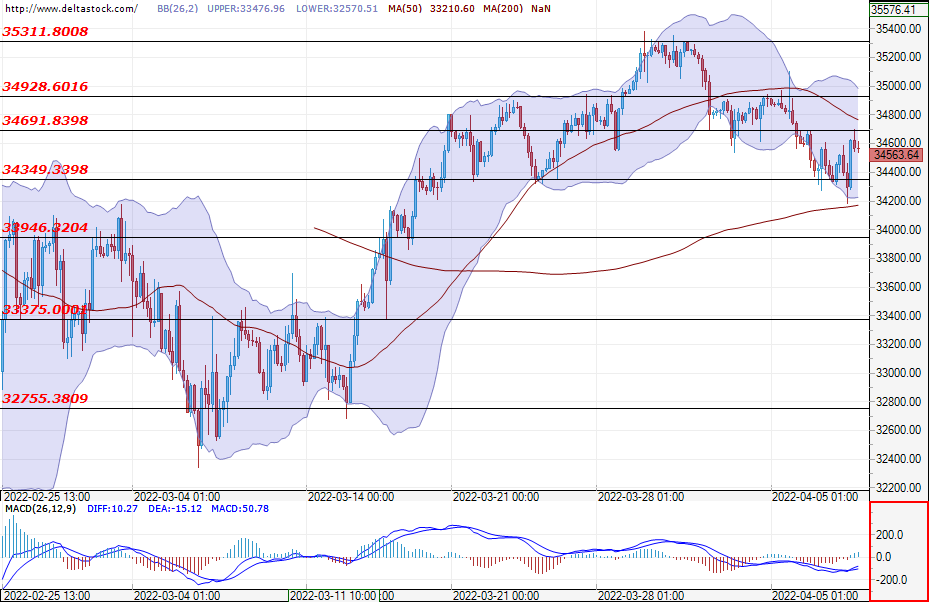
The support zone at 34349 withheld the bearish attack and the U.S. index recovered some of its recent losses. A breach of the close resistance at 34691 could easily continue the recovery and could lead to a test of the next target at 34928. If the bears re-enter the market, then a new successful attack on the mentioned support at 34349 and a violation of the lower zone at 33946 would most likely lead to a firmer market sentiment, increasing the risks of the index entering deeper into the red.
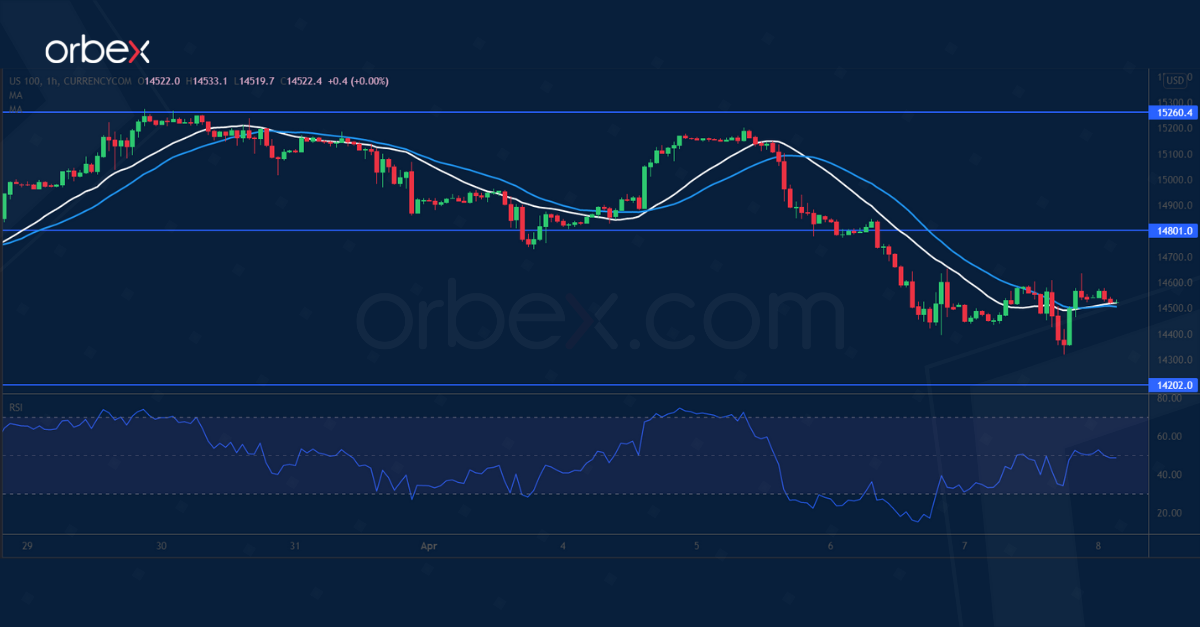
Nasdaq 100 Seeks Support
The Nasdaq 100 retreats as investors continue to digest hawkish Fed minutes.
The rally came to a halt at February’s high at 15260. Then a drop below the short-term demand zone at 14730 led to a wave of liquidation. 14200 is the next support and coincides with the 30-day moving average, making it an area of congestion.
If the bulls become wary of catching a falling knife, a bearish breakout could cause a deeper correction towards 13700. The support-turned-resistance at 14800 is the level to crack to resume the rally.
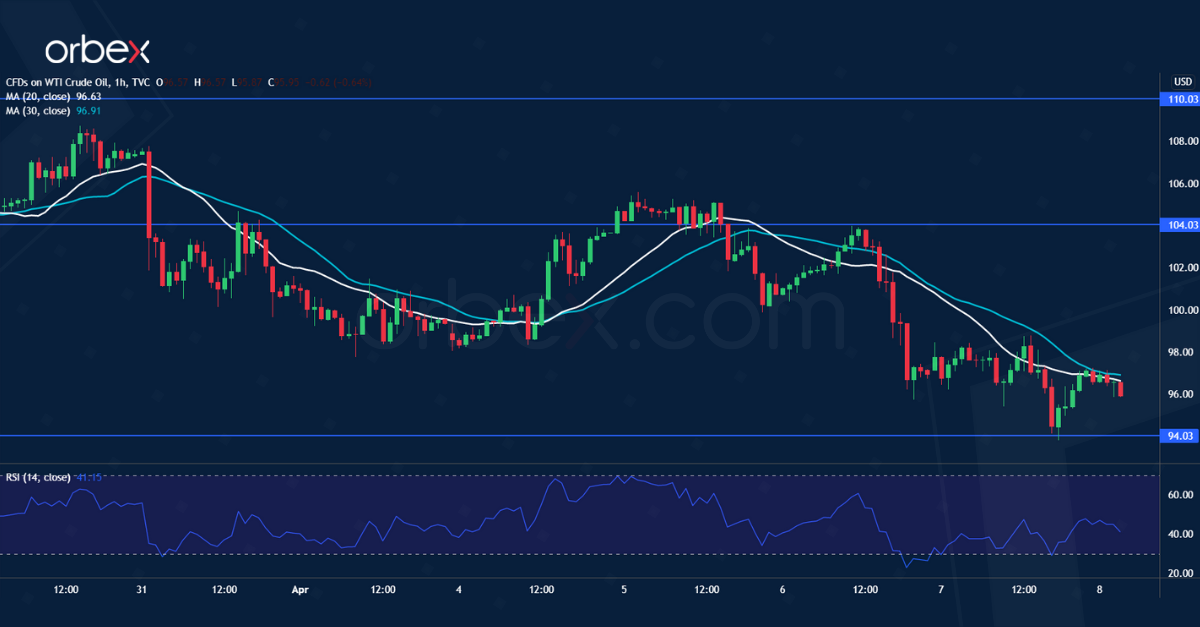
US Oil Grinds Daily Support
WTI crude softens as concerns grow over lockdowns in China. A bearish MA cross on the daily chart suggests that sentiment may have turned cautious.
The price is testing the key floor at 94.00 which is a daily support from the mid-March rebound. A bearish breakout could force the bulls to bail out and trigger a sell-off towards the psychological level of 90.00, putting the commodity on a correction course.
The RSI’s oversold condition may raise some buying interest. Buyers need to lift 104.00 to safeguard the uptrend.
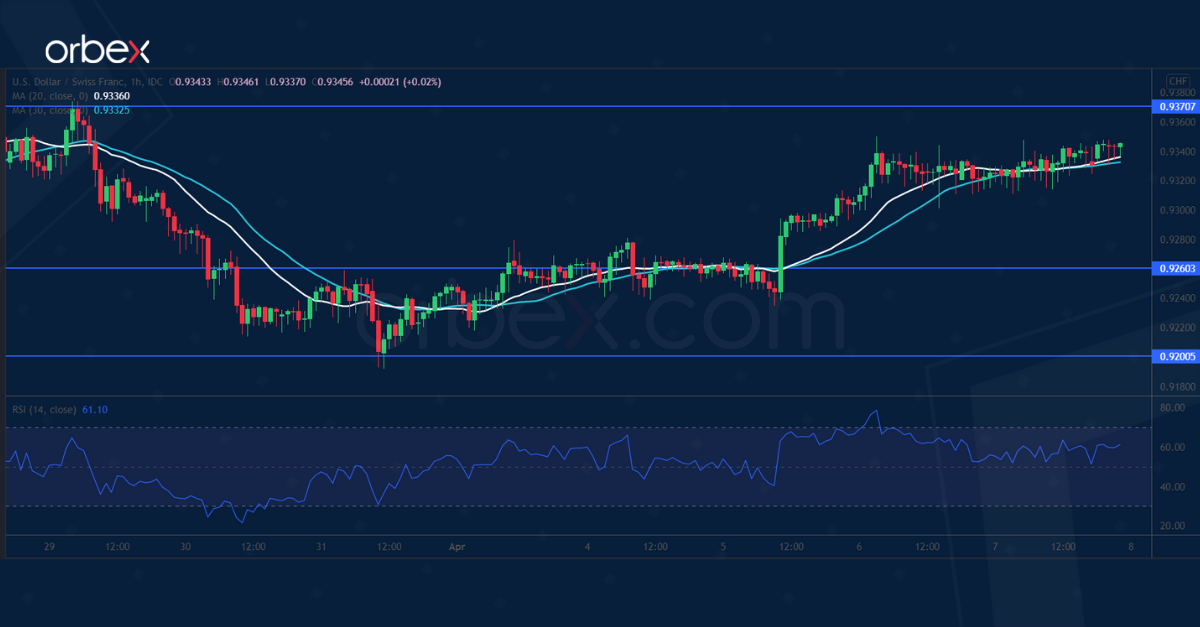
USD/CHF Tests Key Resistance
The US dollar edged higher supported by better-than-expected initial jobless claims. The pair continues its journey upward from the demand zone near 0.9200.
The rally is gaining momentum after a break above 0.9280. 0.9370 from a previously botched rebound is a major hurdle. In fact, its breach could flush out remaining selling interests.
Then last month’s peak at 0.9450 would be within reach. On the downside, 0.9260 is the immediate support if the market shows hesitation. 0.9200 is a critical level to keep the rebound intact.
Technical Outlook and Review
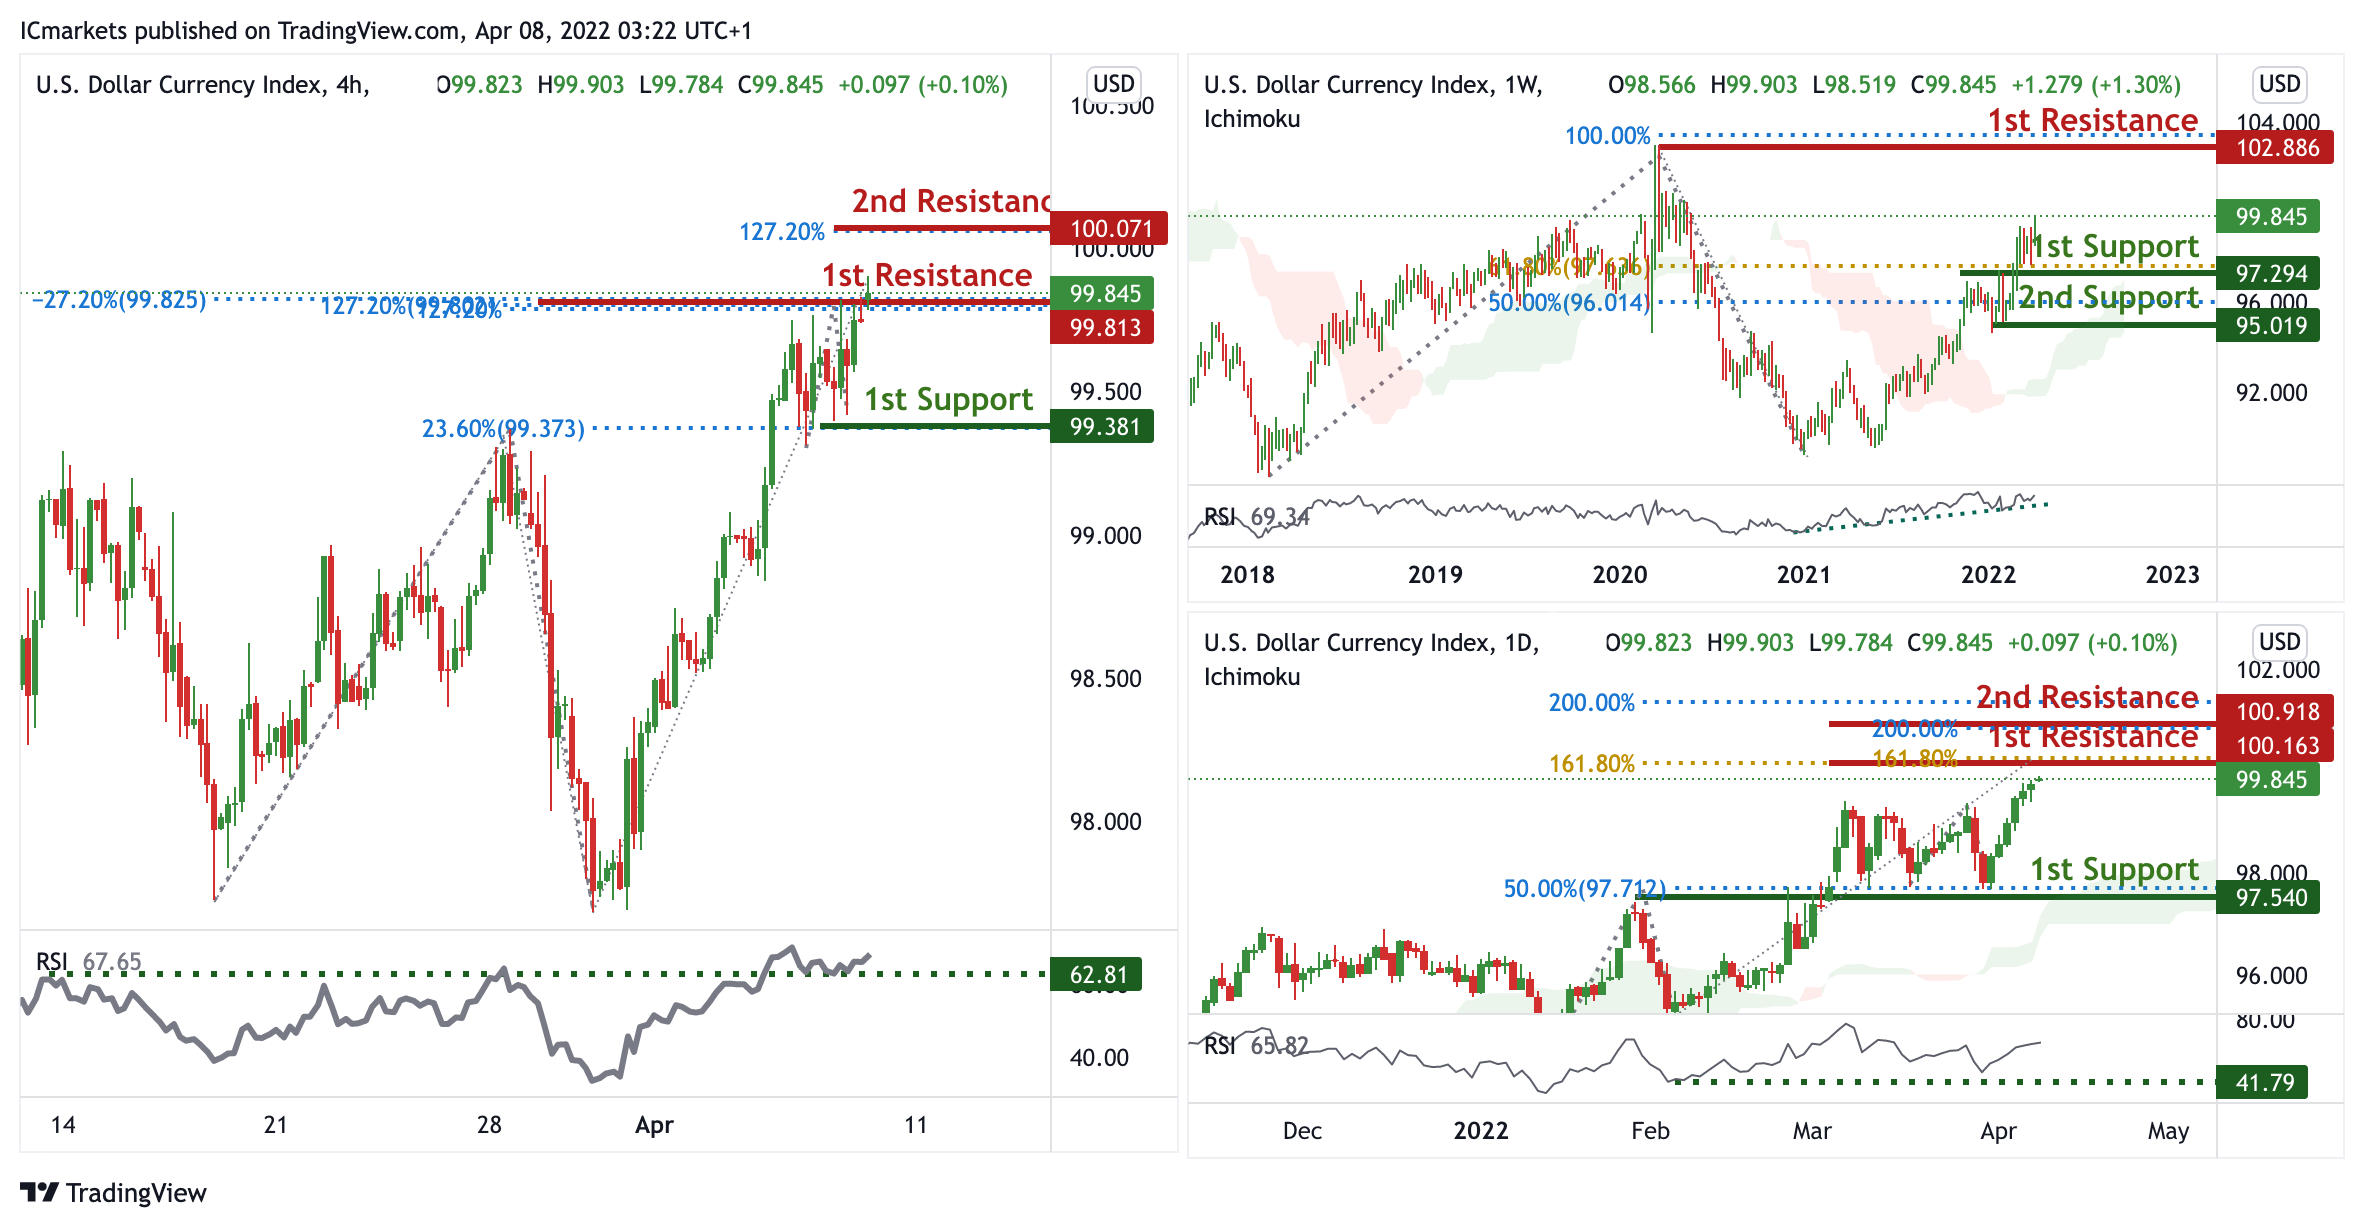
DXY:
On the weekly, prices are on bullish momentum. We see the potential for abounce from our 1st support at 97.294 in line with 61.8% Fibonacci retracement towards our 1st resistance at 102.886. Prices are trading above our ichimoku clouds, further supporting our bullish bias.
On the daily, prices are at a Pivot. We see the potential for a dip from our 1st resistance at 100.163 in line with 161.8% Fibonacci Projection towards our 1st support at 97.540 in line with 50% Fibonacci retracement.
On the H1 timeframe, prices have approached pivot. We see the potential for a dip from our 1st resistance at 99.813 in line with which is an area of Fibonacci confluences towards our 1st support at 99.381 in line with 23.6% Fibonacci retracement. RSI is at levels where dips previously occurred, further supporting our bearish bias.
Areas of consideration:
- H4 time frame, 1st resistance at 99.813
- H4 time frame, 1st support at 99.381
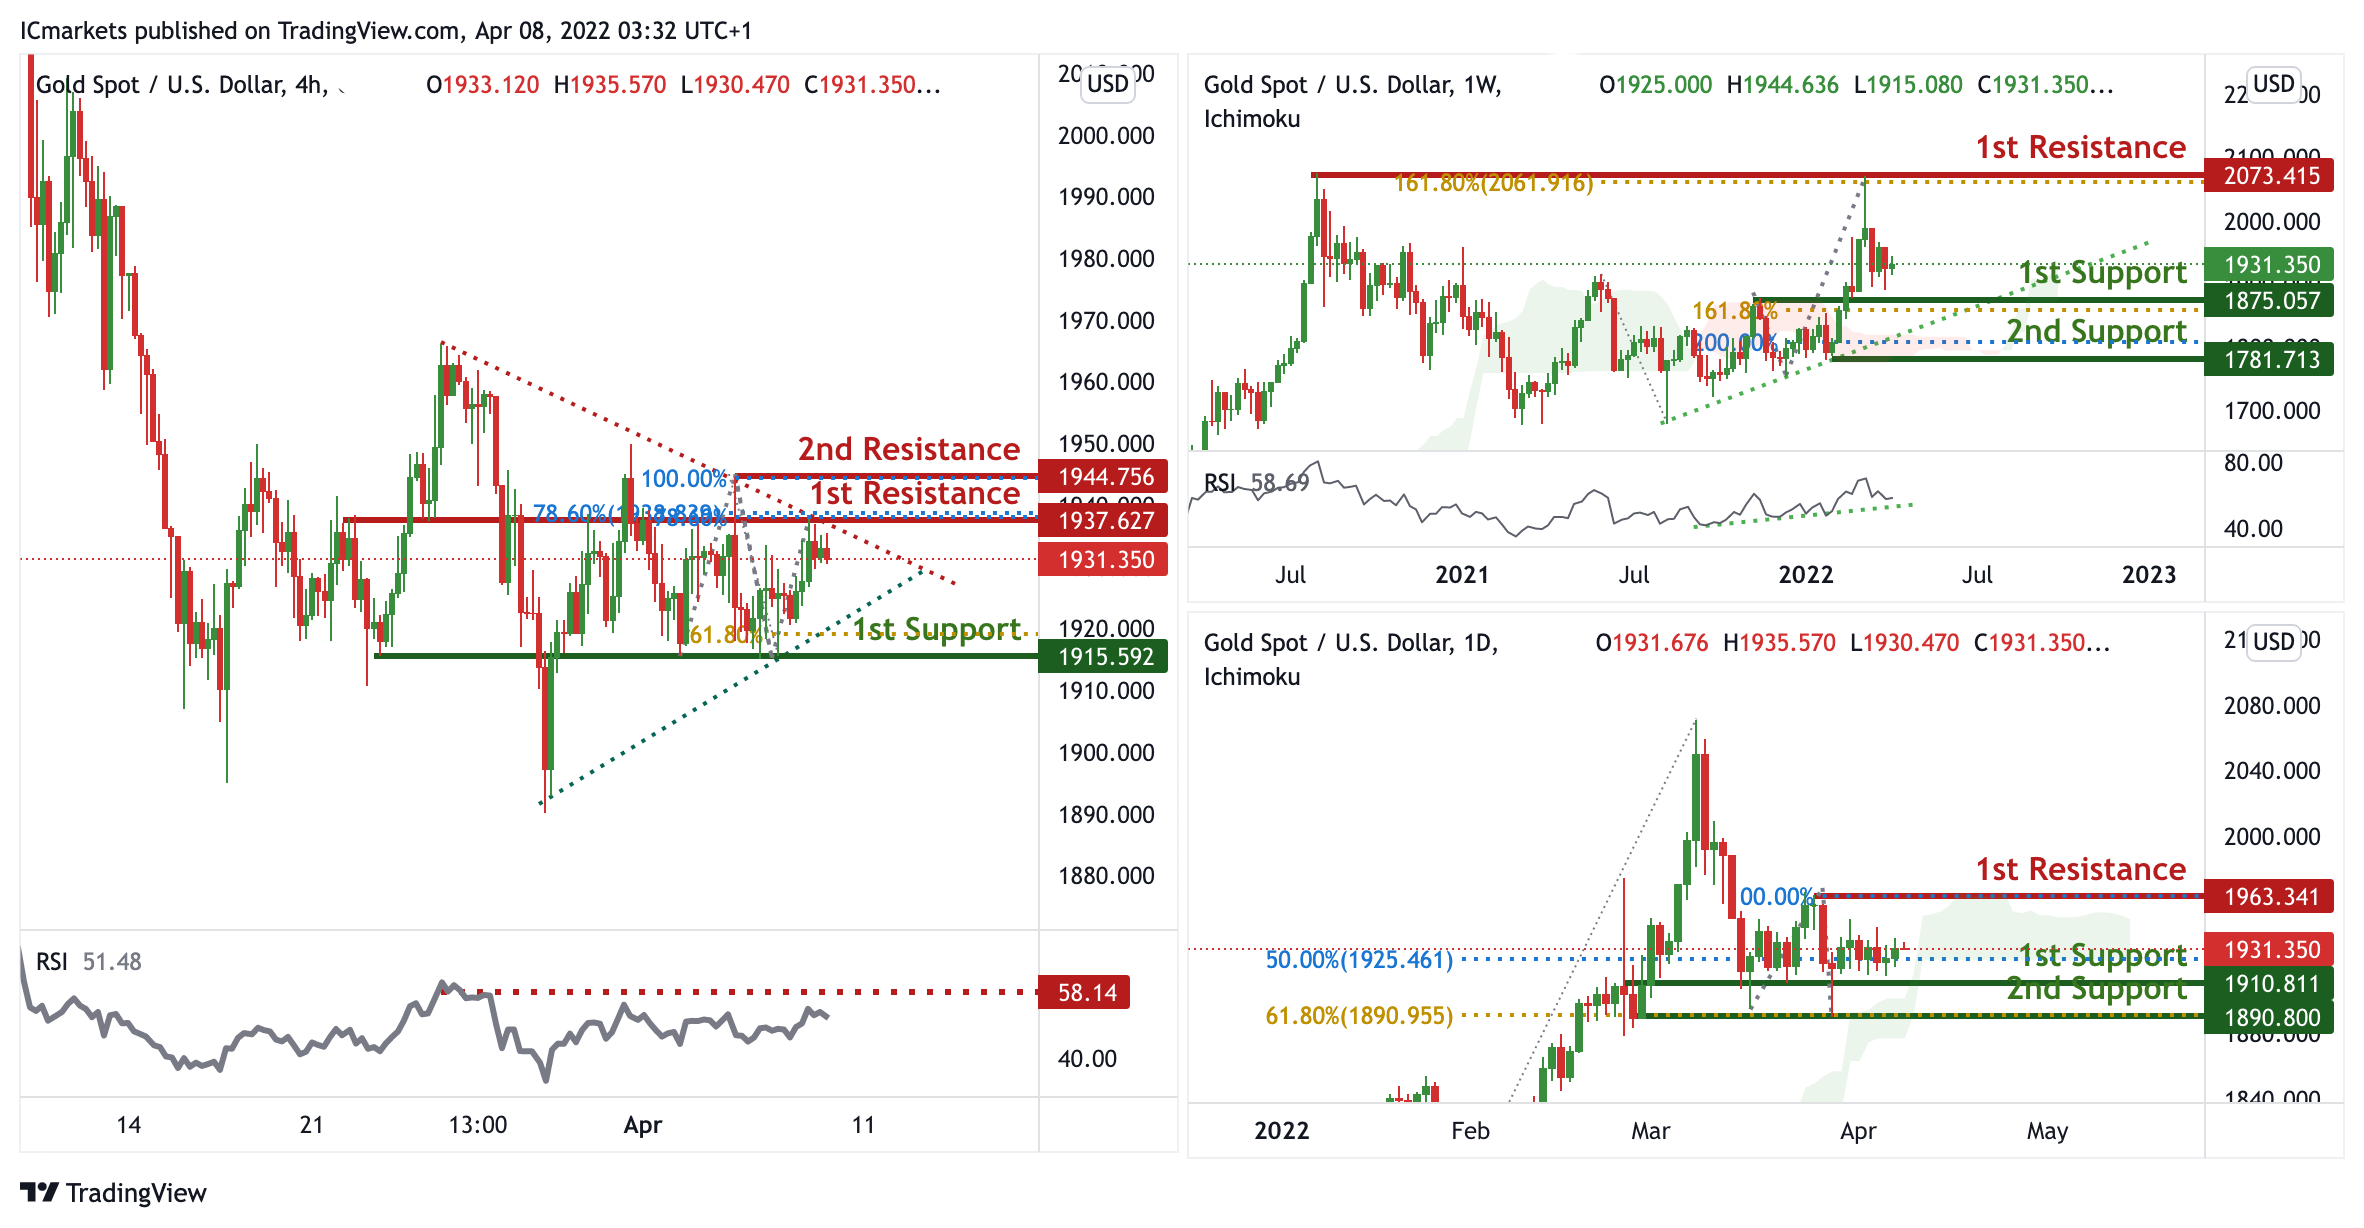
XAU/USD (GOLD):
On the weekly, prices are on bullish momentum and abiding by an ascending trendline support. We see the potential for a bounce from our 1st support at 1875.057 in line with 161.8% Fibonacci Projection. Prices are trading above our ichimoku clouds, further supporting our bullish view. On the daily, prices are on a support. We see the potential for a bounce from our 1st support at 1910.811 in line with 50% Fibonacci retracement towards our 1st resistance at 1910.811 in 100% Fibonacci Projection. Prices are trading above our Ichimoku clouds, further supporting our bullish bias. On the H4, prices are consolidating in a triangle pattern. We see the potential for a dip from our 1st resistance at 1937.627 which is an area of Fibonacci confluences towards our 1st support at 1915.592 in line which is a graphical overlap and in line with 61.8% Fibonacci Projection. RSI is at levels where dips previously occurred, further supporting our bearish view.
Areas of consideration:
- 4h 1st support at 1915.592
- 4h 1st resistance at 1937.627
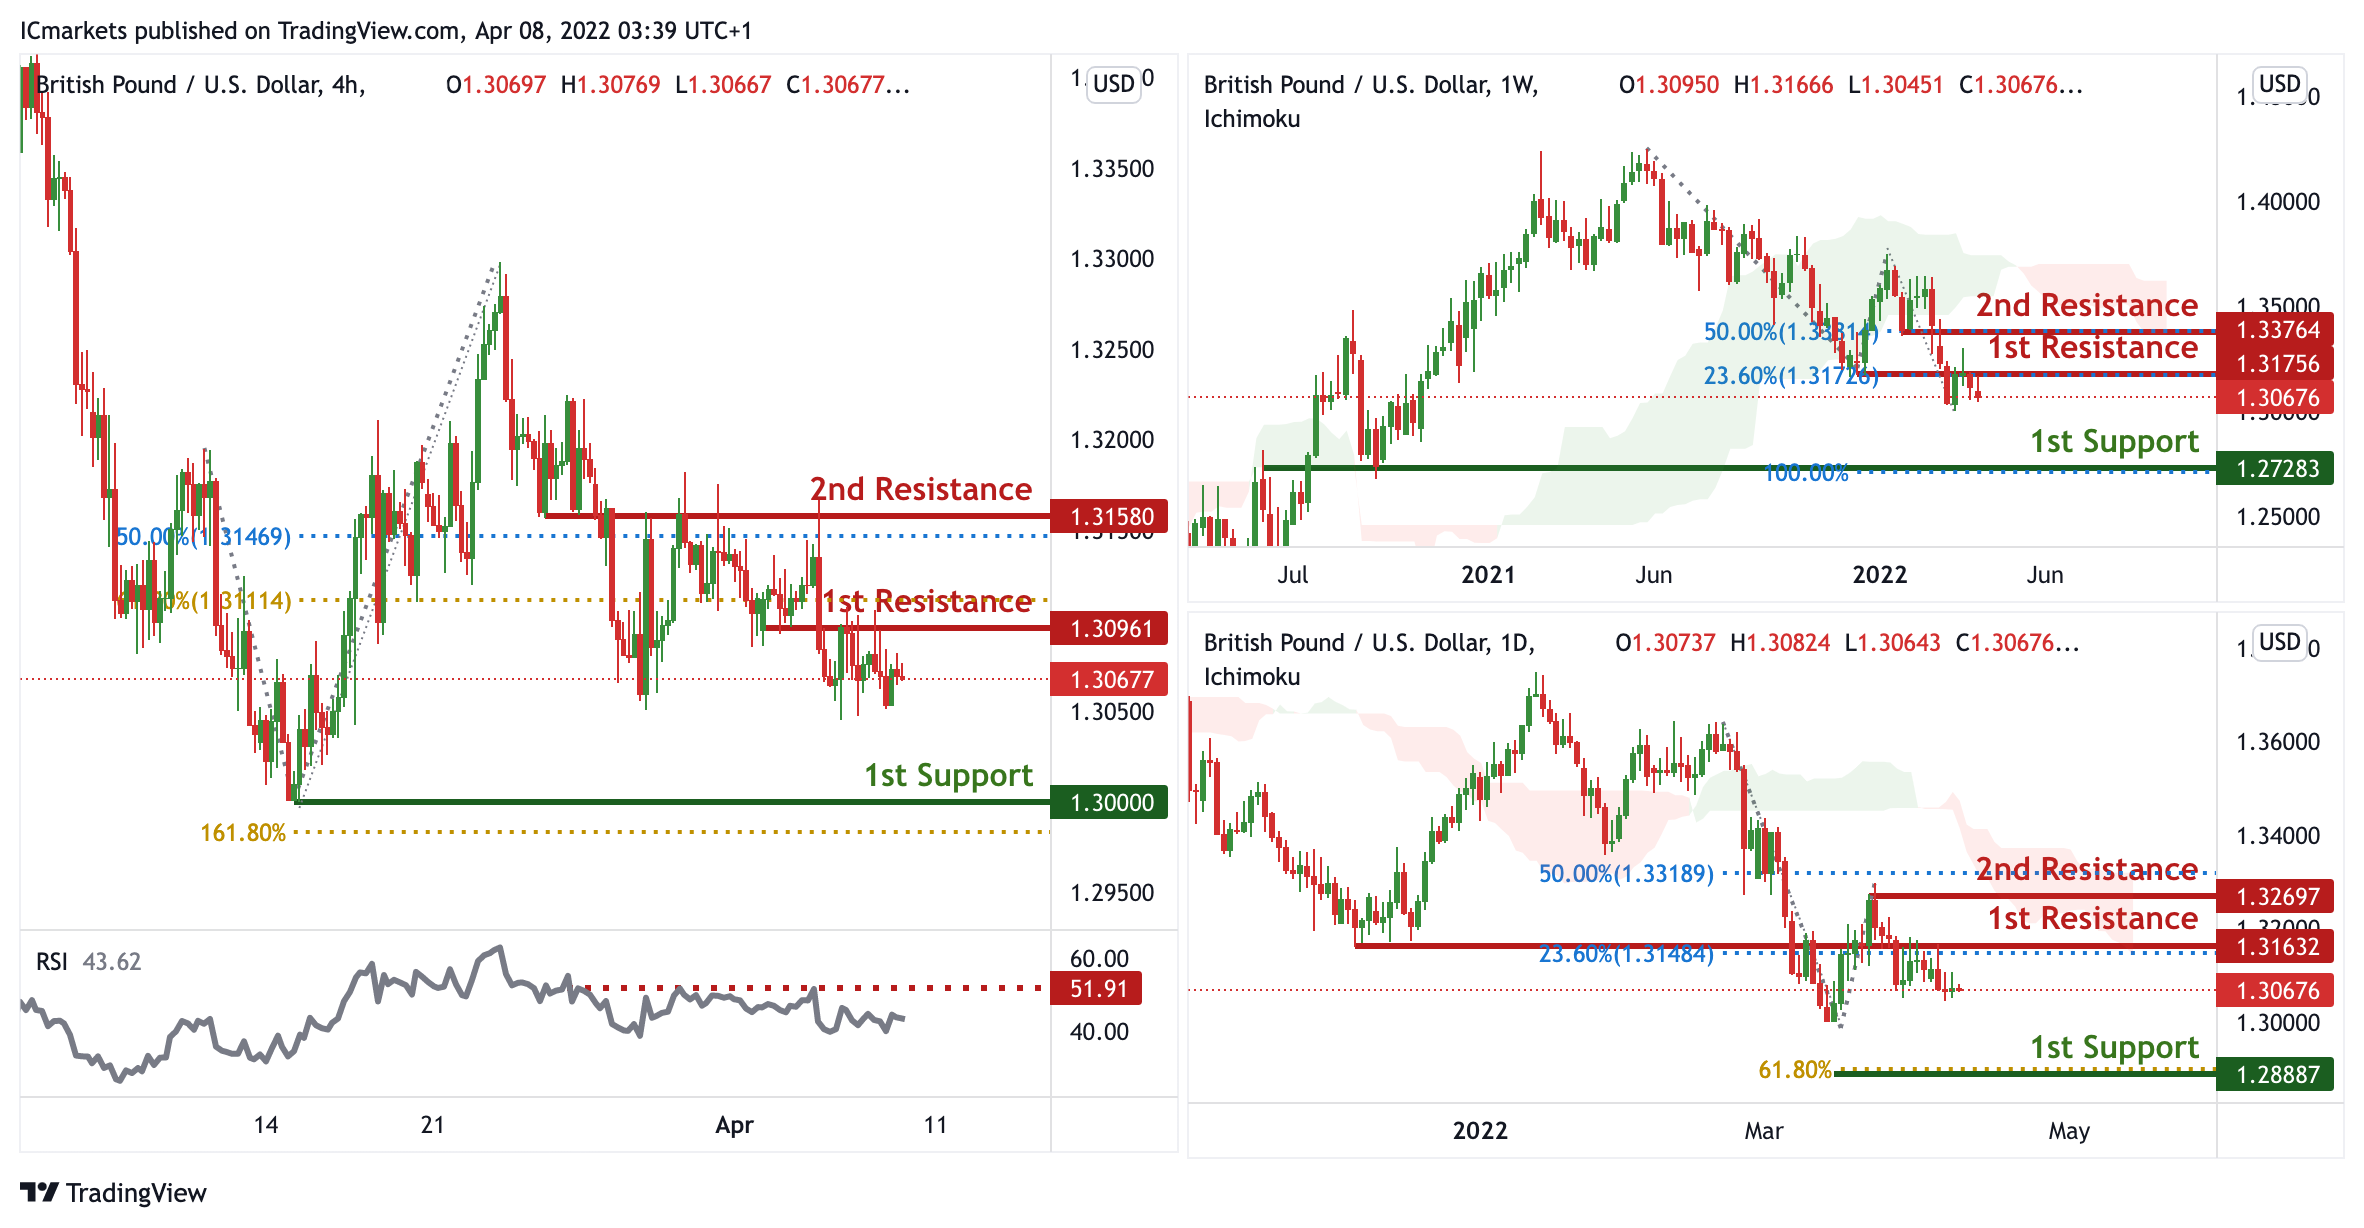
GBP/USD:
On the weekly, prices have reached a key pivot. We see the potential for a dip from our 1st resistance at 1.31756 in line with 23.6% Fibonacci retracement towards our 1st support at 1.27283 in line with 100% fibonacci Projection. Prices are trading below our ichimoku cloud resistance, further supporting our bearish bias.
On the daily, prices are on bearish momentum. We see the potential for a dip from our 1st resistance at 1.31632 in line with 23.6% Fibonacci retracement towards our 1st support at 1.28887 in line with 61.8% Fibonacci projection. Prices are trading below our ichimoku cloud resistance, further supporting our bearish bias.
On the H4, prices are approaching a pivot. We see the potential for further bearish continuation from our 1st resistance at 1.30961 in line with 61.8% Fibonacci retracement towards our 1st support at 1.3000 in line with 161.8% Fibonacci Projection. Alternatively, if prices continue to climb, we might find prices climbing further towards our 2nd resistance at 1.3158 in line with 50% Fibonacci retracement. Our bullish bias is further supported by RSI being at levels where dips previously occurred.
Areas of consideration:
- H4 1st resistance at 1.30961
- H4 1st support at 1.3000
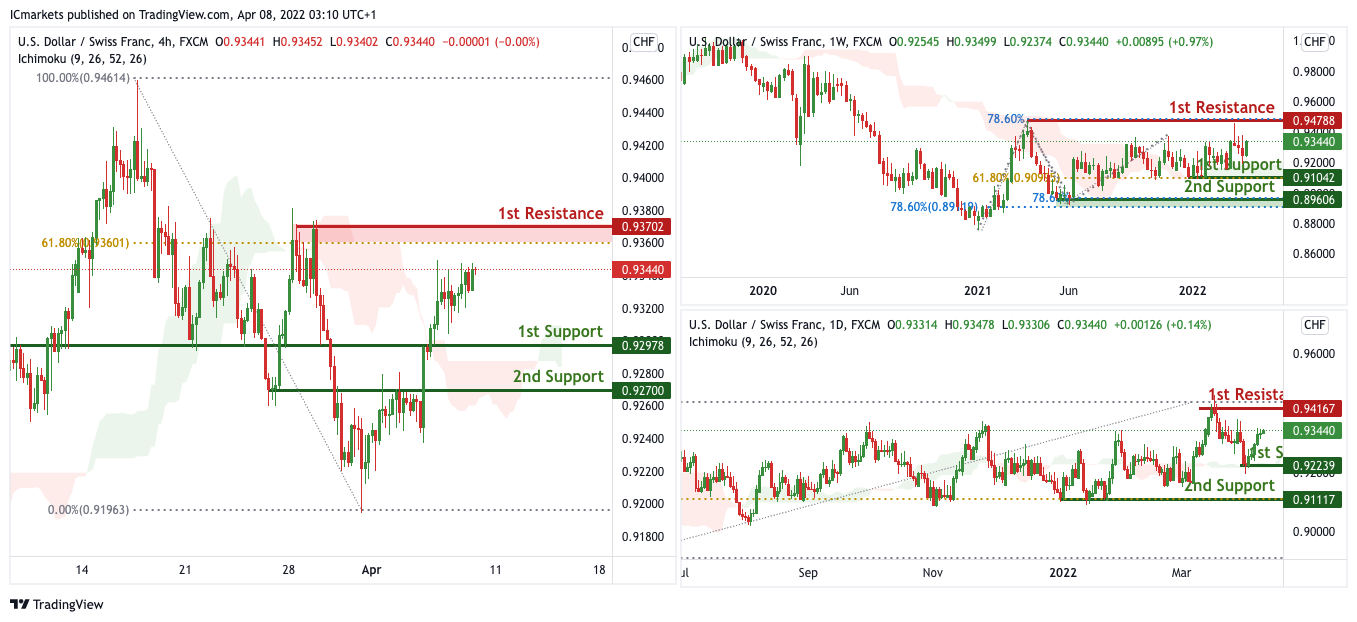
USD/CHF:
On the Weekly, with price moving above the ichimoku cloud, we have a bias that price will rise to our 1st resistance from our 1st support. Alternatively, price may break 1st support structure and head for 2nd support.
On the Daily, with price moving above the ichimoku cloud, we have a bias that price will rise to our 1st resistance from our 1st support. Alternatively, price may break 1st support structure and head for 2nd support.
On the H4, with price moving above the ichimoku cloud and the recent break of the channel, we have a bias that price will rise to our 1st resistance at 0.93720 in line with the 61.8% Fibonacci retracement from our 1st support at 0.92978 in line with the horizontal pullback support. Alternatively, price may break 1st support structure and head for 2nd support at 0.92700 in line with the swing pullback support.
Areas of consideration
- 1st support level at 0.92978
- 1st resistance level at 0.93720
EUR/USD :
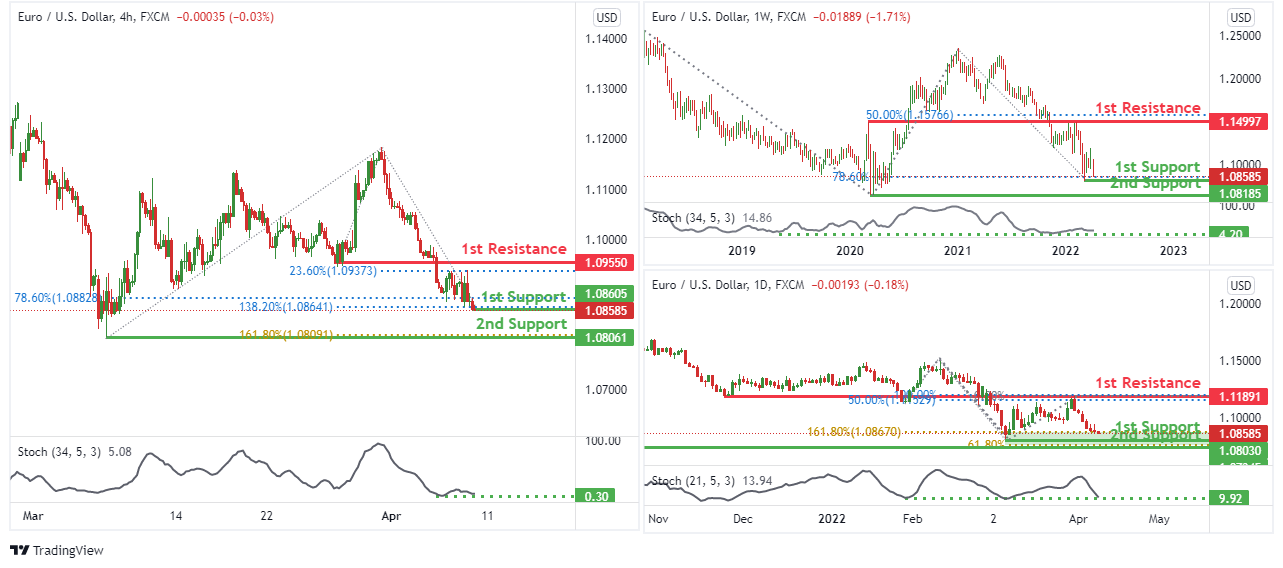
On the weekly timeframe, price is near 1st support level of 1.08185 in line with 78.6% fibonacci retracement. It can potentially bounce up to 1st resistance level of 1.14997 in line with 50% fibonacci retracement. Our bullish bias is supported by the stochastic indicator where price is near support level.
On the daily timeframe, price is 1st support level of 1.08585 in line with 161.8% fibonacci extension. It can potentially bounce up to 1st resistance level of 1.11891 in line with 50% fibonacci retracement and 100% fibonacci projection. Our bullish bias is supported by the stochastic indicator where price is near support level.
On the H4 timeframe, prices are at a key pivot. We see the potential for a bounce from our 1st support at 1.08605 which is an area of Fibonacci confluences towards our 1st resistance at 1.09550 in line with 23.6% Fibonacci retracement. Our bullish bias is supported by the stochastic indicator where price is near support level.
Areas of consideration :
- H4 1st resistance at 1.09550
- H4 1st support at 1.08605
USD/JPY:
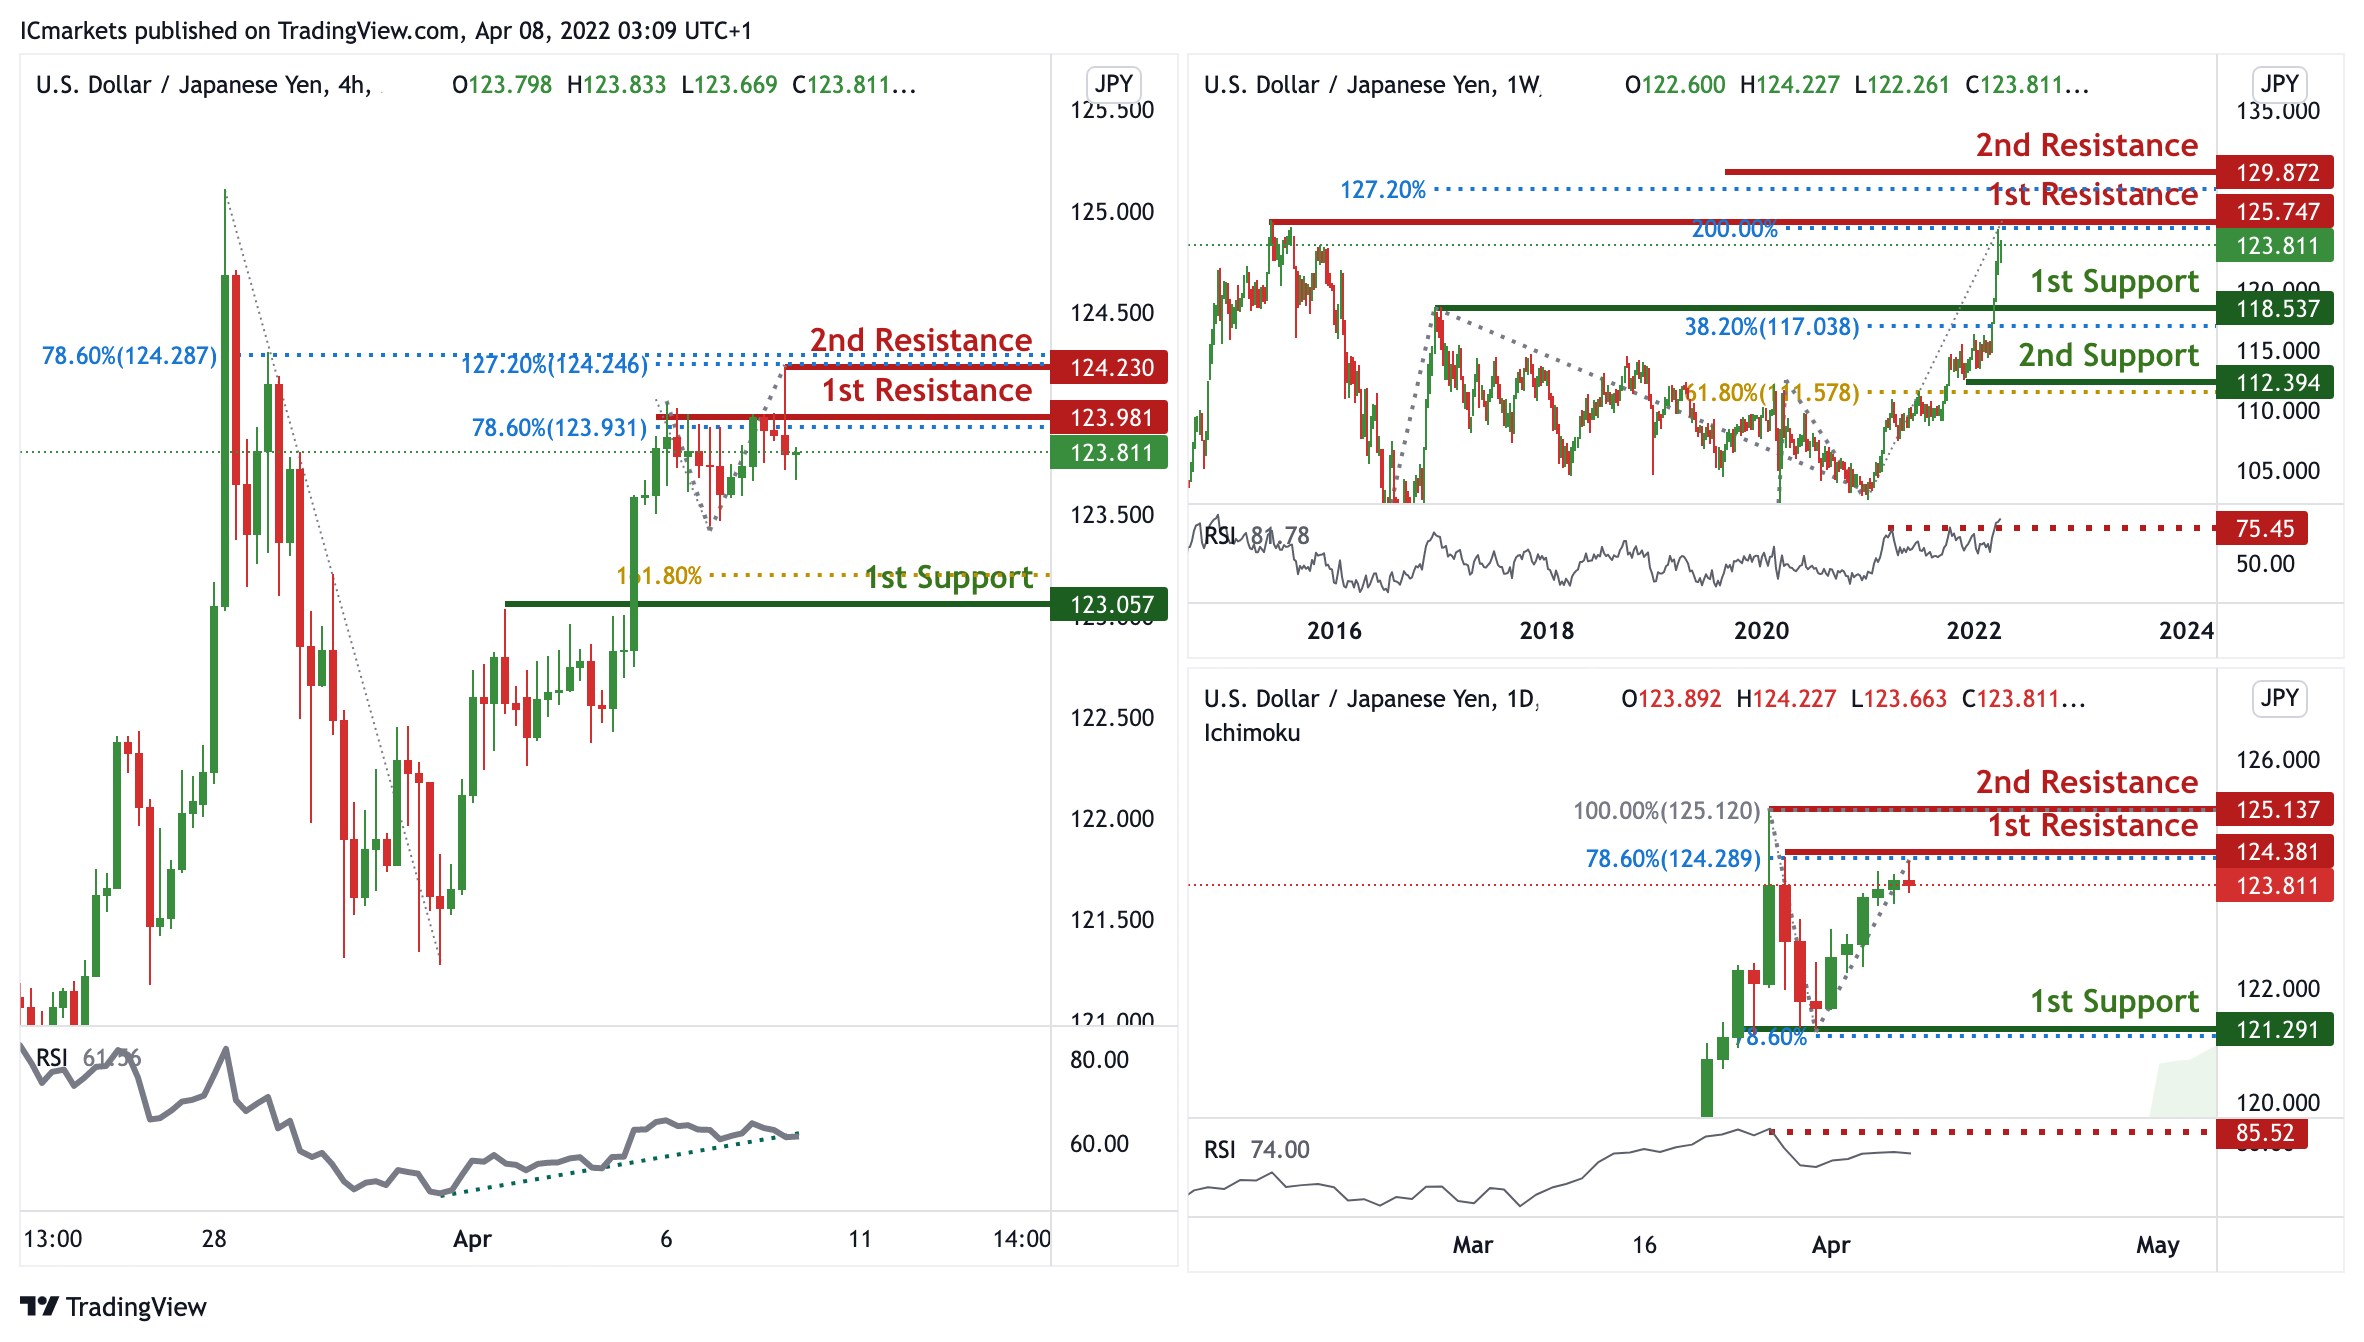
On the weekly, prices are on bullish momentum and approaching a key pivot. We see the potential for a dip from our 1st resistance at 125.747 in line with 200% Fibonacci Projection towards our 1st support at 118.537 in line with 38.2% Fibonacci retracement. RSI is at levels where dips previously occurred. On the daily, prices are approaching a key pivot. We see the potential for dip from our 1st resistance at 124.381 in line with 78.6% Fibonacci Projection towards our 1st support at 121.291 in line with 78.6% Fibonacci projection. RSI is at levels where dips previously occurred. On the H4 timeframe, prices are at a pivot. We see the potential for a dip from our 1st resistance at 123.981 in line with 78.6% Fibonacci projection towards our 1st support at 123.057 in line with 161.8% Fibonacci Projection. Bearish divergence is spotted on RSI, further supporting our bearish bias.
Areas of consideration:
- H4 time frame, 1st resistance at 123.981
- H4 time frame, 1st support at 123.057
AUD/USD:
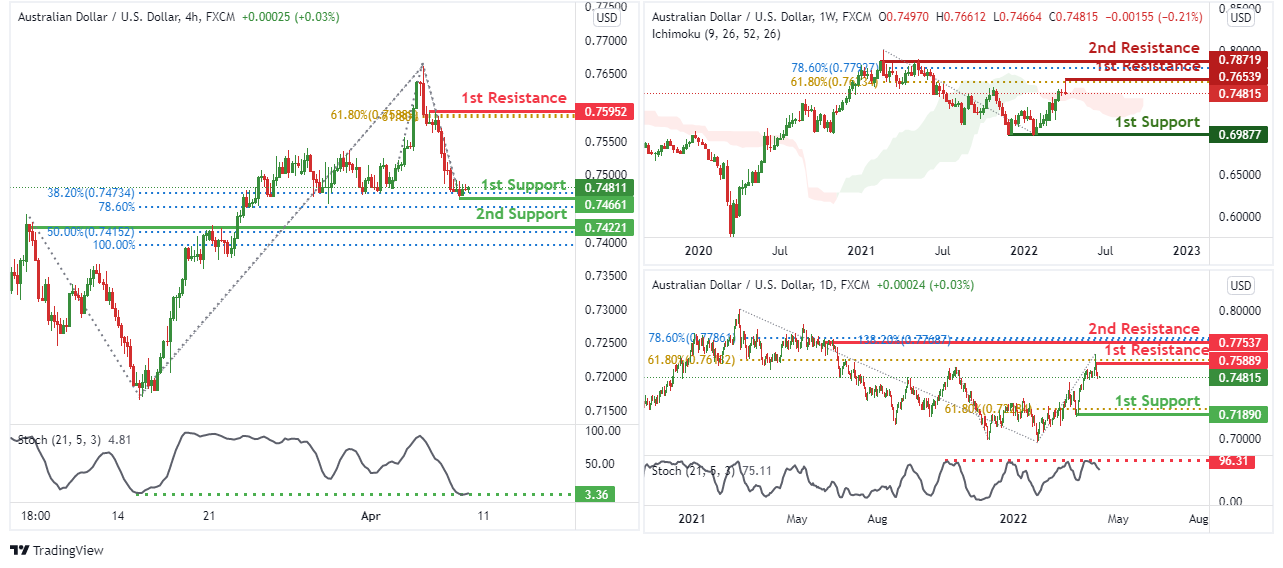
On the weekly timeframe, price is near to 1st resistance level of 0.76539 in line with 61.8% fibonacci retracement. Price can potentially dip to 1st support level of 0.69813 which is in line with 100% fibonacci projection. Our bearish bias is supported by price trading below the ichimoku cloud indicator.
On the daily timeframe, price is near to 1st resistance level of 0.75575 in line with 50% fibonacci retracement, 61.8% fibonacci projection and 161.8% fibonacci extension. Price can potentially bearish dip to 1st support level of 0.71890 which is in line with 100% fibonacci projection. Our bearish bias is supported by the stochastic indicator where price is at resistance level.
On the H4 timeframe, we see the potential for a bullish bounce from our 1st support level at 0.74716 in line with 23.6% Fibonacci retracement towards our 1st resistance at 0.75951 in line with 61.8% Fibonacci retracement and 61.8% fibonacci projection. Our bearish bias is supported by the stochastic indicator where price is at support level.
Areas of consideration
- H4 1st resistance at 0.75951
- H4 1st support at 0.74716
NZD/USD:
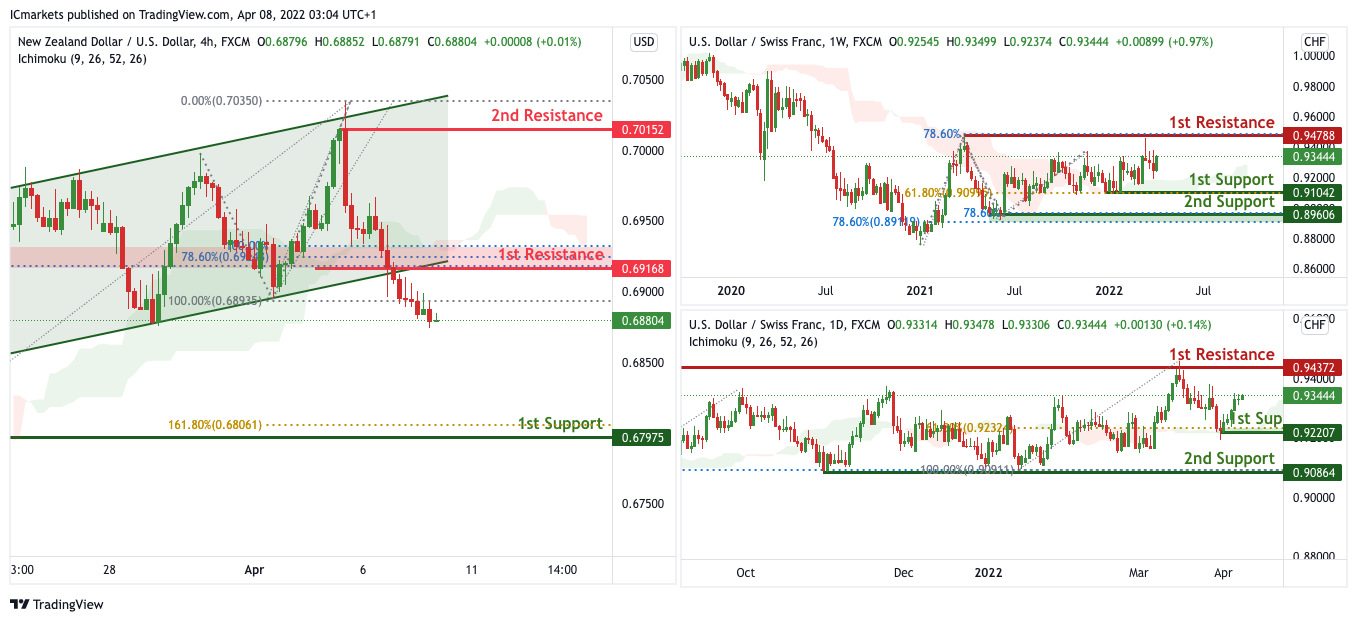
On the Weekly, with price moving above the ichimoku cloud, we have a bias that price will rise to our 1st resistance from our 1st support. Alternatively, price may break 1st support structure and head for 2nd support.
On the Daily, with price moving above the ichimoku cloud, we have a bias that price will rise to our 1st resistance from our 1st support. Alternatively, price may break 1st support structure and head for 2nd support.
On the H4, with price moving below our ichimoku cloud, we expect to see a potential for bearish drop from our 1st resistance of 0.69168 in line with the 23.6% fibonacci retracement and 61.8% Fibonacci projection towards our 1st support level at 0.67975 in line with the 161.8% Fibonacci extension. Alternatively, If price breaks out, it can potentially move towards our 2nd resistance level at 0.70152 which is in line with the swing high resistance.
Areas of consideration:
- H4 time frame, 1st support at 0.67975
- H4 time frame, 1st resistance at 0.69168
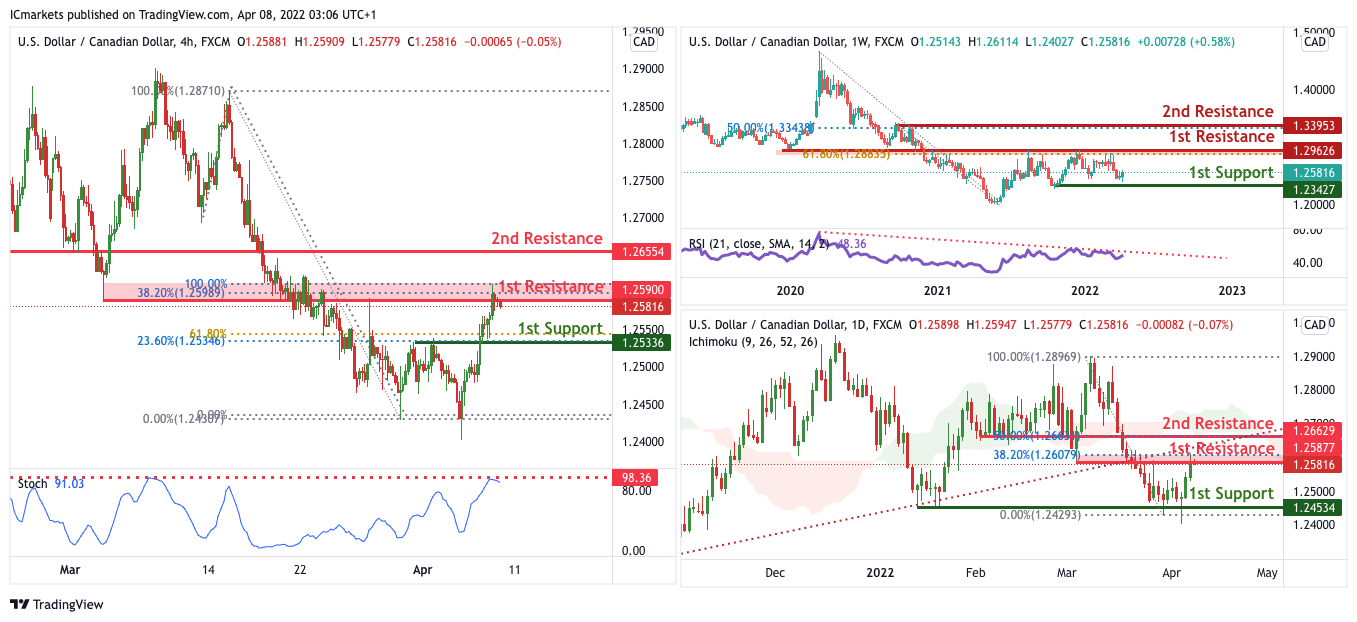
USD/CAD:
On the Weekly, with price expected to reverse off the stochastics indicator, we have a bias that price will drop to our 1st support from our 1st resistance. Alternatively, price may break 1st resistance and head for 2nd resistance.
On the Daily, with price moving below the ichimoku cloud, we have a bias that price will drop to our 1st support from our 1st resistance. Alternatively, price may break 1st resistance and head for 2nd resistance.
On the H4, with price expected to reverse off the stochastic indicator, we expect to see a potential for bearish drop from our 1st resistance of 1.25811 in line with the 38.2% fibonacci retracement and 100% Fibonacci projection towards our 1st support level at 1.25336 in line with 23.6% Fibonacci retracement and 61.8% Fibonacci retracement. Alternatively, If price breaks out, it can potentially move towards our 2nd resistance level at 1.26554 which is in line with the pullback support.
Areas of consideration:
- H4 time frame, 1st support at 1.25336
- H4 time frame, 1st resistance at 1.25811
OIL:
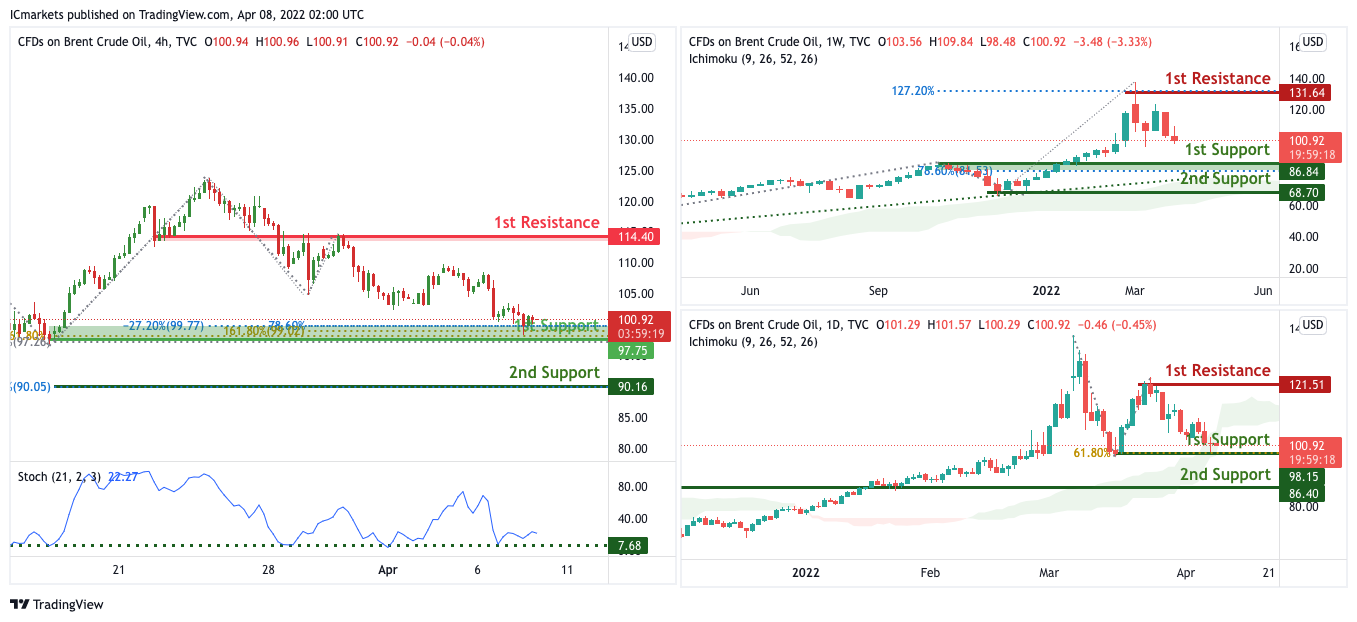
On the Weekly, with price moving above the ichimoku cloud, we have a bias that price will rise to our 1st resistance from our 1st support. Alternatively, price may break 1st support structure and head for 2nd support.
On the Daily, with price moving above the ichimoku cloud, we have a bias that price will rise to our 1st resistance from our 1st support. Alternatively, price may break 1st support structure and head for 2nd support.
On the H4, with price expected to bounce off the support of the stochastics indicator, we have a bias that price will rise to our 1st resistance at 114.40 in line with the horizontal pullback resistance from our 1st support at 101.71 in line with the horizontal overlap support, 78.6% Fibonacci projection. Alternatively, price may break 1st support structure and head for 2nd support at 90.16 in line with the 127.2% Fibonacci extension
Areas of consideration:
- H4 time frame, 1st resistance of 114.40
- H4 time frame, 1st support of 101.71
Dow Jones Industrial Average:
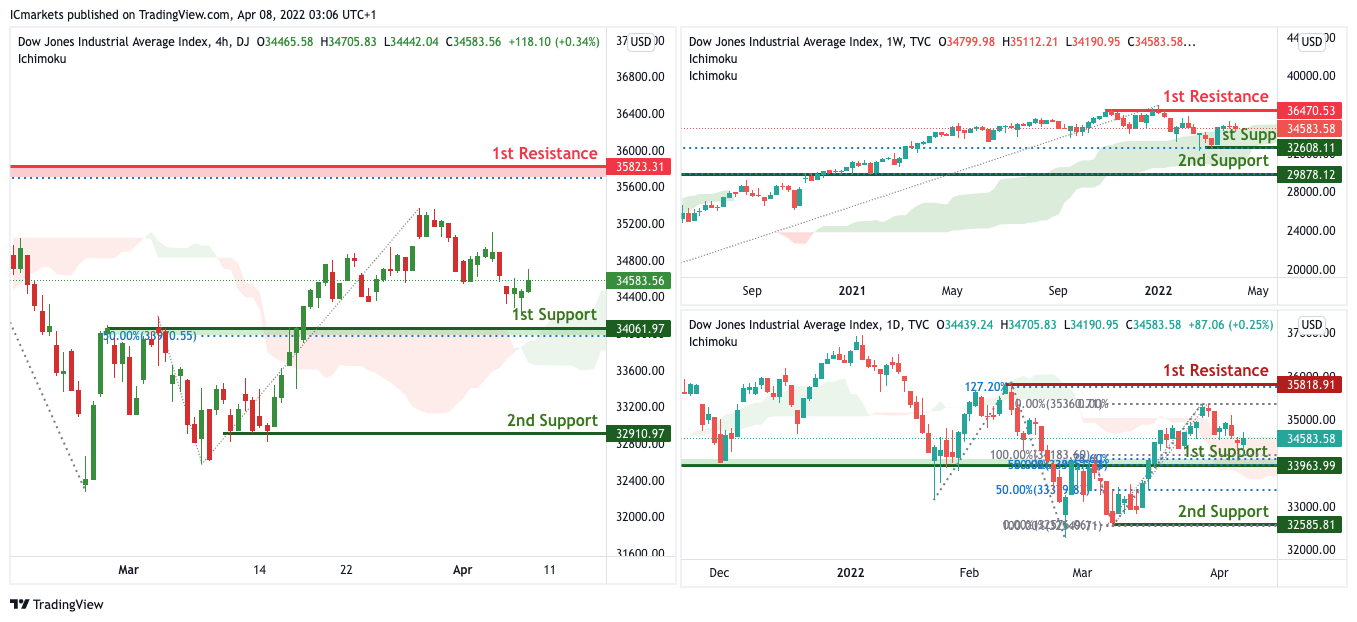
On the Weekly, with price moving above the ichimoku cloud, we have a bias that price will rise to our 1st resistance from our 1st support. Alternatively, price may break 1st support structure and head for 2nd support.
On the H4, with price moving above the ichimoku cloud, we have a bias that price will rise to our 1st resistance from our 1st support. Alternatively, price may break 1st support structure and head for 2nd support.
On the H4, with price moving above the ichimoku cloud, we have a bias that price will rise to our 1st resistance at 35823 in line with the 127.2% Fibonacci extension from our 1st support at 34061 in line with the horizontal pullback support and 50% Fibonacci retracement. Alternatively, price may break 1st support structure and head for 2nd support at 32910 in line with the horizontal swing low support.
Areas of consideration :
- H4 1st support at 34569
- H4 1st resistance at 35823
GBP/JPY Daily Outlook
Daily Pivots: (S1) 161.59; (P) 161.93; (R1) 162.45; More...
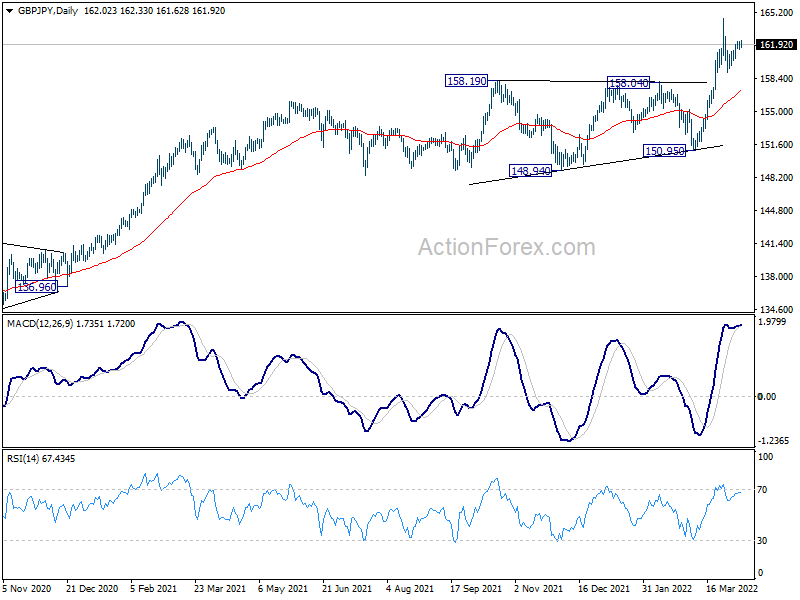
GBP/JPY is still extending the consolidation from 164.61 and intraday bias remains neutral for the moment. Outlook remains bullish with 158.04 resistance turned support intact, and further rally is expected. On the upside, break of 164.61 will resume larger up trend to long term fibonacci level at 167.93. However, firm break of 158.19 will turn bias to the downside and bring deeper pull back.
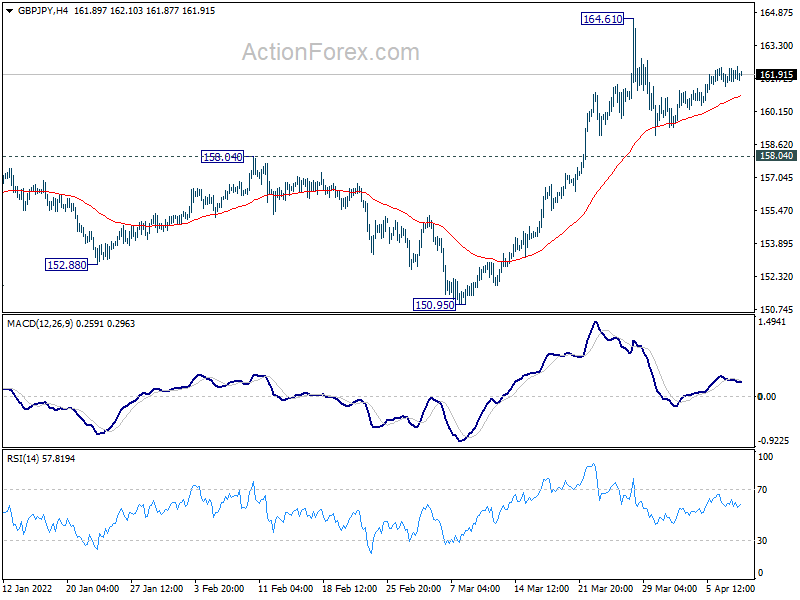
In the bigger picture, up trend from 123.94 (2020 low) is still in progress, and notable support from 55 week EMA affirms medium term bullishness. Next target is 61.8% retracement of 195.86 (2015 high) to 122.75 (2016 low) at 167.93. Sustained break there will be a long term bullish signal. This will now remain the favored case as long as 150.95 support holds.
EUR/JPY Daily Outlook
Daily Pivots: (S1) 134.38; (P) 134.94; (R1) 135.46; More....
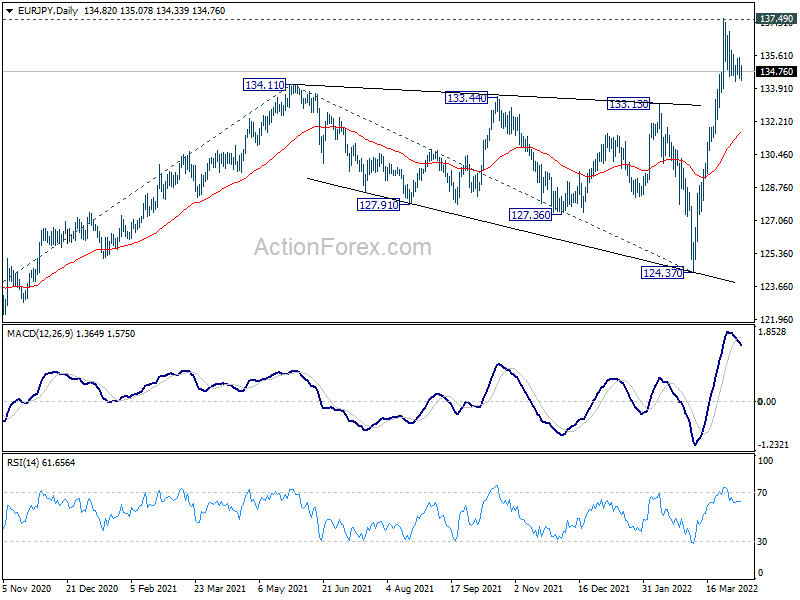
EUR/JPY is staying in consolidation from 137.50 and intraday bias stays neutral for the moment. With 133.70 minor support intact, further rally is expected. On the upside, sustained break of 137.49 resistance will resume larger up trend for 144.06 projection level next. However, firm break of 133.70 will indicate short term topping, and turn bias back to the downside for deeper pull back.
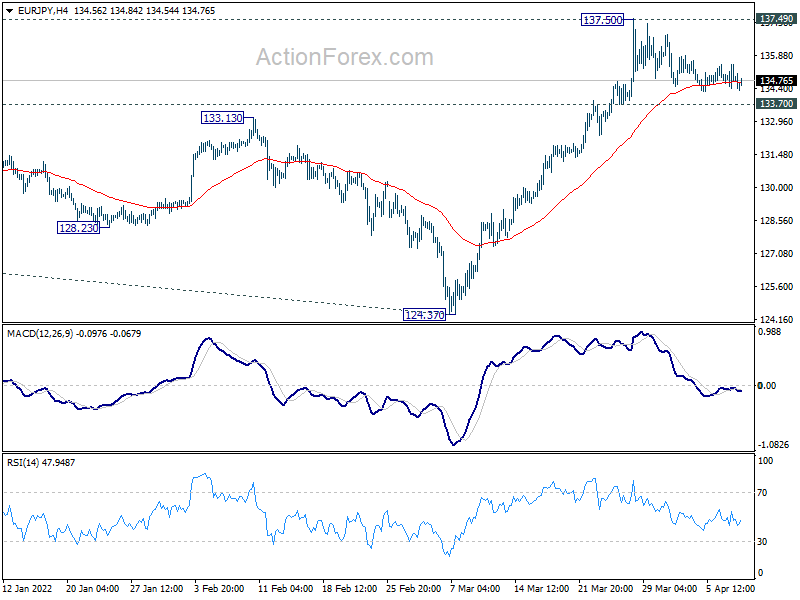
In the bigger picture, up trend from 114.42 (2020 low) is in progress. Sustained break of 137.49 (2018 high) will resume larger pattern from 109.30 (2016 low). Next target will be 100% projection of 114.42 to 134.11 from 124.37 at 144.06. In any case, outlook will now remain bullish as long as 124.37 support holds, in case of deep pull back.