

Sample Category Title
GBP/USD Daily Outlook
Daily Pivots: (S1) 1.3049; (P) 1.3077; (R1) 1.3103; More...
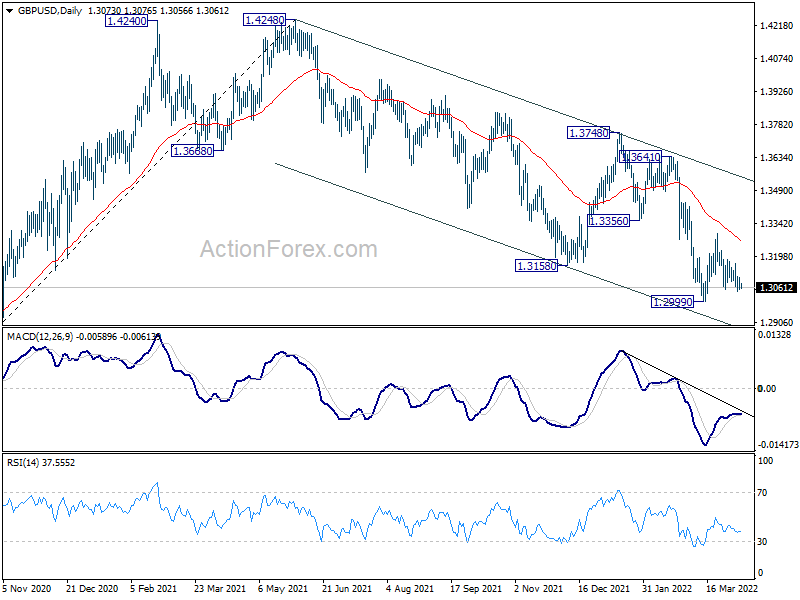
No change in GBP/USD's outlook as consolidation from 1.2999 is still extending. Intraday bias remains neutral and further decline is mildly in favor with 1.3297 resistance intact. On the downside, firm break of 1.2999 will resume larger down trend from 1.4248. However, firm break of 1.3297 will turn bias back to the upside for stronger rebound.
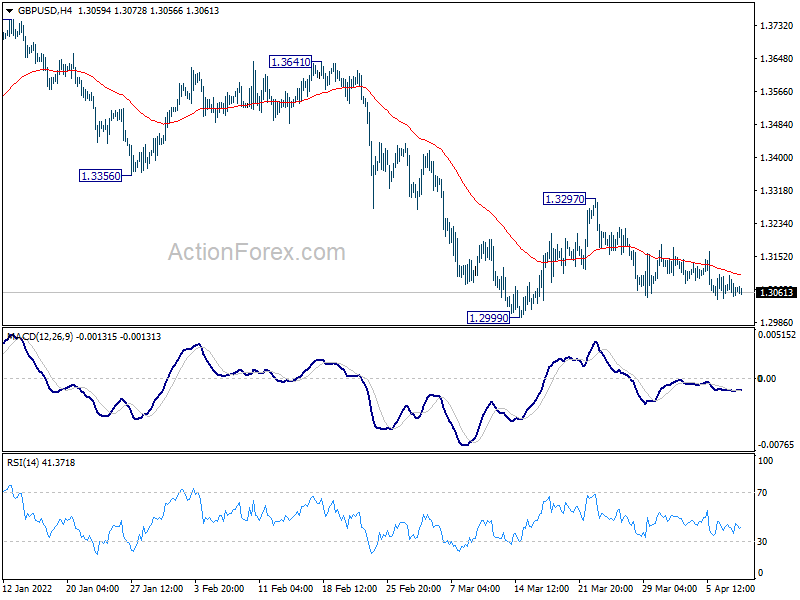
In the bigger picture, current development suggests that the up trend from 1.1409 (2020 low) has completed at 1.4248. Decline from 1.4248 could still be a corrective move, or it could be the start of a long term down trend. In either case, deeper decline would be seen back to 61.8% retracement of 2.1161 to 1.1409 at 1.2493. In any case, break of 1.3748 resistance is needed to indicate medium term bottoming, or outlook will stay bearish.
EUR/USD Daily Outlook
Daily Pivots: (S1) 1.0850; (P) 1.0895 (R1) 1.0924; More...
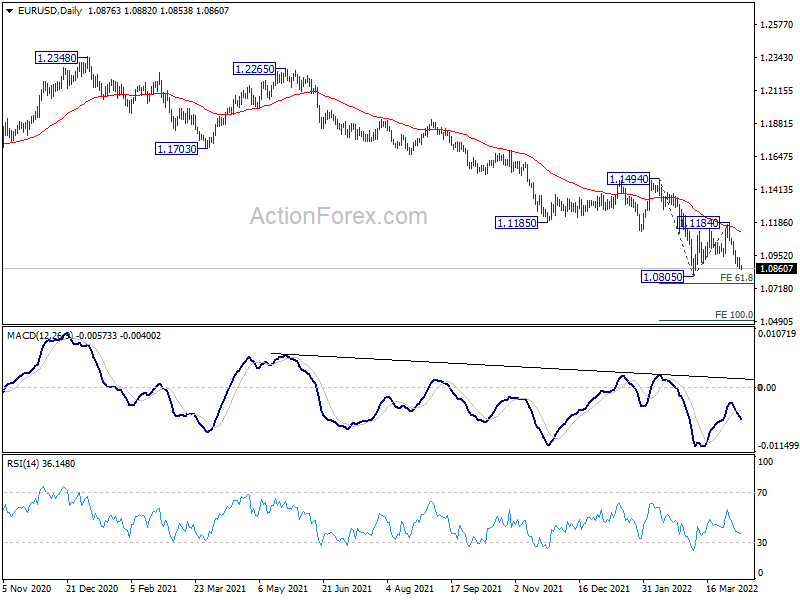
Intraday bias in EUR/USD stays on the downside for retesting 1.0805 low first. Firm break there will resume larger down trend from 1.2248. Next target is 61.8% projection of 1.1494 to 1.0805 from 1.1184 at 1.0758, and then 100% projection at 1.0495. On the upside, above 1.0987 minor resistance will mix up the outlook and bring recovery.
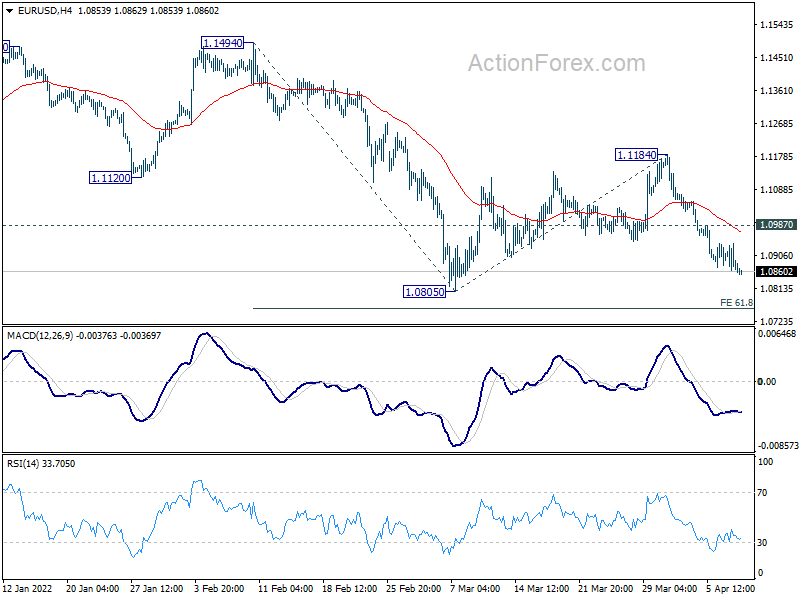
In the bigger picture, the decline from 1.2348 (2021 high) is expected to continue as long as 1.1494 resistance holds. Firm break of 1.0635 (2020 low) will raise the chance of long term down trend resumption and target a retest on 1.0339 (2017 low) next. Nevertheless, break of 1.1494 will maintain medium term neutral outlook, and extending term range trading first.
Euro Soft in Quiet Market, CAD Awaits Job Data
Overall, the markets are rather steady so far in the last trading day of the week. Major Asian indexes are treading water. That followed a late rebound in US markets overnight. Euro weakens mildly and remains the worst performer for the week, followed by Yen and Swiss Franc. Dollar is still the strongest one, support by extended rally in US yields. Aussie and Sterling are the next strongest.
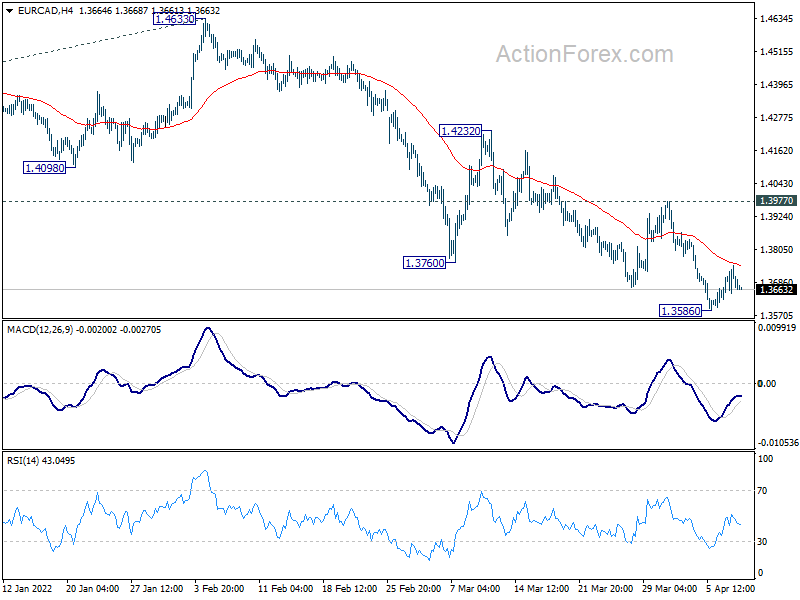
Technically, Canadian Dollar would be a focus today with job data featured too. EUR/CAD recovered mildly after dipping to 1.3586. But outlook stays bearish with 1.3977 resistance intact. Break of 1.3586 will resume the larger down trend. When that happens, the question is whether EUR/USD would also break through 1.0805 low, or USD/CAD would be finally rejected by 1.2591 resistance.
In Asia, at the time of writing, Nikkei is up 0.09%. Hong Kong HSI is down -0.47%. China Shanghai SSE is up 0.31%. Singapore Strait Times is down -0.72%. Overnight, DOW rose 0.25%. S&P 500 rose 0.43%. NASDAQ rose 0.06%. 10-year yield rose 0.043 to 2.652.
Fed Bostic: Appropriate to move policy to neutral, in a measured way
Atlanta Fed President Raphael Bostic said yesterday, "it's time that we get off of our emergency stance -- I think it's really appropriate that we move our policy closer to a neutral position -- but I think we need to do it in a measured way."
At the same virtual conference, Chicago Fed President Charles Evans said, "I'm optimistic that we can get to neutral, look around, and find that we're not necessarily that far from where we need to go."
WTI oil gyrates lower as medium term consolidation extends
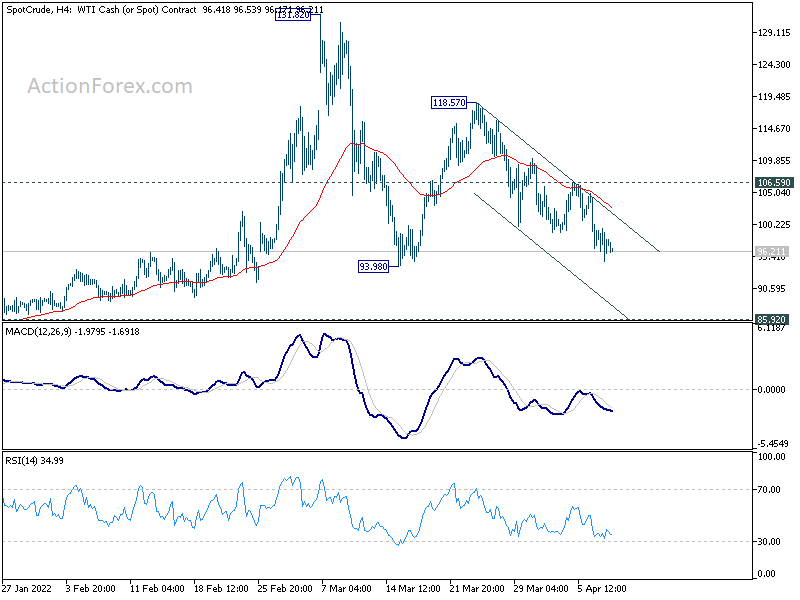
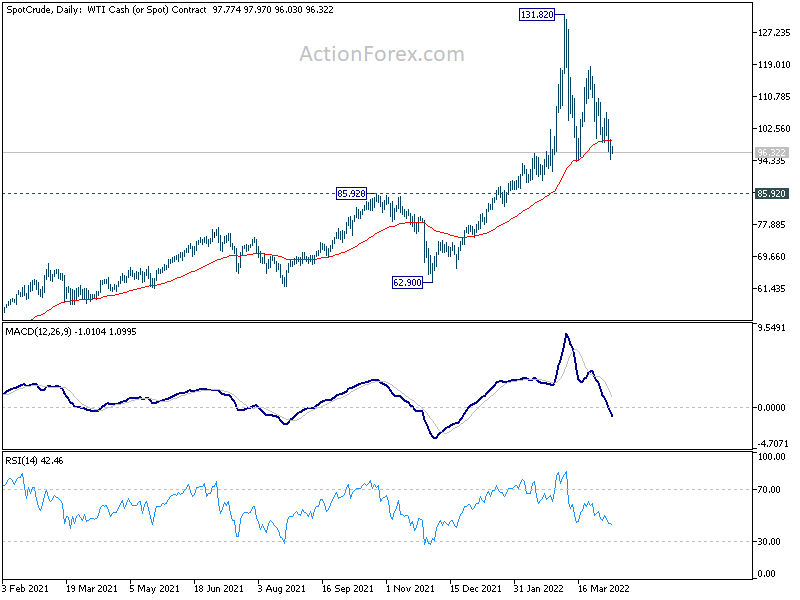
WTI crude oil continued to gyrate lower this week. EU has yet confirmed banning Russian coal and even if they do, it's not expected to take effect until August. Oil embargo is not in sight. Meanwhile, oil demand in China is not looking good as coronavirus lockdowns put activity in Shanghai into a halt.
Anyway, the current fall from 118.57 in WTI crude oil is seen as a leg inside the medium term corrective pattern from 131.82. Deeper decline might be seen through 93.98 support. But strong support should be seen at around 85.92 resistance turned support to bring rebound.
On the upside, break of 106.59 resistance will bring rebound back to 118.57 resistance and possibly above. But there is no scope in break through 131.82 high for the near term. The corrective pattern will take a while to complete.
On the data front
Japan current account surplus came in at JPY 0.52T in February, above expectation of JPY 0.27T. Consumer confidence dropped from 35.3 to 32.8 in March, below expectation of 35.9.
Look ahead, Italy retail sales is the only feature in European session. Later in the day, focus will be on Canada employment.
EUR/USD Daily Outlook
Daily Pivots: (S1) 1.0850; (P) 1.0895 (R1) 1.0924; More...
Intraday bias in EUR/USD stays on the downside for retesting 1.0805 low first. Firm break there will resume larger down trend from 1.2248. Next target is 61.8% projection of 1.1494 to 1.0805 from 1.1184 at 1.0758, and then 100% projection at 1.0495. On the upside, above 1.0987 minor resistance will mix up the outlook and bring recovery.
In the bigger picture, the decline from 1.2348 (2021 high) is expected to continue as long as 1.1494 resistance holds. Firm break of 1.0635 (2020 low) will raise the chance of long term down trend resumption and target a retest on 1.0339 (2017 low) next. Nevertheless, break of 1.1494 will maintain medium term neutral outlook, and extending term range trading first.
Economic Indicators Update
| GMT | Ccy | Events | Actual | Forecast | Previous | Revised |
|---|---|---|---|---|---|---|
| 23:50 | JPY | Current Account (JPY) Feb | 0.52T | 0.27T | 0.19T | 0.18T |
| 05:00 | JPY | Consumer Confidence Index Mar | 32.8 | 35.9 | 35.3 | |
| 06:00 | JPY | Eco Watchers Survey: Current Mar | 45 | 37.7 | ||
| 08:00 | EUR | Italy Retail Sales M/M Feb | 0.20% | -0.50% | ||
| 12:30 | CAD | Net Change in Employment Mar | 77.5K | 336.6K | ||
| 12:30 | CAD | Unemployment Rate Mar | 5.40% | 5.50% | ||
| 14:00 | USD | Wholesale Inventories Feb F | 2.10% | 2.10% |
WTI oil gyrates lower as medium term consolidation extends
WTI crude oil continued to gyrate lower this week. EU has yet confirmed banning Russian coal and even if they do, it's not expected to take effect until August. Oil embargo is not in sight. Meanwhile, oil demand in China is not looking good as coronavirus lockdowns put activity in Shanghai into a halt.
Anyway, the current fall from 118.57 in WTI crude oil is seen as a leg inside the medium term corrective pattern from 131.82. Deeper decline might be seen through 93.98 support. But strong support should be seen at around 85.92 resistance turned support to bring rebound.
On the upside, break of 106.59 resistance will bring rebound back to 118.57 resistance and possibly above. But there is no scope in break through 131.82 high for the near term. The corrective pattern will take a while to complete.
Fed Bostic: Appropriate to move policy to neutral, in a measured way
Atlanta Fed President Raphael Bostic said yesterday, "it's time that we get off of our emergency stance -- I think it's really appropriate that we move our policy closer to a neutral position -- but I think we need to do it in a measured way."
At the same virtual conference, Chicago Fed President Charles Evans said, "I'm optimistic that we can get to neutral, look around, and find that we're not necessarily that far from where we need to go."
Cliff Notes: Labour Market Justifies Action by the RBA and FOMC
Key insights from the week that was.
This week witnessed a significant change in the RBA’s policy outlook. Rate expectations also drove market outcomes offshore.
Beginning with the RBA, the April decision statement saw the Board shift from biding their time to patiently assess conditions to having enough confidence in the economy to consider raising rates “over coming months” – assuming the data flow continues to justify doing so.
Westpac subsequently revised our view for the RBA tightening cycle, not only bringing forward the first hike from August to June 2022, but also revising up our expectation for the cash rate at year end (to 1.25%) and the peak for this cycle (to 2.00% in June 2023, 25bps higher and 6 months earlier than our prior estimate). While the change in language from the RBA highlights a greater willingness to act against inflation risks, it is the state of the labour market that backs our revised view.
Since the March RBA Board meeting, the labour market has continued to outperform expectations, the unemployment rate falling from 4.2% to 4.0% in March. Surging job vacancies point to a further substantial tightening of the labour market ahead from levels already consistent with full employment. As outlined by Chief Economist Bill Evans this week, we now expect the unemployment rate to fall to a low of 3.25% by year end (previously 3.75%) and wages growth to peak at 4.0% in 2023 (previously 3.5%). Combined with the (historic) accumulated savings of Australian households, real wage growth will support expectations of demand and inflation through end-2023 and the series of rate hikes we are forecasting. In terms of the risks to the outlook for policy and the economy, note the RBA’s latest Financial Stability Review is due for release today.
Before moving offshore, it is worth noting that this week also saw the release of the latest trade data for Australia. In February, the trade surplus narrowed sharply against expectations from $11.8bn (previously $12.9bn) to $7.5bn. The surprise came as a result of a surge in imports (12.1%) spread across consumer and intermediate goods – arguably the consequence of the re-opening of Australia’s economy and the recovery of global supply chains. An additional negative versus expectations in February was that, instead of rising further, exports consolidated in the month. In contrast, higher commodity prices will see the value of exports rally in coming months, leaving the trade surplus back at, or above, record highs.
Then to the US. As the tone of data remained strong, comments from FOMC speakers continued to signal a consensus for urgent action. Most notable were those of Governor Lael Brainard who signalled an intent to run quantitative tightening (QT) at a much more aggressive pace in 2022-23 than in 2017-19. The March meeting minutes subsequently gave a clearer view of the planned pace of QT, with the monthly caps for balance sheet roll-off likely to be ramped up over just three months to $60bn for Treasury securities and $35bn for mortgage-backed securities – roughly twice the caps of 2017-19. Combined with the rate hikes forecast by Westpac and the market, the net result will be a rapid normalisation of policy and a further tightening of financial conditions – from levels that are, arguably, already bordering on restrictive.
A full up-to-date assessment of the outlook for Australia and New Zealand, the US, Europe and China as well as commodities and FX markets will be made available today on Westpac IQ in our April edition of Market Outlook.
USD/JPY Restarts Uptrend Above 123.00
Key Highlights
- USD/JPY started a fresh increase from the 121.20 support zone.
- A key bullish trend line is forming with support near 123.75 on the 4-hours chart.
- EUR/USD started a consolidation phase near the 1.0900 pivot region.
- GBP/USD is showing bearish signs below 1.3150.
USD/JPY Technical Analysis
The US Dollar found a strong support near the 121.20 zone against the Japanese Yen. USD/JPY formed a base and started a fresh increase above the 122.00 level.
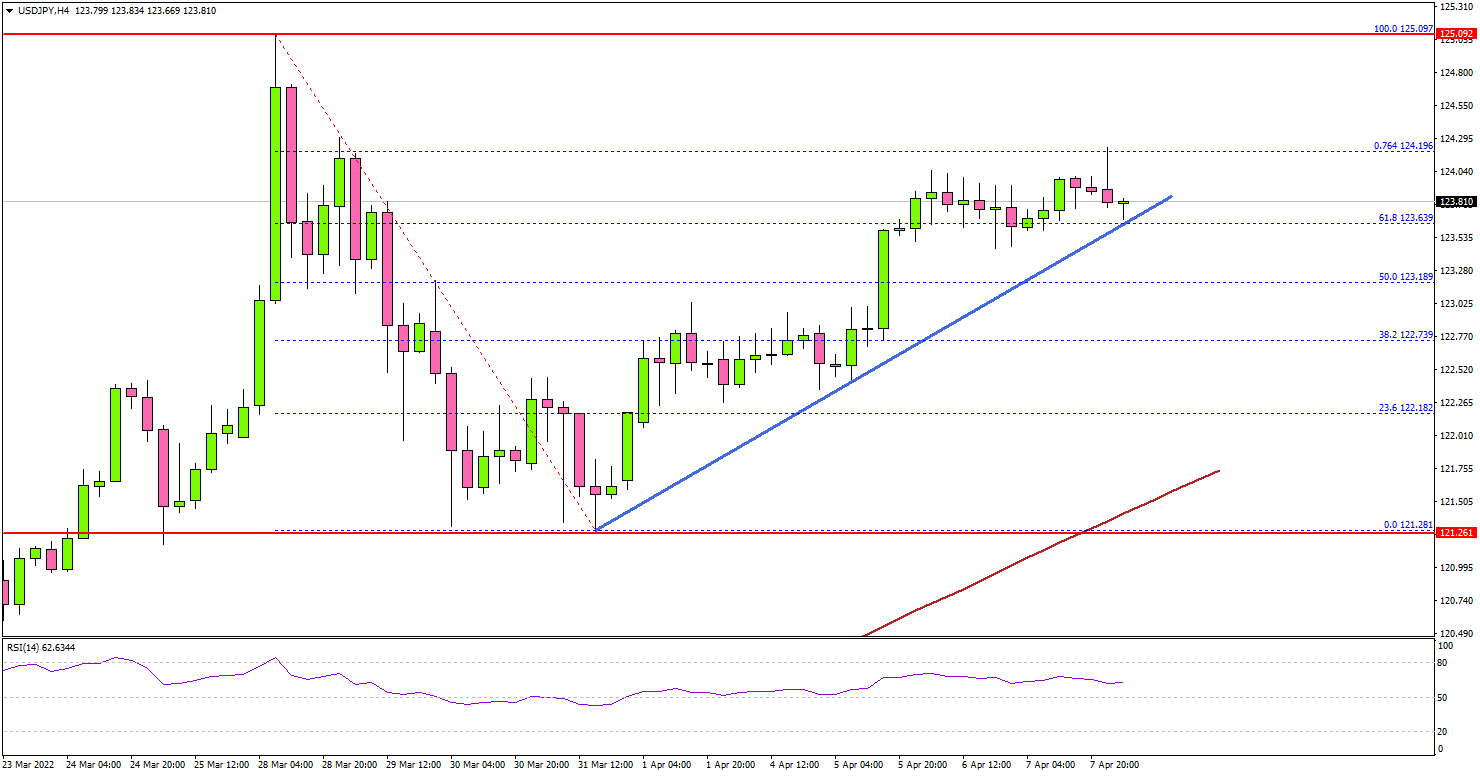
Looking at the 4-hours chart, the pair cleared the 122.50 resistance zone, the 200 simple moving average (green, 4-hours), and the 100 simple moving average (red, 4-hours).
There was a clear move above the 50% Fib retracement level of the key decline from the 125.09 swing high to 121.28 low. The pair even settled above the 123.50 level. There is also a key bullish trend line forming with support near 123.75 on the same chart.
If there is a close above the 76.4% Fib retracement level of the key decline from the 125.09 swing high to 121.28 low, the pair could accelerate higher.
The next major resistance is near the 125.00 level. Any more gains might send the pair towards the 126.20 level in the coming sessions.
On the downside, an immediate support is near the 123.75 level. The next major support is near the 122.80 level. A downside break below the 122.80 support level might resend the pair towards the 121.50 level.
Fundamentally, the US Initial Jobless Claims for the week ending April 02, 2022 was released yesterday by the US Department of Labor. The market was looking for a decline from 202K to 200K.
The actual result was better than the forecast, as the US Initial Jobless Claims saw a drop to 166K. Besides, the last reading was revised down to 171K.
The report added:
The previous week's rate was revised up by 0.2 from 0.9 to 1.1 percent. The advance number for seasonally adjusted insured unemployment during the week ending March 26 was 1,523,000, an increase of 17,000 from the previous week's revised level.
Looking at EUR/USD, the pair found support near the 1.0880 zone, but it might struggle to recover above 1.0950. Similarly, GBP/USD might face resistance near 1.3150 and 1.3200.
Economic Releases
- Canada’s employment Change for March 2022 – Forecast 80K, versus 336.6K previous.
- Canada’s Unemployment Rate for March 2022 - Forecast 5.4%, versus 5.5% previous.
Elliott Wave View: Nasdaq Resumes Lower
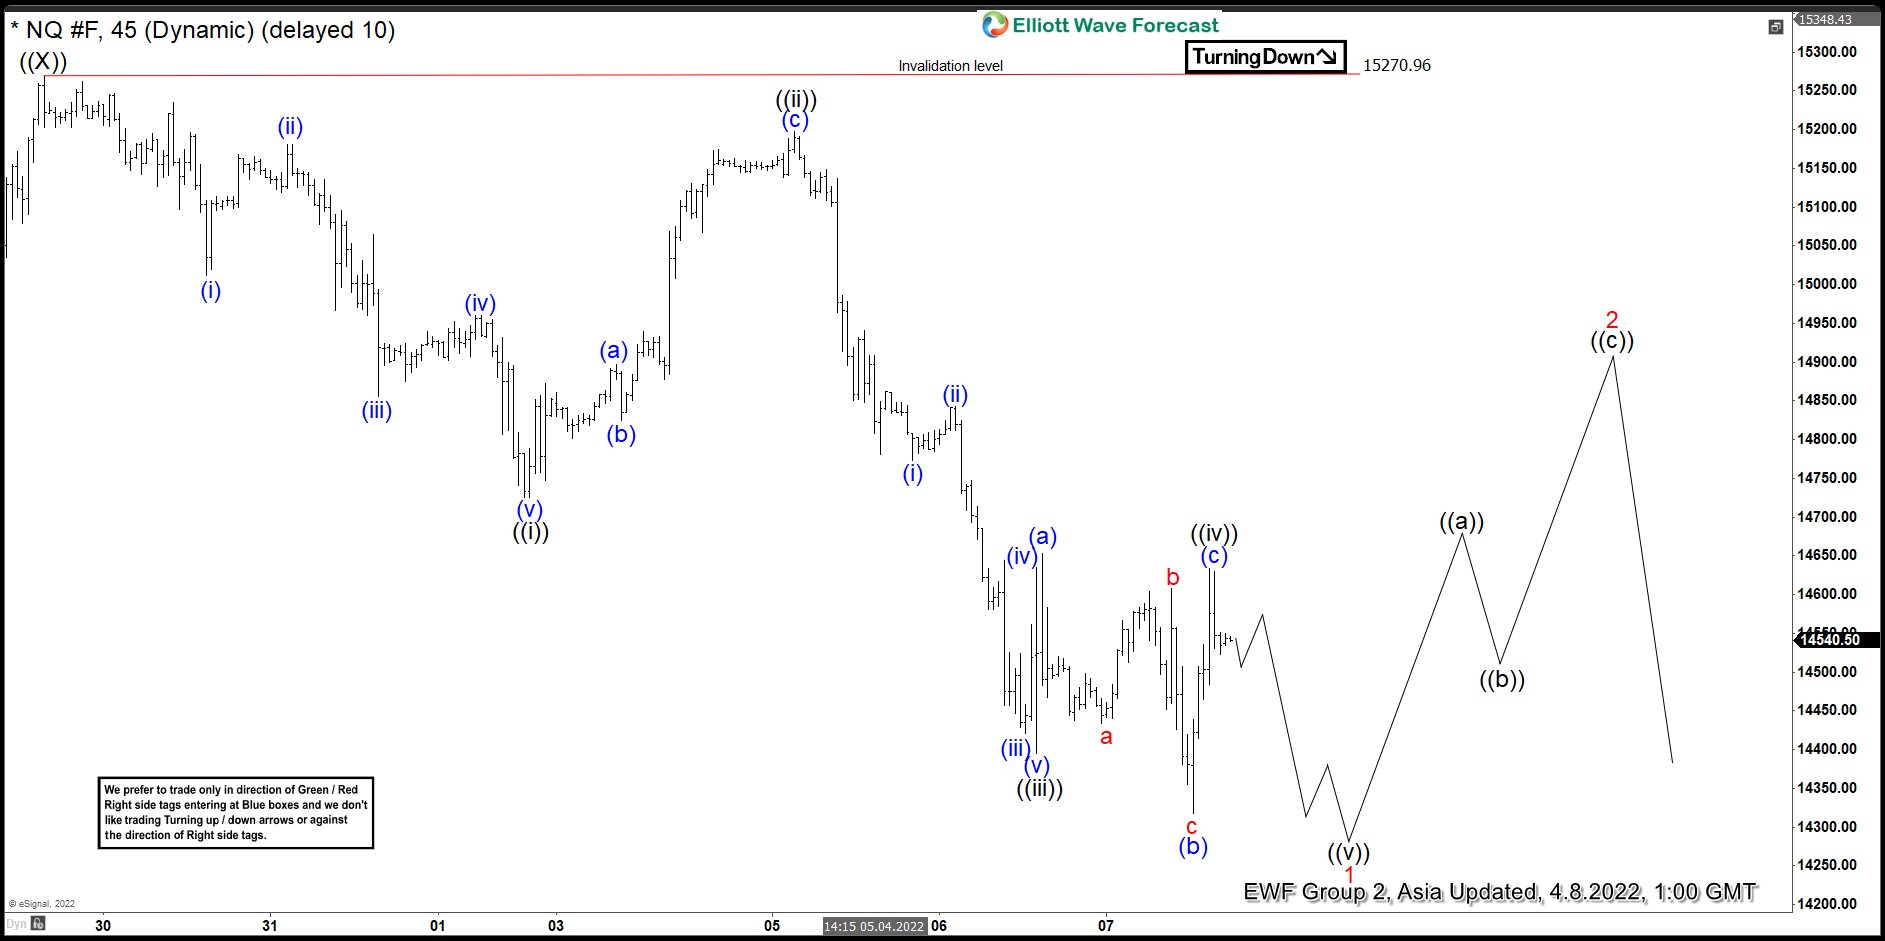
Short term outlook in Nasdaq (NQ) suggests the rally to 15270.96 ended wave ((X)). The Index has resumed lower in wave ((Y)), although it still needs to break below the last low on March 15 at 12942.50 to validate the view. The decline from wave ((X)) however looks impulsive suggesting further downside is likely, at least in the near term. Down from wave ((X)), wave (i) ended at 15012.55 and rally in wave (ii) ended at 15180.75. Index then resumes lower in wave (iii) to 14855.50, wave (iv) ended at 14960, and final wave (v) lower ended at 14725 which completed wave ((i)).
Index then corrected in wave ((ii)) towards 15198 before turning lower again. Down from wave ((ii)), wave (i) ended at 14773.50 and wave (ii) ended at 14843. Index then continues lower in wave (iii) to 14420.5, wave (iv) ended at 14634.25, and wave (v) ended at 14394.75 which completed wave ((iii)). Wave ((iv)) correction took the form of an expanded flat where wave (a) ended at 14652.75, wave (b) ended at 14317 and wave (c) ended at 14633.75. Near term, expect the Index to extend lower in wave ((v)) which should complete wave 1 in higher degree. Index should then rally in wave 2 to correct the decline from wave ((X)) before it resumes lower. Near term, as far as pivot at 15270.96 high stays intact, expect rally to fail in the sequence of 3, 7, or 11 swing for more downside.
NQ 45 Minutes Elliott Wave Chart
Eco Data 4/8/22
[php_everywhere instance="1"]
French Election: What Does it Mean for the Euro?
The first round of the French presidential election will be held on April 10, ahead of the runoff two weeks later. Opinion polls have narrowed significantly in recent weeks and a victory for President Macron doesn’t look so certain anymore. For the euro, this election seems like an asymmetric downside risk.
The rules
Presidential elections in France consist of two stages. In the first round, candidates from all parties can participate. If one candidate manages to secure more than 50% of the vote, they instantly win. Otherwise, there is a second round between the two most popular candidates.
Nobody has ever won from the first round. That’s unlikely to change this time, since the field is very crowded with twelve candidates running. The frontrunners in opinion polls are the current president, Emmanuel Macron, and the opponent he defeated in the last election, the far-right Marine Le Pen.
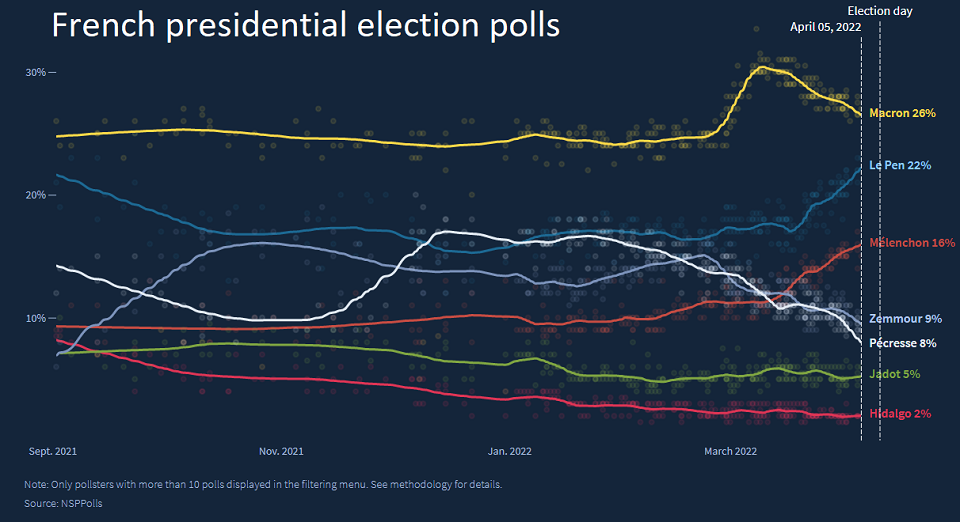
In third place comes the leftist Jean-Luc Melénchon, followed by the ultra-nationalist TV pandit Eric Zemmour and the conservative Valérie Pécresse who are virtually tied in fourth and fifth place.
2017 repeat?
Therefore, it seems like Macron will be squaring off against Le Pen once again in the second round, only his polling lead is much smaller now. Back in the 2017 election, Macron won the final round in a landslide with 66% of the vote against Le Pen’s 34%.
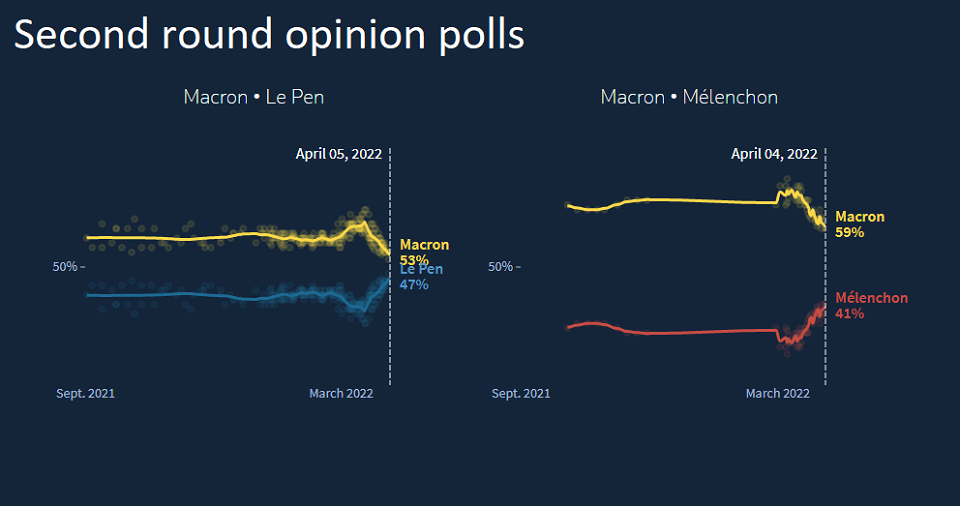
This time, polls show Macron at 53% and Le Pen at 47% - a much tighter race. That is almost within the margin of error, so surprises are entirely possible. Macron enjoyed a boost in popularity recently thanks to his diplomatic efforts to prevent the war in Ukraine, but that spell has started to fade as the war drags on and the cost of living increases.
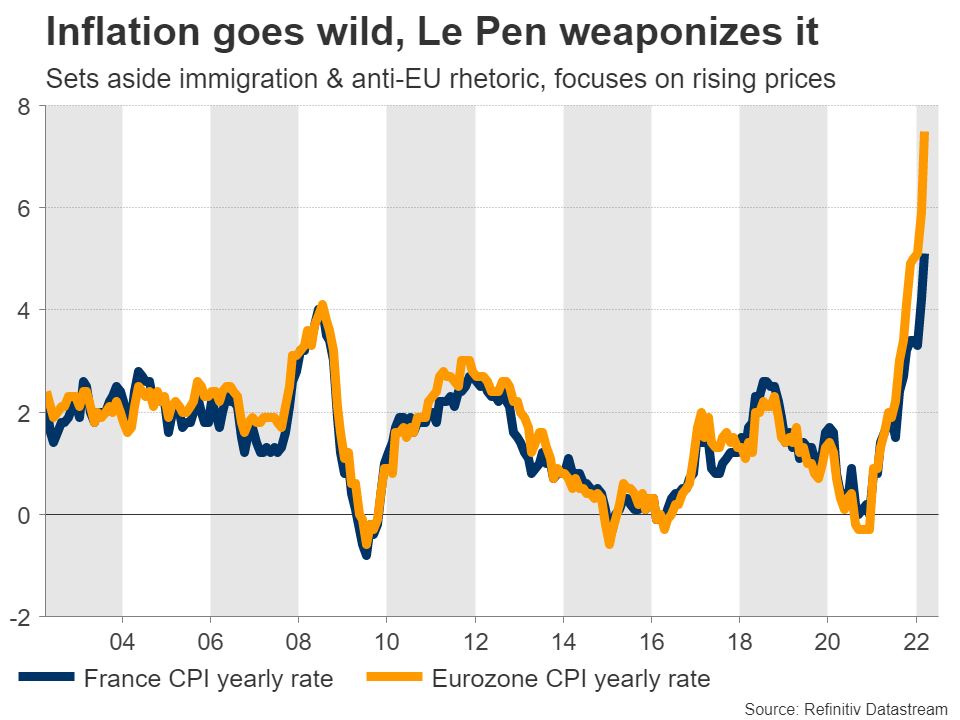
Le Pen has taken advantage of this situation. She has rebranded herself, focusing on economic problems such as rising prices rather than the immigration and anti-EU rhetoric she campaigned on previously. The new strategy is working - she has risen dramatically in polling surveys and she has a much better chance of getting elected than 2017.
Eurozone implications
The main difference with 2017 is that an exit from the European Union or the euro is no longer on the agenda. That said, this race could still have massive implications for Europe.
Macron has spearheaded the push towards greater economic integration. He pushed for the creation of common debt instruments in the height of the pandemic to finance the Recovery Package and has routinely criticized the Eurozone’s strict fiscal rules.
He essentially tried to fix the two main problems with Europe’s economic architecture - the absence of Eurobonds and the rules that prevent governments from running large deficits, which ultimately enforce austerity on indebted nations.
Hence, Macron is clearly the most growth-friendly candidate. If he loses this election, there would essentially be a European leadership vacuum and the drive to reform could fade, keeping the economy stuck in slow gear. That would be bad news for the euro.
Think of it this way - back in 2017, euro traders worried about Le Pen getting elected because she wanted to exit the EU. This time, the question for markets is not whether Le Pen will be defeated, but rather whether Macron can stay in power.
Market nerves
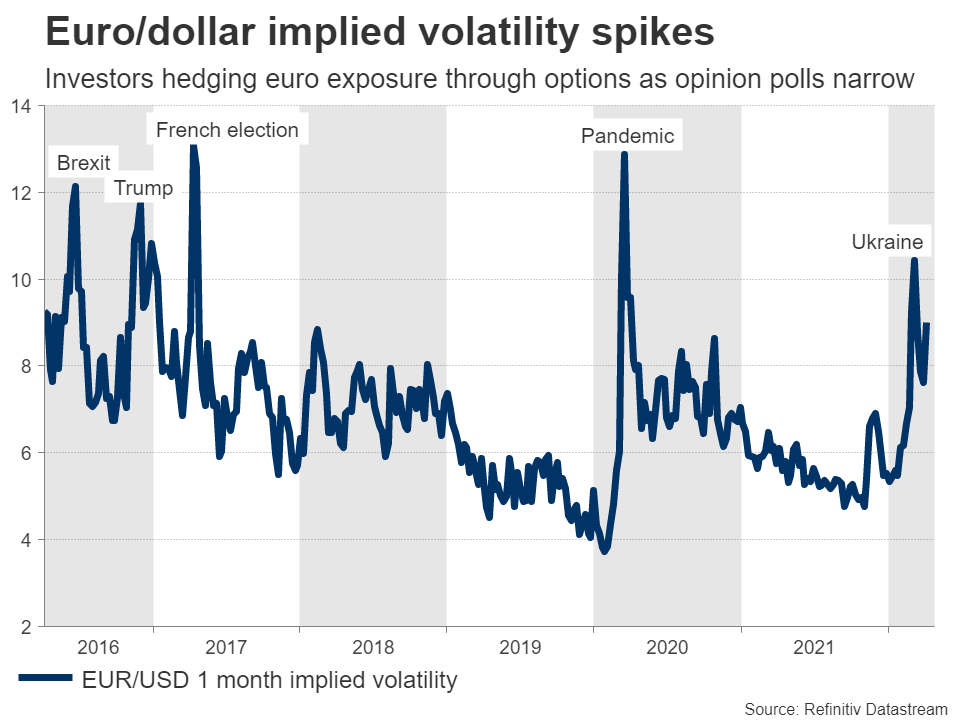
In the markets, the cost of hedging the euro has spiked lately as opinion polls continue to tighten. Implied volatility in euro/dollar options for the next one month has risen to 9%, reflecting growing demand for protection against sharp moves in FX markets.
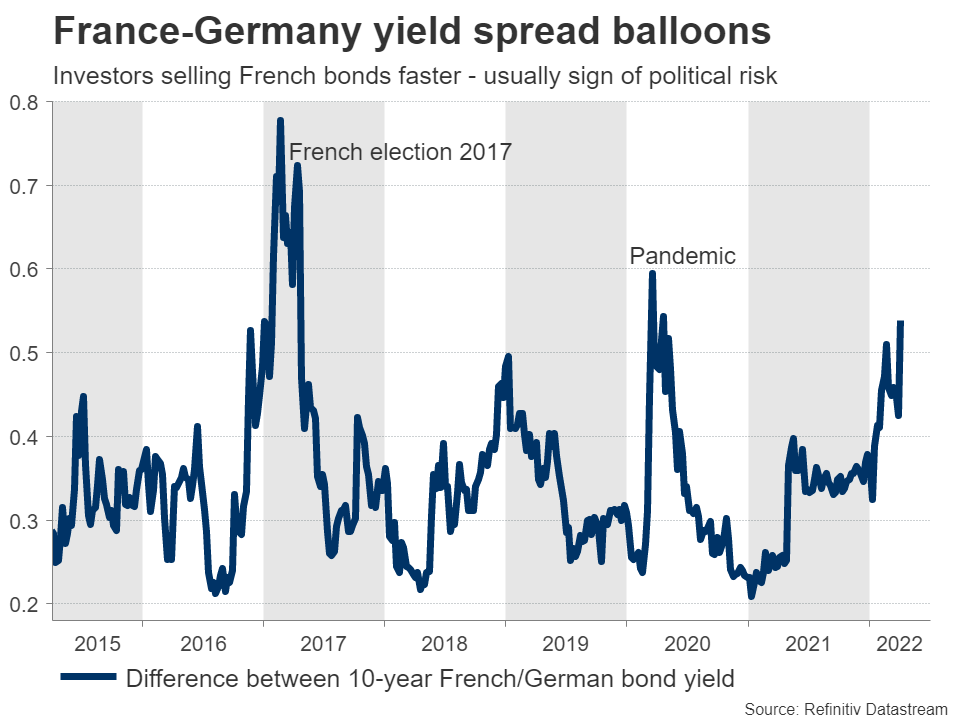
The bond market tells a similar story. The difference between French and German 10-year borrowing costs has ballooned, which means investors are dumping French bonds faster than German ones as the political risk gets baked into the cake.
In the FX arena, the euro has tanked but it is difficult to blame election nerves for that. Between the ongoing war, escalating sanctions, surging energy prices, and the darkening economic outlook for the Eurozone economy, euro traders had a lot to digest.
Trading playbook
All told, this event presents an asymmetric risk for the euro. A victory for President Macron is already the market’s baseline scenario, so if he really wins, the single currency is unlikely to receive a huge boost. It’s already the most probable outcome.
On the flipside, a victory for Le Pen could come as a shock, injecting a new air of uncertainty into European politics and generating a much greater negative FX impact. Investors have been hedging against this outcome but implied volatility in the euro is lower than it was back in 2017, while Le Pen’s chances are probably better now.
Of course the stakes are not so high this time, since she isn’t threatening to exit the euro. Still, if she does win, the drive to integrate the Eurozone economically would slow or even disappear, which is negative for the bloc’s longer-term prospects.
The first round will be telling. If traders sense that Le Pen has enough momentum to close the gap on Macron in the second round, a political risk premium could be priced back into the euro, keeping it under pressure heading into the second round.
Buckle up, it could be a wild ride.