Sample Category Title
RBA stands pat, drop the patient stance
RBA keeps cash rate unchanged at 0.10% today as widely expected. The central bank dropped the line that "the Board is prepared to be patient as it monitors how the various factors affecting inflation in Australia evolve." It's seen as a sign that RBA is preparing the markets for an earlier rate hike.
In the forward guidance, RBA said "the Board has wanted to see actual evidence that inflation is sustainably within the 2 to 3 per cent target range before it increases interest rates.". While inflation has picked up and further increase is expected, "growth in labour costs has been below rates that are likely to be consistent with inflation being sustainably at target."
RBA concluded, "over coming months, important additional evidence will be available to the Board on both inflation and the evolution of labour costs. The Board will assess this and other incoming information as its sets policy to support full employment in Australia and inflation outcomes consistent with the target."
BoJ Kuroda: Recent Yen moves somewhat rapid
BoJ Governor Haruhiko Kuroda told the parliament today that recent moves in Yen exchange way have been "somewhat rapid". He added, "it's extremely important for currency rates to move stably reflecting economic and financial fundamentals."
"We will patiently maintain powerful monetary easing to support an economy still in the midst of recovering from the COVID-19 pandemic's impact," he reiterated.
"If long-term interest rates rise rapidly, we are ready to deploy such market operations," Kuroda said, referring to the intervention to cap 10-year JGB yield at 0.25%.
(RBA) Statement by Philip Lowe, Governor: Monetary Policy Decision
At its meeting today, the Board decided to maintain the cash rate target at 10 basis points and the interest rate on Exchange Settlement balances at zero per cent.
Inflation has increased sharply in many parts of the world. Ongoing supply-side problems, Russia's invasion of Ukraine and strong demand as economies recover from the pandemic are all contributing to the upward pressure on prices. In response, bond yields have risen and expectations of future policy interest rates have increased.
The Australian economy remains resilient and spending is picking up following the Omicron setback. Household and business balance sheets are in generally good shape, an upswing in business investment is underway and there is a large pipeline of construction work to be completed. Macroeconomic policy settings also remain supportive of growth and national income is being boosted by higher commodity prices. At the same time, rising prices are putting pressure on household budgets and the floods are causing hardship for many communities.
The strength of the Australian economy is evident in the labour market, with the unemployment rate falling further to 4 per cent in February. Underemployment is also at its lowest level in many years. Job vacancies and job ads are at high levels and point to continuing strong growth in employment over the months ahead. The RBA's central forecast is for the unemployment rate to fall to below 4 per cent this year and to remain below 4 per cent next year.
Wages growth has picked up, but, at the aggregate level, is only around the relatively low rates prevailing before the pandemic. There are, however, some areas where larger wage increases are occurring. Given the tightness of the labour market, a further pick-up in aggregate wages growth and broader measures of labour costs is in prospect. This pick-up is still expected to be only gradual, although there is uncertainty about the behaviour of labour costs at historically low levels of unemployment.
Inflation has increased in Australia, but it remains lower than in many other countries; in underlying terms, inflation is 2.6 per cent and in headline terms it is 3.5 per cent. Higher prices for petrol and other commodities will result in a further lift in inflation over coming quarters, with an updated set of forecasts to be published in May. The main sources of uncertainty relate to the speed of resolution of the various supply-side issues, developments in global energy markets and the evolution of overall labour costs.
Financial conditions in Australia continue to be highly accommodative. Interest rates remain at a very low level, although fixed mortgage rates for new loans have risen recently. The Australian dollar exchange rate has appreciated due to the higher commodity prices and, in TWI terms, is around the level of a year ago. Housing prices have risen strongly over the past year, although some housing markets have eased recently. With interest rates at historically low levels, it is important that lending standards are maintained and that borrowers have adequate buffers.
The Board's policies during the pandemic have supported progress towards the objectives of full employment and inflation consistent with the target. The Board has wanted to see actual evidence that inflation is sustainably within the 2 to 3 per cent target range before it increases interest rates. Inflation has picked up and a further increase is expected, but growth in labour costs has been below rates that are likely to be consistent with inflation being sustainably at target. Over coming months, important additional evidence will be available to the Board on both inflation and the evolution of labour costs. The Board will assess this and other incoming information as its sets policy to support full employment in Australia and inflation outcomes consistent with the target.
Technical Outlook and Review
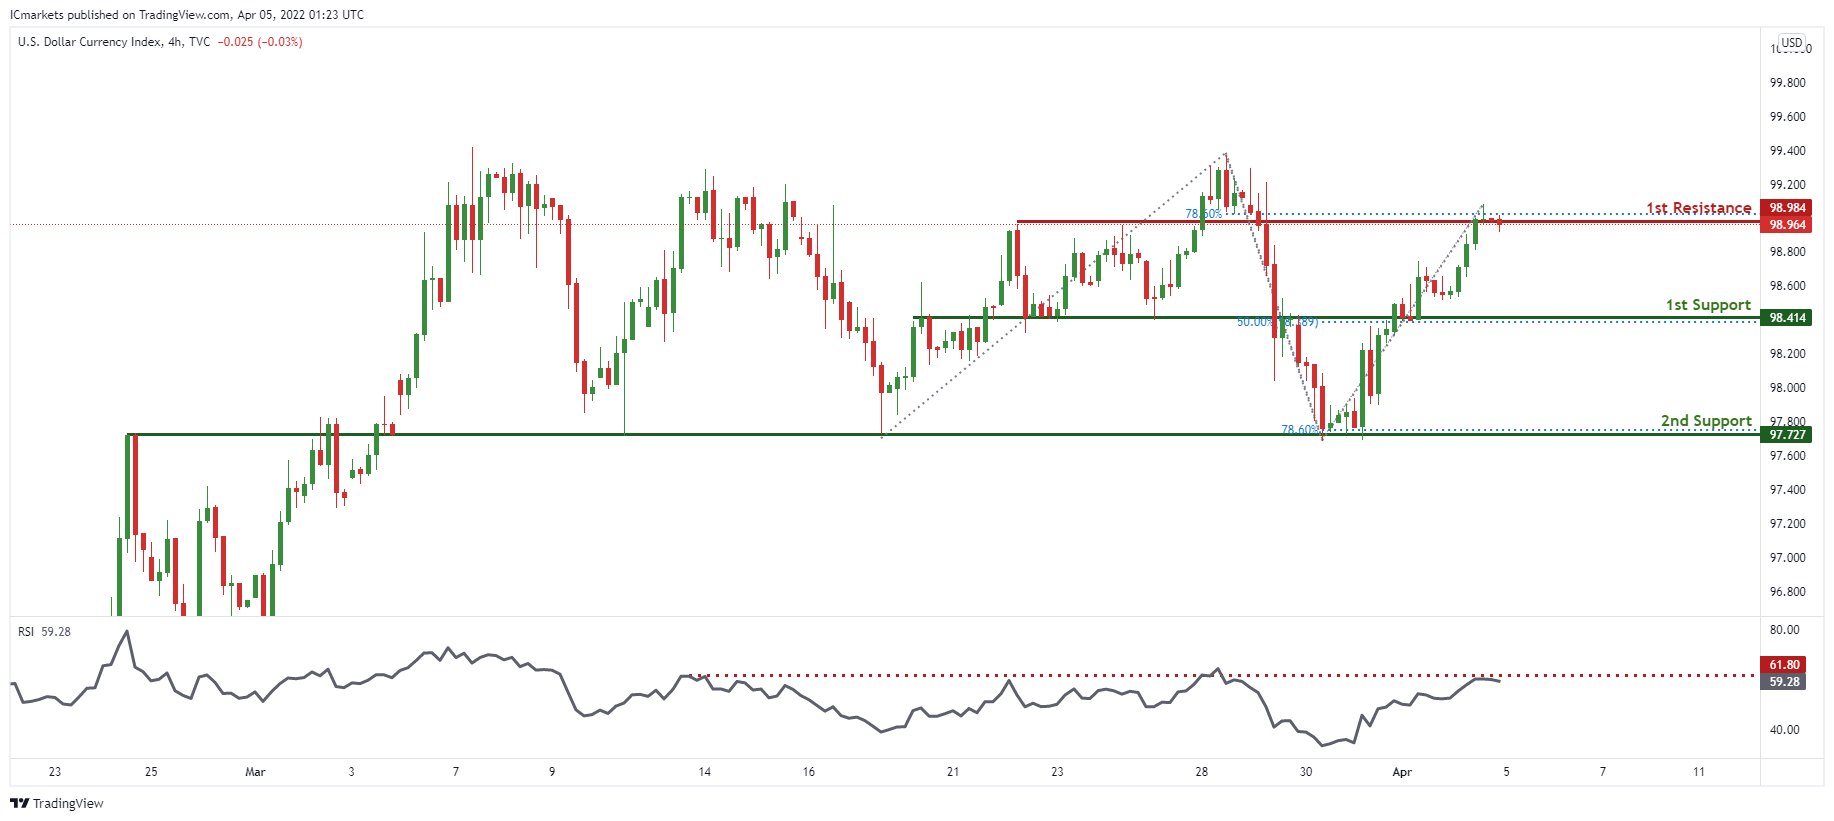
DXY:
On the H1 timeframe, prices are approaching a pivot. We see the potential for a dip from our 1st resistance at 98.4931 in line with 50% Fibonacci Retracement towards our 1st support at 97.7490 in line with 61.8% Fibonacci Projection. Prices are trading below our ichimoku clouds, further supporting our bearish bias.
Areas of consideration:
- H4 time frame, 1st resistance at 98.4931
- H4 time frame, 1st support at 97.749
XAU/USD (GOLD):
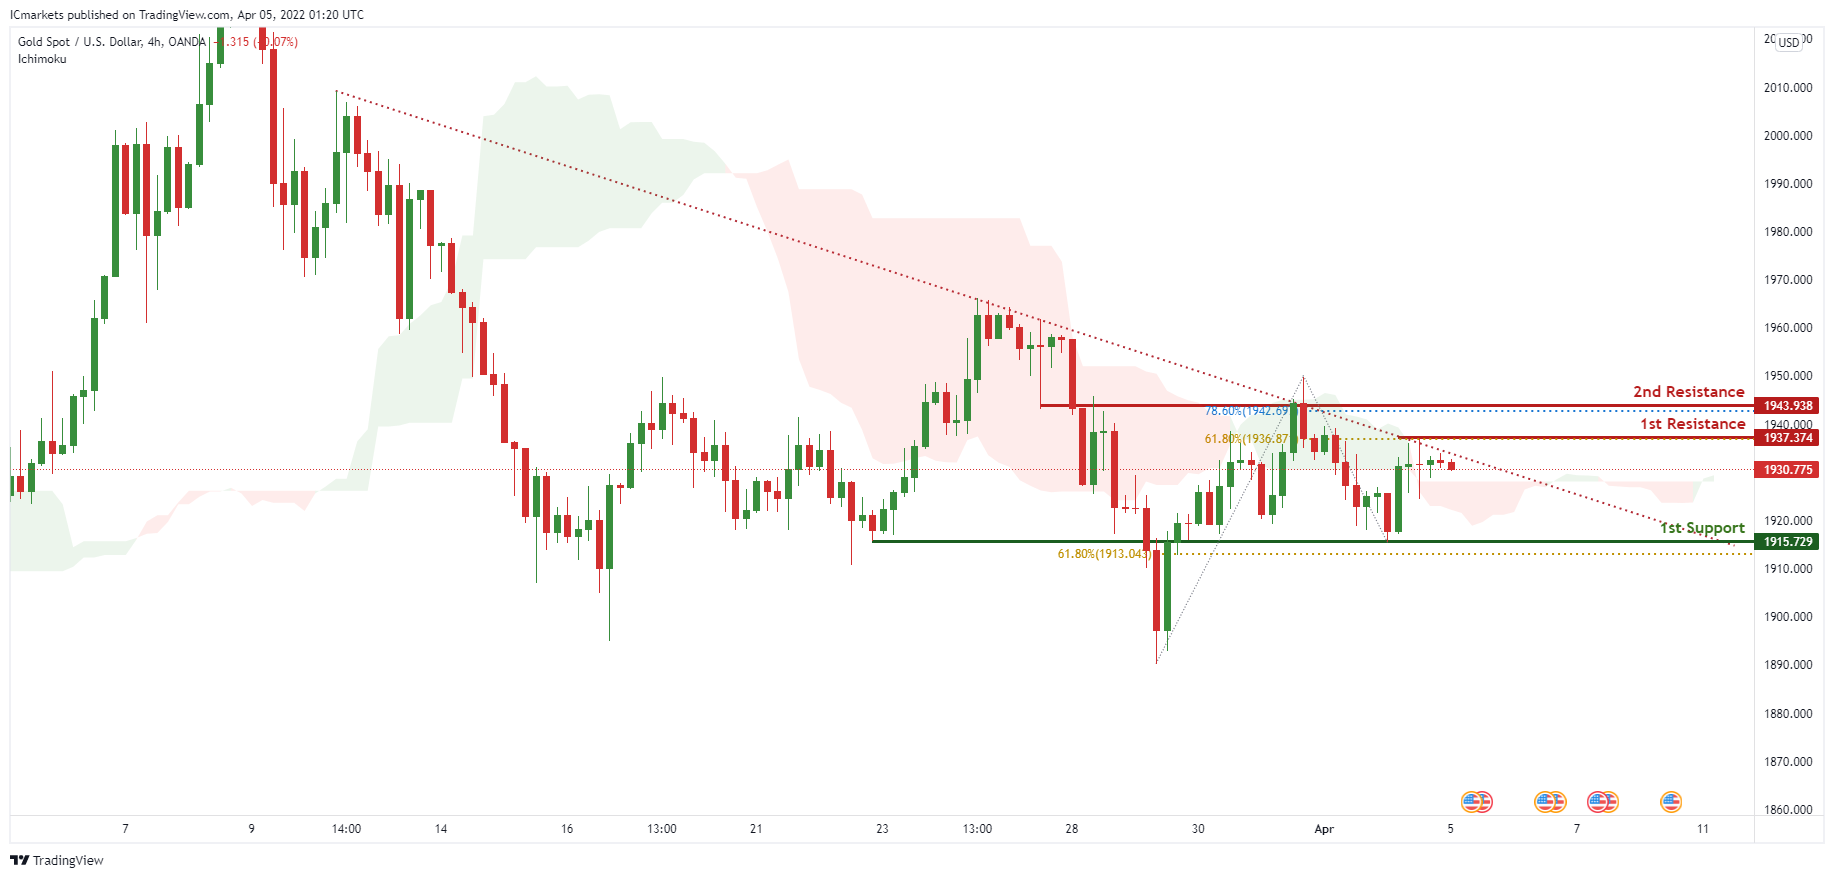
On the H1, prices are abiding by our support. We see the potential for further bullish continuation from our 1st support at 1918.010 which is in line with 50% Fibonacci retracement towards our 1st resistance at 1938.927 in line which is a graphical overlap.
Areas of consideration:
- 4h 1st support at 1918.01
- 4h 1st resistance at 1938.927
GBP/USD:
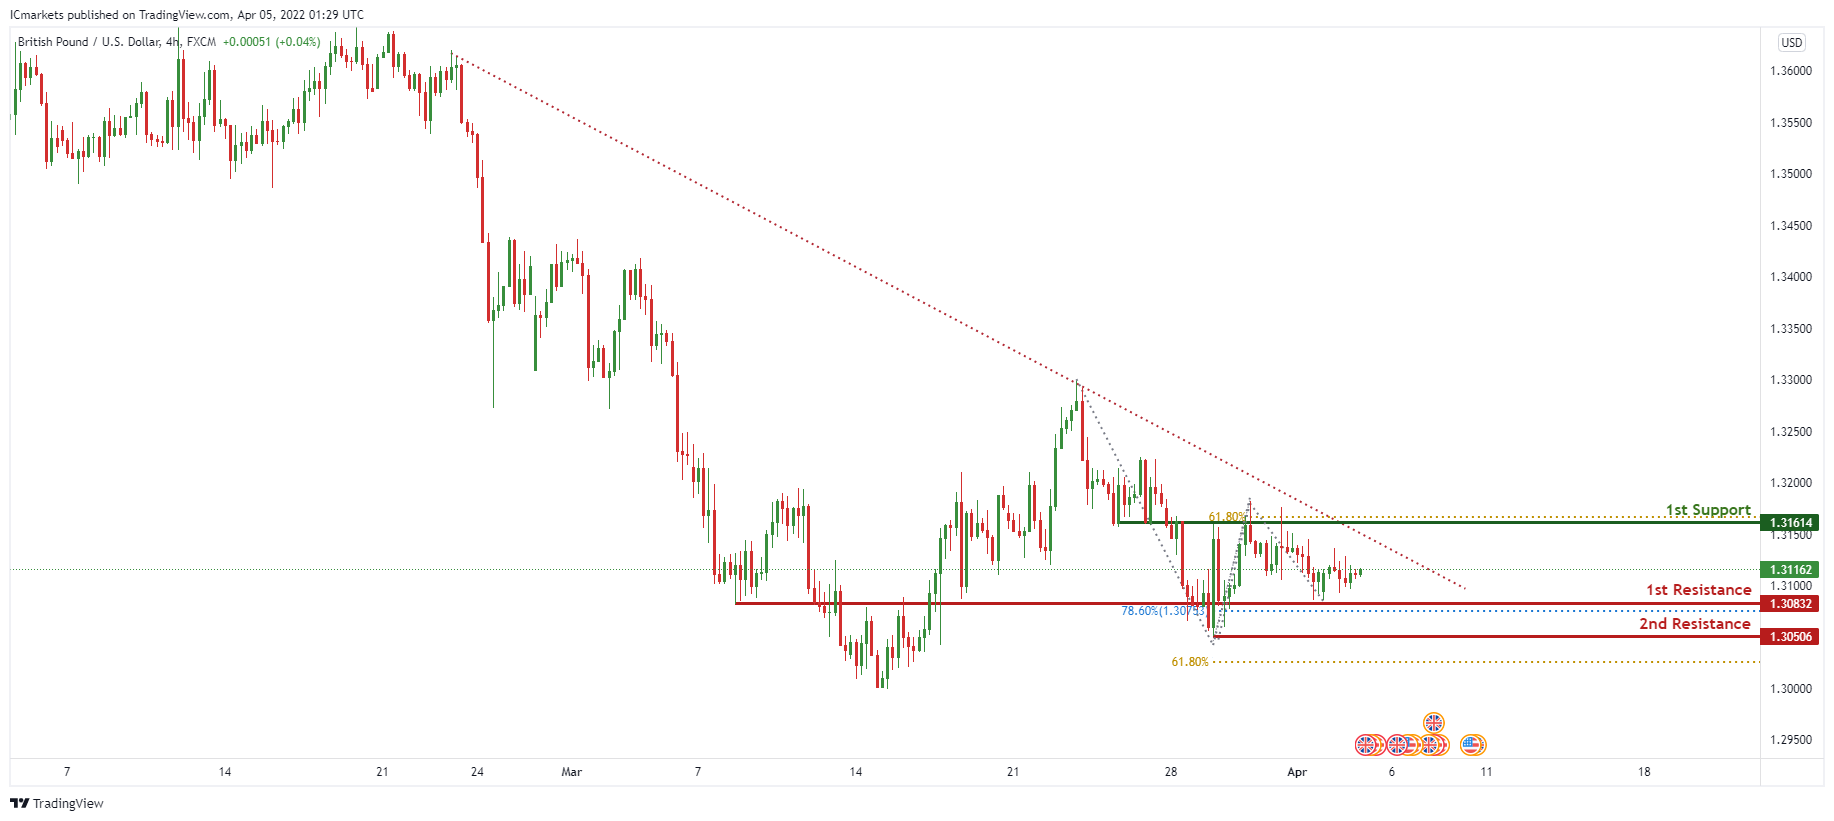
On the H4, prices are abiding by a descending trendline resistance. We see the potential for a dip from our 1st resistance 1.31614 in line with 61.8% Fibonacci retracement towards our 1st support at 1.30832 in line with 78.6% Fibonacci retracement. Alternatively, breaking descending trendline will find prices climbing towards our 2nd resistance at 1.32081 in line with 100% FIbonacci projection. Our bearish bias is further supported by RSI being at levels where dips previously occurred.
Areas of consideration:
- H4 1st resistance at 1.31614
- H4 1st support at 1.30832
USD/CHF:
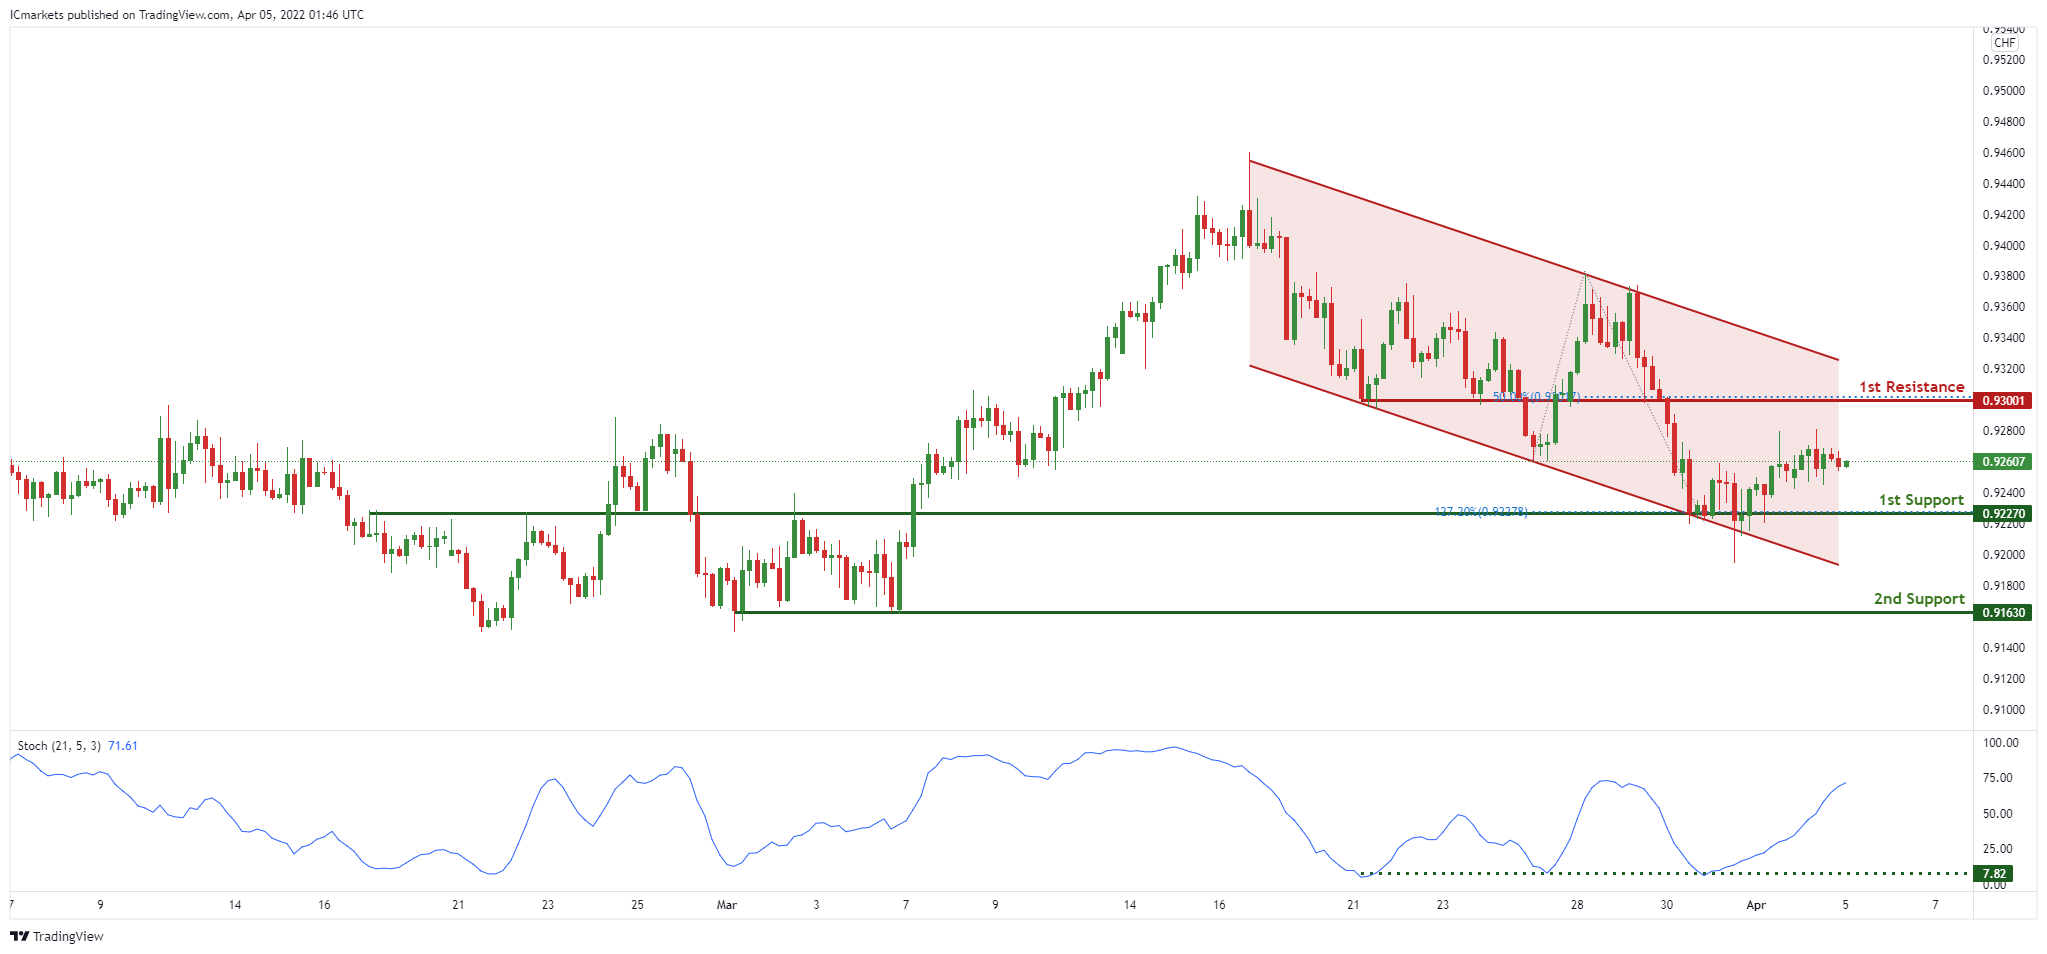
On the H4, with price expected to bounce off the support of the stochastics indicator, we have a bias that price will rise to our 1st resistance at 0.93001 in line with the 50% Fibonacci retracement from our 1st support at 0.92270 in line with the horizontal overlap support and 127.2% Fibonacci extension. Alternatively, price may break 1st support structure and head for 2nd support at 0.91630 in line with the swing low support.
Areas of consideration
- 1st support level at 0.92302
- 1st resistance level at 0.93001
EUR/USD :
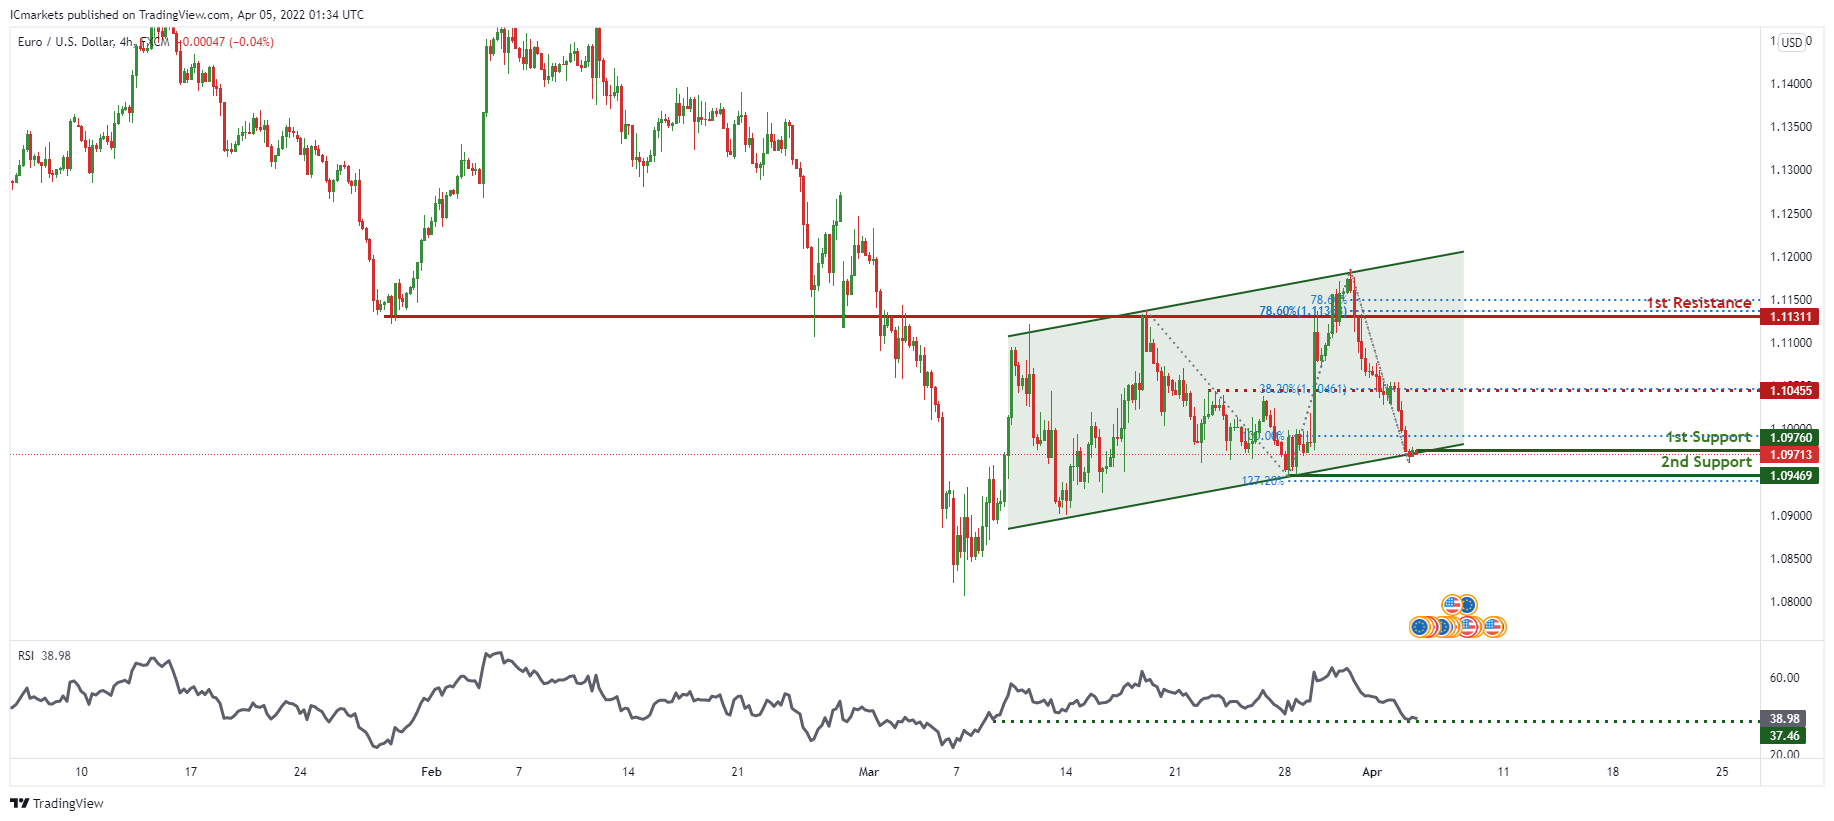
On the H4 timeframe, prices are consolidating in a parallel channel. We see the potential for a bounce from our 1st support at 1.09760 in line with 100% Fibonacci projection towards our 1st resistance at 1.11311 which is an area of Fibonacci confluences. Stochastics are at levels where bounces previously occurred, further supporting our bullish bias.
Areas of consideration :
- H4 1st resistance at 1.11311
- H4 1st support at 1.09760
USD/JPY:
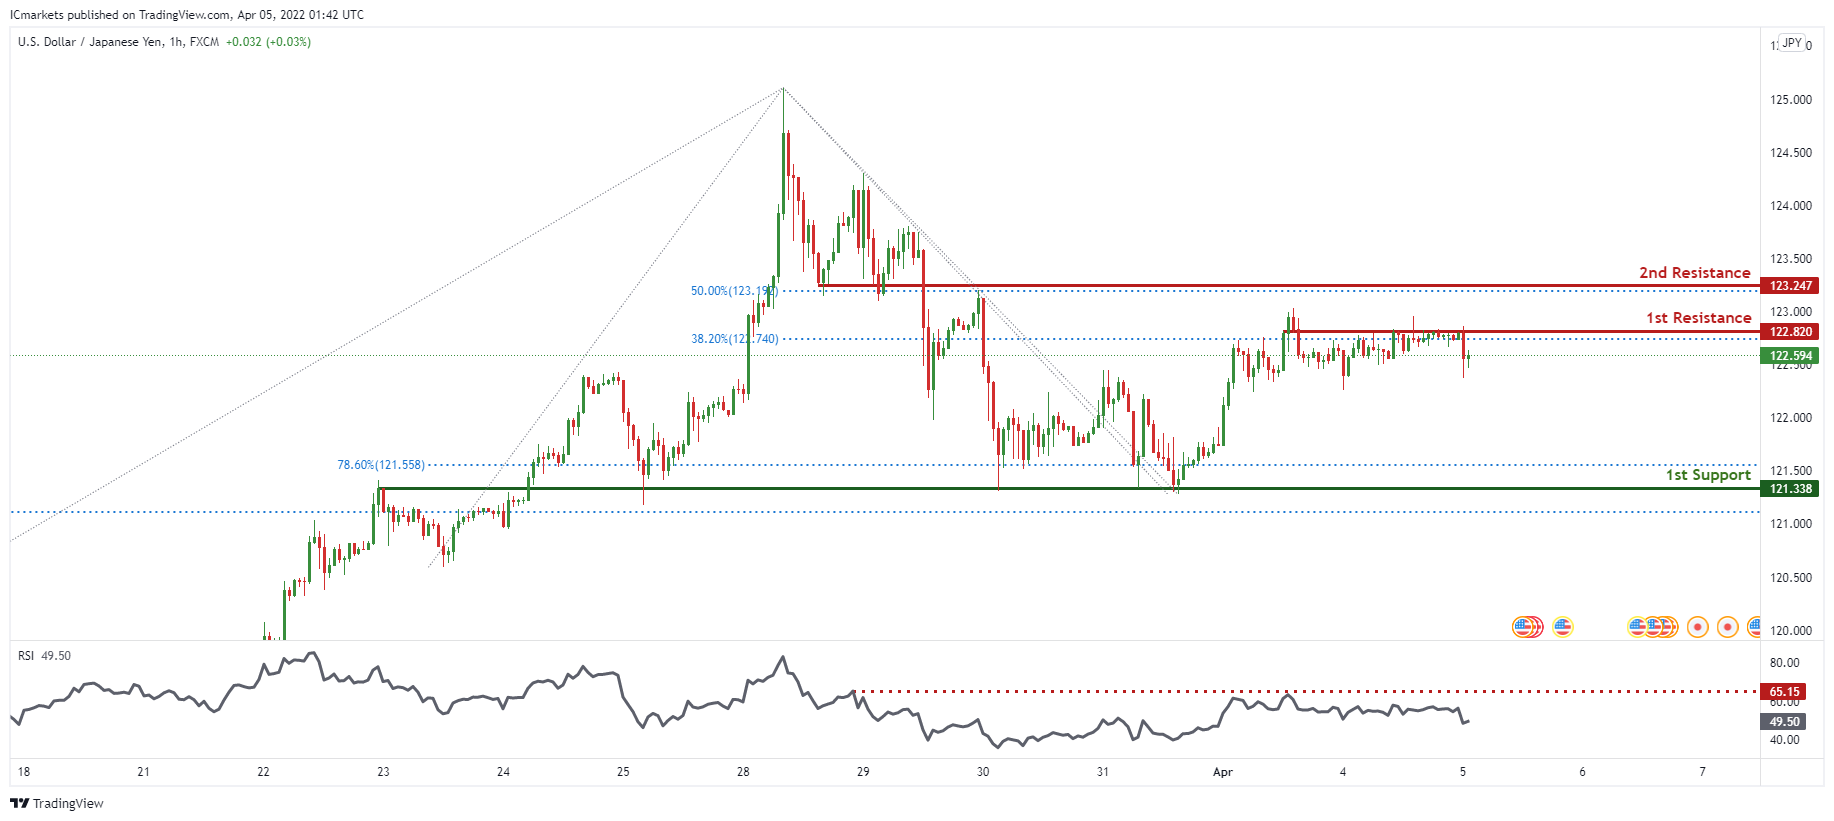
On the H4 timeframe, prices have approached a strong resistance. We see the potential for a dip from our 1st resistance at 122.820 in line with 38.2% Fibonacci retracement towards our 1st support at 121.338 which is an area of Fibonacci confluences. RSI is at a level where dips previously occurred, further supporting our bearish bias.
Areas of consideration:
- H4 time frame, 1st resistance at 122.820
- H4 time frame, 1st support at 121.338
AUD/USD:
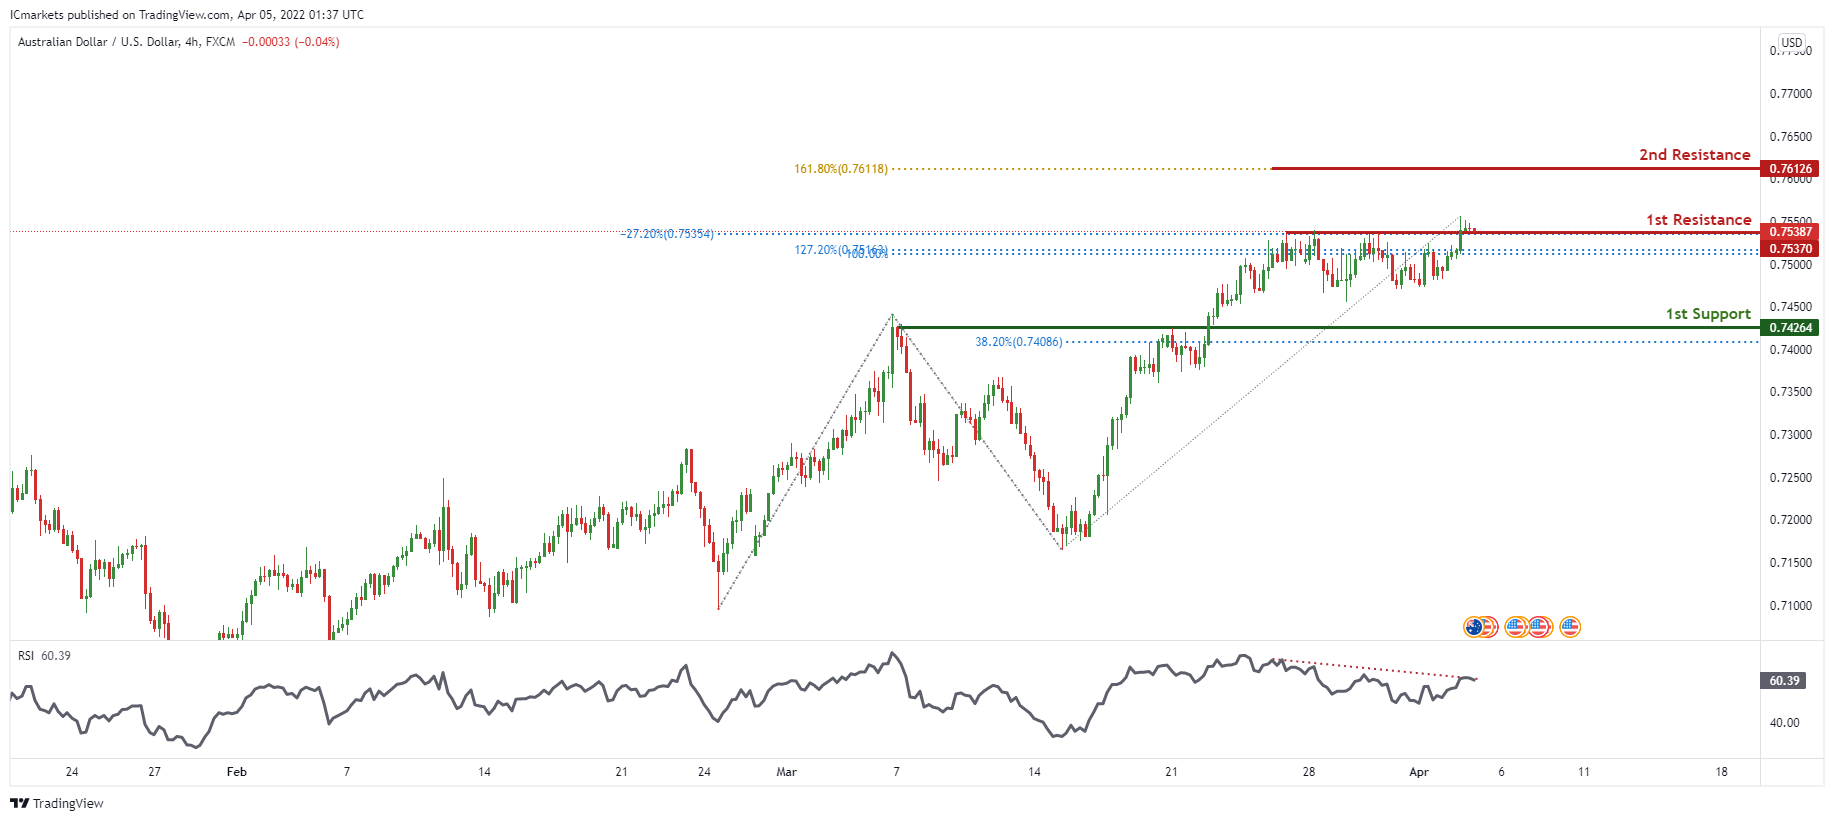
On the H4 timeframe, prices are approaching a pivot. We see the potential for a dip from our 1st resistance at 0.75370 which is an area of Fibonacci confluences towards our 1st support at 0.74264 in line with 38.2% Fibonacci retracement. Our bearish bias is supported by RSI being on bearish momentum.
Areas of consideration
- H4 1st resistance at 0.75370
- H4 1st support at 0.74264
NZD/USD:
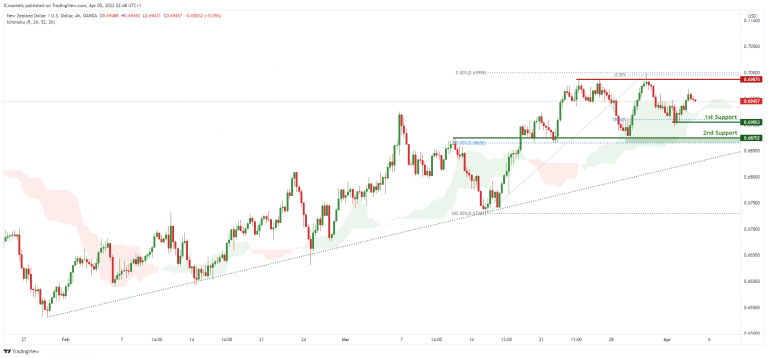
On the H4, with price expected to bounce off the support of the ichimoku cloud, we have a bias that price will rise to our 1st resistance at 0.69875 in line with the swing high resistance from our 1st support at 0.69053 in line with the horizontal overlap support, 78.6% Fibonacci projection. Alternatively, price may break 1st support structure and head for 2nd support at 0.68752 in line with the 50% Fibonacci retracement.
Areas of consideration:
- H4 time frame, 1st support at 0.69053
- H4 time frame, 1st resistance at 0.69875
USD/CAD:
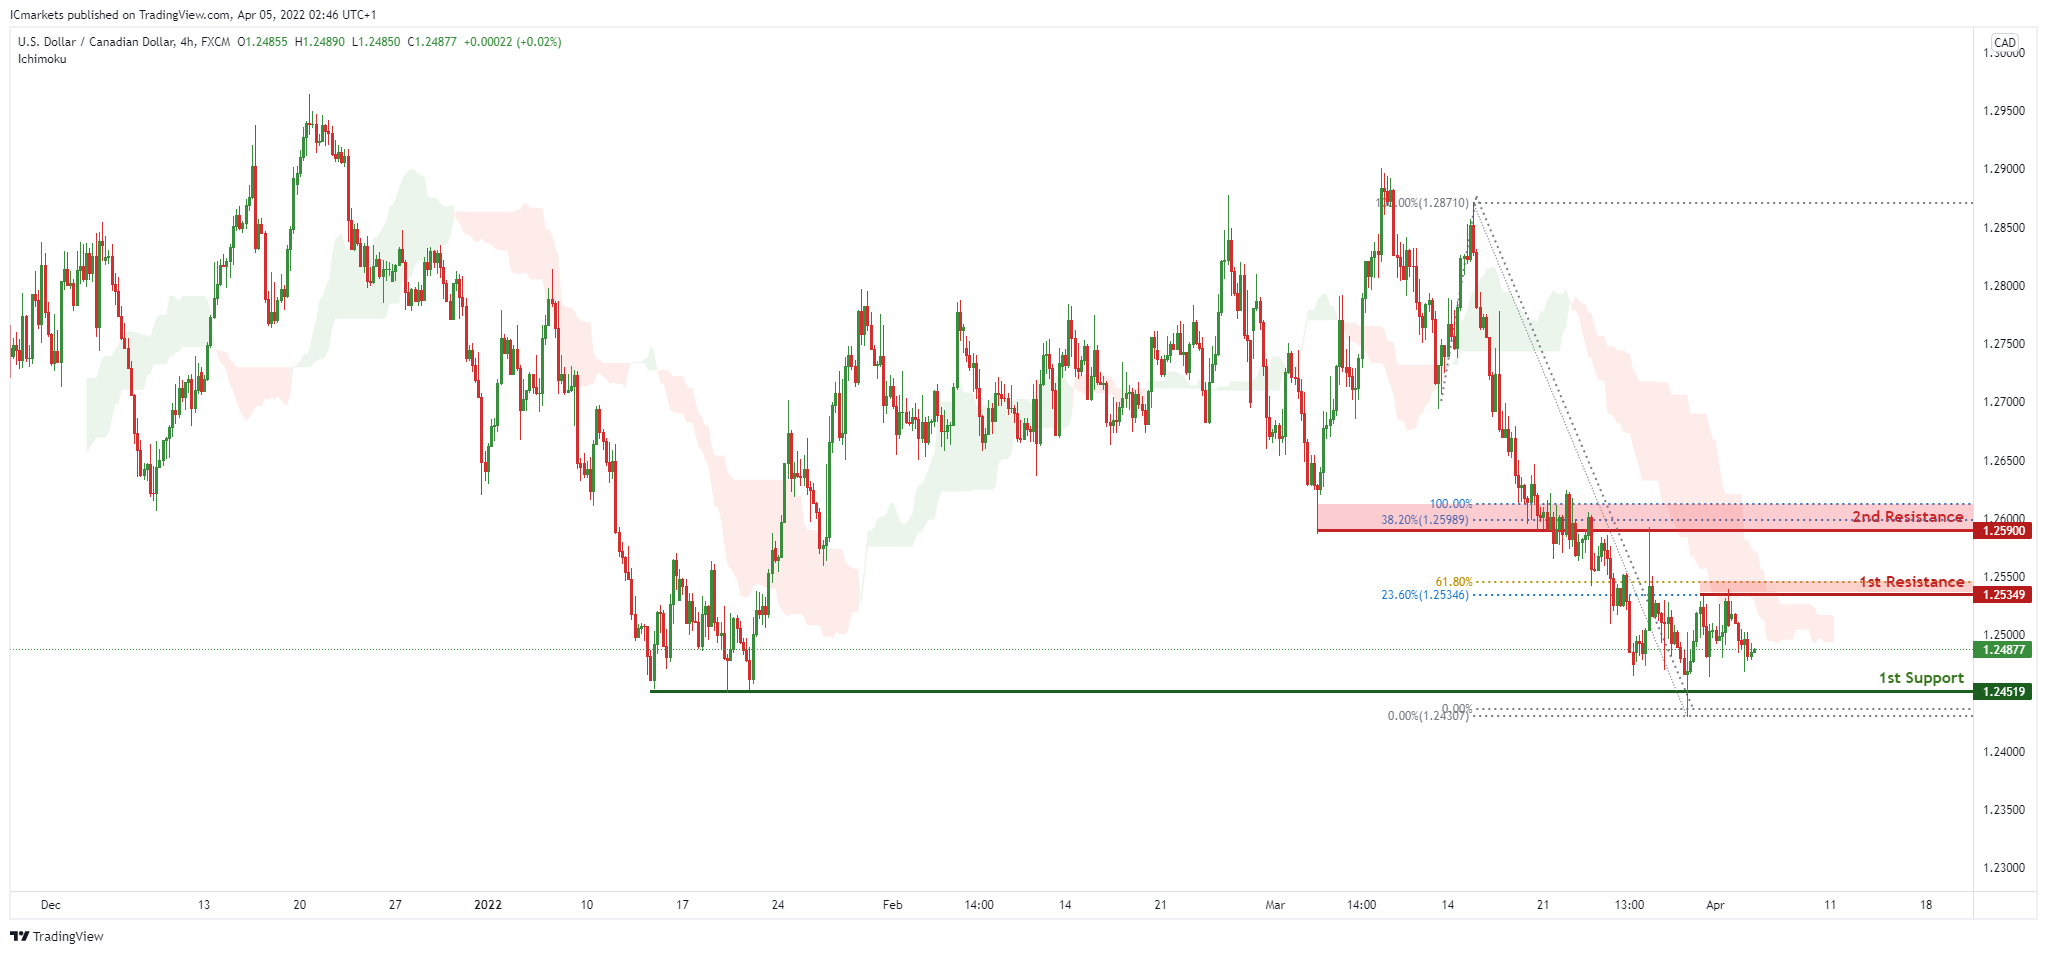
On the H4, with price moving below the ichimoku cloud, we expect to see a potential for bearish drop from our 1st resistance of 1.25349 in line with the 23.6% fibonacci retracement and 61.8% Fibonacci projection towards our 1st support level at 1.24519 in line with the swing low support. Alternatively, If price breaks out, it can potentially move towards our 2nd resistance level at 1.25900 which is in line with the 38.2% Fibonacci retracement and 100% Fibonacci projection.
Areas of consideration:
- H4 time frame, 1st support at 1.24519
- H4 time frame, 1st resistance at 1.25349
OIL:
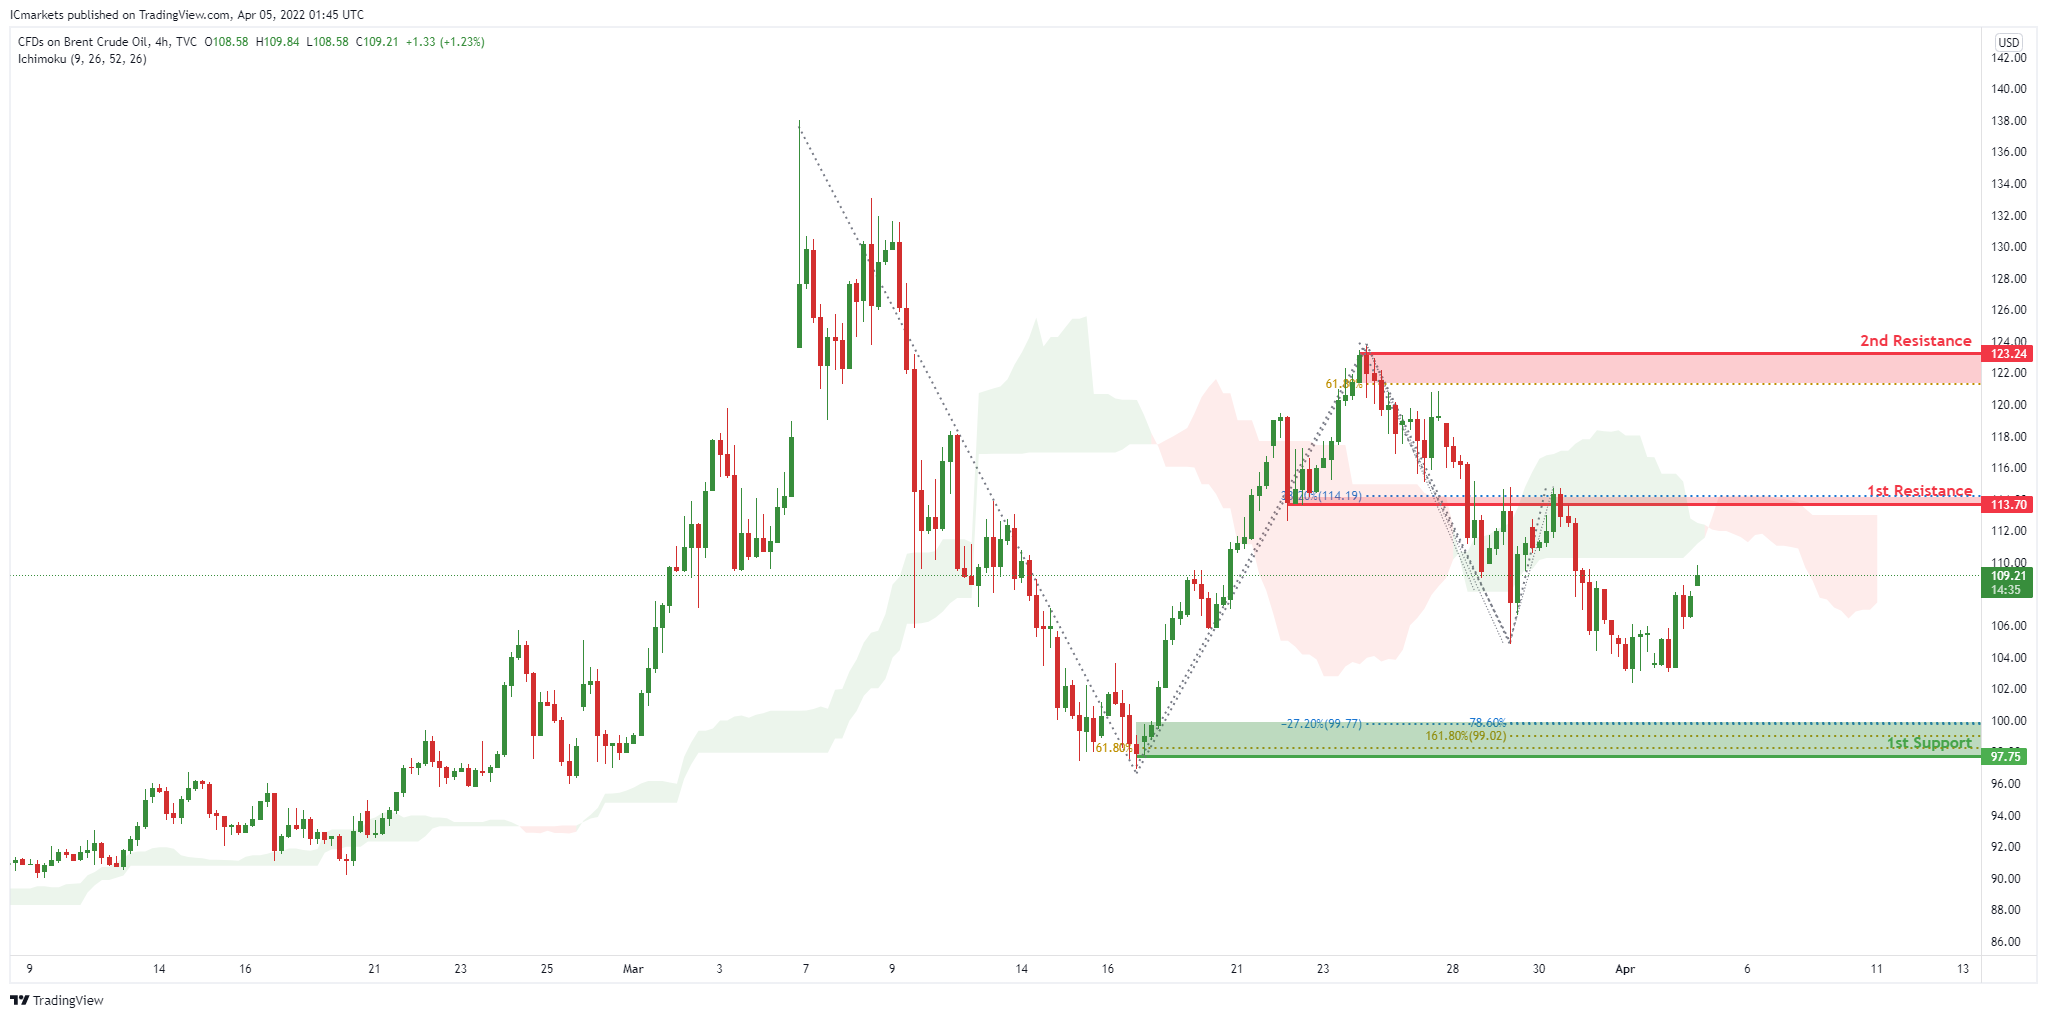
On the H4, with price moving below the ichimoku cloud, we expect to see a potential for bearish drop from our 1st resistance of 113.70 in line with the pullback resistance and 38.2% Fibonacci retracement towards our 1st support level at 97.75 in line with the 61.8% and 78.6% Fibonacci projection, 161.8% Fibonacci extension, -27.2% Fibonacci expansion. Alternatively, If price breaks out, it can potentially move towards our 2nd resistance level at 123.24 which is in line with the swing high resistance.
Areas of consideration:
- H4 time frame, 1st resistance of 113.70
- H4 time frame, 1st support of 98.14
Dow Jones Industrial Average:
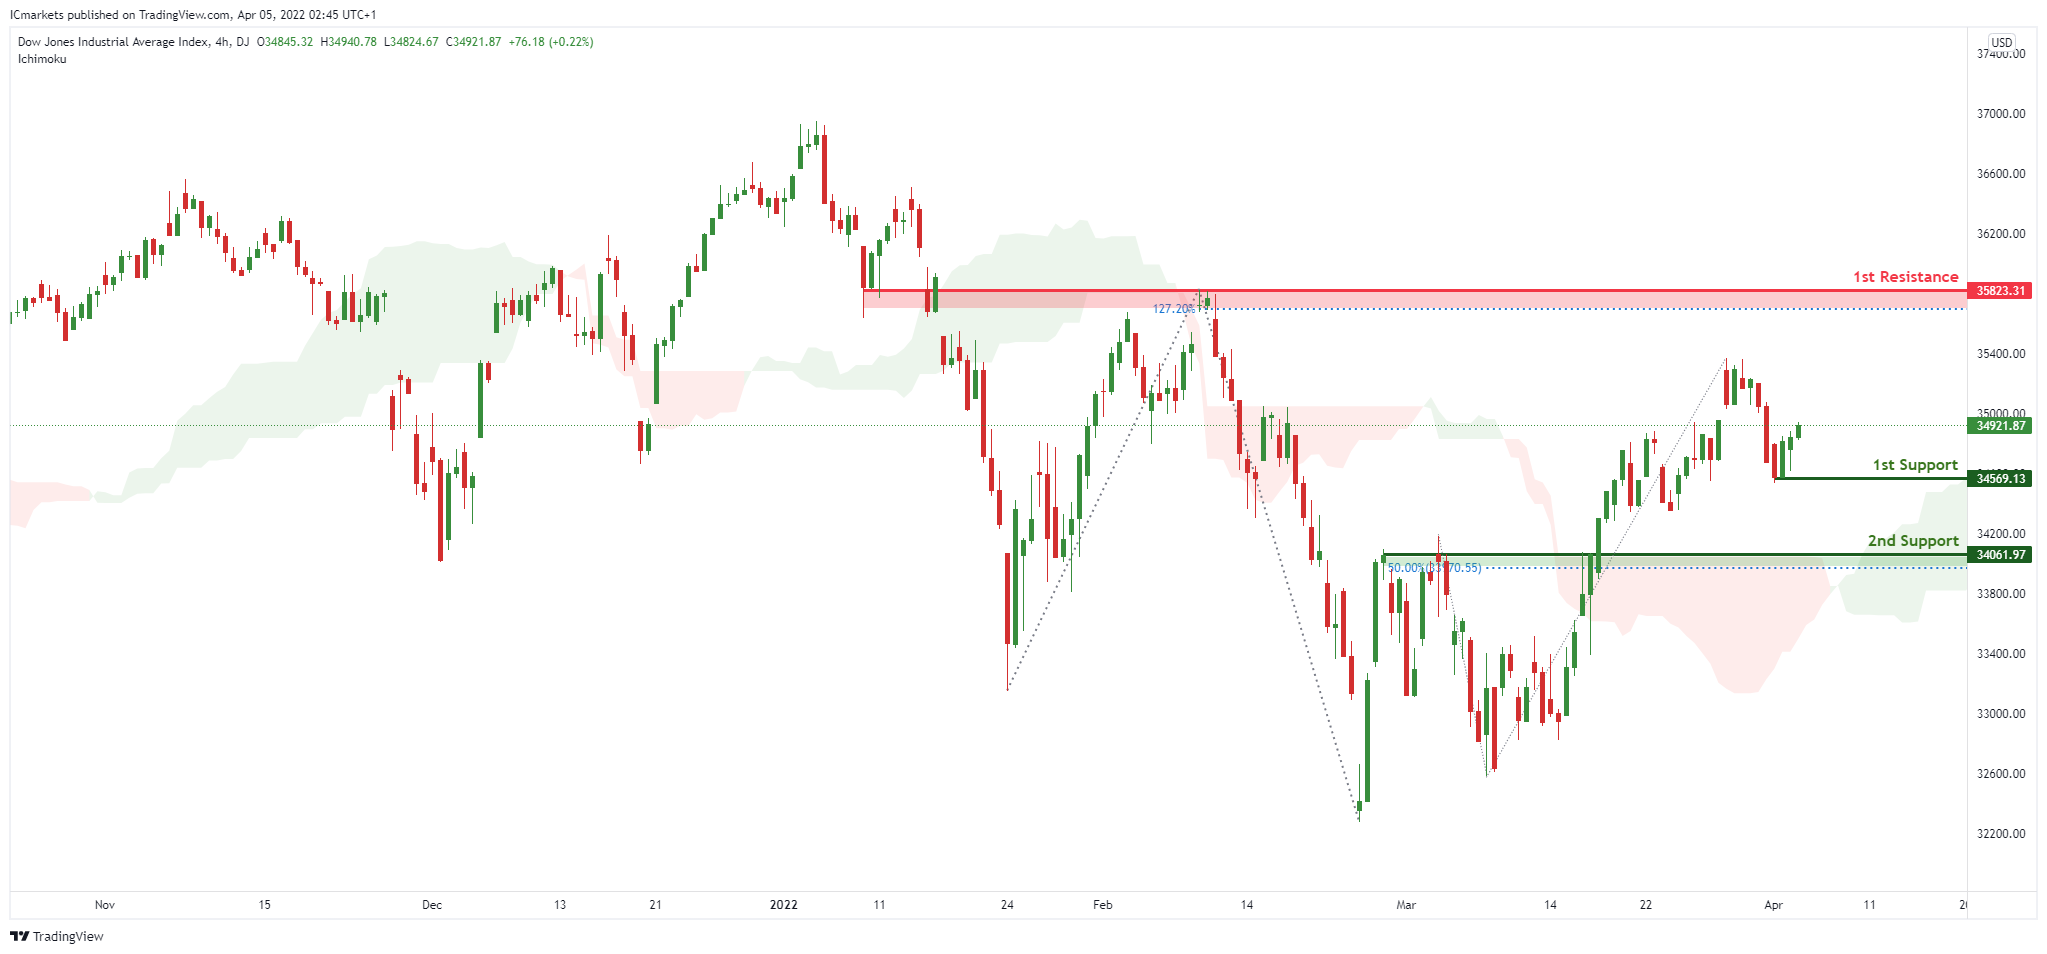
On the H4, with price moving above the ichimoku cloud, we have a bias that price will rise to our 1st resistance at 35823 in line with the 127.2% Fibonacci extension from our 1st support at 34065 in line with the horizontal pullback support and 50% Fibonacci retracement. Alternatively, price may break 1st support structure and head for 2nd support at 32633 in line with the horizontal swing low support.
Areas of consideration :
- H4 1st support at 34065
- H4 1st resistance at 35823
Fed Minutes to Offer Clues on Balance Sheet Plan as Yield Curve Inverts
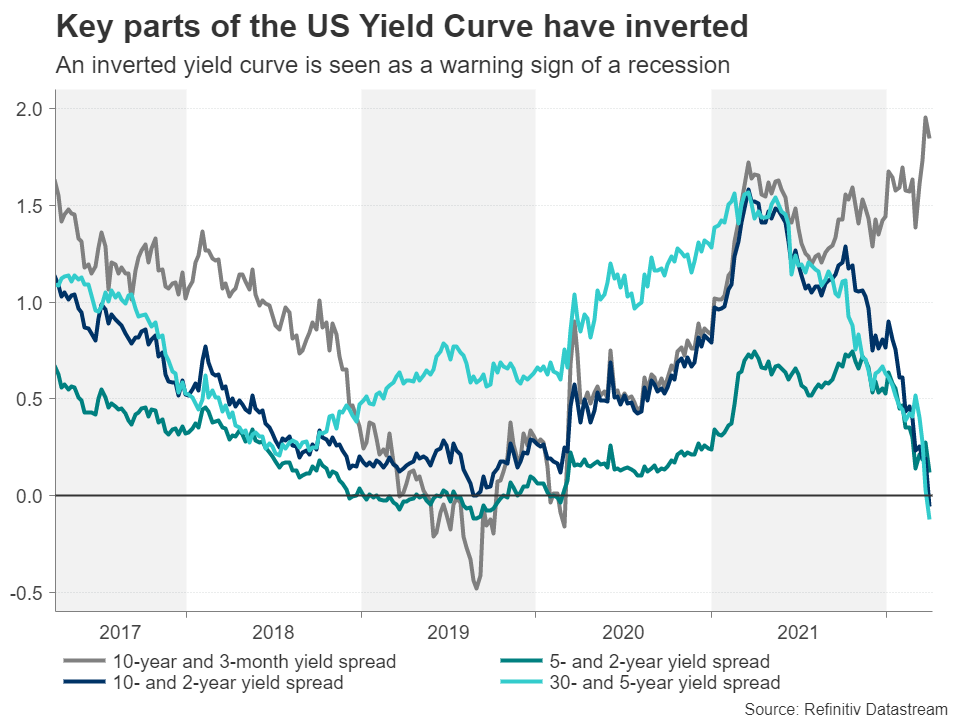
The Federal Reserve publishes the minutes of its March 15-16 policy meeting on Wednesday (18:00 GMT) and investors will be parsing them for any clues about how quickly the balance sheet will be reduced. US data on inflation and the labour market have only strengthened since the March meeting, adding pressure on policymakers to consider a 50-basis-points rate hike at the next one. But more worryingly, key parts of the yield curve are inverting. So will the Fed rock the boat when markets are jittery?
Paying the price of being behind the curve?
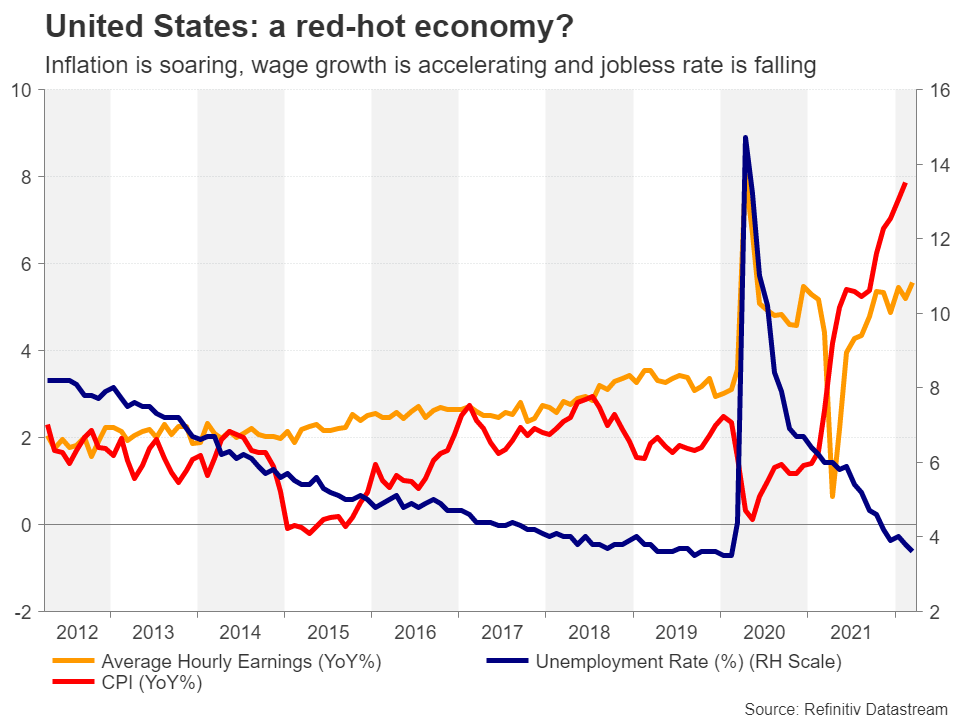
A tight labour market and red-hot inflation are normally a recipe for very high interest rates, but in this cycle, the Fed has only just started lifting borrowing costs. Not only that, it’s doing so from rock bottom levels. Policymakers hesitated about removing stimulus sooner because they were still worried about the pandemic’s ripple effects. They thought that once the pent-up demand petered out and supply disruptions proved to be short-lived, inflation would fall back.
That hasn’t happened. In fact, the inflation headache has only gotten worse: the supply-chain issues have yet to be resolved, the Ukraine crisis has generated an even bigger price shock than the pandemic as commodity prices have skyrocketed, and now there’s a real risk of a wage-price spiral as average hourly pay has started to creep up.
The US economy can withstand higher rates
One bit of good news for the Fed is that the American economy is roaring. Moreover, the outlook hasn’t deteriorated as much as it has for other economies like the Eurozone’s because the United States won’t be as badly affected from the surge in energy prices and the Western sanctions against Russia. That gives the Fed quite a bit of scope to raise rates without pushing the economy into recession.
Another ‘advantage’ for the Fed is the fact that a lot of the supply-related price pressures in the US were directly exacerbated by excess demand in the economy. So although many of the supply shortages will likely persist for some time, weaker demand should nonetheless offset a sizeable chunk of the upside cost pressures, meaning that tighter policy should be effective in at least partially bringing down inflation. The same can’t be said for the European Central Bank as most of the price increases in the euro area are being driven by external factors.
Fed setting the stage for 50-bps hike
The Fed’s wake-up call on inflation has been on full display in recent weeks after a string of FOMC members came out in support for more aggressive tightening. Dovish-leaning Chair Powell has also hinted he is open to a 50-bps move at the next meeting in May, sending rate hike bets sharply higher.
The FOMC had upped its rate hike projections for the rest of 2022 to six at the March gathering and it’s looking very likely the median dot plot will be revised further up in June. But before then, the spotlight is on the May meeting when a decision on reducing the balance sheet is expected.
Attention will soon shift to balance sheet
The last time the central bank decided to shrink its bond holdings they set a pace of $50 billion a month. However, policymakers have hinted that they would like to see a much faster balance sheet runoff this time round. So are the markets headed for a nasty shock in May and will there be any indication of a much larger-than-anticipated pace of reduction in the minutes?
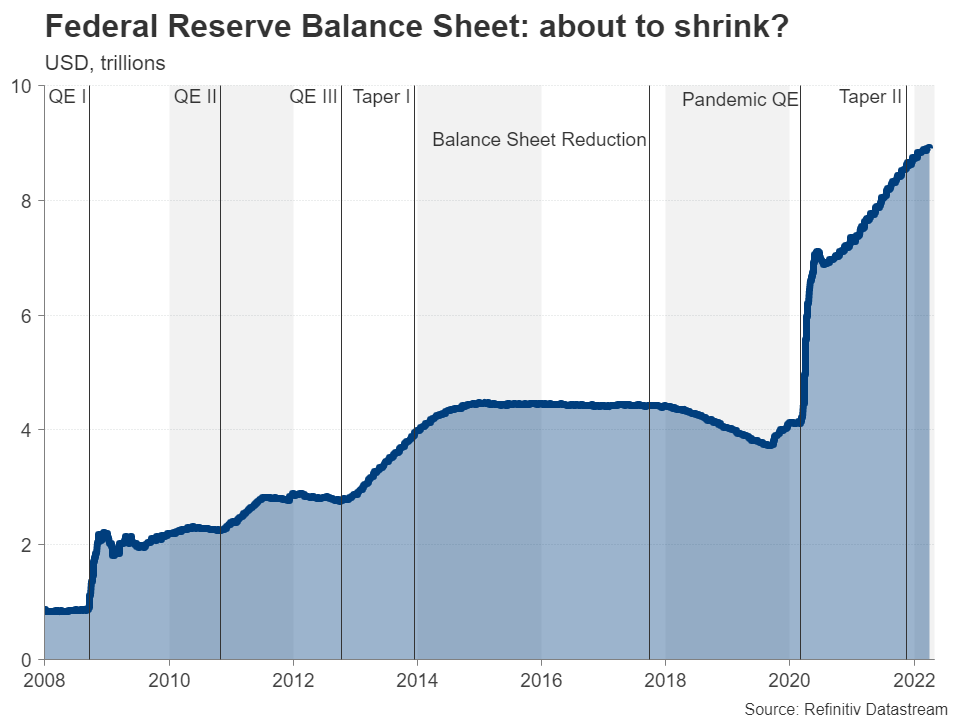
There is a case to be made for shrinking the balance sheet very rapidly as this would ease some of the burden of monetary tightening on interest rates. The other argument is that it would help steepen the yield curve, which is something that could be used to allay fears of a recession. The 10-year/2-year and 30-year/5-year parts of the yield curve have inverted in the past week, amid growing concerns the Fed will overtighten.
Are markets complacent about QT?
Nevertheless, the Fed will probably prefer not to go too fast on quantitative tightening, allowing it to put the process on autopilot so that it can focus its efforts on guiding investors through the rate increases. The main risk for the markets is that they haven’t completely, if at all, priced in the impact of quantitative tightening. Quite possibly, the impact will only be known once the Fed has put its plan into action.
But at a time when there is so much uncertainty about the inflation outlook and the fallout from the war in Ukraine, any surprise giveaways from the balance sheet discussions in the minutes could spark quite a bit of volatility in the bond and stock markets.
Euro can’t catch a break from the bullish dollar
As for the US dollar, hawkish minutes could provide yet another boost, pushing euro/dollar towards the $1.0950 level. Breaching this support would pave the way for the 22-month low of $1.0804 set in March.
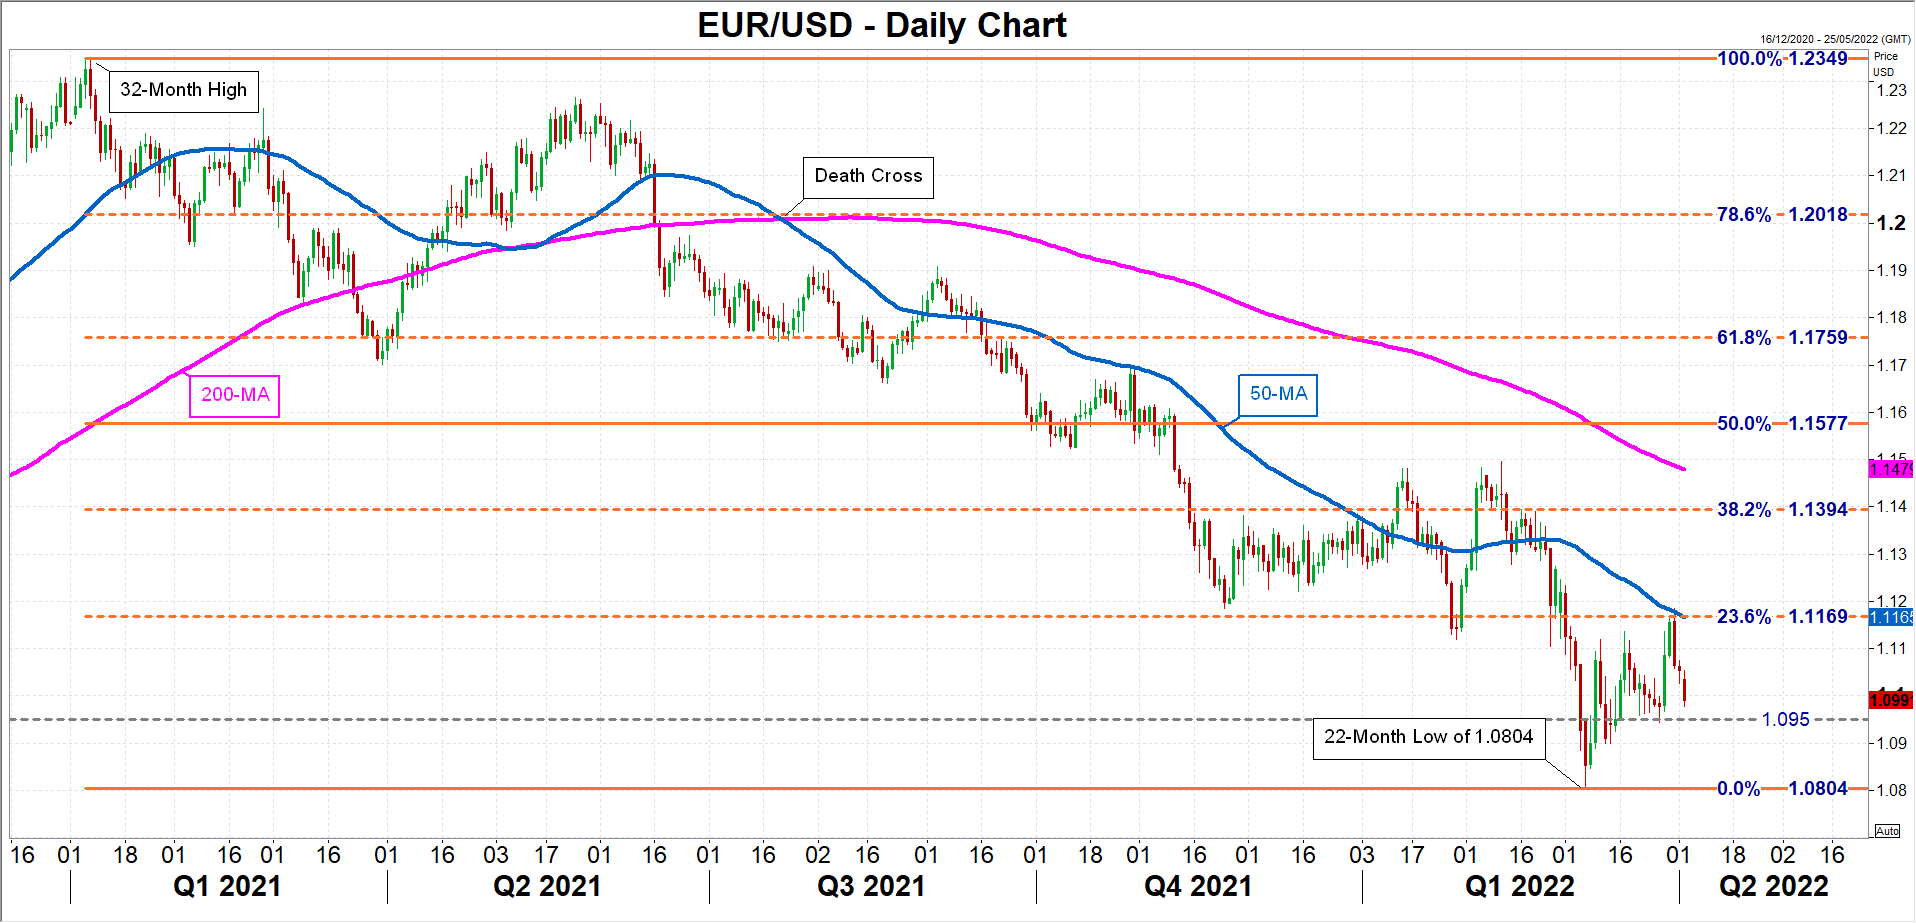
However, if there are no unexpected revelations in the minutes and policymakers even express some doubts about the outlook due to the looming squeeze on consumers from the energy crisis and the elevated geopolitical tensions, euro/dollar might just be able to bounce back. Initially, the pair could claw its way up towards the 50-day moving average at $1.1165, which is also the 23.6% Fibonacci retracement of the January-March downtrend. Higher up, the 38.2% Fibonacci of $1.1394 would be the next big test for dollar bears.
GBP/USD at Clear Risk of More Downsides
Key Highlights
- GBP/USD is struggling below the 1.3200 resistance zone.
- A connecting bearish trend line is forming with resistance near 1.3135 on the 4-hours chart.
- EUR/USD must stay above 1.0950 to start a fresh increase.
- The US ISM Services Index could increase from 56.5 to 58.0 in March 2022.
GBP/USD Technical Analysis
The British Pound struggled to stay above the 1.3200 zone against the US Dollar. GBP/USD started a fresh decline and traded below the 1.3150 support zone.
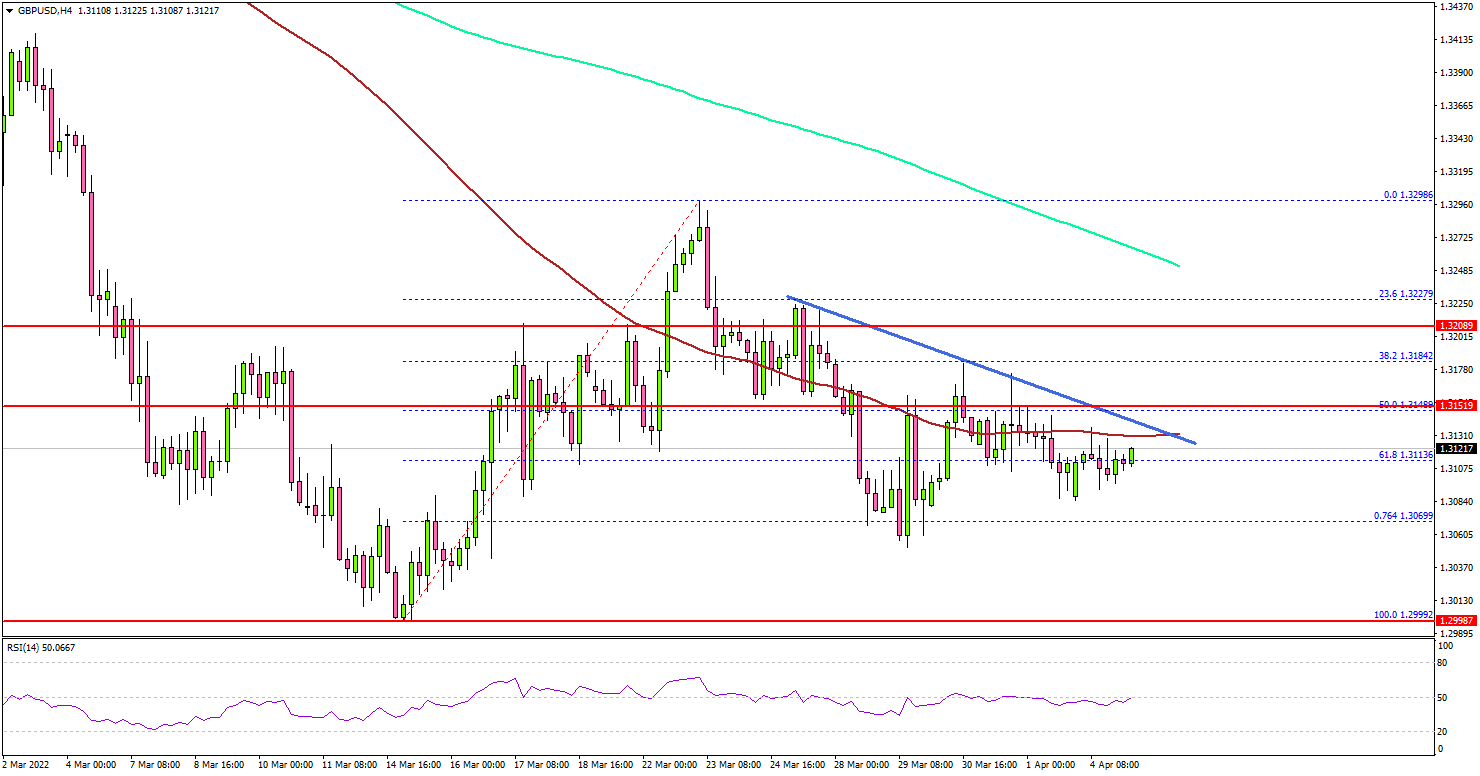
Looking at the 4-hours chart, the pair declined below the 1.3180 support level and settled below the 200 simple moving average (green, 4-hours). There was a clear move below the 50% Fib retracement level of the upward move from the 1.2999 swing low to 1.3298 high.
The pair even traded below 1.3100 level and the 100 simple moving average (red, 4-hours). It tested the 76.4% Fib retracement level of the upward move from the 1.2999 swing low to 1.3298 high.
If the bears remain in control below 1.3150, there is a risk of more downsides. The next major support sits near the 1.3050 level, below which the pair could revisit 1.3000.
On the upside, an immediate resistance is near the 1.3135 level and the 100 simple moving average (red, 4-hours). There is also a connecting bearish trend line forming with resistance near 1.3135 on the same chart.
The main resistance sits near the 1.3200. A clear move above the 1.3200 zone could set the pace for a move towards 1.3300.
Looking at EUR/USD, the pair extended decline below 1.1040. It must stay above the key 1.0950 support level to start a fresh increase. If not, it could dive to 1.0820.
Economic Releases
- US Goods and Services Trade Balance for Feb 2022 - Forecast $-88.5B, versus $-89.7B previous.
- US ISM Services Index for March 2022 – Forecast 58.0, versus 56.5 previous.
Elliott Wave View: Dollar Index (DXY) Resumes Higher
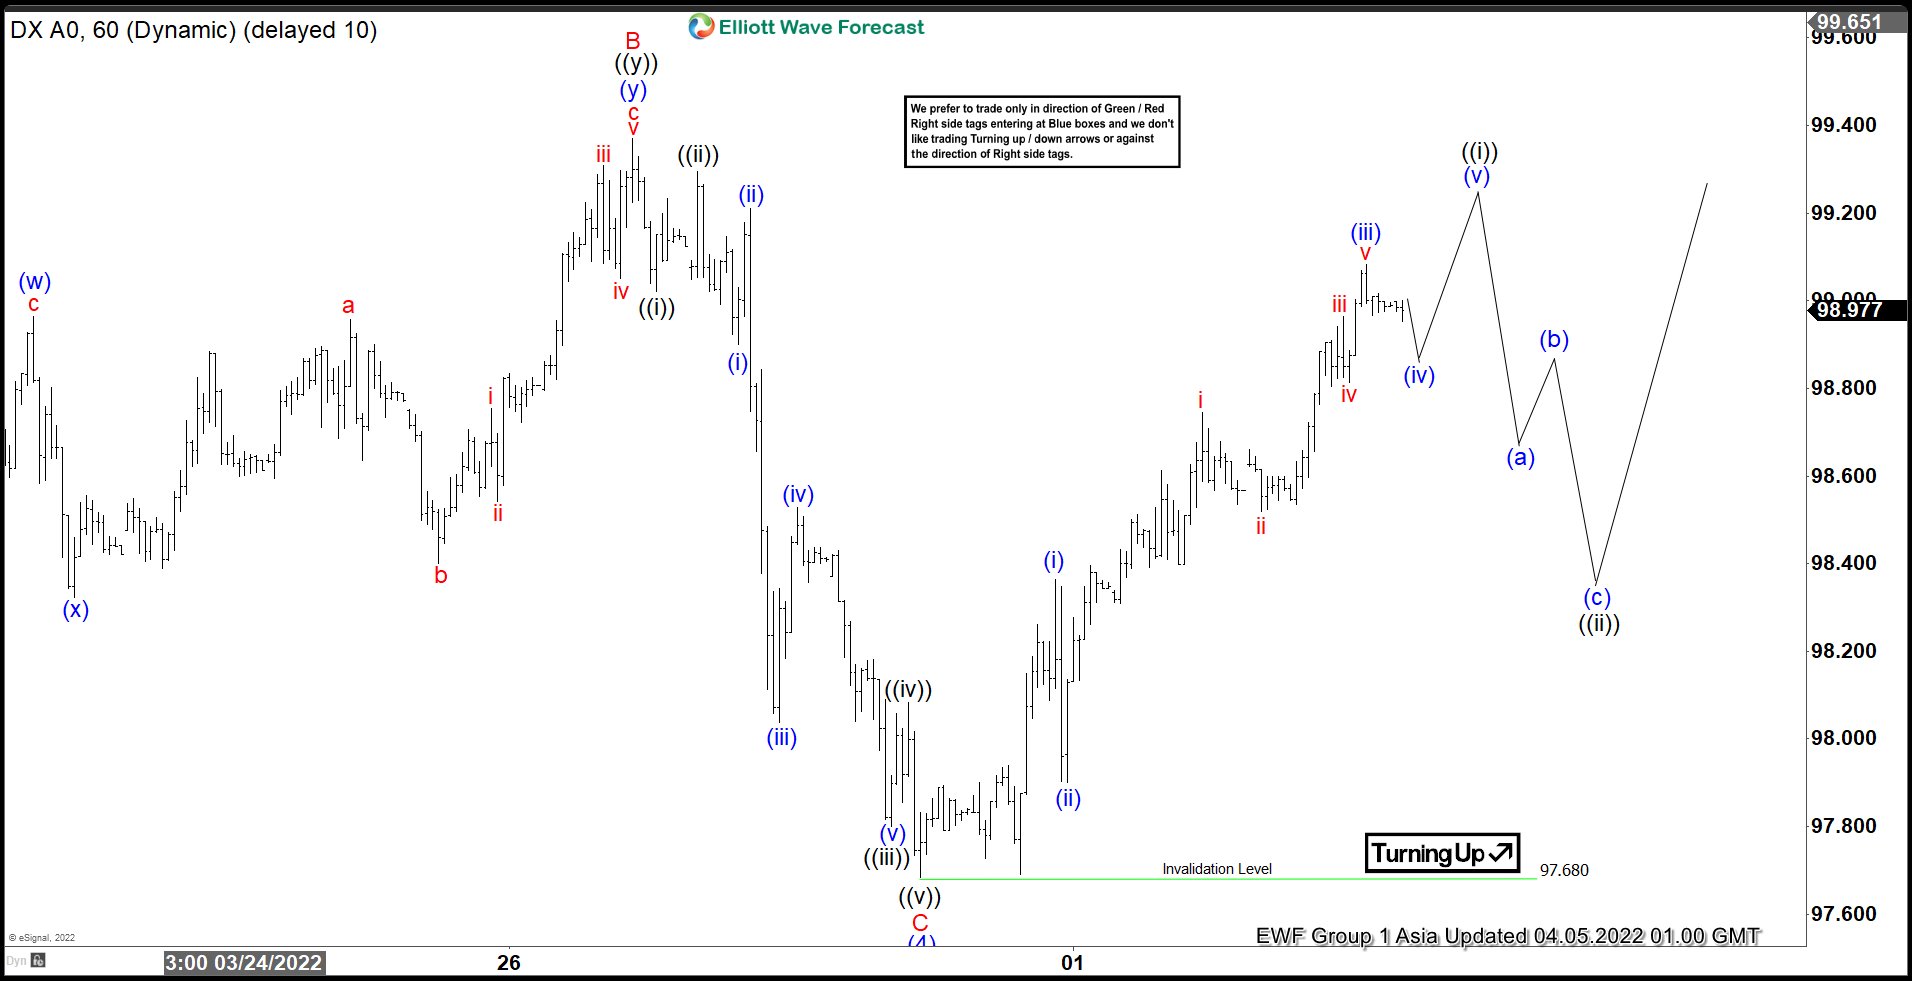
Short Term outlook in Dollar Index (DXY) suggests the decline from March 7, 2022 peak ended in wave (4) at 97.68. Internal subdivision of wave (4) unfolded as a zigzag Elliott Wave structure. Down from March 7 peak, wave A ended at 97.71 and rally in wave B ended at 99.37. The Index then resumed lower in wave C towards 97.68 which completed wave (4) in higher degree. The Dollar has turned higher in wave (5). Internal subdivision of wave (5) is in progress as a 5 waves impulse.
Up from wave (4), wave (i) ended at 98.36 and pulllback in wave (ii) ended at 97.9. Index then resumes higher in wave (iii) to 99.08. Expect Index to pullback in wave (iv) and then extend higher again one more leg in wave (v) before it completes wave ((i)). Afterwards, expect a wave ((ii)) pullback to correct the rally from wave (4) low on March 30 before the Index resumes higher again. Near term, as far as March 30 low pivot at 97.68 stays intact, expect dips to find support in the sequence of 3, 7, or 11 swing for further upside.
Dollar Index 60 Minutes Elliott Wave Chart
EUR/USD Looks Increasingly Vulnerable
EUR/USD fell on Monday as fresh claims of Russian war crimes in the Ukraine led to increased speculation of more punitive sanctions against Russia. The news, combined with other developments over the weekend, dented hopes last week of a possible de-escalation in the war. Added downward pressure on the euro also came from firmer-than expected US factory order data for February on what was a light day in terms of economic data. ECB Governing Council member Vasle, who hinted the ECB could raise interest rates by the end of this year, lent little support to the euro in the current environment.
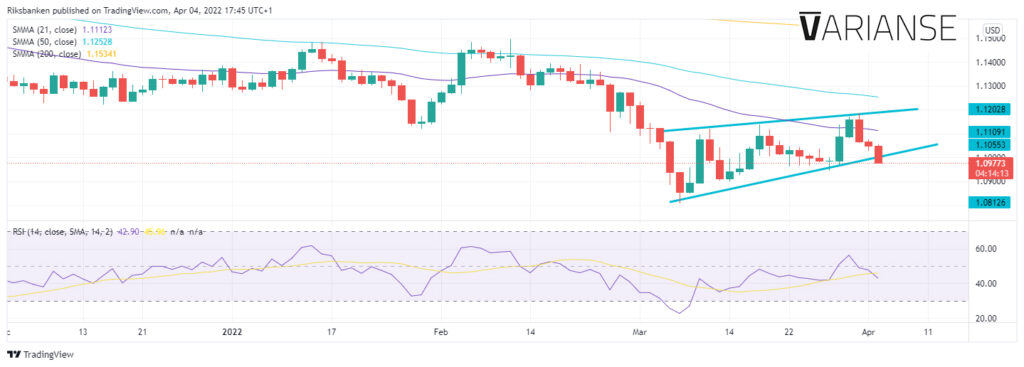
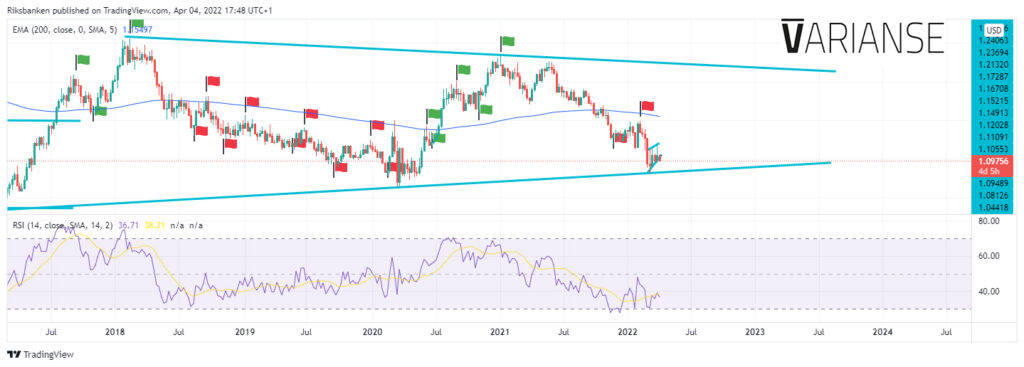
The dip back below 1.10 is not just of psychological importance, but also represents a break to the downside in the rising wedge pattern that has developed in recent weeks. This could be a prelude to a continuation in EUR/USD’s downtrend. In turn, this increases the probability that EUR/USD experiences a downside break of the longer-term symmetrical triangle pattern that has developed over recent years. Such a move could lead to an even larger fall. EUR/USD tested the bottom end of this pattern on 8 March, before traders bid the pair higher.
Geopolitical factors are unsurprisingly in the driver seat when it comes to EUR/USD for the moment. Still, a host of ECB and Fed speakers this week could easily tilt the scales for the euro as much as the Ukraine. Economic data could play an equally significant role as traders try to assess the impact of recent events on the euro area economy.
The final March services PMI for the euro area is due for release on Tuesday and is likely to get more attention than usual in a relatively quiet week for data. The preliminary PMI dropped to 54.80 from 55.0 in April. More importance, however, is likely to be placed on the release of the March Federal Reserve minutes on Wednesday which are expected to outline the central bank’s plans for balance sheet reduction.
A break above the 1.117 region in the coming days could lead to a more positive shift sentiment around the pair, but for the time being the risks for EUR/USD look increasingly tilted to the downside in terms of risk and reward.
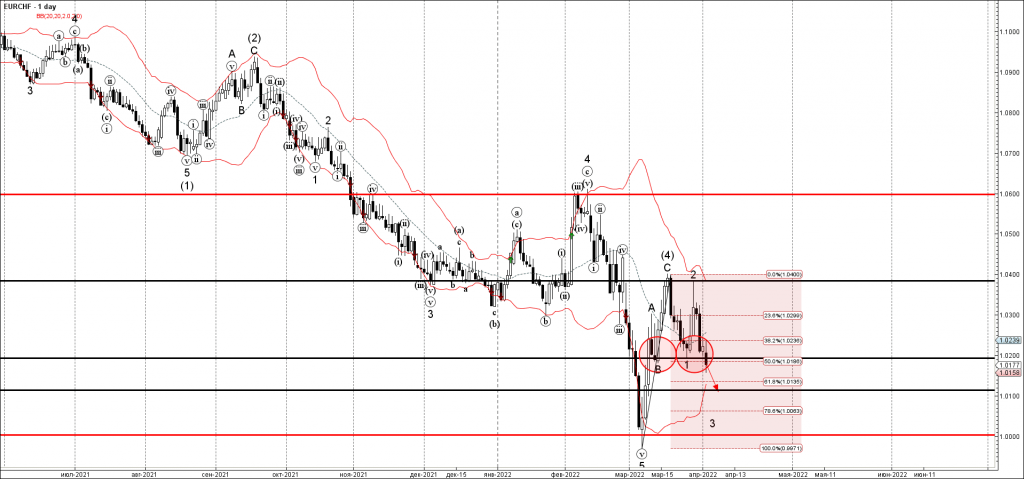
EURCHF Wave Analysis
- EURCHF broke key support level 1.020
- Likely to fall to support level 1.01
EURCHF currency pair recently broke the key support level 1.020 (which has been reversing the pair from the start of March).
The breakout of the support level 1.020 coincided with the breakout of the 50% Fibonacci correction of the upward ABC correction (4) from the start of March.
Given the clear downtrend – EURCHF currency pair can be expected to fall further toward the next support level 1.01.
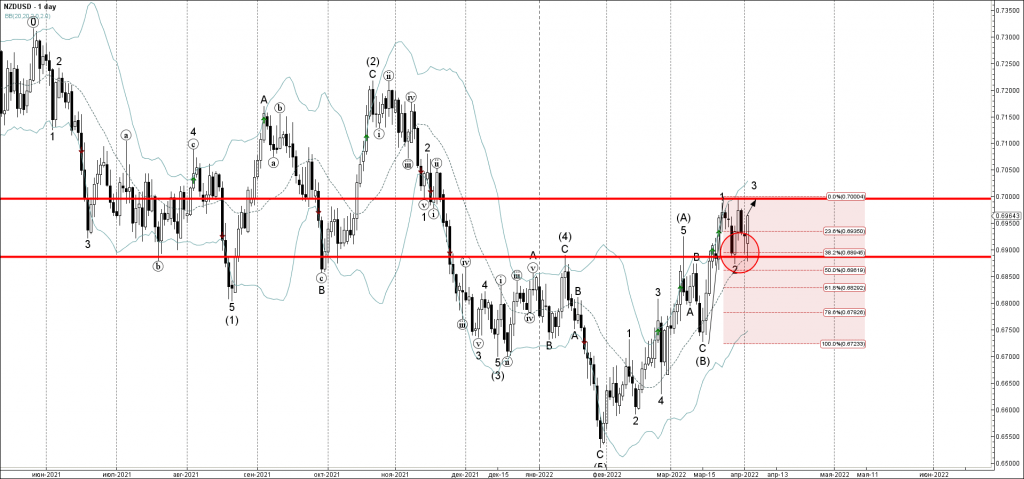
NZDUSD Wave Analysis
- NZDUSD reversed from key support level 0.6885
- Likely to rise to resistance level 0.7000
NZDUSD recently reversed up with the daily Long-Legged Doji from the key support level 0.6885 (former monthly high from January).
The support area near the support level 0.6885 was strengthened by the 20-day moving average and 38.2% Fibonacci correction of the upward impulse wave 1 from March.
NZDUSD can be expected to rise further toward the next round resistance level 0.7000 (top of the previous impulse wave 1 from last month).