Sample Category Title
EUR/USD Mid-Day Outlook
Daily Pivots: (S1) 1.1027; (P) 1.1052 (R1) 1.1075; More...
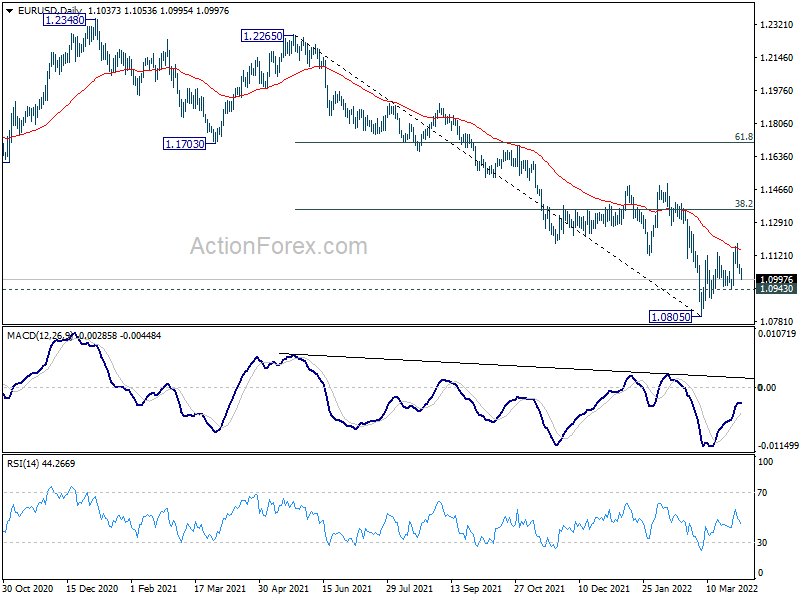
EUR/USD's fall from 1.1184 extends lower today but stays above 1.0943 support. Intraday bias remains neutral first. On the upside, break of 1.1184 will resume the rebound from 1.0805 to 38.2% retracement of 1.2265 to 1.0805 at 1.1363. However, break of 1.0943 will revive near term bearishness and bring retest of 1.0805 low first.
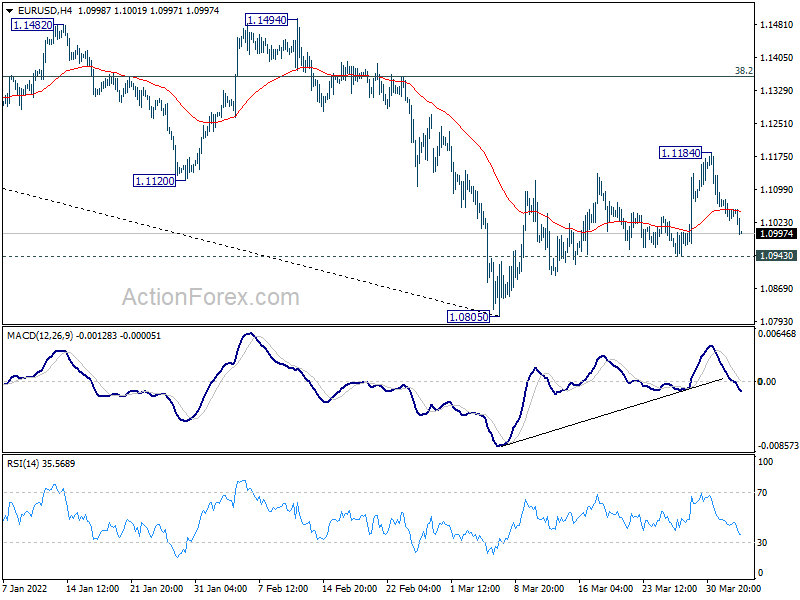
In the bigger picture, the decline from 1.2348 (2021 high) is expected to continue as long as 1.1494 resistance holds. Firm break of 1.0635 (2020 low) will raise the chance of long term down trend resumption and target a retest on 1.0339 (2017 low) next. Nevertheless, break of 1.1494 will maintain medium term neutral outlook, and extending term range trading first.
Euro Falls Broadly as EU Considers Fresh Sanctions Against Russia
Euro falls broadly today on expectation that EU is going to impose another round of sanctions against Russian following war crimes in Ukraine. Additionally, investor confidence data indicates the war in Ukraine is pushing Eurozone into recession. Sterling and Swiss Franc are broadly weak too. Commodity currencies are currently the stronger ones while Dollar and Yen are mixed.
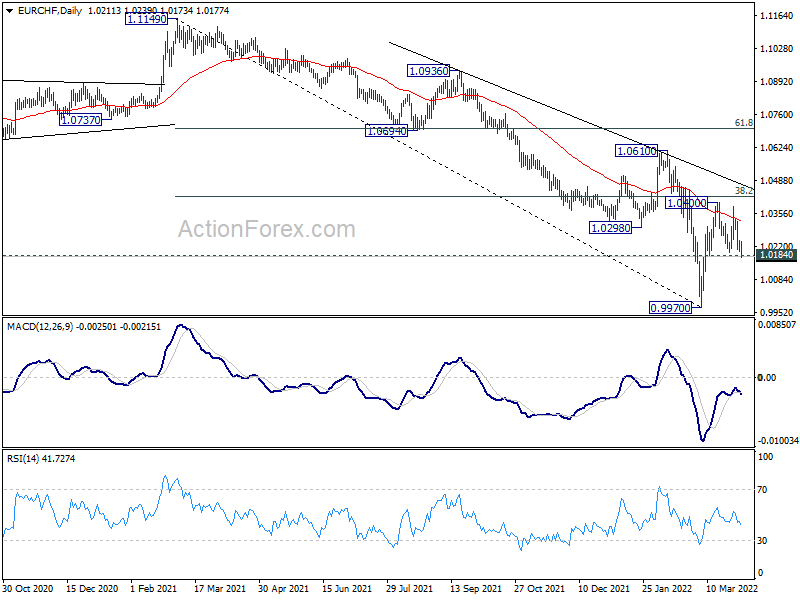
Technically, EUR/CHF's breach of 1.0814 minor support argues that rebound from 0.9970 has completed already. Rejection by 38.2% retracement of 1.1149 to 0.9970 at 1.0420, and 55 day EMA keeps medium term outlook bearish. Retest of 0.9970 would be seen next. At the same time, attention will be on whether EUR/USD and EUR/GBP would break through 1.0943 and 0.8294 support levels to revive near term bearishness.
In Europe, at the time of writing, FTSE is up 0.06%. DAX is down -0.12%. CAC is up 0.03%. Germany 10-year yield is down sharply b y -0.072 at 0.484. Earlier in Asia, Nikkei rose 0.25%. Hong Kong HSI rose 2.10%. China was on holiday. Singapore Strait Times dropped -0.06%. Japan 10-year JGB yield rose 0.0004 to 0.217.
Eurozone Sentix dropped to -18 in April, pushed into recession
Eurozone Sentix Investor Confidence dropped from -7.0 to -18.0 in April, much worse than expectation of -9.7. That's also the lowest level since July 2020. Current Situation index dropped from 7.8 to -5.5, lowest since April 2021. Expectations index dropped from -20.8 to -29.8, lowest since December 2011.
Sentix said the Eurozone economy is "being pushed into recession by the Ukraine conflict and the accompanying sanctions and uncertainties."
"Due to the still considerable dynamics in the inflation trend, investors do not expect the central bank to be able to come to the rescue with a looser, even more expansive monetary policy. The economy and the stock markets are thus left to their own devices. For many investors, this is a new experience with its own risks."
BoE Bailey: Crypto creates an opportunity for the downright criminal
BoE Governor Andrew Bailey criticized at a "Stop Scam" conference that's cryptocurrencies created an "opportunity for the downright criminal." He asked, "what do people committing ransom attacks usually demand payment in? The answer is crypto."
He also lamented that cryptocurrency users act as though national rules do not apply to them. "Some crypto enthusiasts say they shouldn't be covered by Russian sanctions because that's not their world," he said. "I'm sorry, it is your world. We're all in the same world."
EUR/USD Mid-Day Outlook
Daily Pivots: (S1) 1.1027; (P) 1.1052 (R1) 1.1075; More...
EUR/USD's fall from 1.1184 extends lower today but stays above 1.0943 support. Intraday bias remains neutral first. On the upside, break of 1.1184 will resume the rebound from 1.0805 to 38.2% retracement of 1.2265 to 1.0805 at 1.1363. However, break of 1.0943 will revive near term bearishness and bring retest of 1.0805 low first.
In the bigger picture, the decline from 1.2348 (2021 high) is expected to continue as long as 1.1494 resistance holds. Firm break of 1.0635 (2020 low) will raise the chance of long term down trend resumption and target a retest on 1.0339 (2017 low) next. Nevertheless, break of 1.1494 will maintain medium term neutral outlook, and extending term range trading first.
Economic Indicators Update
| GMT | Ccy | Events | Actual | Forecast | Previous | Revised |
|---|---|---|---|---|---|---|
| 23:50 | JPY | Monetary Base Y/Y Mar | 7.90% | 7.60% | ||
| 06:00 | EUR | Germany Trade Balance (EUR) Feb | 11.5B | 11.3B | 9.4B | |
| 08:30 | EUR | Eurozone Sentix Investor Confidence Apr | -18 | -9.7 | -7 | |
| 12:30 | CAD | Building Permits M/M Feb | 21.00% | 2.30% | -8.80% | |
| 14:00 | USD | Factory Orders M/M Feb | -0.60% | 1.40% | ||
| 14:30 | CAD | BoC Business Outlook Survey |
BoE Bailey: Crypto creates an opportunity for the downright criminal
BoE Governor Andrew Bailey criticized at a "Stop Scam" conference that's cryptocurrencies created an "opportunity for the downright criminal." He asked, "what do people committing ransom attacks usually demand payment in? The answer is crypto."
He also lamented that cryptocurrency users act as though national rules do not apply to them. "Some crypto enthusiasts say they shouldn't be covered by Russian sanctions because that's not their world," he said. "I'm sorry, it is your world. We're all in the same world."
Eurozone Sentix dropped to -18 in April, pushed into recession
Eurozone Sentix Investor Confidence dropped from -7.0 to -18.0 in April, much worse than expectation of -9.7. That's also the lowest level since July 2020. Current Situation index dropped from 7.8 to -5.5, lowest since April 2021. Expectations index dropped from -20.8 to -29.8, lowest since December 2011.
Sentix said the Eurozone economy is "being pushed into recession by the Ukraine conflict and the accompanying sanctions and uncertainties."
"Due to the still considerable dynamics in the inflation trend, investors do not expect the central bank to be able to come to the rescue with a looser, even more expansive monetary policy. The economy and the stock markets are thus left to their own devices. For many investors, this is a new experience with its own risks."
Gold Consolidates Around 50% Fibonacci Level
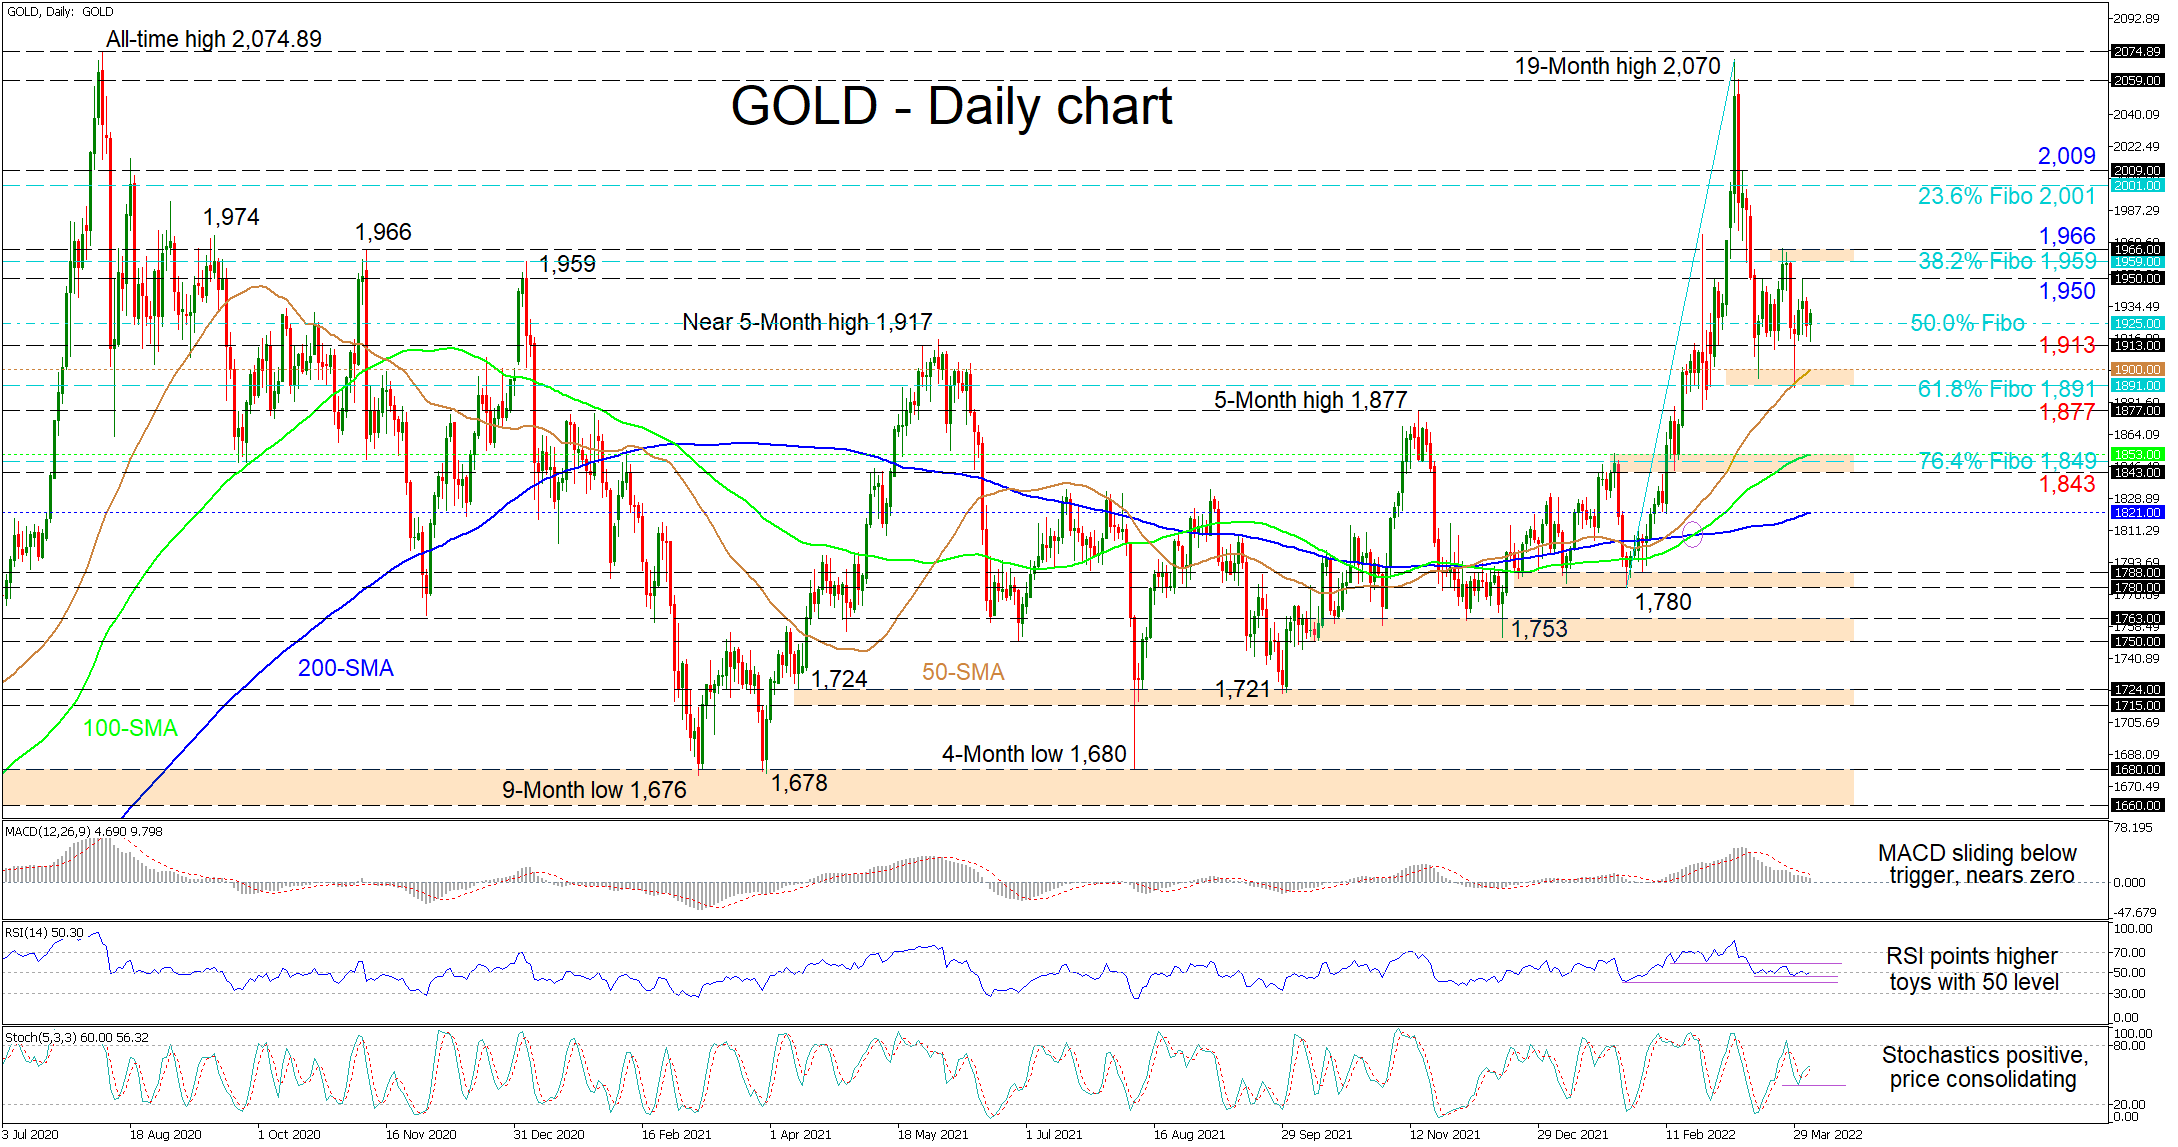
Gold has stabilized around the 1,925 level, which is the 50.0% Fibonacci retracement of the near six-week rally from 1,780 until the 19-month high of 2,070. The rising simple moving averages (SMAs) continue to endorse the bullish trend in the commodity.
Meanwhile, the picture painted by the short-term oscillators is one of conflicting signals in directional momentum. The MACD is indicating that positive momentum continues to wane as it glides beneath its red trigger line towards the zero threshold. Currently, the RSI is fluctuating around the 50 neutral mark failing to provide a convincing price preference in the yellow metal. Lastly, the stochastic oscillator has regained a positive charge and is promoting upside price action.
If the price of the precious metal deteriorates below the immediate 50.0% Fibo, prompt downside friction could occur at the 1,913 level ahead of a crucial support band between the 50-day SMA at 1,900 and the 61.8% Fibo of 1,891. If the 50-day SMA and the 61.8% Fibo fail to defend the positive structure, sellers may then challenge the key 1,877 barrier before targeting the fortified support zone from the 100-day SMA of 1,853 until the 1,843 low.
Alternatively, if buyers fuel extra positive traction from the 50.0% Fibo of 1,925, resistance could originate from the 1,950 nearby high prior to the bulls confronting the resistance zone linking the 38.2% Fibo of 1,959 to the March 24 high of 1,966. Overcoming this barricade may encourage the bulls to pilot higher, in order to tackle the 23.6% Fibo of 2,001 and the neighbouring 2,009 obstacle.
Summarizing, gold is exhibiting a neutral-to-bullish bias above the SMAs, the March 29 trough of 1,890 and the 61.8% Fibonacci level. A climb in the price above the 1,966 barrier could ramp up upside momentum. Yet, for the positive outlook to dampen, the price would need to sink clearly beneath the 1,877 border.
Bitcoin Prepares to Break through the $45-48K Range
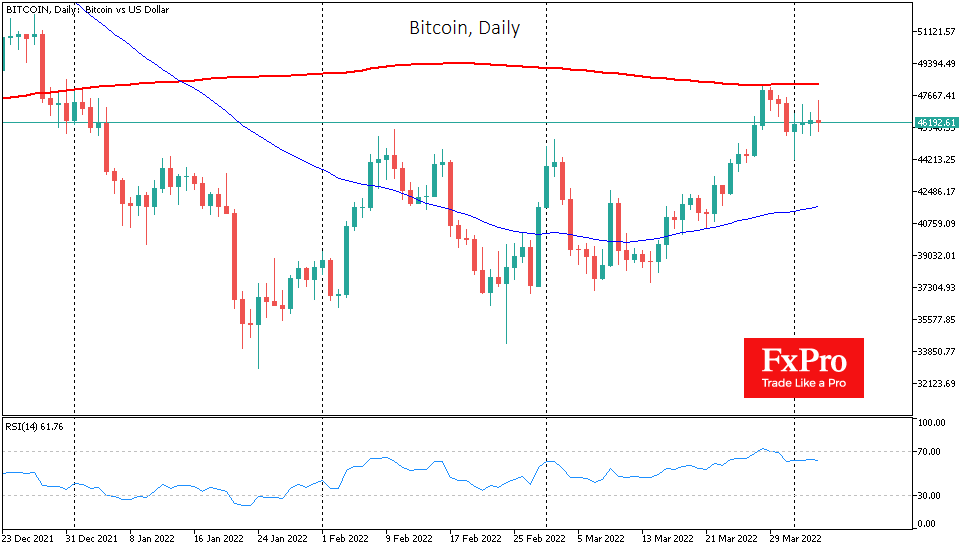
Bitcoin rose 0.6% over the past week, ending it at around $46,400. Ethereum added 8%, while other leading altcoins from the top ten rose in price from 0.1% (XRP) to 30% (Solana).
According to CoinMarketCap, the total capitalization of the crypto market increased by 1.3% over the week, to $2.15 trillion. The Bitcoin dominance index over the same period of time sank by 1.5% points, to 40.7% due to the growth of altcoins.
At the beginning of the new week, the cryptocurrency index of fear and greed rose from 48 to 52, remaining within the neutral range.
Bitcoin has corrected down since Thursday along with the decline in stock indices. Noticeable resistance was provided by the $48K level with the 200-day moving average passing close to it. Over the weekend, the first cryptocurrency found a balance near $46K.
Buyers manage to keep bitcoin from falling to the area of previous peaks near $45, turning the former resistance into effective support. However, a breakout of the 200-day moving average is still required to confirm bullish sentiment. Breaking out of the $45-48K range could signal the start of a broader trend in the direction of the breakout.
In early April, the commemorative 19 millionth coin was mined in the bitcoin network. At the moment, more than 90% of the total emission of the first cryptocurrency has been mined, which is limited to 21 million coins.
Bitcoin can reach $4.8 million if it acquires the status of a global reserve asset, according to VanEck investment company. However, this scenario is unlikely. The top contender for the status of world reserve currency is now the Chinese yuan.
Markets Tilted Towards Optimism, a Possible Bull Trap
Financial markets are clinging to positivity on Monday morning after a modest rise on Friday. Robust US labour market data reinforced expectations that the Fed will press the monetary policy brake harder. However, this news is countered by optimism that a strong labour market will allow the economy to avoid a recession by providing a soft landing. Furthermore, buyers’ interest is supported by China’s confirmation of cooperation in the audit of local companies according to US regulations.
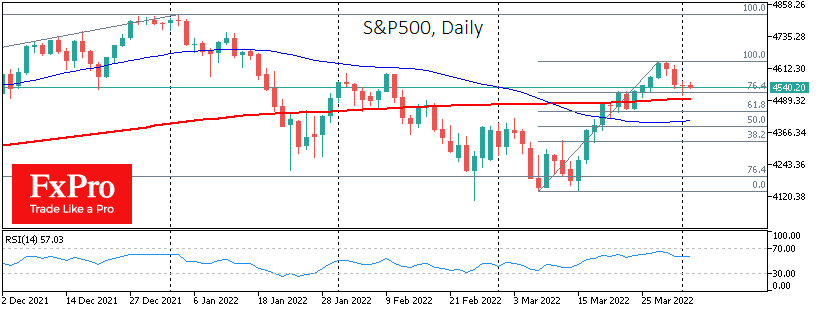
April has been described as a historically favourable month for equity markets, so the warning signals from outside are so far dissipating into buying streams after the correction at the end of last week.
Against the market at the end of March, there was profit-taking activity after the more than 11% growth for S&P500 and an even sharper recovery for European and Asian indices from the March lows. The resurgence of positive sentiment among participants is setting up that buying near the close of trading on Friday and early on Monday is a sign of the end of the mini correction, which will be followed in the coming days by a renewal of the late March highs.
However, there are serious doubts about the market’s ability to sustain the positive momentum in a broader context.
Fed officials say they are considering a 50-point rate hike at the start of May and kick-starting the selling of securities off the balance sheet. The Fed raised the interest rate by 50 points in one meeting in May 2000, cementing the dot-com bubble’s melting down for the next three years.
Regarding China and the US, we should also be under no illusions. Over the last four years, we have seen many periods of truce, but the general trend towards more confrontation has continued, albeit along a somewhat winding road.
An essential ally of the stock market is a strong economy. Investors are shifting capital from bonds to equities as a growing economy makes it possible to count on rising corporate earnings.
However, this could prove to be a death trap for bulls. By buying now, they are pushing up equity indices, signalling to the Fed that markets are ready for a tightening. Historically, central banks in similar circumstances have tightened policy until markets are stressed, and economies are on the verge of recession.
Natural Gas Without Hysteria
The energy sector has retreated markedly from its highs in the first days of March but remains a hot topic for markets.
Europe’s gas market survived several bouts of fear that it would be without Russian gas. However, we only saw a fourfold increase in value in the first half of the month, followed by stabilisation at high, but not extreme, levels. At the beginning of the last week of March, the price was supported by a fall to EUR 1000 per thousand cubic metres compared to a peak of EUR 3400.
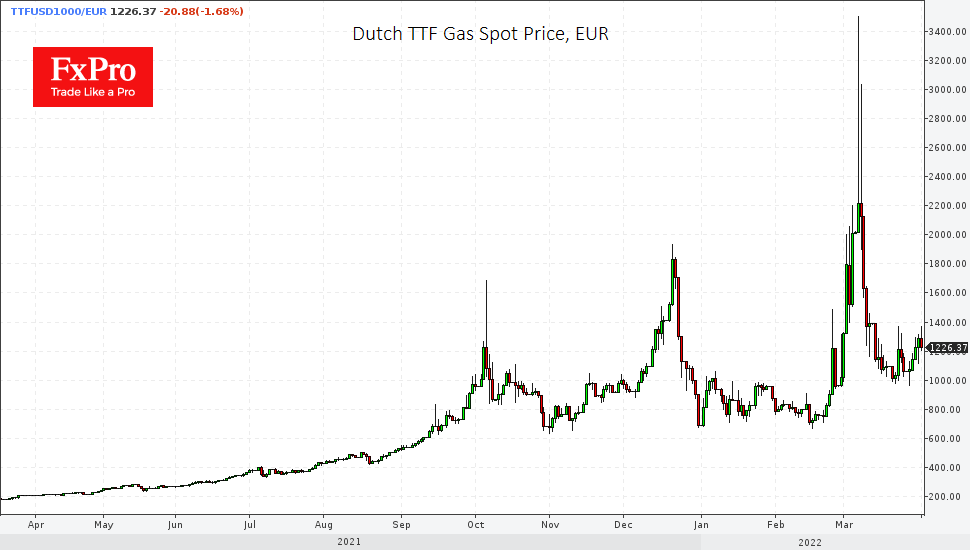
This price dynamic clearly showed that the markets did not price for a gas disaster. The current gas payment scheme looks like a nice political compromise. Europe is paying for gas in euros and dollars (as negotiated), and Russia is getting roubles for gas (as it wanted). The net economic effect of such rearrangements is close to zero. Also, these measures are not binding for LNG exports and settlements with Japan. Besides, there is a caveat that a special commission may allow receiving currency in payment for gas. An additional calculation here is that new contracts will always include clauses about alternative payment methods, but they have little effect on the price.
Nevertheless, the general upward trend in gas and oil prices is still in place. Spot gas prices in Europe are now six times higher than a year ago and two years ago in March. This does not mean a six-fold increase in prices for final consumers, as most supplies are under long-term contracts. Therefore, what we see in the Dutch TTF prices is nothing more than a struggle between speculators and small buyers in a relatively illiquid market.
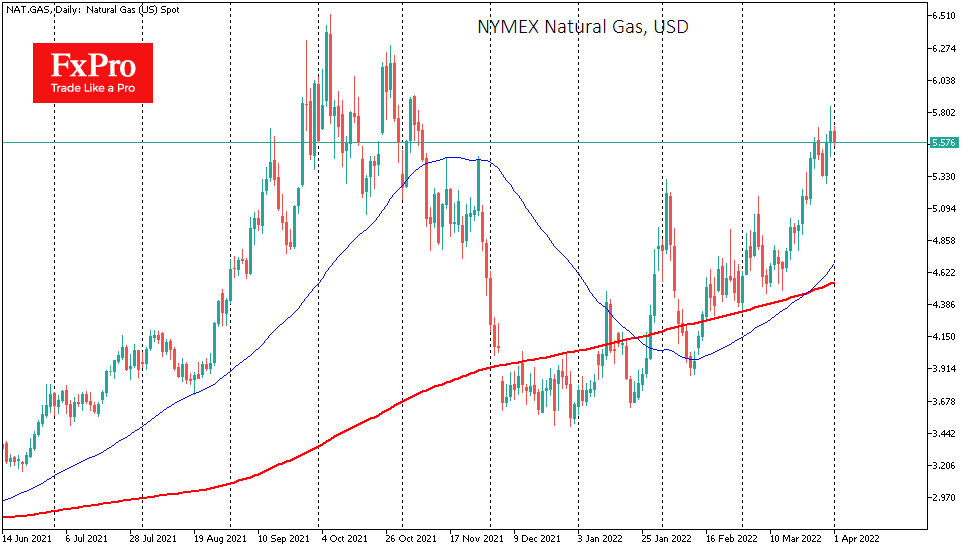
The NYMEX pricing is much more liquid and representative. Besides, it is pretty far from the conflict. Prices here are up 30% in one month and 130% year to date. Gas was up to $5.6 MMBtu yesterday but 14% below October’s highs near $6.5, making it hard to see market hysteria. Instead, it is just a relatively measured trend. The development of this trend has the potential to return the US gas price to October highs by the end of April due to Europe’s increased interest in non-Russian gas. At the same time, signs that Europe and Russia have managed to formalise some gas purchase terms for themselves are likely to return Dutch’s spot prices to levels near or below EUR 1000.
US Dollar Rises as Strong NFP Point to More Fed Hikes
The US dollar rose slightly on Monday morning as investors reflected on the strong American jobs data. On Friday, data by the Bureau of Labor Statistics (BLS) showed that the American economy added over 431k jobs in March this year. This increase was strong even though it was lower than the 750k jobs that were created in February. The unemployment rate declined to 3.6%, the lowest level since the pandemic started. Wages also kept rising in March. As a result, there is a likelihood that the Fed will be more hawkish. In a statement to the FT, Fed’s Mary Daily said that she would support a 50 basis point hike in May. She estimates that the neutral rate will be between 2.3% and 2.5%.
The euro declined against the British pound and the US dollar as the EU considers more sanctions against Russia. There are also concerns that the EU will soon have a gas crisis now that the bloc has rejected the proposal to pay for its deliveries in euros. The currency will react to the latest German trade numbers that will come out in the morning session. Analysts expect these numbers will show that the country’s imports rose by 1.45 while exports rose by 1.5%. As a result, the trade surplus is expected to have increased to over 9.6 billion euros. The EU will also publish the latest producer price index data.
The economic calendar will have a few additional events today. In the United States, the statistics agency will publish the February factory order numbers. Analysts expect that these orders rose by 1.4% in February. The other key data to watch will be the Turkish consumer price index data, which is expected to show that the headline CPI rose by 61.60% in March. Earlier today, the Australian Bureau of Statistics published strong retail sales numbers. The data came as the Reserve Bank of Australia (RBA) started its monetary policy meeting.
EURUSD
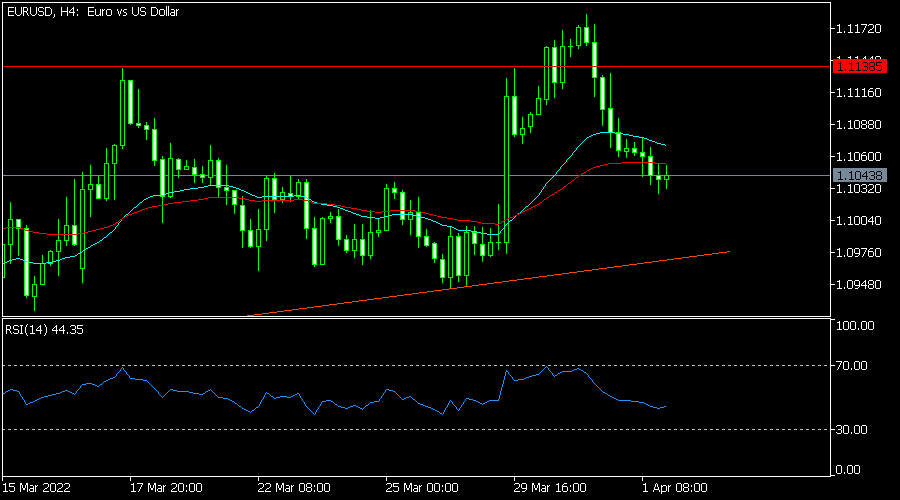
The EURUSD pair maintained a bearish trend as the US dollar rose. It declined to a low of 1.1042, which was lower than last week’s high of 1.1185. It has also dropped below the important support at 1.1138, which was the highest point on March 18. It has also moved below the 25-day and 50-day moving average while the RSI has moved below the neutral point at 50. Therefore, the pair will likely keep falling today.
GBPUSD
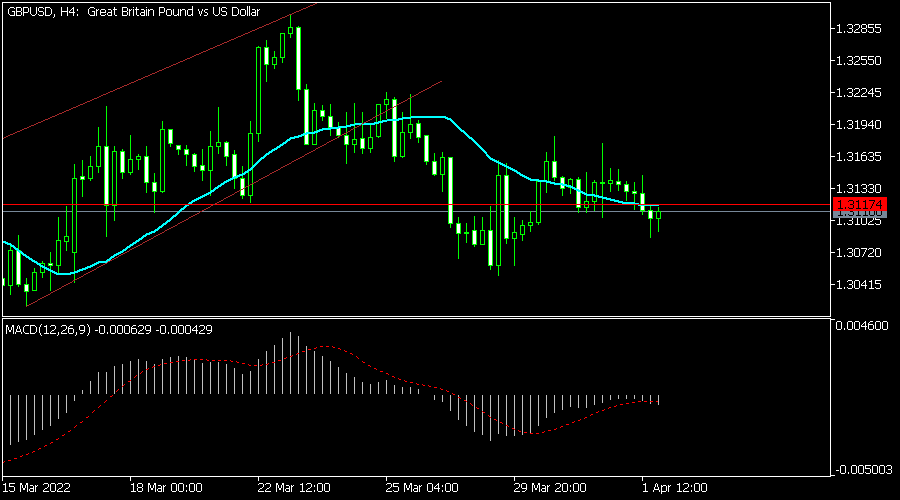
The GBPUSD has been in a tight range in the past few days. It is trading at 1.3110, which is also lower than March 23 high of 1.3296. It has also moved slightly below the 25-day moving average while the MACD is slightly below the neutral level. Therefore, the outlook for the pair is neutral with a bearish bias.
EURCHF
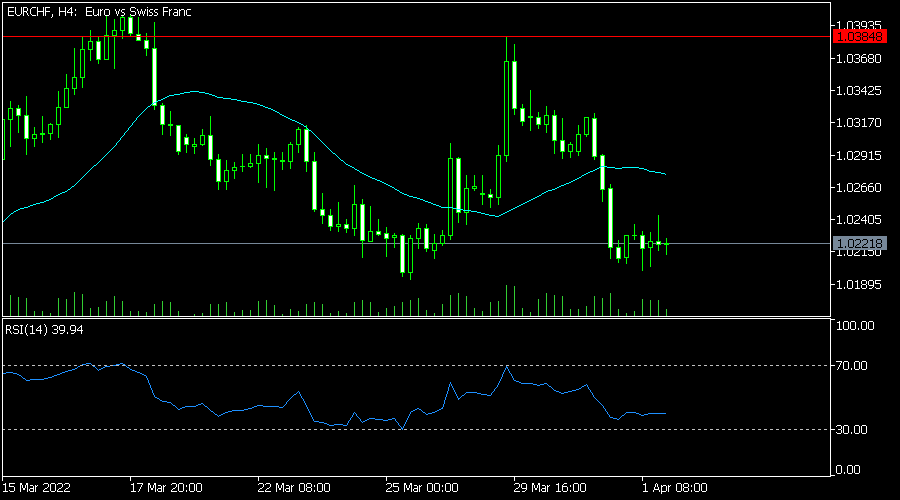
The EURCHF pair has been in a tight range in the past two days. It is trading at 1.0220, which is lower than last week’s high of 1.0384. On the four-hour chart, the pair has moved below the 25-day MA. It has also formed a small bearish flag pattern while the Relative Strength Index has moved slightly above the oversold level. Therefore, the pair will likely keep falling today.
Daily Technical Analysis
EUR/USD
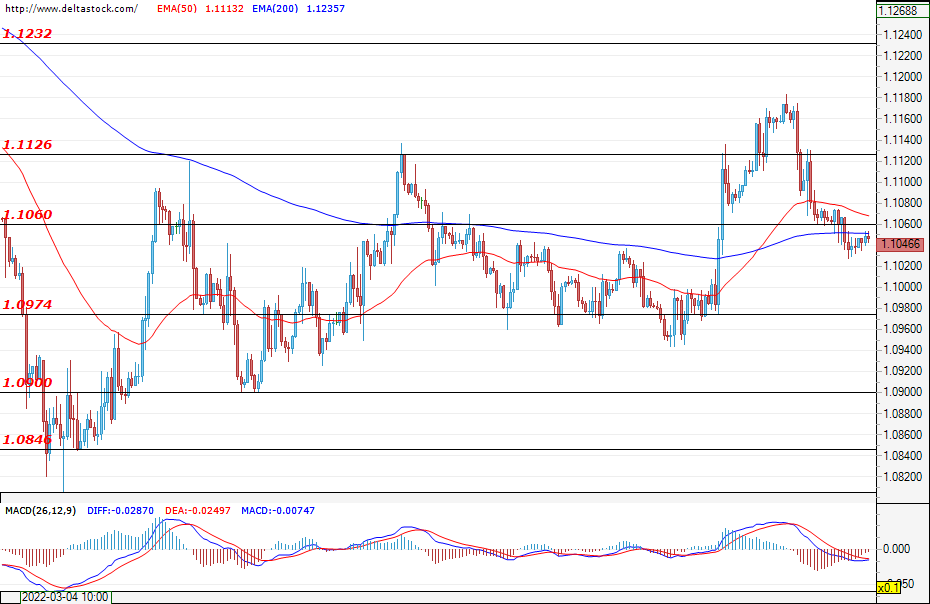
The currency pair is trading just below the support area at 1.1060, with the bears currently being in control of the market. This, in turn, could lead to another prolonged sell-off and a test of the next significant support at 1.0974. Alternatively, if the bulls manage to limit the sales around the current market levels, then we could see a rise towards the 1.1126 resistance instead. This week, only the Fed's meeting minutes (Wednesday; 19:00 GMT), when more detailed information on the U.S. monetary policy stance will be presented, would have a more serious impact on the movement of the currency pair.
USD/JPY
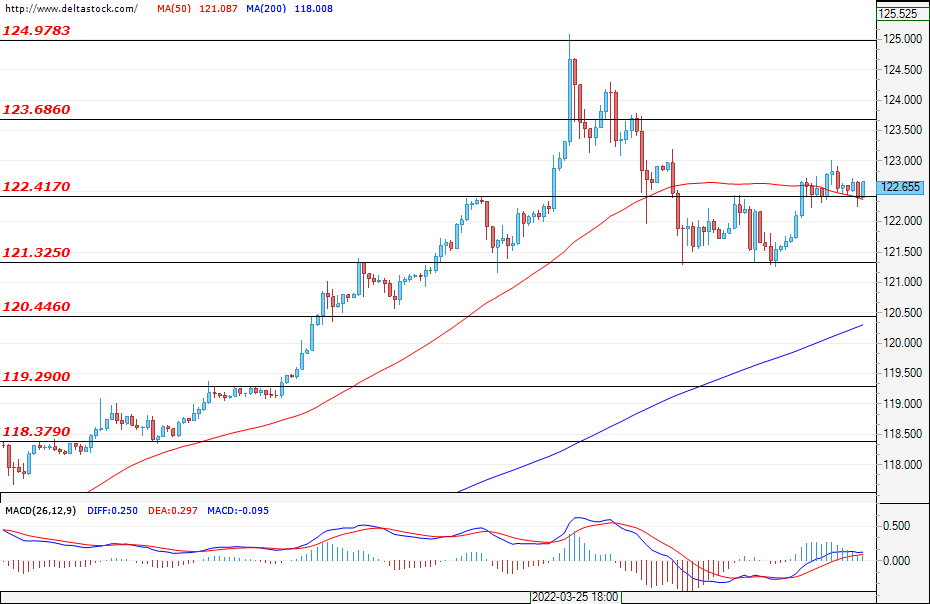
At the time of writing, the currency pair is consolidating just above the support level at 122.41. The sentiment for the moment remains neutral as the decline from the previous week was limited to the support level at 121.30. It is therefore possible to witness the formation of a range between 121.30 and 123.68.
GBP/USD
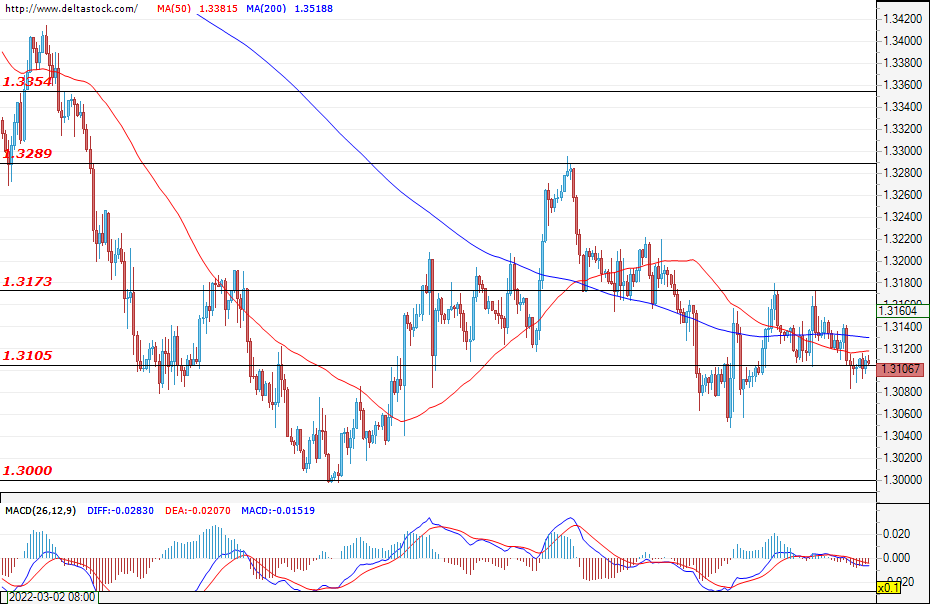
The pound consolidated at the 1.3105 support zone, and with a successful breach of the mentioned support, we could witness a subsequent depreciation and an attack on the support zone at 1.3000, which is the local bottom for the currency pair. A scenario, in which a range movement is formed in the narrow channel of 1.3105 – 1.3173, is not excluded, if the neutral sentiment from the last week is maintained. In the upward direction, the main resistance for the bulls is the upper boundary of the range at around 1.3173.
EUGERMANY40
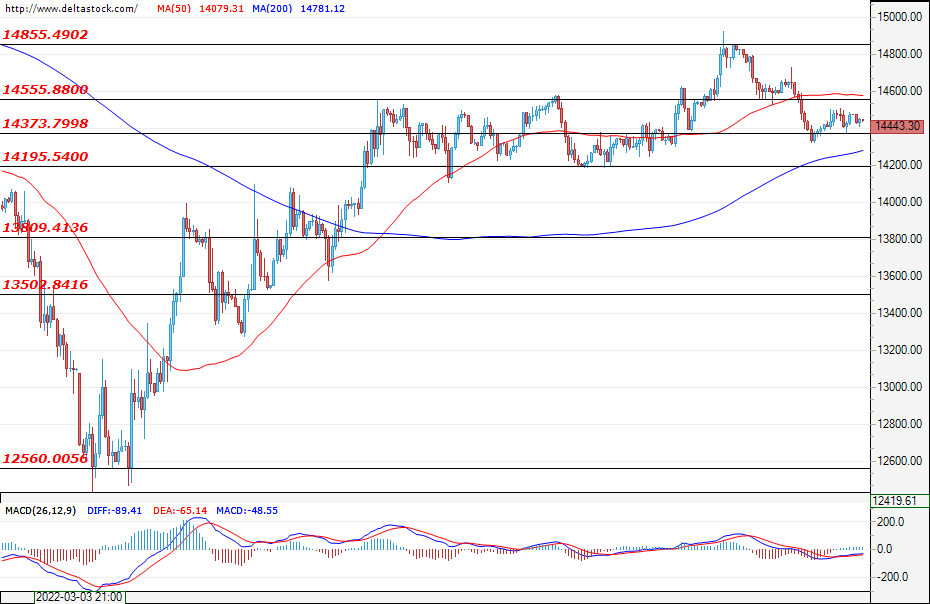
Over the past week, the German index lost some of its value and the most likely scenario is for the negative sentiment to remain intact throughout the week. An additional drop and an attack on the support zone at 14195 still cannot be ruled out. A successful breach of this level would give the bears a serious incentive and potentially help them seize full control over the market, bringing the index down towards the support level at 13800.
US30
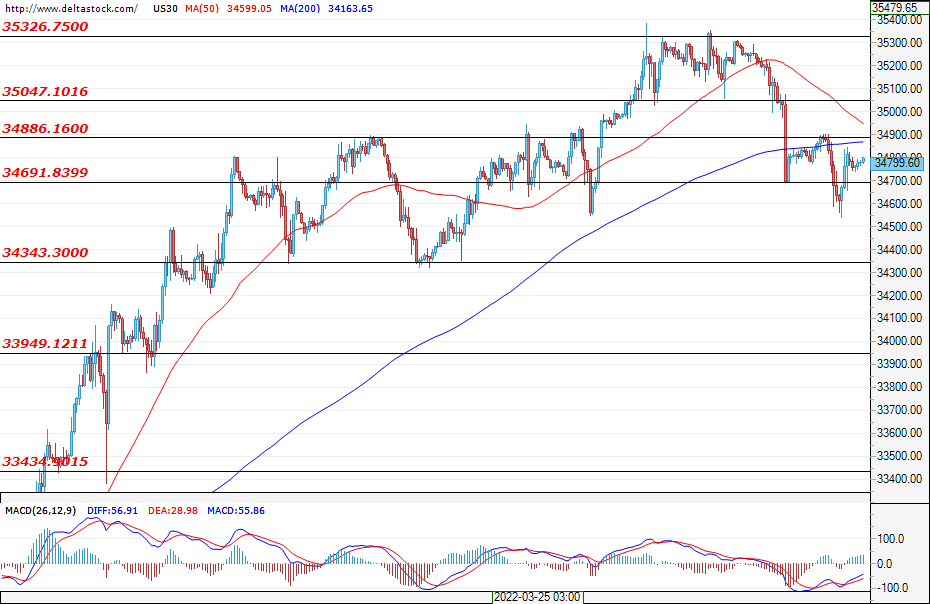
Both the German index and the U.S. blue-chip stock index recorded a week of losses. During the first trading session for this week, we see a consolidation around the level of 34800. However, if the support zone at 34690 is breached, then it is very likely for the bears to gain a foothold and we may witness a deepening of the sell-off towards the next support area at 34343, and in a more pessimistic scenario – down towards the 33950 support zone. The Fed's meeting minutes (Wednesday; 19:00 GMT) will be vital for the future course of the U.S. index. Increased volatility is therefore expected during the event.