Sample Category Title
EUR/USD Mid-Day Outlook
Daily Pivots: (S1) 1.1282; (P) 1.1336; (R1) 1.1364; More...
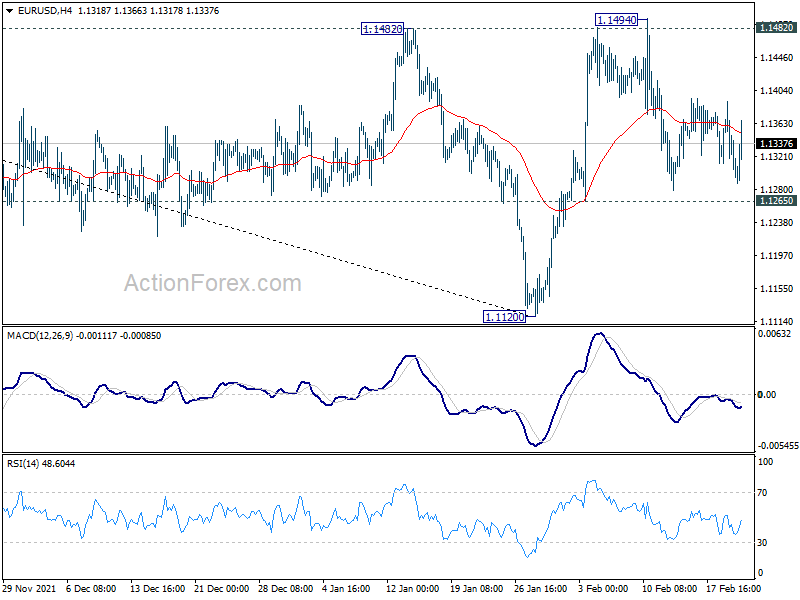
EUR/USD recovers notably after initial dip today, but stays well inside range of 1.1265/1482. Intraday bias remains neutral and outlook is unchanged. On the upside, firm break of 1.1482 will target 38.2% retracement of 1.2348 to 1.1120 at 1.1589 next. Sustained break there will argue that whole fall from 1.2348 has completed too and target 61.8% retracement at 1.1879. On the downside, however, break of 1.1265 support will dampen this bullish view and bring retest of 1.1120 low instead.
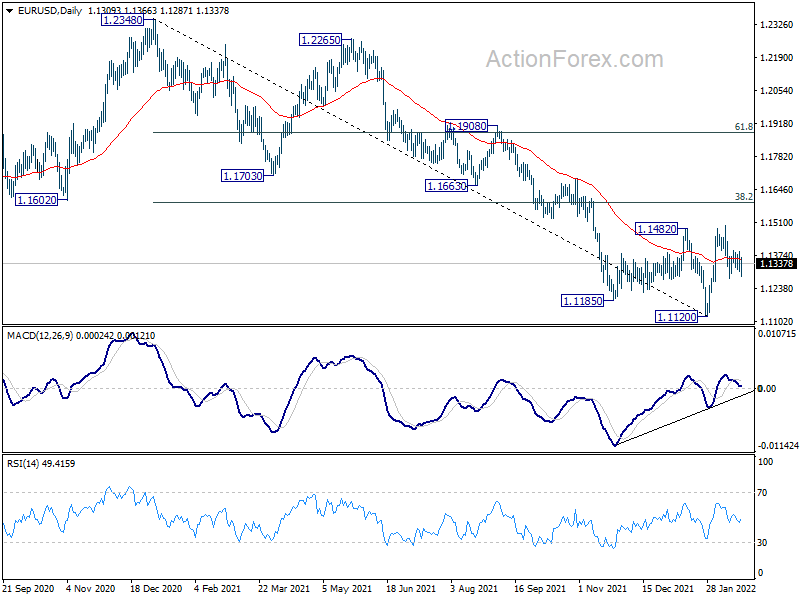
In the bigger picture, the decline from 1.2348 (2021 high) is seen as a leg inside the range pattern from 1.2555 (2018 high). Sustained trading above 55 week EMA (now at 1.1593) will argue that it has completed and stronger rise would be seen back towards top of the range between 1.2348 and 1.2555. However, firm break of 1.0635 (2020 low) will raise the chance of long term down trend resumption and target a retest on 1.0339 (2017 low) next.
Markets Surprisingly Calm Despite War Risks and Sanctions, Euro Recovers
The markets are surprisingly calm despite some initial volatility on escalation in Russia Ukraine situation. News of sanctions on Russia are staying to flow out, with the UK sanctioning five Russians banks and three individuals. Germany also put the certification of the Nord Stream 2 gas pipeline on hold. But there are just very little reactions in the markets.
Major European indexes are mixed in very tight range while DOW futures are just slightly down. Yields of benchmark treasuries are indeed rising. Gold is hovering around 1900 handle after initial rally lost momentum. WTI crude oil also retreats quickly after breaching 95.98 resistance very briefly.
In the currency markets, Kiwi and Aussie are currently the strongest ones. Euro is following closely with help from rally in German yields. Sterling remains the worst performing, but Swiss Franc and Yen are also weak. Dollar and Loonie are mixed in between.
At the time of writing, FTSE is up 0.24%. DAX is down -0.31%. CAC is down -0.03%. Germany 10-year yield is up 0.070 at 0.278. Earlier in Asia, Nikkei dropped -1.71%. Hong Kong HSI dropped -2.69%. China Shanghai SSE dropped -0.96%. Singapore Strait Times dropped -1.04%. Japan 10-year JGB yield dropped -0.0108 to 0.198.
BoE Ramsden: 50bps hike would have been warranted in Feb
BoE Deputy Governor Dave Ramsden said a speech, "personally I felt that the 0.5pp increase in Bank Rate would have been warranted in February, in line with a watchful and responsive approach to monetary policy".
"I have concerned about the emerging inflationary impetus from a tight labour market and from a broadening out in price pressures since last summer... have been voting for some front-loaded tightening in monetary policy since last September", he added.
"Looking ahead, like the rest of the Committee I judge that if the economy develops broadly in line with the February MPR forecast, some further modest tightening in monetary policy is likely to be appropriate in the coming months," he said".
Nevertheless he emphasized that the word " modest" was "significant". "I do not envisage Bank Rate rising to anything like its pre-2007 level of 5% or above, let alone to the kind of levels we used to see before the MPC was formed in 1997," he said.
Germany Ifo business climate rose to 98.9, betting on an end to coronavirus crisis
Germany Ifo Business Climate rose from 96.0 to 98.9 in February, above expectation of 96.5. Current Assessment Index rose from 96.2 to 98.6, above expectation of 96.6. Expectations index rose from 95.8 to 99.2, above expectation of 96.5.
By industry, manufacturing rose from 20.0 to 23.5. Services rose from 7.7 to 13.5. trade rose from -1.3 to 6.6. Construction rose from 8.0 to 8.3.
Ifo said, "the German economy is betting on an end to the coronavirus crisis. However, the escalation of the crisis engulfing Ukraine remains a risk factor."
EUR/USD Mid-Day Outlook
Daily Pivots: (S1) 1.1282; (P) 1.1336; (R1) 1.1364; More...
EUR/USD recovers notably after initial dip today, but stays well inside range of 1.1265/1482. Intraday bias remains neutral and outlook is unchanged. On the upside, firm break of 1.1482 will target 38.2% retracement of 1.2348 to 1.1120 at 1.1589 next. Sustained break there will argue that whole fall from 1.2348 has completed too and target 61.8% retracement at 1.1879. On the downside, however, break of 1.1265 support will dampen this bullish view and bring retest of 1.1120 low instead.
In the bigger picture, the decline from 1.2348 (2021 high) is seen as a leg inside the range pattern from 1.2555 (2018 high). Sustained trading above 55 week EMA (now at 1.1593) will argue that it has completed and stronger rise would be seen back towards top of the range between 1.2348 and 1.2555. However, firm break of 1.0635 (2020 low) will raise the chance of long term down trend resumption and target a retest on 1.0339 (2017 low) next.
Economic Indicators Update
| GMT | Ccy | Events | Actual | Forecast | Previous | Revised |
|---|---|---|---|---|---|---|
| 23:50 | JPY | Corporate Service Price Index Y/Y Jan | 1.20% | 1.20% | 1.10% | |
| 07:00 | GBP | Public Sector Net Borrowing (GBP) Jan | -3.7B | -3.6B | 16.1B | |
| 09:00 | EUR | Germany IFO Business Climate Feb | 98.9 | 96.5 | 95.7 | 96.0 |
| 09:00 | EUR | Germany IFO Current Assessment Feb | 98.6 | 96.6 | 96.1 | 96.2 |
| 09:00 | EUR | Germany IFO Expectations Feb | 99.2 | 96.5 | 95.2 | 95.8 |
| 14:00 | USD | S&P/Case-Shiller Home Price Indices Y/Y Dec | 18.00% | 18.30% | ||
| 14:00 | USD | Housing Price Index M/M Dec | 1.10% | 1.10% | ||
| 14:45 | USD | Manufacturing PMI Feb P | 56 | 55.5 | ||
| 14:45 | USD | Services PMI Feb P | 53 | 51.2 | ||
| 15:00 | USD | Consumer Confidence Feb | 110.2 | 113.8 |
Another Day, Another RollercoasterRide
Volatility is the only thing that appears to be certain in the markets right now, as European stocks pare losses to even sneak into positive territory on the day while US futures now eye only a small decline after the bank holiday weekend.
The old adage goes that the market hates uncertainty and while that has clearly been evident at times over the last couple of weeks, there's no doubt that investors continue to be tempted back in at the slightest hint of diplomacy winning the day. Even after the events of the last 24 hours and all of the rhetoric that's accompanied it, there remains hope.
Russia still claims to desire a diplomatic solution to the crisis in Ukraine, despite being the catalyst for the latest escalation when recognising the independence of two separatist regions. That decision has invited a barrage of criticism and sanctions will follow today which will no doubt damage diplomatic efforts that appeared to be making headway earlier this week.
Of course, while the latest developments look like a precursor to an invasion - and may well be just that - they could also be deliberate attempts to add further urgency to the situation and force people into serious negotiations. As it stands, investors appear to be hoping this is the case and as long as Russia continues to seek a diplomatic solution and troops remain on the right side of the border, interest in the dips will remain.
As the crisis deepens though, we will continue to see risks being priced in accordingly, and nowhere is that more evident than in Russian assets and the oil and gas markets. The move by Germany to halt certification of Nord Stream 2 following the events of the last 24 hours is not entirely surprising but does block what would have otherwise been one passage to alleviating pressures in the gas market in the coming months.
Oil eyeing $100 after Ukraine escalation
While stock markets are enjoying a partial recovery, oil and gas prices remain elevated as a conflict in Ukraine significantly increases the risk of disruptions to Russian supply. While there is reportedly no desire to intentionally restrict supplies in the face of further escalation, assurances will be taken with a pinch of salt given recent developments.
The market remains extremely tight for oil and gas and the risk of disruption will result in a significant risk premium for as long as the possibility of conflict remains. A nuclear deal between the US and Iran will alleviate some of the pressures in the oil market but as we're seeing, that's doing little to stop oil prices marching towards $100.
Gold pares gains but remains well supported
Gold is now trading a little lower on the day after trading as high as $1,913 earlier in the session as risk appetite has gradually improved. The recovery looks fragile at best and barring a significant positive development, it's hard to imagine gold not seeing plenty of support on the dips.
For so long, people have questioned gold's position as a safe haven and an inflation hedge but recent events have put that debate to bed. The yellow metal continues to trade around $1,900 and could go much further in the event of major escalation.
Bitcoin suffers in risk-averse trade
Bitcoin is seeing some reprieve today after falling more than 15% since last Thursday. Risk aversion has weighed heavily on the cryptocurrency and in the absence of a significant improvement in Ukraine, we could see further pressure on it and other risk assets. With bitcoin back below $40,000, the focus switches back to recent notable levels, including $36,250 - where it has seen support today - and $33,000. But the big level remains $30,000 which has been key for many months.
Gold Appears Exhausted after a Rally
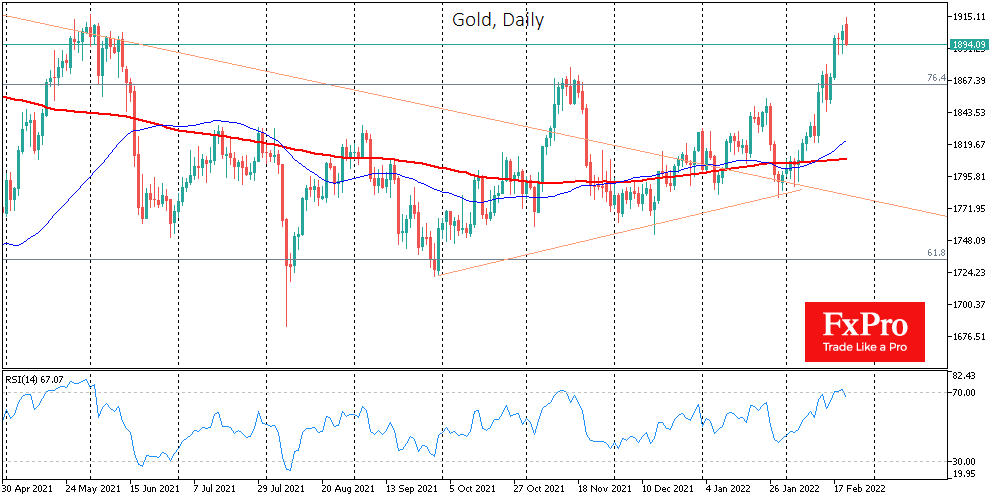
At the start of Tuesday’s trading, gold was close to $1914, its highest level since June last year. However, we already saw a pullback under $1895 and a 0.45% drop.
Interestingly, today’s opening gold rally seems more like a knee-jerk reflex to the news headlines rather than a panicked flight to the safe haven. The momentum of last week’s rise has been draining in recent days. The increasingly heated situation in eastern Ukraine, the collapse of Russian stock indices, and the more than 4% dip in European stock indices did little to move gold yesterday.
Producers such as Barrick Gold are getting a competitive advantage from the current situation, and they rose impressively last week. Still, today their prices are moderately lower as the stock is slightly overheated after a 20% rise since February 11th.
Despite the agitating geopolitical situation in Eastern Europe, there is a relatively muted demand for other safe assets. The yen and the franc have been rising steadily against the euro over the last couple of weeks, and on Tuesday morning, we saw some of the recent gains recede.
From the dynamics by the end of this week, we might be able to tell if this means a temporary pause in the rally or a reversal downwards again, as we saw in the middle of last year. Right now, the chances of both a breakout scenario and a corrective pullback from the rally since late January are roughly equal.
In a retracement scenario, gold might pull back to $1880, but it will probably stay there until it reaches $1865. If we see only a pause in trading before a new buying wave and gold gets back to rewrite the highs before the end of the week, we might see an avalanche of stop-orders triggered, accelerating the strengthening.
It took five weeks to go from $1780 to $2075 in 2020. Since the end of January, the momentum that started from the same levels has been proceeding at a similar pace.
EUR/USD and USD/JPY Look for Support: Elliott Wave Analysis
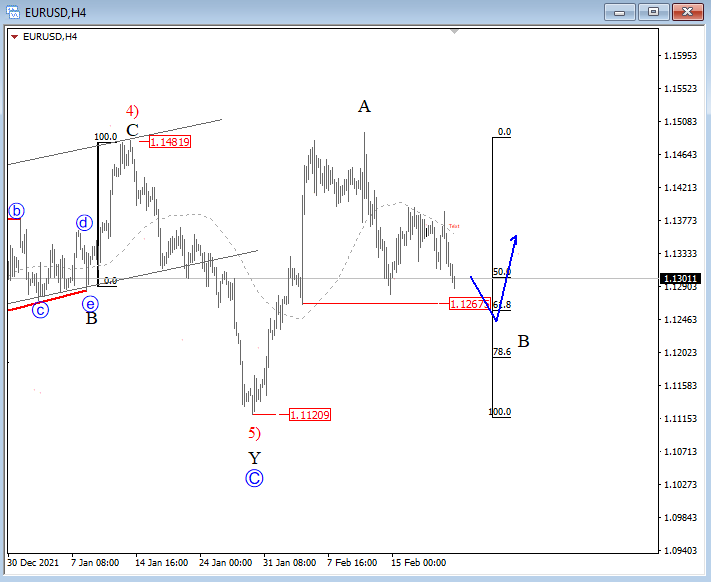
EURUSD made a sharp rise which is looking impulsive from 1.1121, so we assume that pair is bottoming and that more upside can be seen after a pullback. Support for current wave B can be at 1.1260 area but after three subwaves down.
EUR/USD 4h Elliott Wave analysis
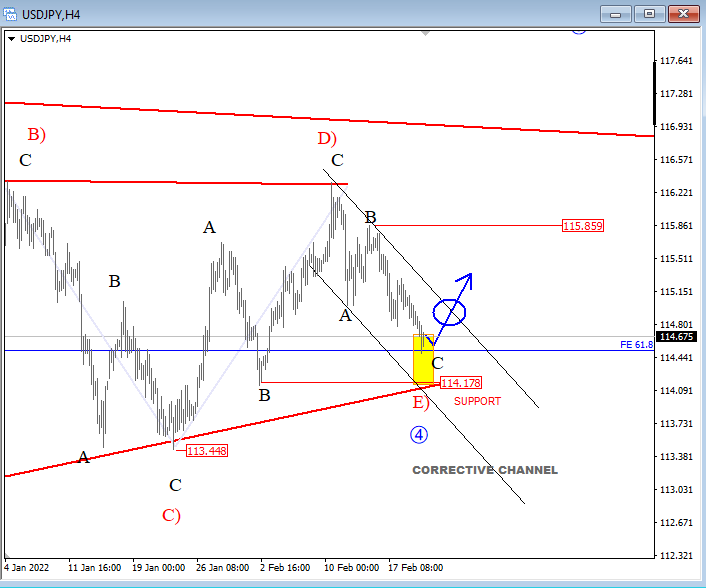
USDJPY is trading sideways for the last few weeks which now looks more and more like a bullish triangle, so we should be aware of more upside after wave E) that is now approaching 114.00-114.50 support area. This will be key support for bulls in this week when we will expect a bounce as long as 113.44 invalidation level is not breached. The next important invalidation level is at 112.54.
USD/JPY 4h Elliott Wave analysis
Euro Rises Despite Ukraine Escalation
Putin sends “peacekeepers” into eastern Ukraine
Panicky investors? Risk-off market? The euro isn’t having any of it, as EUR/USD has jumped 0.38% on the day. The Ukraine crisis is escalating, but the euro received a boost from German Ifo Business Climate for February, which rose to 98.9 and beat expectations.
Hopes of a summit between US President Biden and Russian President Putin were dashed on Monday after Putin announced that he would recognise two breakaway regions in Ukraine controlled by pro-Russian separatists. This was quickly followed by Russia sending “peacekeepers” into those areas, which means Russian soldiers and weapons are being moved into eastern Ukraine. The US and UK responded by declaring they would slap Moscow with sanctions but did not release any details. The ball remains in Putin’s court – will he order an invasion of Ukraine?
The ratcheting of the crisis by Russia’s latest moves has sent the equity markets tumbling as panicky investors head for safety, but we’re not seeing the same response in the forex markets. The euro has been a reliable barometer of the level of the crisis until now, as Ukraine is geographically close to the eurozone and the bloc is completely dependent on Russian energy supplies. If the situation continues to deteriorate, we could see the euro lose ground.
The Federal Reserve, is widely expected to raise rates at its March meeting. The most likely scenario is a traditional hike of 25 basis points, but traders shouldn’t rule out a 50-bps move. On Monday, Fed Governor Michelle Bowman suggested she was open to a 50-bps move if it was warranted by the economic data. At the same time, if the Ukraine crisis deteriorates further, the Fed could decide that it’s not the right timing to raise rates in the middle of a massive geopolitical crisis and could hold off with a rate hike.
EUR/USD Technical
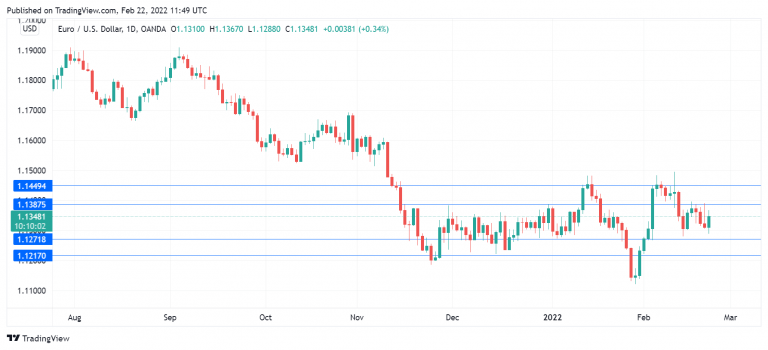
- EUR/USD is testing resistance at 1.1387. Above, there is resistance at 1.1449
- There is support at 1.1271 and 1.1217
Stocks Plunge, Oil Surges as Russian Troops Enter Breakaway Regions
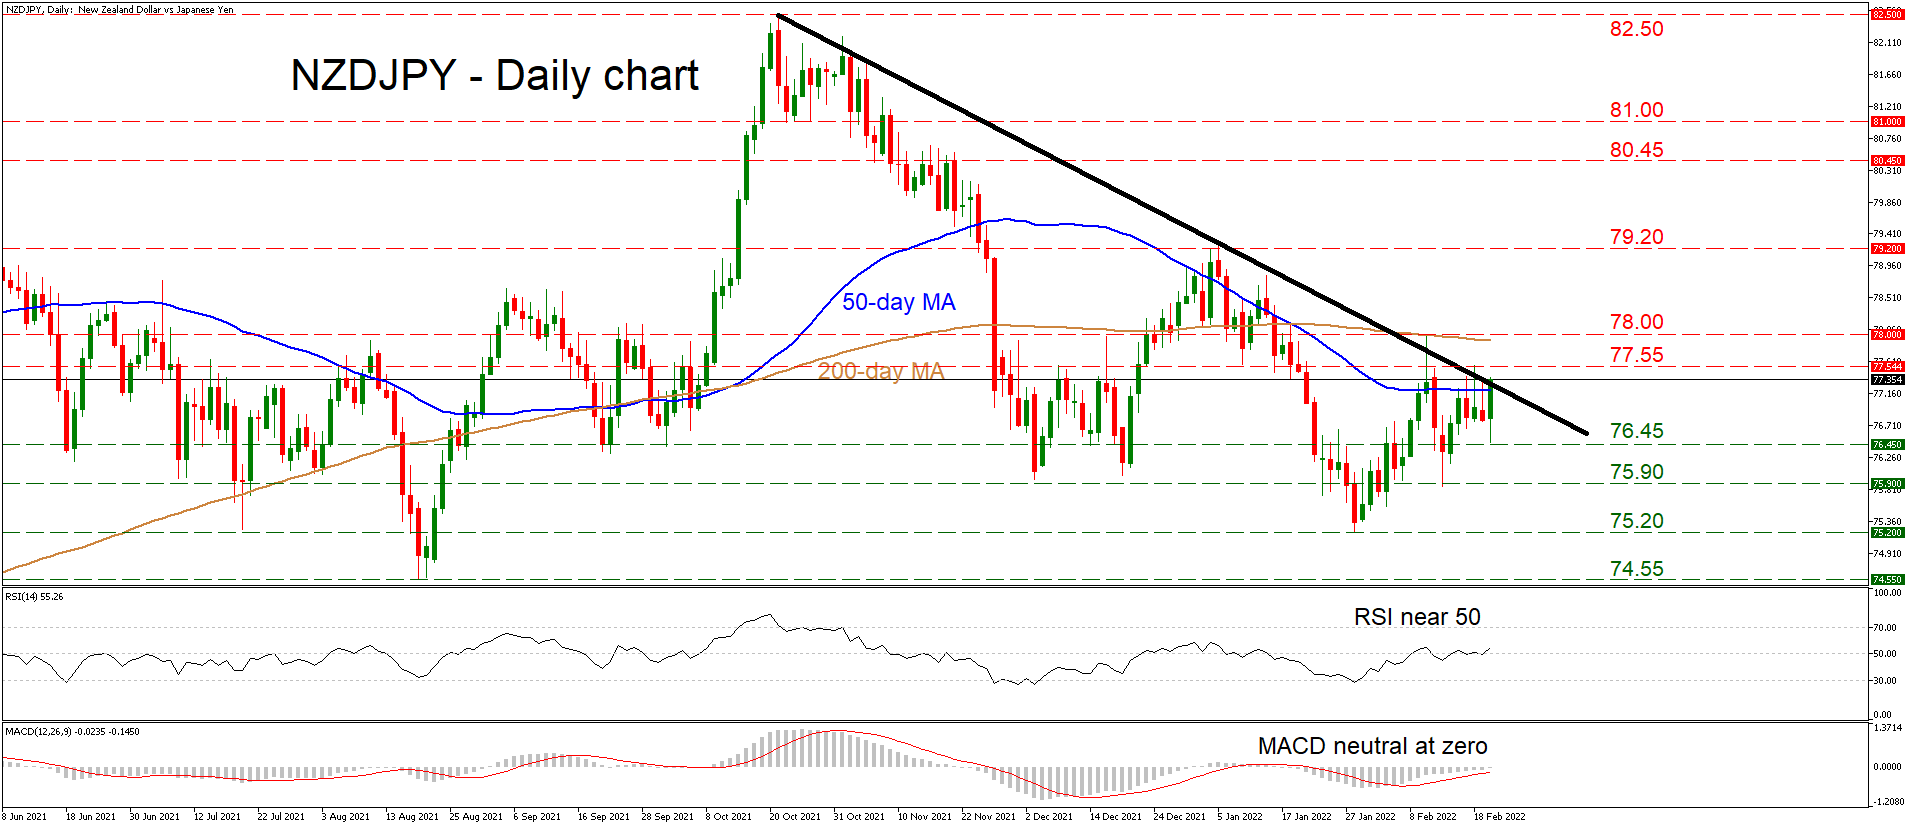
NZDJPY has been printing lower highs and lower lows since October, trading beneath a downtrend line. The bulls have taken the wheel in recent sessions and are trying to break above this trendline. If they succeed, that could help turn the near-term picture neutral, from negative currently.
Neither the moving averages nor the short-term oscillators paint a clear picture at this stage. The moving averages have flattened completely, while both the RSI and the MACD are stuck around their neutral levels.
In case buyers manage to close above the downtrend line and the nearby high of 77.55, the spotlight would turn towards the 78.00 region, which also encompasses the 200-day moving average. If this crucial region is violated too, that would interrupt the series of lower highs on the daily chart and potentially open the door for a test of 79.20.
Now should the trendline reject the bulls and sellers take back the reins, the first obstacle to the downside might be the 76.45 zone. If that gives way, the next barrier could be the area around 75.90, which halted the retreat twice in December.
Summarizing, as long as the pair trades below the downtrend line, the picture seems negative. A potential break above the trendline and 77.55 would be encouraging, but a close above 78.00 is needed to confirm that the outlook has truly turned neutral.
BoE Ramsden: 50bps hike would have been warranted in Feb
BoE Deputy Governor Dave Ramsden said a speech, "personally I felt that the 0.5pp increase in Bank Rate would have been warranted in February, in line with a watchful and responsive approach to monetary policy".
"I have concerned about the emerging inflationary impetus from a tight labour market and from a broadening out in price pressures since last summer... have been voting for some front-loaded tightening in monetary policy since last September", he added.
"Looking ahead, like the rest of the Committee I judge that if the economy develops broadly in line with the February MPR forecast, some further modest tightening in monetary policy is likely to be appropriate in the coming months," he said".
Nevertheless he emphasized that the word " modest" was "significant". "I do not envisage Bank Rate rising to anything like its pre-2007 level of 5% or above, let alone to the kind of levels we used to see before the MPC was formed in 1997," he said.
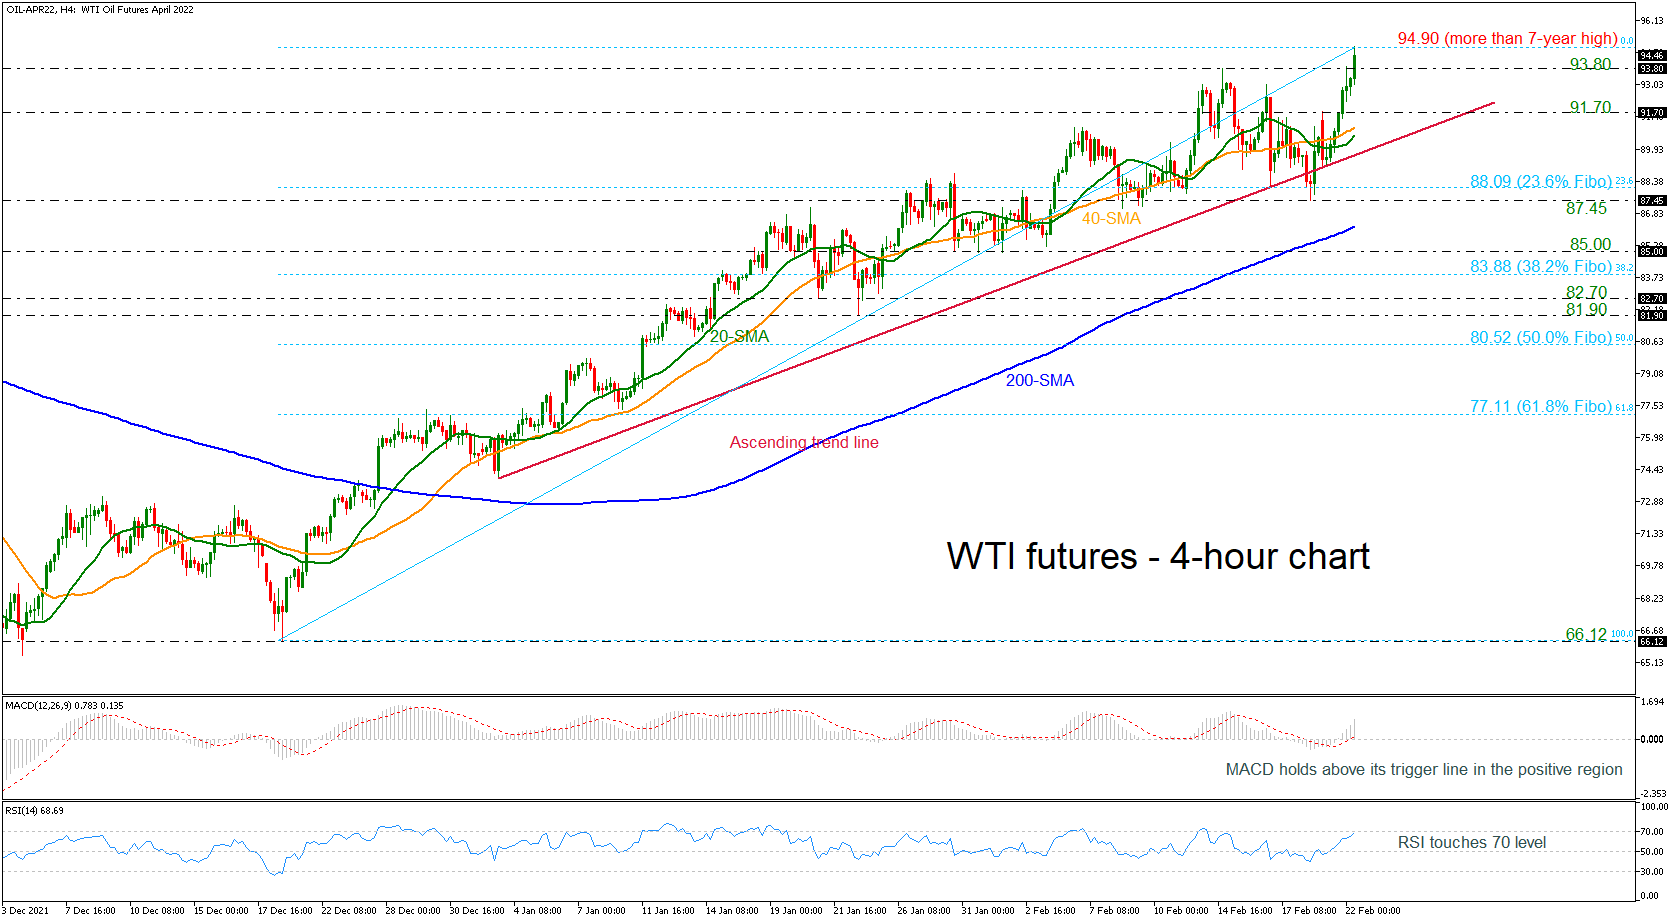
WTI Futures Rallies to Fresh Highs again Near 95.00
WTI crude oil futures are surging towards a more-than-seven-year high of 94.90, creating the eighth consecutive green four-hour session. The price rebounded off the short-term ascending trend line with the technical indicators mirroring the aggressive bullish structure. Specifically, the RSI is picking up speed around 70 and the MACD continues to distance itself above its red signal line.
Should the price decisively close above the multi-year high, bulls could extend the uptrend towards the next resistance at 98.74, taken from the inside swing low on May 2014. Further advances above this level, could then target the area around the 100.00 round figure.
On the other hand, a decline could meet the 93.80 and the 91.70 levels ahead of the 40- and 20-period simple moving averages (SMAs) at 91.00 and 90.63 correspondingly. Slightly lower, the price could retest the uptrend line near 89.90, which the market was unable to break in the previous couple of months. More bearish movements shift the focus to the 23.6% Fibonacci retracement level of the up leg from 66.12 to 94.90 at 88.09.
To summarize, oil prices have been in a strong positive tendency in the short- and medium-term timeframes and only a move beneath the 200-period SMA may change this outlook.
EURJPY Buyers Contest Decline and Break of MAs
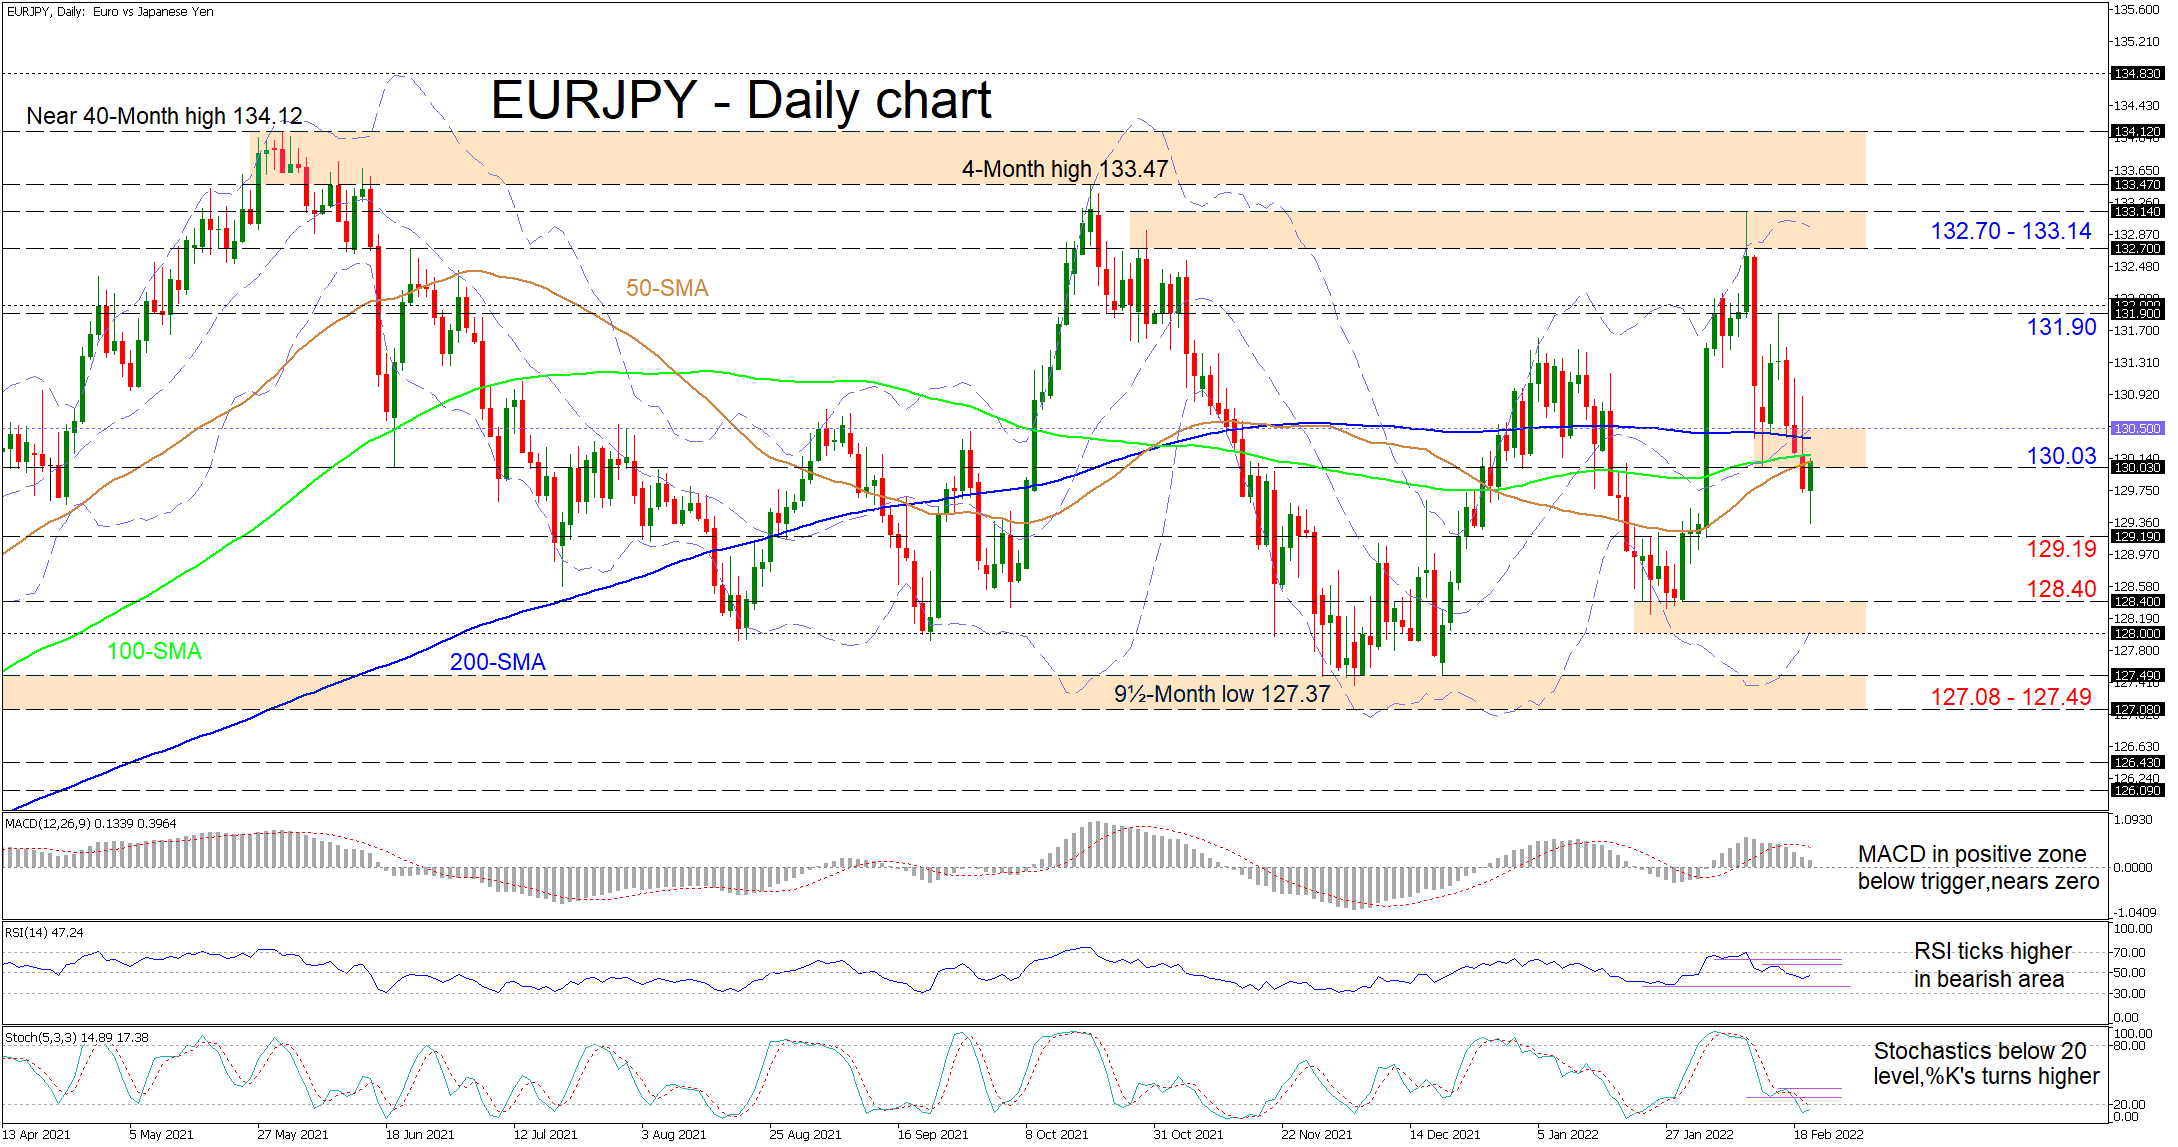
EURJPY bulls are pushing back after the converged simple moving averages (SMAs) failed to halt fresh plunges in the price. The SMAs are lacking any definitive trend suggestions but could now prove to be a tougher barrier for buyers to overstep.
The short-term oscillators are signalling that negative impetus in the pair has lost some might. The MACD’s decline below its red trigger line has softened slightly on its way to the zero threshold, while the RSI is improving in the bearish region. Furthermore, the stochastic %K line’s negative charge is waning in oversold territory.
As negative impetus continues to lose its might, the bulls may put pressure on the immediate resistance zone existing between the 130.03 inside swing low and the mid-Bollinger band at 130.50. Recapturing the region above this fortified barrier could boost upside momentum, propelling the price towards the 131.90 high and adjacent 132.00 handle. If bullish pressures endure, the 132.70-133.14 boundary could then come under attack, which encapsulates the upper Bollinger band as well.
Otherwise, if sellers retake control, initial downside friction could evolve at the 129.19 obstacle before the bears dive to test the support zone from the 128.40 level until the 128.00 hurdle, where the lower Bollinger band currently resides. Breaching this too, negative pressures may then attempt to deepen the down move in the pair with a break of the significant 127.08-127.49 base, which has defended the broader positive structure since February 2021.
Summarizing, EURJPY’s latest bearish bearing remains intact below the flattened SMAs and the 131.90 high, despite buyer’s emergence beneath the moving averages.