Sample Category Title
Risk Aversion Sentiment Continues To Percolate
Notes/Observations
- Risk aversion sentiment on rapid spread of the omicron coronavirus variant and more potential restrictions; String of new Covid-related restrictions planned in Europe, Moderna prelim booster data helps revers some sentiment.
- UK Brexit Frost resignation highlights concerns of chaos within PM Johnson’s govt.
- Chinese property sector remains in focus as PBoC trims its 1-year LPR for the 1st time since the early stages of the pandemic.
Asia
- China PBOC Monthly Loan Prime Rate Setting Operation cut the 1-year rate for the 1st time since Apr 2020 by 5bps to 3.80%; maintained rate on 5-year LPR at 4.65%.
- Chinese property developer China Estates [127.HK] failed to receive sufficient shareholder support to take it private of an offer price of HK$4.00/shr.
- Chinese property developer Kaisa [1638.HK] missed total of $118.8M interest payments for bonds due 2021, 2023, 2025 notes and $400M in prinicpal payments for 2021 notes.
- Hong Kong Legislative Council elections saw just 30.2% of voter turnout (lowest on record), all candidates picked by China Communist Party and election under new rules.
Coronavirus
- Netherlands PM Rutte announced that a lockdowns was unavoidable due to a 5th wave of the pandemic.
- UK Health Sec Javid refused to rule out further coronavirus containment measures in England before Christmas.
- Italy govt said to be contemplating new virus restrictions in order to avoid a surge in cases.
- German govt said to be bracing for tighter contact restrictions to stem virus spread.
Europe
- Uk Brexit Min Frost resigned. Liz Truss to take over in position. Frosted noted that confident that Brexit was secured but had concerns about the government's direction.
- EU Commissioner McGuiness: On Brexit Min Frosts resignation: Noted that the name will change but the issues would not . EU planning to buildon progress already made.
- ECB's Holzmann (Austria) stated that could quickly assess if inflation was falling as expected in 2022 and adjust monetary policy accordingly.
- Turkey President Erdogan renewed pledges to continued pace of rate cuts; President referenced Islamic teachings on interest rate (Note: Turkey TRY currency (Lira) weakens beyond the 17 handle against the USD (fresh record lows).
Americas
- Sen Manchin (D-VW) stated that he would not support Biden's "Build Back Better" legislation.
- House Speaker Pelosi noted that Build Back Better package won’t have passed the law by year end but hopeful we’ll soon reach an agreement soon and pass the legislation asap next year.
- Goldman Sachs analyst lowers US GDP Q1 outlook to 2% (prior 3%) and Q2 to 3% (prior 3.5%).
Speakers/Fixed income/FX/Commodities/Erratum
Equities
- Indices [Stoxx600-1.5% at #, FTSE -1.7% at 7,146, DAX -2.1% at 15,204, CAC-40 -1.4% at 6,833, IBEX-35 -2.1% at 8,140, FTSE MIB -2.3% at 25,997, SMI -1.0% at 12,588, S&P 500 Futures -1.3%].
- Market Focal Points/Key Themes: European indices open lower across the board but moderated the losses ab it as the session progressed; omicrong fears blamed for the lack of risk appetite; all sectors start the day in the red, but the least negative ones include telecom and real estata; among sectors leading to the downside are materials and consumer disrectionary; effective date for Ryanair delisting from London trading (continues trading in Ireland); BNP sells its US operations to Bank of Montreal; Osram sells its Fluence unit to Signify; earnings expected during the upcoming US session inclue Nike and Micron Technology.
Equities
- Energy: Vestas VWS.DK -5.2% (price increases).
- Healthcare: Novo Nordisk NOVOB.DK -10.8% (delay to Wegovy); Genfit GNFT.FR +4.7% (analyst action).
- Industrials: ArcellorMitall MT.NL -2.8% (analyst action).
- Technology: BE Semi BESI.NL -3.9% ( Cuts outlook).
- Telecom: Telecom Italia TIT.IT -2.3% (Former CEO steps down from board).
Speakers
- ECB's De Cos reiterated Council view that unlikely to rate rates in 2022 if inflation behaved as expected.
- Some ECB members said to have sought explicit acknowledgement of upside risks to inflation in statement but were rebuffed by chief economist Lane.
- Joachim Nagel picked to run Germany’s Bundesbank (as speculated).
- Germany Fin Min Lindner stated that Inflation risks increase the importance of stability-oriented monetary policy.
- Former Brexit Min Frost: Left govt because could not support certain policies; have full admiration for PM Johnson.
- Poland Central Bank's Hardt reiterated view of seeing more rate hikes.
- Ukraine Central Bank Dec Minutes noted that the majority backed the 50bps hike to 9.00%.
Currencies/Fixed income
- Risk aversion flows put bid into the safe-haven plays of USD and JPY pairs. Greenback trying to build upon recent gains following an increasingly hawkish Fed.
- EUR/USD off the session lows by mid-day at 1.1260.
- GBP/USD was testing the 1.32 level in the aftermath of Lord Frost resignation as Brexit Min coupled with concerns that UK could tighten restrictions to contain the spread of the Omicron coronavirus variant.
- Turkey TRY currency (Lira) weakened beyond the 17 handle against the USD (fresh record lows). Move followed Turkey President Erdogan renewed pledges to continued pace of rate cuts; President referenced Islamic teachings on interest rate.
Economic data
- (TW) Taiwan Nov Export Orders Y/Y: 13.4% v 5.2%e.
- (EU) Euro Zone Oct Current Account (seasonally adj): €18.1 v €17.6B prior.
- (CH) Swiss weekly Total Sight Deposits (CHF): 722.7 v 722.7B prior; Domestic Sight Deposits: 645.7 v 646.8B prior.
- (PL) Poland Q3 Unemployment Rate: 3.0% v 3.4%e.
- (PL) Poland Nov Sold Industrial Output M/M: +5.3% v -1.1%e; Y/Y: 15.2% v 8.2%e.
- (PL) Poland Nov PPI M/M: 1.0% v 2.0% prior; Y/Y: 13.2% v 12.0% prior.
- (IT) Italy Oct Current Account Balance: €5.5B v €4.7B prior.
- (PT) Portugal Oct Current Account: +€0.3B v -€0.1B prior.
- (GR) Greece Oct Current Account Balance: -€0.8B v -€0.2B prior.
- (BE) Belgium Dec Consumer Confidence: # v 1 prior.
Fixed income issuance
- None seen.
Looking ahead
- (CO) Colombia Nov Industrial Confidence: No est v 12.2 prior; Retail Confidence: No est v 41.7 prior.
- 05:25 (EU) Daily ECB Liquidity Stats.
- 06:00 (UK) Dec CBI Industrial Trends Total Orders: 20e v 26 prior; Selling Prices: 60e v 67 prior.
- 06:00 (PT) Portugal Nov PPI M/M: No est v 2.4% prior; Y/Y: No est v 15.9% prior.
- 06:25 (BR) Brazil Central Bank Weekly Economists Survey.
- 06:45 (US) Daily Libor Fixing.
- 07:00 (IN) India announces details of upcoming bond sale (held on Fridays).
- 08:00 (UK) Daily Baltic Dry Bulk Index.
- 08:30 (UR) Ukraine Q3 Final GDP Q/Q: No est v 1.4% prelim; Y/Y: No est v 5.4% prelim.
- 10:00 (US) Nov Leading Index: 0.9%e v 0.9% prior.
- 10:00 (CO) Colombia Oct Trade Balance: -$1.4Be v -$1.7B prior; Total Imports: 5.7Be v $5.7B prior.
- 16:00 (KR) South Korea Nov PPI Y/Y: No est v 8.9% prior.
- 17:30 (AU) Australia ANZ Roy Morgan Weekly Consumer Confidence Index: No est v 108.0 prior.
- 19:00 (KR) South Korea Dec 1-20th Exports Y/Y: No est v 20.4% prior; Imports Y/Y: No est v 42.3% prior.
- 19:01 (UK) Dec Lloyds Business Barometer: No est v 40 prior.
- 19:30 (AU) RBA Dec Minutes.
- 21:00 (NZ) New Zealand Nov Credit Card Spending M/M: No est v 8.4% prior; Y/Y: No est v -5.6% prior.
- 23:30 (HK) Hong Kong to sell 3-month, 6-month and 12-month Bills.
AUD/USD Pair Is Now Declining Below 0.7150
The Aussie Dollar started a fresh decline from well above 0.7200 against the US Dollar. The AUD/USD pair traded below the 0.7180 support to move into a bearish zone.
The pair even traded below the 0.7150 level and the 50 hourly simple moving average. It is now declining and approaching the 0.7100 support zone. There is also a key bearish trend line forming with resistance near 0.7135 on the hourly chart.
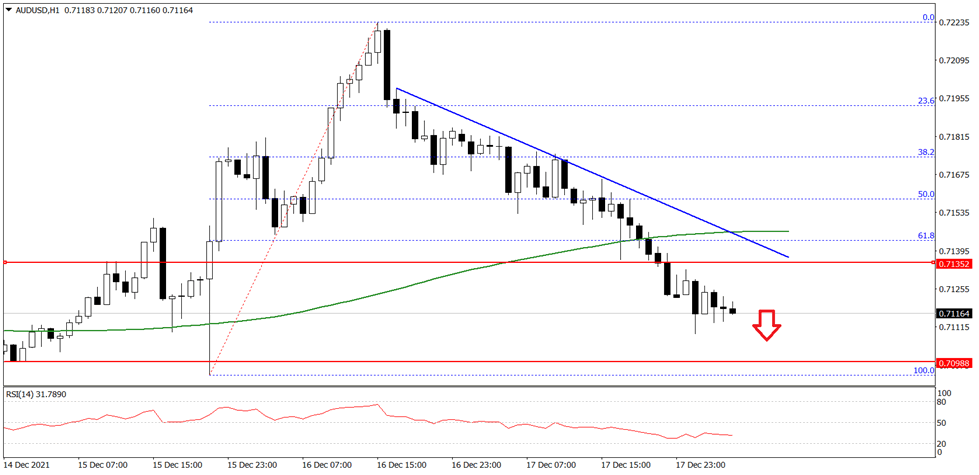
The next major resistance is near the 0.7150 level and the 50 hourly SMA, above which the pair could rise steadily towards the 0.7200 level in the near term.
An immediate support on the downside is near 0.7100 on FXOpen. The next key support is near the 0.7080 level. A clear break below the 0.7080 support could lead the pair towards the 0.7000 support.
The Dollar Index Is Rising Amid The Fed’s Statements About The Imminent Increase In Interest Rates
Last week, investors were focused on the decision of the central banks in the United States, Great Britain, Switzerland, Japan, the Eurozone, and closely watched inflation data in European countries, Great Britain, and Canada. Following Wednesday's FOMC meeting, the US Federal Reserve doubled the pace of reducing the quantitative easing program to $30 billion a month. At the same time, Fed officials forecast 3 rate hikes in 2022 and 3 rate hikes in 2023. On Thursday, the Bank of England unexpectedly raised its key rate to 0.25% from 0.1%. At the same time, the central bank has left the volume of the program of state bond purchase at the level of 875 billion pounds.
The European Central Bank left monetary policy unchanged but raised its inflation forecasts and lowered expectations for economic growth in 2022 because of the Omicron option. The Swiss National Bank (SNB) stayed true to its ultra-soft monetary policy, deviating from its tightening course. As for inflation, the consumer price index and the producer price index broke records in nearly all countries.
It is not surprising that more and more central banks are turning to more aggressive measures to fight inflation, from cutting stimulus programs to raising interest rates. Federal Reserve officials said on Friday that the first interest-rate hike could come as soon as March. Investors began shifting their portfolios back to the "cash," which led to an increase in the dollar index and a decrease in the stock indices quotes.
The US stock market closed in the red area on Friday. The Financial sector fell by 2% as 10-year yields fell below 1.4% due to concerns about the impact of the Omicron strain. The Dow Jones index (US30) decreased by 1.48% (-1.65% for the week), the S&P 500 index (US500) decreased by 1.03% (-1.90% for the week), and the NASDAQ technology index (US100) lost 0.07% and became the leader of the fall for the week (-2.89%) among US indices.
A Goldman Sachs study found that the US stock market has grown very disproportionately over the past year. The giants TSLA, NVDA, GOOGL, MSFT, and AAPL showed 35% growth in the S&P 500 index. And if you look at April, they gave a total of 50%. FB and AMZN increased slightly, and the remaining 493 companies in the index traded within +-2% over the past year.
At the end of each year, the largest investment companies evaluate the prospects for markets and give forecasts for the main stock indices. JPMorgan Chase Bank predicts growth in the US stock market next year. Analysts expect the rise of the S&P 500 index (US500) to 5050 points. The potential growth from current levels is about 8%. The chief strategist of Goldman Sachs, David Kostin, expects that by the end of 2022, the S&P 500 (US500) index will rise to 5100 points (+9%) due to the continued growth of corporate earnings. Morgan Stanley expects the S&P 500 (US500) index to decline to 4,400 points over the next 12 months.
Pharmaceutical company Pfizer expects sales of the Covid-19 vaccine to be about $31 billion in 2022.
The World Health Organization said a variant of the Omicron coronavirus had been detected in 89 countries. According to the study, the probability of re-infection with Omicron is five times higher than that of the Delta. Scientists predict that Omicron will lead to record hospitalizations and tremendous strain on health care systems in all countries.
European stock indexes were traded without a single dynamic on Friday. British FTSE 100 (UK100) gained 0.13% on Friday (-0.30% for the week), German DAX (DE40) decreased by 0.67% (-0.78% for the week), Spanish IBEX 35 (ES35) decreased by 0.82% (-0.78% for the week) and French CAC 40 (FR40) lost 1.12% and became the leader of the fall among the main European indices.
France's consumer price index increased to 2.8% in November. According to INSEE, the main reasons for the increase were energy prices, industrial goods, and services. Spain's inflation rate reached 5.5%. This is lower than forecast, but the overall picture remains the same: inflation is at its highest level in 29 years and is rising faster than wages. Germany's statistical data showed that producer price inflation reached its highest level since 1951 at 19.2%.
Consumer prices in the Eurozone remained at a 4.9% level. Omicron strain infections continue to rise in the UK. The Netherlands imposed a lockdown until January 16 due to an increase in Omicron cases: stores, bars, restaurants, and other public places of prime necessity will be closed from December 19.
The EU has extended sanctions against Russia for six months.
Asian markets mostly traded in negative territory on Friday. Japan's Nikkei 225 (JP225) decreased by 1.79% (-0.56% for the week), Hong Kong's Hang Seng (HK50) decreased by 1.20% (-4.33% for the week), and Australia's S&P/ASX 200 (AU200) added 0.11% (-0.67% for the week). China's central bank cut its benchmark interest rate for the first time since the pandemic. The People's Bank of China cut the one-year lending rate to 3.8% from 3.85%. The five-year lending rate remained unchanged from the previous month at 4.65%. In China, domestic gasoline and diesel prices have been lowered since December 18.
At the commodities market, futures on orange juice (+9.03%), timber (+1.85%), and palladium (+1.5%) showed the biggest gains by the end of the week. Futures on natural gas (-6.52%), Brent oil (-3.03%), sugar (-2.94%), and WTI crude oil (-2.13%) showed the biggest drop.
Oil prices fell again last week, and gold closed above $1,800 a troy ounce for the first time in a month. The decline in oil prices has been attributed to Omicron fears, leading to a drop in fuel demand and last week's sharp drop in crude inventories. Gold ended the week with 1.1% growth, its highest weekly gain since early November. The rise in gold came after the Federal Reserve announced its heightened concern over inflation in the US and began cutting the QE program more quickly while scheduling several interest rate hikes next year. On the one hand, this should, on the contrary, have led to a decline in gold prices. But because of high inflation and low prices for the "yellow metal," investors began to buy gold again as a hedge against inflation.
Main market quotes:
- S&P 500 (F) (US500) 4,620.64 −48.03 (−11.03%)
- Dow Jones (US30) 35,365.44 −532.20 (−11.48%)
- DAX (DE40) 15,531.69 −104.71 (−10.67%)
- FTSE 100 (UK100) 7,269.92 +9.31 (+0.13%)
- USD Index 96.57 +0.63 (+0.66%)
Important events for today:
- Australia Mid-Year Economic and Fiscal Outlook at 02:30 (GMT+2);
- China PBoC Loan Prime Rate (m/m) at 03:30 (GMT+2).
The Analytical Overview Of The Main Currency Pairs
The EUR/USD currency pair
Technical indicators of the currency pair:
Prev Open: 1.1329
Prev Close: 1.1236
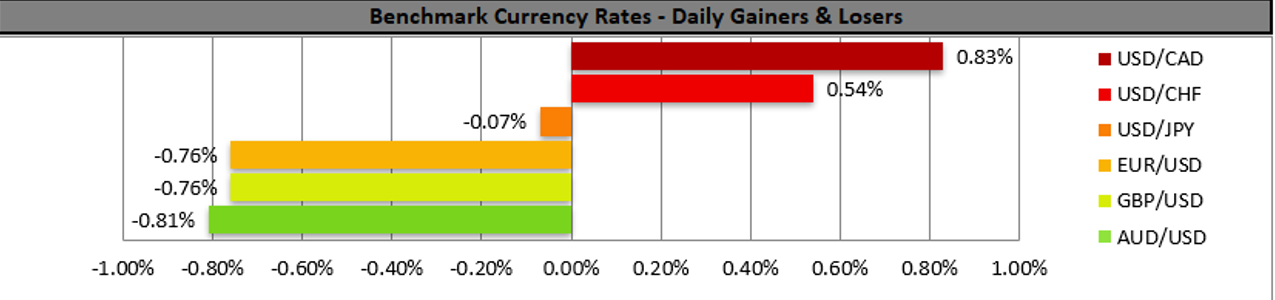
% chg. over the last day: -0.83%
The German producer price index, which shows the inflation rate between factories and large companies, reached a new absolute record of 19.2% on an annualized basis. High energy prices remain a major factor in the rise in inflation. Energy prices increased by 49.4% this year due to a strong increase in natural gas prices of 83.4%. Spain's inflation rate reached 5.5%. This is less than forecast, but inflation is at its highest level in 29 years, and it is rising faster than wages. The consumer price index in the Eurozone remained at 4.9% as expected.
Trading recommendations
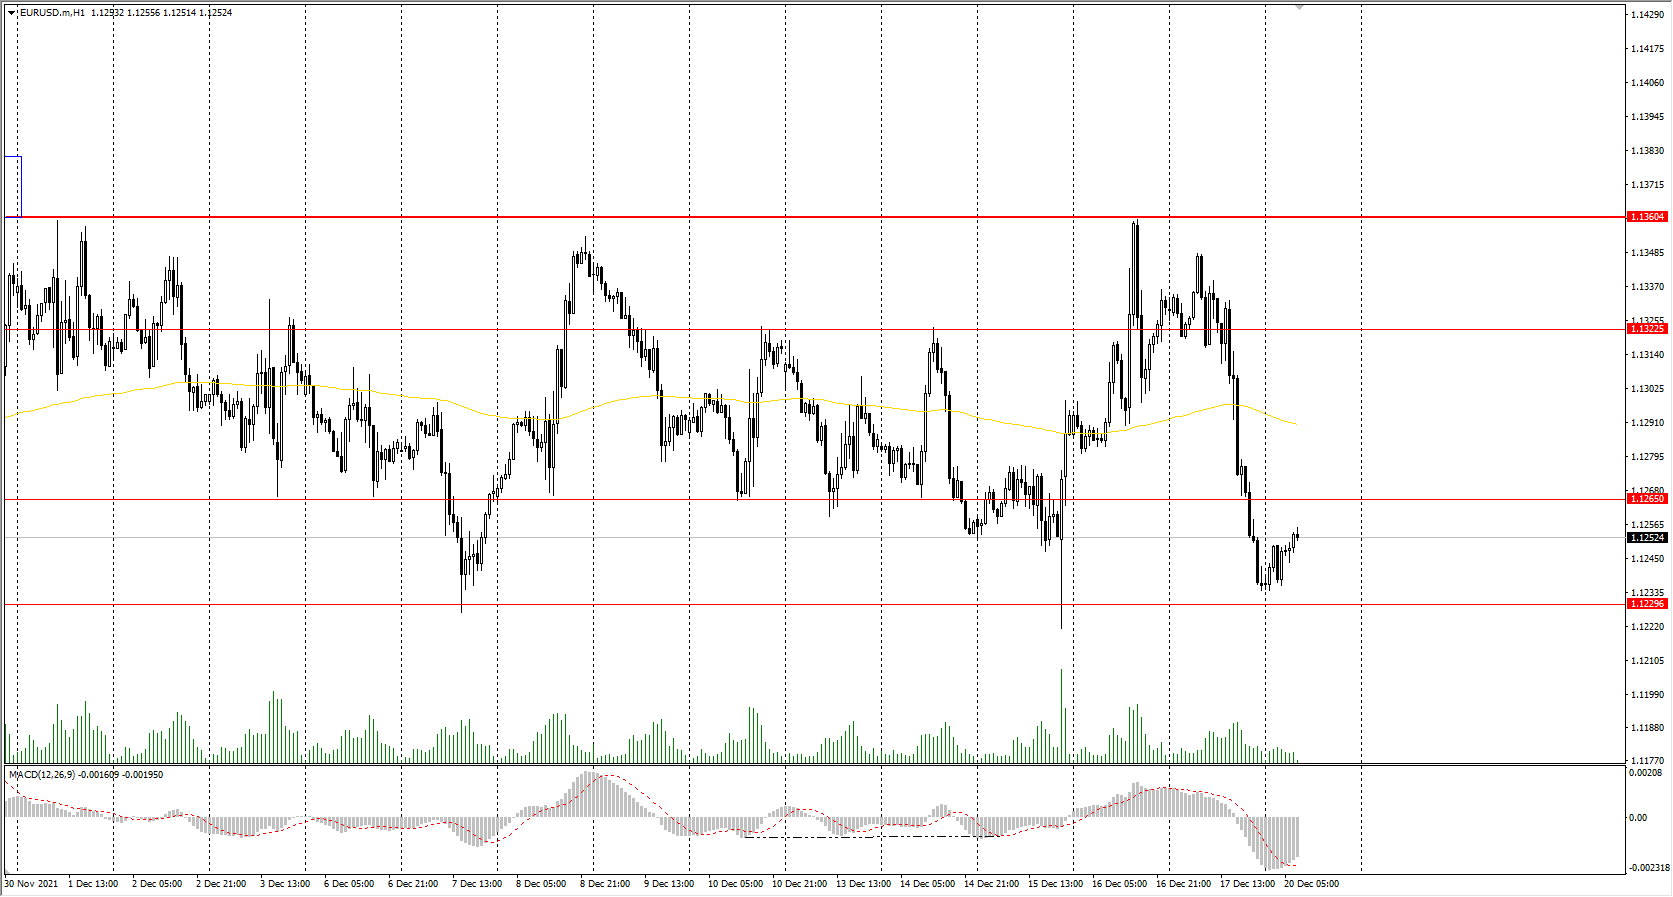
Support levels: 1.1230, 1.1168
Resistance levels: 1.1265, 1.1323, 1.1360, 1.1436, 1.1535, 1.1613, 1.1667, 1.1717
From a technical point of view, the EUR/USD on the hour time frame is still bearish. The price is trading in a wide corridor. Against the background of a sharp strengthening of the dollar index on Friday, the EUR/USD quotes fell sharply. The MACD indicator has become negative, sellers' pressure prevails. Under such market conditions, traders should consider sell positions from the resistance levels around the moving average. Buy trades can be considered on the lower time frames after the price fixes above the level of 1.1265.
Alternative scenario: if the price breaks out through the 1.1360 resistance level and fixes above, the mid-term uptrend will likely resume.
The GBP/USD currency pair
Technical indicators of the currency pair:
Prev Open: 1.3318
Prev Close: 1.3235
% chg. over the last day: -0.63%
UK retail sales increased by 1.4% in November; a rise of 0.8% was expected. Omicron strain infections in the UK continue to rise before the Christmas holidays. Official figures show a 52% increase in illnesses over the past week. Across the country, Premier League games, which have always been considered the most popular entertainment for Brits over the Christmas vacations, have begun to be canceled.
Trading recommendations
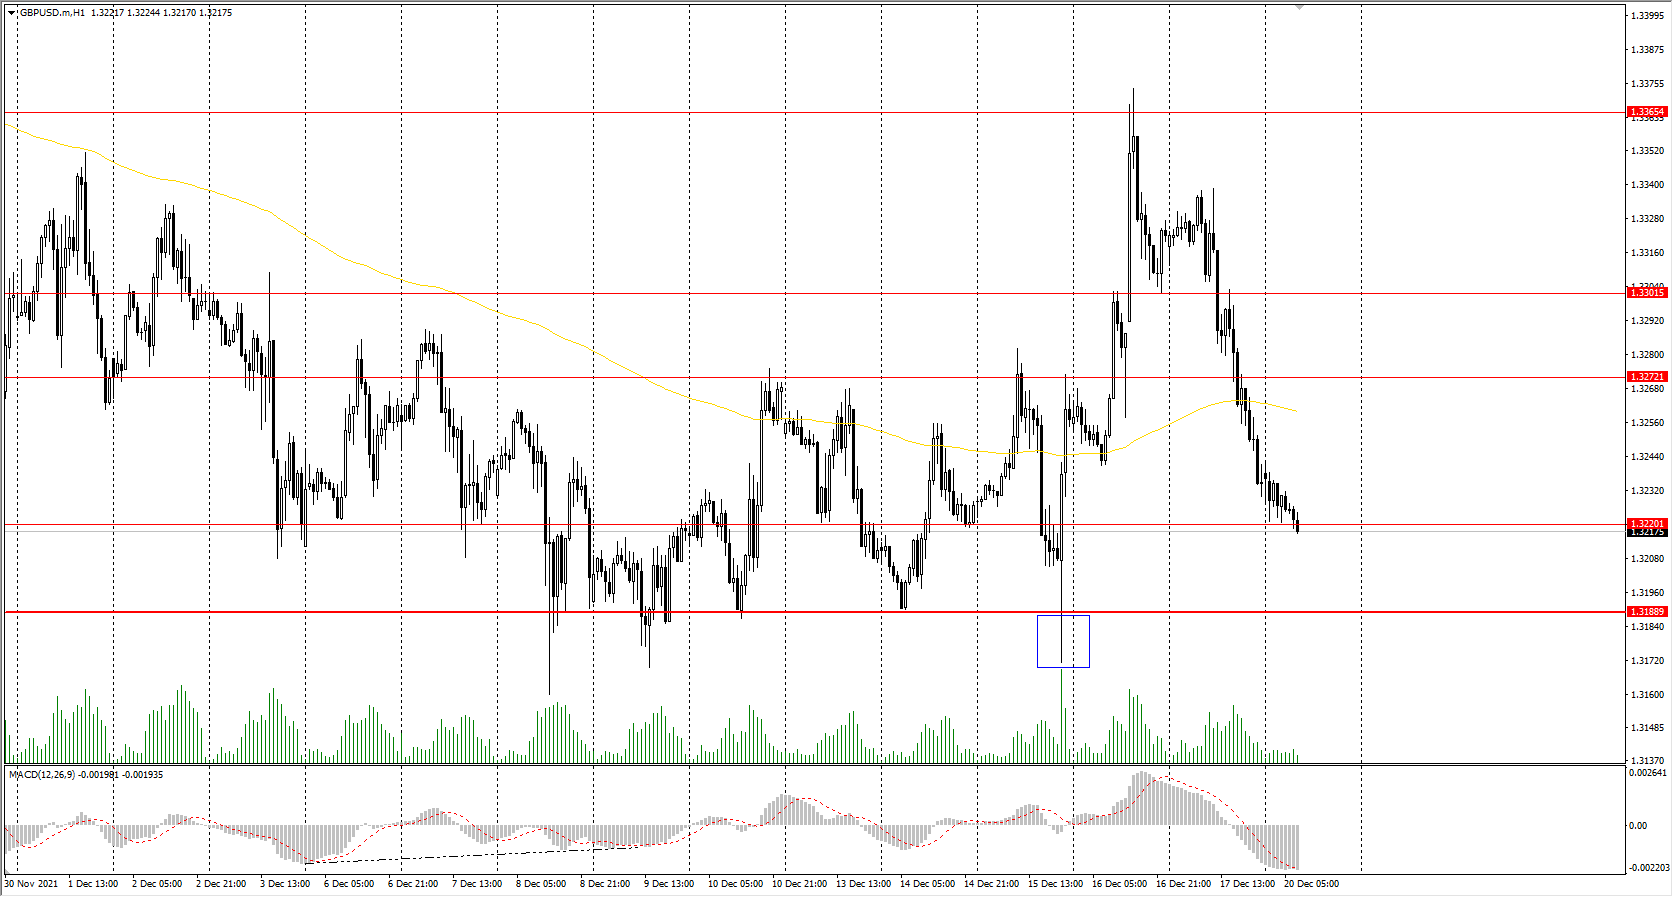
Support levels: 1.3220, 1.3189
Resistance levels: 1.3272, 1.3301, 1.3365, 1.3434, 1.3507, 1.3575, 1.3685
On the hourly time frame, the trend on GBP/USD is still bullish. But the rise in the dollar index led to the weakening of the British currency. The MACD indicator has become negative, sellers' pressure prevails. Under such market conditions, traders should consider buy positions from the nearest support levels but only with additional confirmation in the form of a buyers' initiative. Sell trades can be considered from the resistance levels near the moving average.
Alternative scenario: if the price breaks down through the 1.3189 support level and consolidates below, the bearish scenario will likely resume.
The USD/JPY currency pair
Technical indicators of the currency pair:
Prev Open: 113.62
Prev Close: 113.70
% chg. over the last day: +0.07%
From a fundamental point of view, the monetary policy of the Bank of Japan is aimed at active economic stimulation, while the US Federal Reserve, on the contrary, accelerated the reduction of the quantitative easing program last week. Such a situation is in favor of further growth of USD/JPY quotes.
Trading recommendations
Support levels: 113.30, 112.62, 112.30
Resistance levels: 113.95, 114.17, 115.15, 115.50
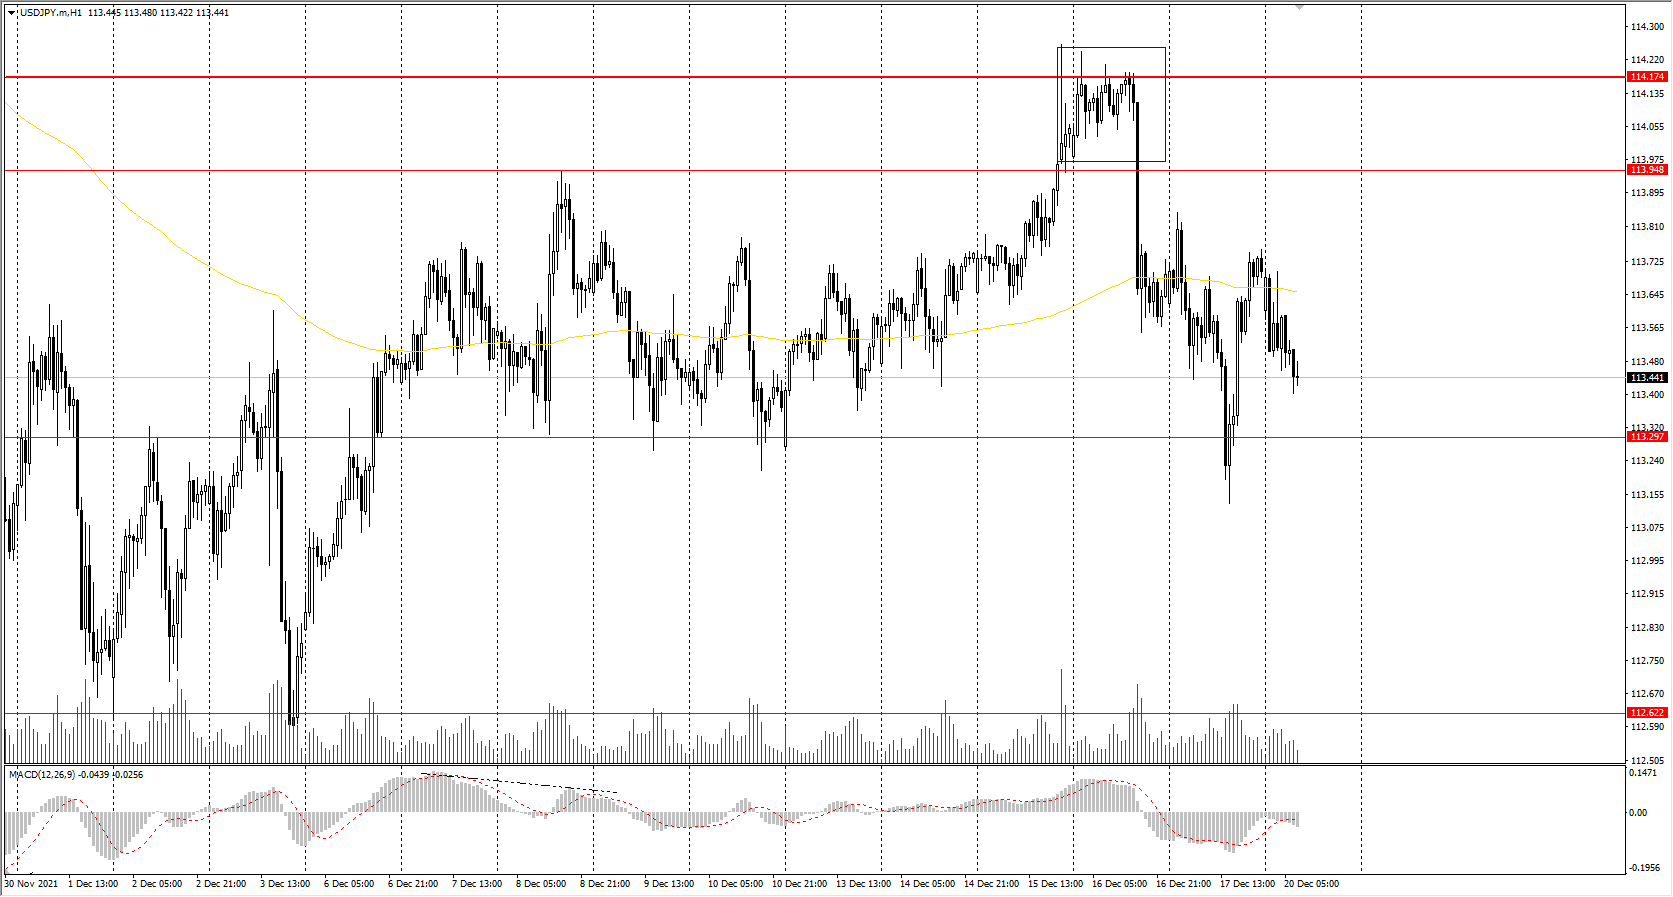
The global trend on the USD/JPY currency pair is bearish. The price failed to break out through the f priority change level and again returned to the wide corridor. Under such market conditions, traders can look for sell positions from the resistance level of 113.95, but with additional confirmation. Buy positions should be considered from the 113.30 support level, but with additional confirmation in the form of a buyers' initiative or after the price breaks out the priority change level.
Alternative scenario: if the price rises above 114.17, the uptrend will likely resume.
The USD/CAD currency pair
Technical indicators of the currency pair:
Prev Open: 1.2773
Prev Close: 1.2887
% chg. over the last day: +0.89%
Federal Reserve officials said Friday that the first interest rate hike may come as soon as March. Investors began to shift their portfolios back to "cash", which led to an increase in the dollar index. The rise in the dollar led to a decline in major currencies against the US dollar. The Canadian dollar is a commodity currency, so it is highly correlated with both the dollar index and oil prices. Oil prices are declining sharply amid the rapid spread of the Omicron strain. All of these factors are weakening the Canadian currency.
Trading recommendations
Support levels: 1.2828, 1.2721, 1.2677, 1.2638
Resistance levels: 1.2918, 1.2951
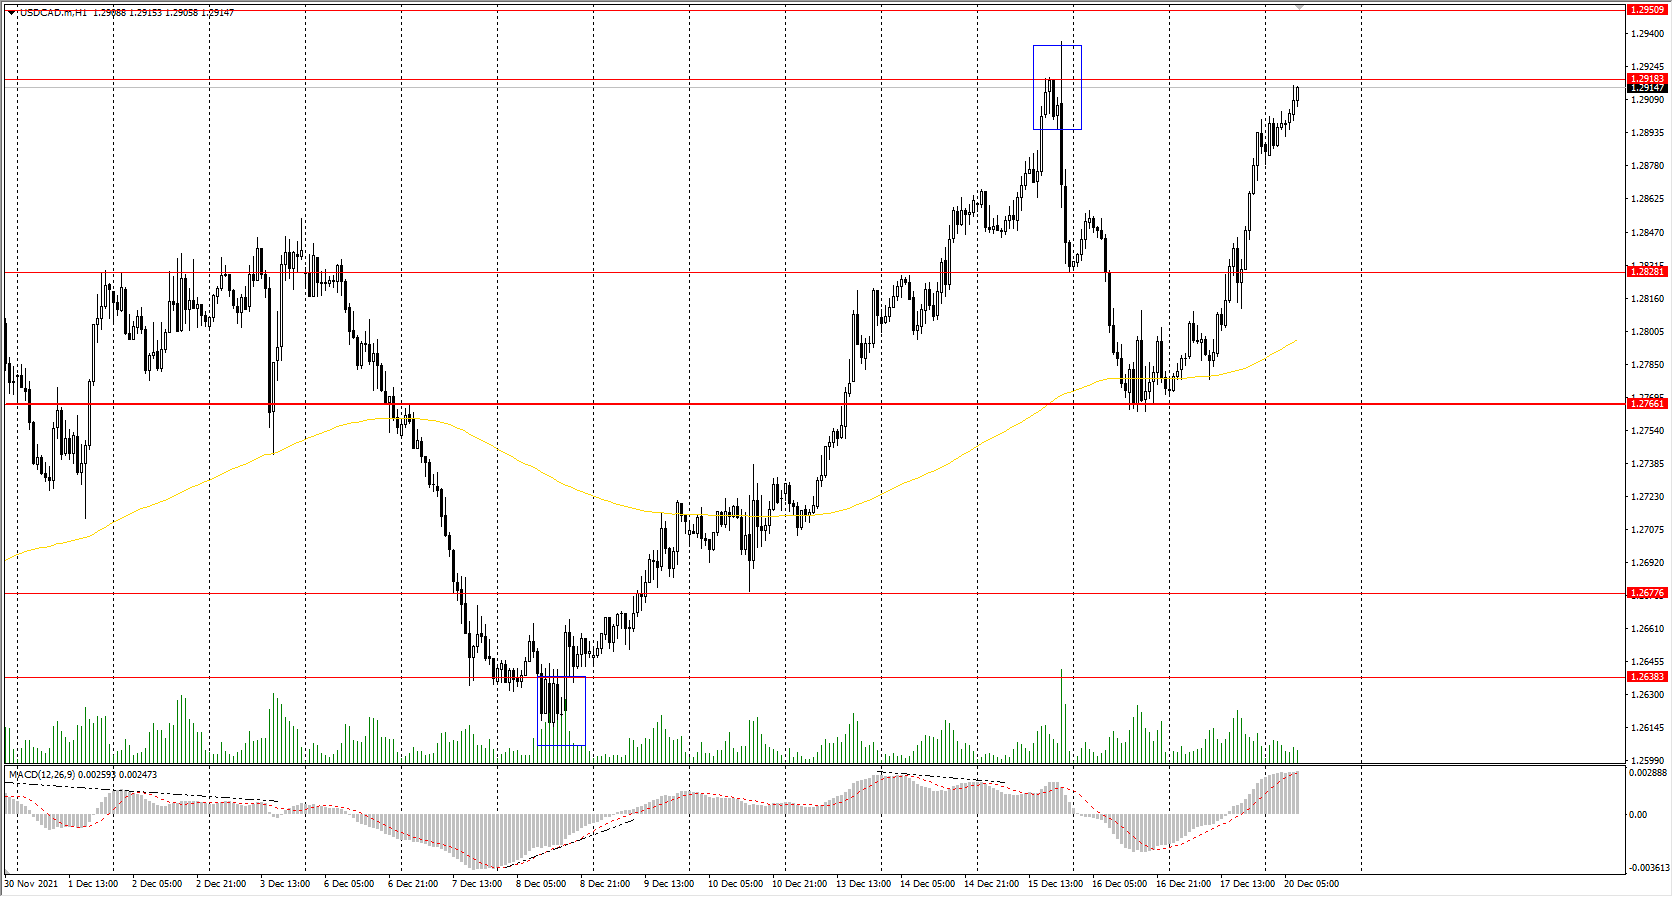
From a technical point of view, the USD/CAD currency pair trend is bullish. The MACD indicator has become positive, the buyers' pressure has increased, there are no signs of reversal at the moment. Under such market conditions, it is better to look for buy deals from the support levels near the moving average on the lower time frames. Sell deals should be considered from the false breakout area, but with additional confirmation in the form of a sellers' initiative.
Alternative scenario: if the price breaks down through the 1.2766 support level and fixes below, the downtrend will likely resume.
US Dollar Index Outlook: Near-Term Focus Shifts Higher As Dollar Moves To The Upper Side
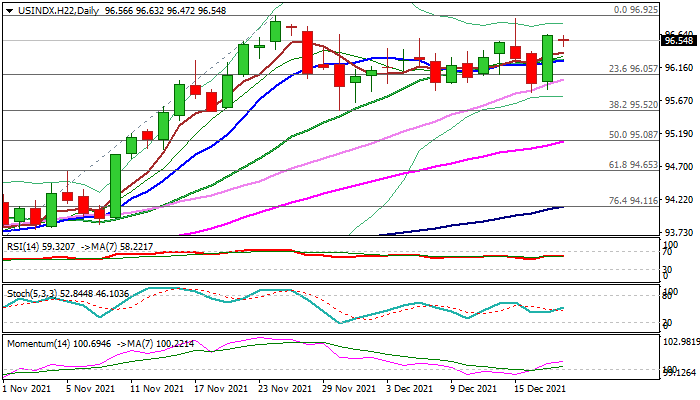
The dollar index is trading within a narrow range in early Monday but remains bid on prevailing risk-off mode and underpinned following last Friday’s 0.70% advance, which fully reversed post-Fed fall.
The price action moves into the upper part of the range that extends into fifth consecutive week, with near-term focus shifting to the upside, supported by rising bullish momentum on daily chart and price moving above daily Tenkan-sen (96.33).
Near-term bias is expected to remain with bulls while the price stays above this level, underpinned by bullish signal from eventual weekly close above 96.47 (50% retracement of larger 103.80/89.15 fall), although the action continues to face strong headwinds from new 2021 high (96.92, posted on Nov 24).
Fading bullish momentum and overbought RSI on weekly chart, add to worries of possible repeated stall on approach to 96.92 peak.
Bullish scenario requires a clear break of 96.92 to signal continuation of rally from 2021 low at 89.15 and expose targets at 97.78 (Jun 30 lower top) and 98.20 (Fibo 61.8% of 103.80/89.15) in extension.
Extended sideways mode could be expected while the price remains within 96.92/92.52 range, but near-term bias would turn negative on return below Tenkan-sen, while the downside would become more vulnerable on extension below 95.93 (daily Kijun-sen).
Res: 96.64, 96.87, 96.92, 97.45.
Sup: 96.33, 96.05, 95.93, 95.79.
USD Gets Support From Waller’s Comments
USD got some support on Friday against a number of its counterparts as Fed Board Governor Waller underscored the Fed's hawkish pivot as expressed in its last meeting. The Fed official practically endorsed the faster tapering of the Bank's QE program while also implied the possibility for a rate hike as soon as March 2022 with two or three rate hikes in total for the year. Across the Atlantic the common currency tended to weaken against the USD but also against the pound for some time as the pandemic has a firm grip over the continent and Netherlands went into lockdown.
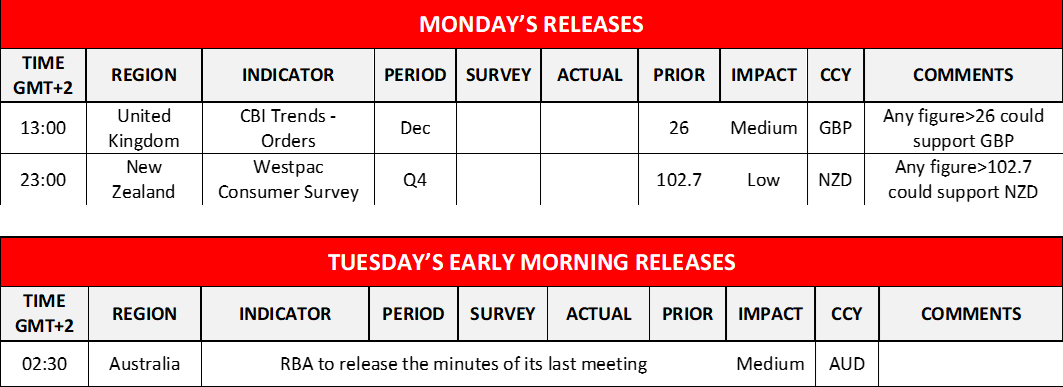
AUD also was on the retreat against the USD, as worries for the omicron variant tended to strengthen, threatening international trading conditions, while Aussie traders focus on the release of RBA's last meeting due out tomorrow in the Asian session. GBP slipped against the USD on Friday practically erasing any gains made during the week and strong retail sales data for November were not able to counter the uncertainty created for UK's economic outlook by the pandemic. It should be noted that earlier last week BoE had created substantial support for the pound by proceeding with its first post-pandemic rate hike and pound traders are expected to keep a close eye over December's CBI trends for Orders due out later today.
Gold's price seems to have stabilised somewhat on Friday after halting, at least for now, its upward motion. We tend to maintain a bias for a sideways motion between the 1793 (S1) support line and the 1815 (R1) resistance level. We must note though that the RSI indicator below our 4-hour chart is above the reading of 50 implying some bullish tendencies for the precious metal. Should the bulls actually take charge of gold's direction we may see it breaking the 1815 (R1) line and aim for the 1830 (R2) level. Should the bears take the initiative, we may see gold's price breaking the 1793 (S1) support line and aim for the 1770 (S2) level.
AUD/USD dropped on Friday breaking the 0.7170 (R1) level and aimed for the 0.7100 (S1) support level. We tend to maintain a bearish outlook for the pair given also that the pair's RSI indicator has a downward slope and is aiming for the reading of 30. Should the selling interest be extended we may see the pair breaking the 0.7100 (S1) support line and aim for the 0.7045 (S2) level. On the other hand, should there be enough buying orders along its path we may see AUD/USD reversing course and aim for the 0.7170 (R1) level.
Other highlights for today
Today we note the release of UK's CBI trends for industrial orders for the month of December while later on we note the release from New Zealand of the Westpac consumer Survey for Q4. During tomorrow's Asian session we get from Australia RBA's last meeting minutes.
As for the coming weeks
In the current week, we get on Wednesday the UK and US GDP rates for Q3, on Thursday US durable goods orders for November while on Friday the 24th we get from Japan November's CPI rates. Next week, we get on Thursday the 30th of December UK's Nationwide House prices and Switzerland's KOF indicators both being for December, while on New Year's Eve Chinas' NBS manufacturing PMI figures also for December. On Monday the 3rd of January we get Turkey's CPI rates and from the US we highlight the ISM manufacturing PMI figure, both for December. On Tuesday the 4th, we note the release of Chinas' Caixin Manufacturing PMI figure for December, Australia's RBA interest rate decision, while Switzerland and France are to release their December inflation rates. On Wednesday the 5th of January we note the release of the US ISM non-manufacturing PMI figure for December. On Thursday the 6th of January we get Germanys' preliminary HICP rates for December. On Friday the 7th of January the crown is expected to be the US employment report with its NFP figure December among other high impact data
XAU/USD H4 Chart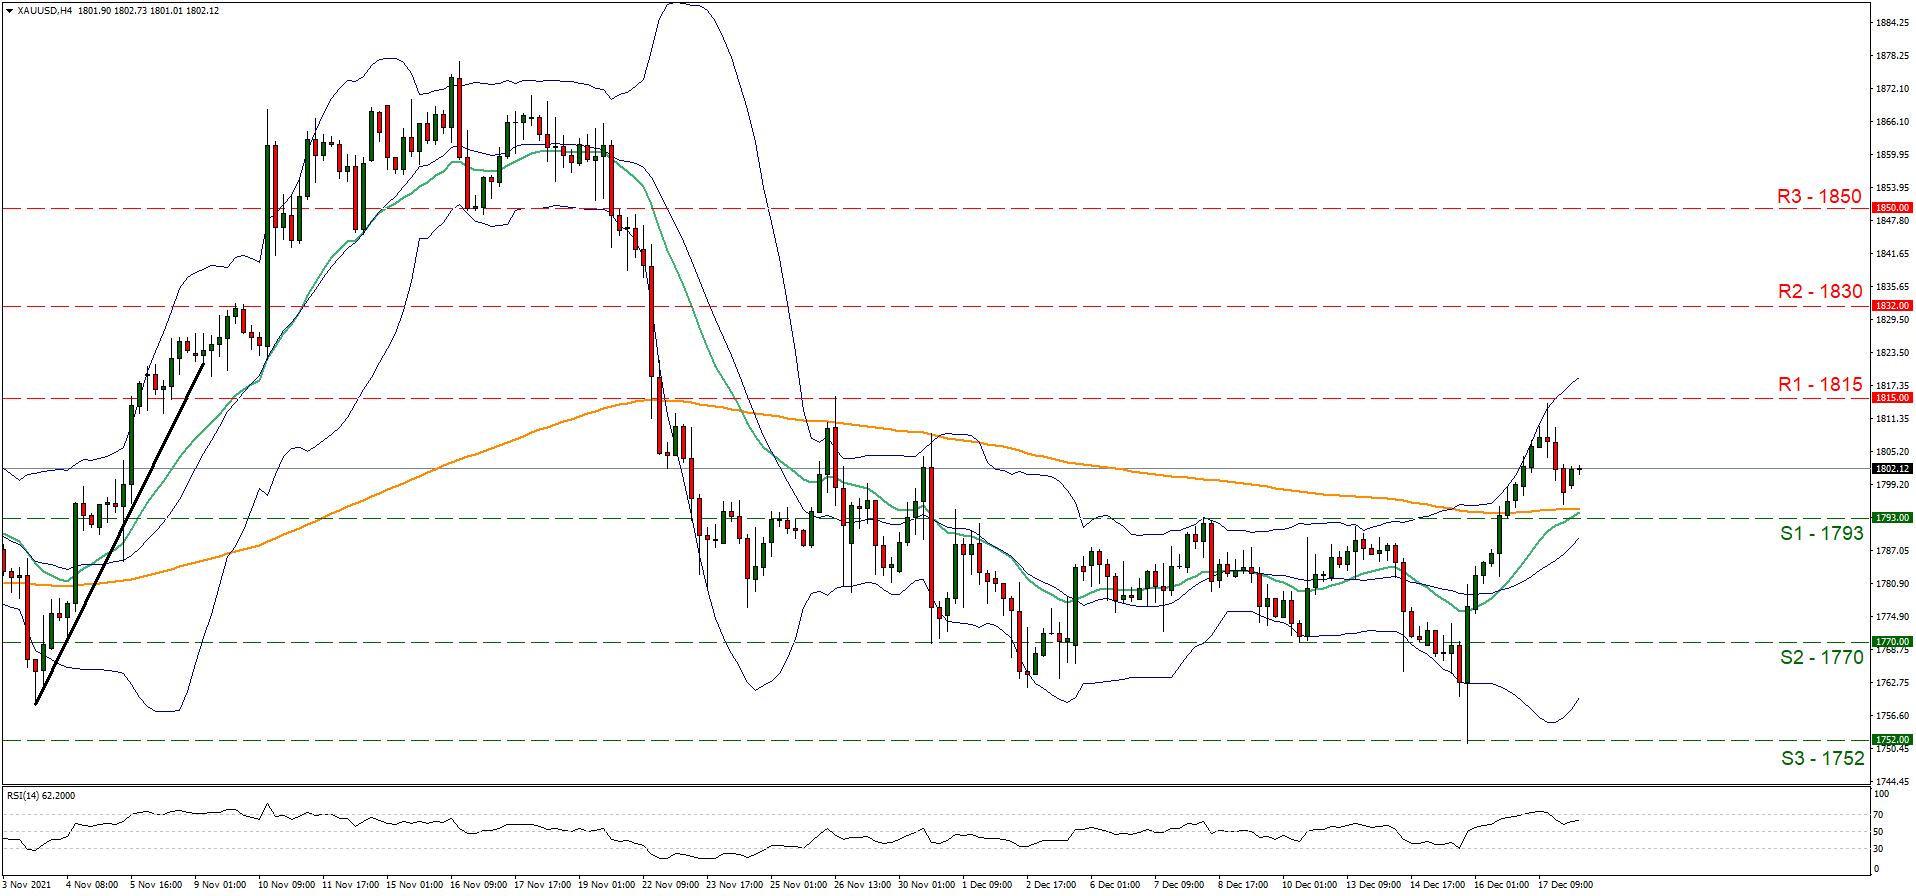
Support: 1793 (S1), 1770 (S2), 1752 (S3)
Resistance: 1815 (R1), 1830 (R2), 1850 (R3)
AUD/USD H4 Chart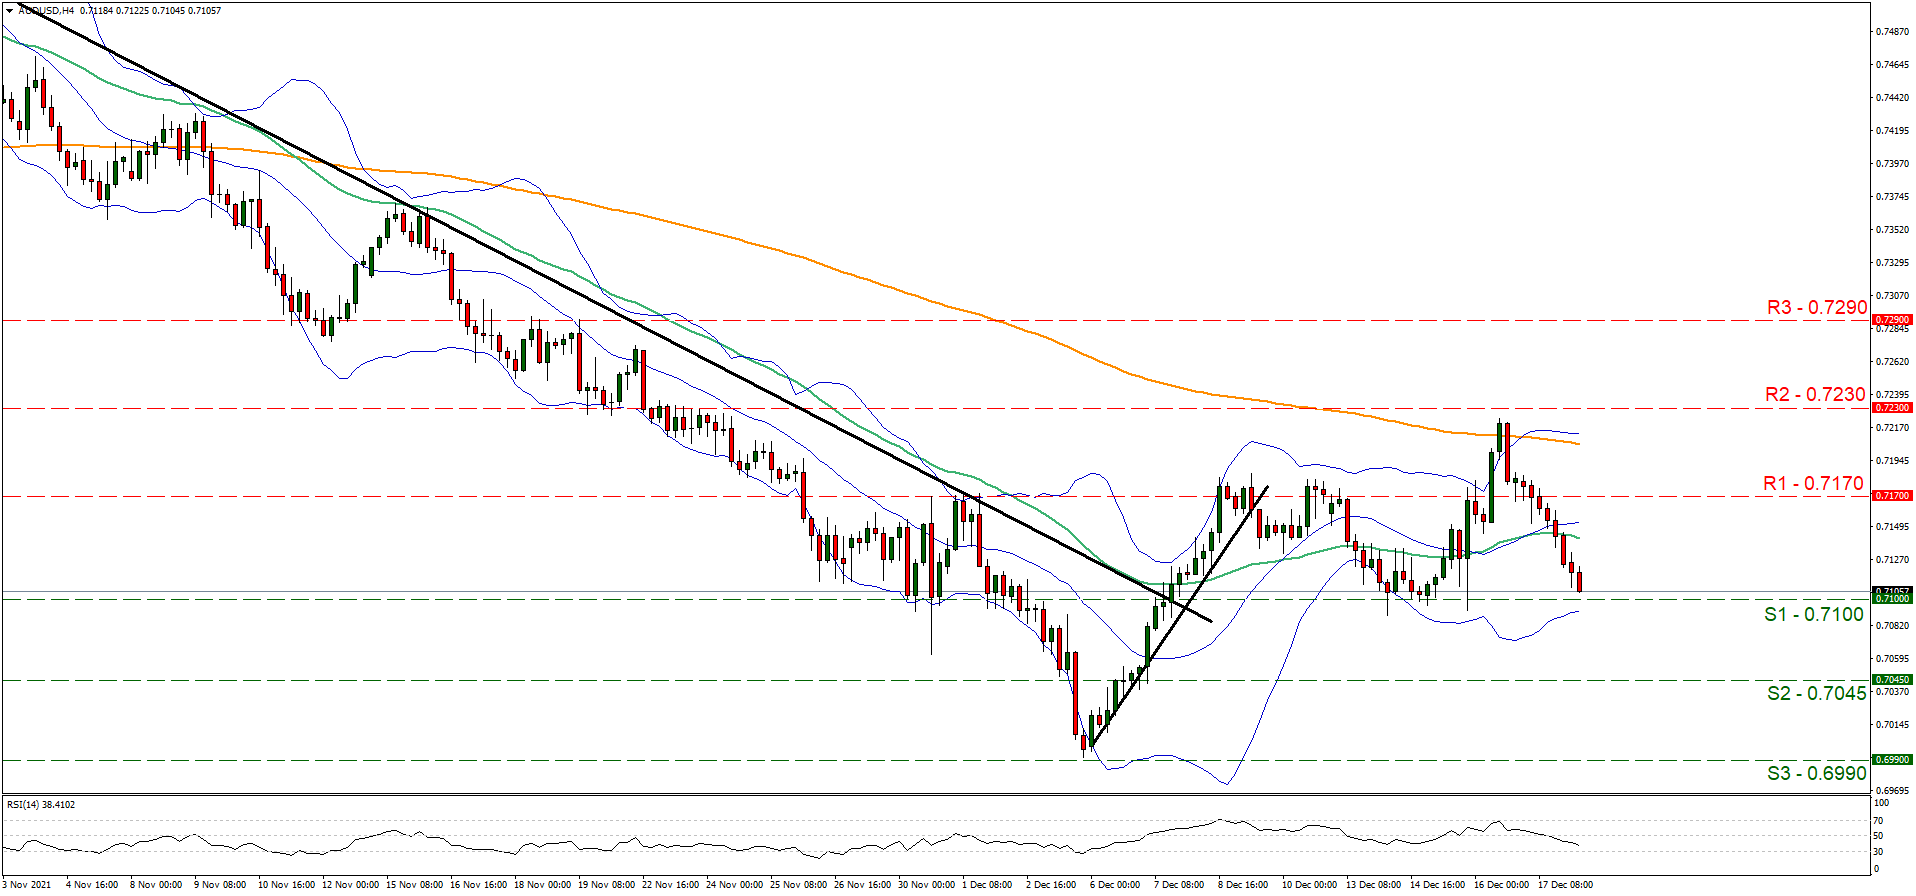
Support: 0.7100 (S1), 0.7045 (S2), 0.6990 (S3)
Resistance: 0.7170 (R1), 0.7230 (R2), 0.7290 (R3)
USDJPY Moves Sideways After Sharp Drop, Bias Turns Bearish
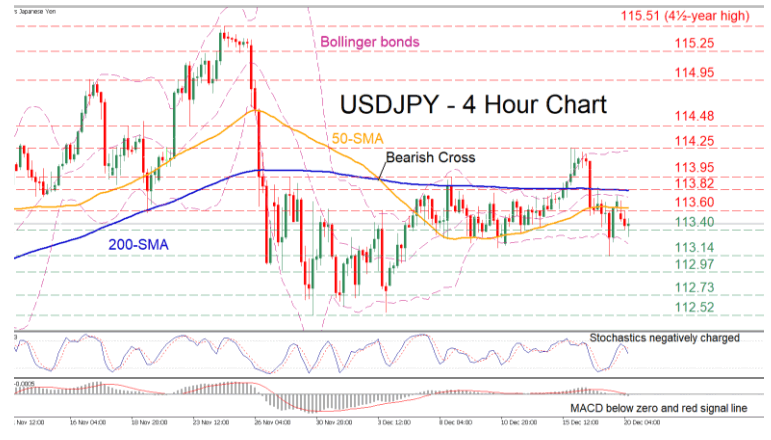
USDJPY has been trending downwards after the price peaked at the 4½-year high of 115.51 in late November. However, after its decline halted, the pair has adopted a more sideways pattern. Recently, the short-term picture seems to be deteriorating as the price has crossed below both its 50 and 200-day simple moving averages (SMAs).
This recent downside move is likely to resume as the momentum indicators endorse the pair’s bearish immediate-term bias. More specifically, the stochastic oscillator is sloping downwards after posting a bearish crossover, while the MACD is found beneath both zero and its red signal line.
Should the negative momentum strengthen and the price drops below the recent low of 113.40, initial support might be encountered at the 113.14 region. Falling beneath this barrier, the spotlight would turn to 112.97. Breaching these hurdles, the bears might then target the 112.73 obstacle.
On the flipside, if the bulls manage to retake control, the pair may meet resistance at the most recent high of 113.60. Overcoming this resistance point, the focus would turn to the 113.82 level, which overlaps with the pair’s 200-day SMA. Higher up, the price could climb towards the 113.95 barricade, before the bulls aim at the 114.25 region.
Overall, USDJPY has been moving without a clear direction in the medium-term, but the near-term picture seems to be worsening. Only a clear break above 114.25 could alter the medium-term picture back to positive.
Risk Aversion Lifts The US Dollar
Omicron jitters boost US dollar
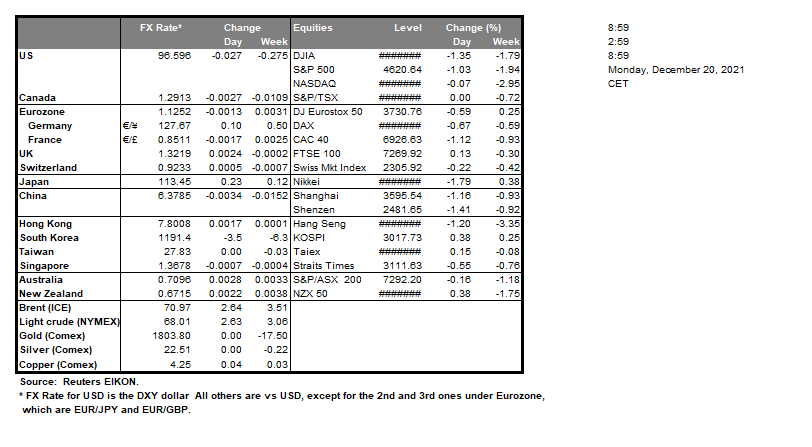
There’s something to be said for being the least-ugly horse in the glue factory, and the US dollar seems to be that horse right now. On Friday, risk aversion saw the dollar index soar by 0.65% to 96.67, before edging lower to 96.60 in Asia. Chief losers were the low yielders, notably the euro and the yen. The incipient rally in the world’s most popular sentiment indicators, the Canadian, Australian and New Zealand dollars, was also quickly snuffed out. US treasury yields are falling in Asia today, indicative of haven flows continuing in US bonds, and that alone should limit US dollar pullbacks. 96.00 and 97.00 should contain the dollar index nicely this week, with a daily close above or below signalling the US dollar’s next directional move.
With virus restrictions ramping up in Europe, EUR/USD’s recovery rally ended as soon as it began on Friday, falling 0.70% to 1.1235, before short-covering lifted it to 1.1248 today. The single currency has failed several times above 1.1360 last week, and weekend developments do not give much reason to change that opinion. Rallies are there to be sold with a failure of 1.1200 opening the downside to 1.1000. EUR/USD has multi-decade support at 1.0700.
USD/JPY has support at 113.00 and with the Bank of Japan reiterating the last 30 years of guidance this morning, that is it is not time to start withdrawing stimulus, the topside remains the weakest link. Having failed ahead of 1.3400, and with virus and political woes mounting, sterling will be challenged to even rally back to 1.3300 now. The 200-day moving average (DMA) at 1.3145 is immediate support.
As global sentiment barometers, the CAD, AUD, and NZD were stretchered off the field on Friday and have eased further today to 1.2896, 0.7120 and 0.6725 respectively. NZD/USD looks like the ugliest duckling, but all three are now back to approaching 2021 lows. Her Majesty’s Commonwealth Dominions need some good omicron news and fast.
Asian currencies have had a mixed performance. The yuan continues to strengthen despite weaker fixes from the PBOC. With China’s borders likely closed for all of 2022, the trade surplus flows will continue underpinning yuan strength. The SGD, THB, PHP, and IDR have all performed well post-FOMC, most likely because omicron has been discounted as a risk factor by investors. Although the INR and KRW have failed to rally, they are still holding steady. Both currencies are likely to feel the heat of fast-money outflows into the year-end, limiting gains.
Rather surprisingly, Asian currencies remain mostly resolute in the face of a souring sentiment environment and a strong US dollar. The main exception is the stagflation-ista Indian rupee which is also likely suffering fast-money outflows into the year-end, having been the major beneficiary of the shared prosperity clampdowns in China. The main reason for Asian FX fortitude lies with the Chinese yuan, I believe. Despite the PBOC setting weaker yuan fixes of late, the yuan is refusing to play ball in open markets. Part of this is the China trade surplus being recycled, and not offset by open borders allowing movement. The solidity of the yuan has acted as a stabilising influence on regional Asian currencies. Whether this continues is open for debate.
Gold Trapped Below 1,800 Bar, Bias Cautiously Bullish
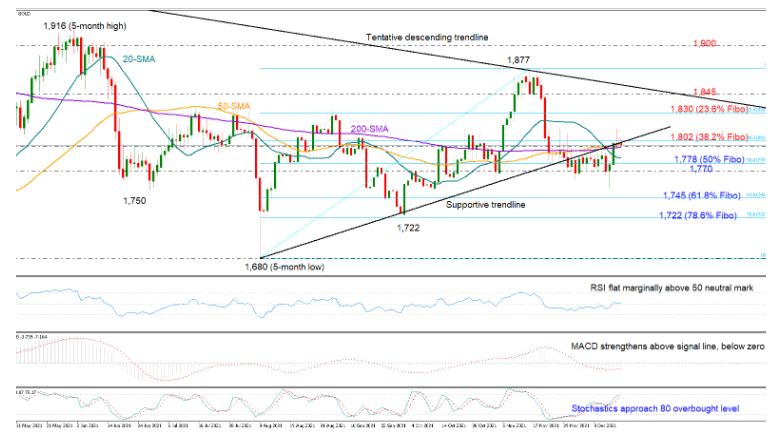
Gold remains trapped below the 1,800 boundary and the support-turned resistance trendline despite the quick bounce off the more-than-two-month low of 1,752.
The 50- and 200-day simple moving averages (SMAs) and the 38.2% Fibonacci retracement of the 1,680 – 1,877 upleg are making any breakout around the 1,800 threshold more essential, but bullish signals are not really convincing yet, reflecting some cautiousness among traders instead. Particularly, the RSI has shifted to the sidelines after barely crossing above its 50 neutral mark, the MACD continues to gain ground within the negative area and above its red signal line, while the Stochastics are approaching their 80 overbought level.
Should buying pressures dominate, the precious metal could speed up towards the 23.6% Fibonacci retracement of 1,830, while within breathing distance, the tentative descending trendline stretched from the record high of 2,079 may attract some interest ahead of the 1,877 peak. Beyond the latter, the rally could tease the 1,900 – 1,916 key resistance zone with scope to upgrade the neutral medium-term outlook.
In the event of a downside reversal, the bears may push for a close below the 50% Fibonacci and the 1,700 bar again. If their efforts prove successful this time, the price could tumble towards the 61.8% Fibonacci of 1,745, while a break below the swing low of 1,722, where the 78.6% Fibonacci is placed, could provide direct access to the 1,680 bottom.
Summarizing, although the short-term risk is skewed to the upside, the precious metal will need to close confidently above the 1,800 mark to motivate fresh bullish actions.
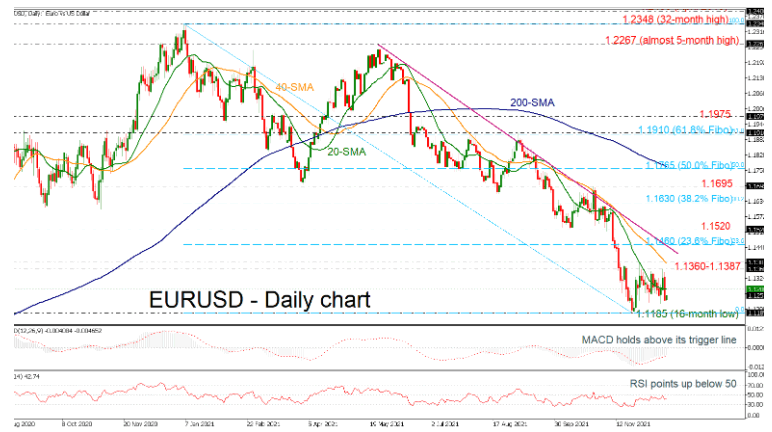
EURUSD Consolidates Near 1.1250, Neutral Bias
EURUSD is consolidating its gains within the 16-month trough of 1.1185 and the 1.1360 resistance level, with the level of the 20-day simple moving average (SMA) in the middle at 1.1280.
Regarding the technical indicators, the MACD is still moving above its trigger line in the negative region, approaching the zero level, while the RSI is sloping marginally up below the neutral threshold of 50. The 20-day SMA is looking ready for an upside turn, though the 40-day SMA is continuing the negative move.
Should the 1.1360-1.1387 resistance zone crack, the price could initially test the 23.6% Fibonacci retracement level of the down leg from 1.2348 to 1.1185 at 1.1460 and the descending trend line before heading towards the 1.1520 barrier. Running higher, the bulls will need to drive beyond the 38.2% Fibonacci of 1.1630 to access the 1.1695 high.
In the negative scenario, immediate support could come from the 16-month bottom of 1.1185. If there is a close below this hurdle, the 1.1015 support could prevent a sharper decline towards 1.0765, taken from the low on May 2020.
In brief, EURUSD is remaining exposed to downside corrections as the price is still moving beneath the long-term downtrend line. Only a climb above the 200-day SMA at 1.1765 may change this view.