Sample Category Title
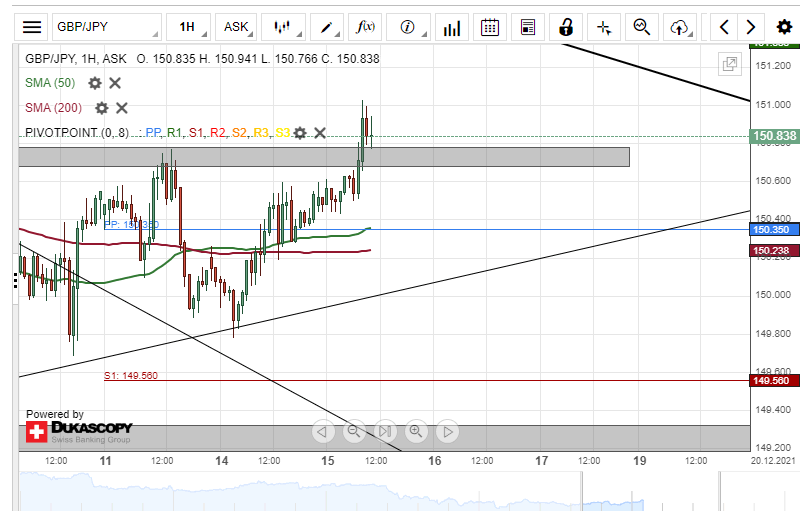
GBP/JPY Breaks Resistance
On Wednesday morning, the GBP/JPY currency exchange rate broke the high level zone at 150.67/150.77. However, the following surge appeared to have been stopped by the 151.00 mark.
A move above the 151.00 level could aim at the weekly R1 simple pivot point at 151.33. Above the pivot point, note the 151.50 mark and the resistance line of the October and November high levels.
If the pair declines, it could look for support in the 150.67/150.77 zone. Below the zone, the combination of the weekly simple pivot point at 150.35 and the 50 and 200-hour simple moving averages are highly likely set to act as support.
AUD/USD Trades In Previous Range
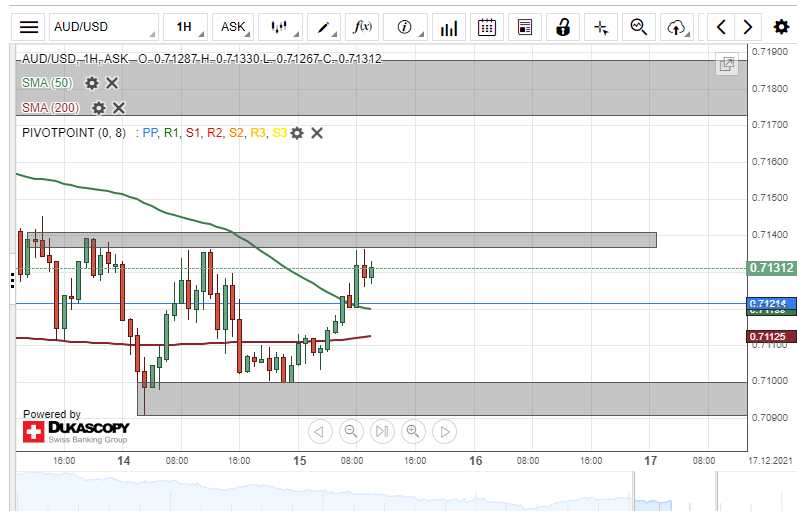
The AUD/USD currency exchange rate continues to fluctuate between the support of the 0.7090/0.7100 zone and the resistance of the 0.7137/0.7141 levels. On Wednesday morning, the pair approached the resistance zone and was testing it.
A passing of the 0.7137/0.7141 level might result in a surge to the December high level zone at 0.7173/0.7187. Above the zone, the 0.7200 mark might act as resistance.
However, a decline of the rate from the resistance zone could find support in the weekly simple pivot point at 0.7121, the 50-hour SMA near 0.7120 and the 200-hour SMA near 0.7110. Further below, the 0.7090/0.7100 zone is located at.
EUR/JPY Remains Near 128.00
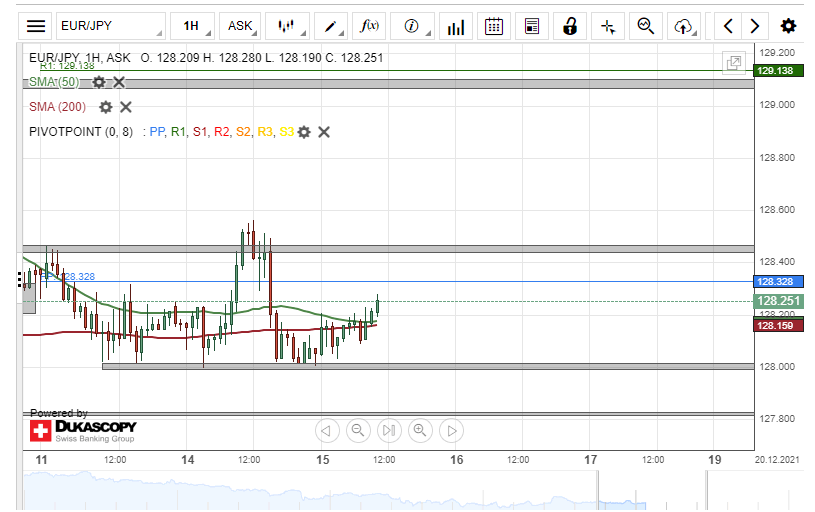
Despite a surge above the previous week's high levels, the EUR/JPY eventually retraced back to the support of the 128.00 level. On Wednesday morning, the pair had returned to trading between the 128.00 mark and the resistance of the 50 and 200-hour simple moving average near 128.20.
In the case that the rate declines below the 128.00 level, the EUR/JPY might find support first in the Friday low level at 127.80. Below the 127.80 level, note a strong support zone at 127.40/127.66.
On the other hand, a surge of the rate would have to pass the resistance of the 50 and 200-hour SMAs at 128.20, the weekly simple pivot point at 128.33 and the high levels near 128.45 and 128.55, before aiming at the 129.00 mark.
USDJPY Maintains Cautious Tone Ahead Of FOMC
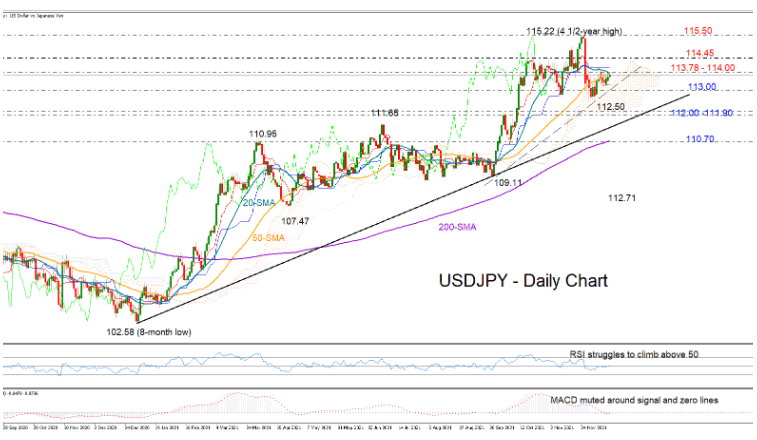
USDJPY has been trapped between the red Tenkan-sen line and the 20-day simple moving average (SMA) the past couple of sessions, consolidating the bounce off the two-month low of 112.50 within the 113.24 – 113.78 territory.
Traders are probably in a wait-and-see mode ahead of the FOMC policy meeting, with the RSI and the MACD currently reflecting a neutral bias for the market as the former is struggling to enter the bullish zone above 50, while the latter remains muted around its zero and signal lines.
The market trend, however, is still at risk of aversion in the short-term picture. The 20-day SMA is set to cross below the 50-day SMA, signaling a continuation of the latest downfall below the 112.50 low. But for the price to touch that trough, the bears will first need to close below the dashed tentative supportive trendline currently around 113.00.
Should the decline stretch below 112.50, the pair may print a new lower low within the 112.00 – 111.90 region. Note that the one-year-old tentative ascending trendline is also in the neighborhood and failure to pivot here could produce stronger selling pressures, with the price likely tumbling towards the 200-day SMA at 110.74 in the aftermath.
Alternatively, a break above the 113.80 – 114.00 area could open the way towards the 114.45 resistance. Any step higher from here would resume confidence in the bullish trajectory, shifting the spotlight towards the 4½-year high of 115.22 and the 115.50 barrier taken from March 2017. Further up, the rally could accelerate towards the 117.00 mark, where the bulls faced some limitations in early 2017.
Summarizing, despite the latest upside correction, USDJPY is still maintaining a cautious tone in the short-term picture. A move above 113.80 – 114.00 could improve buying sentiment.
All Eyes On The Fed
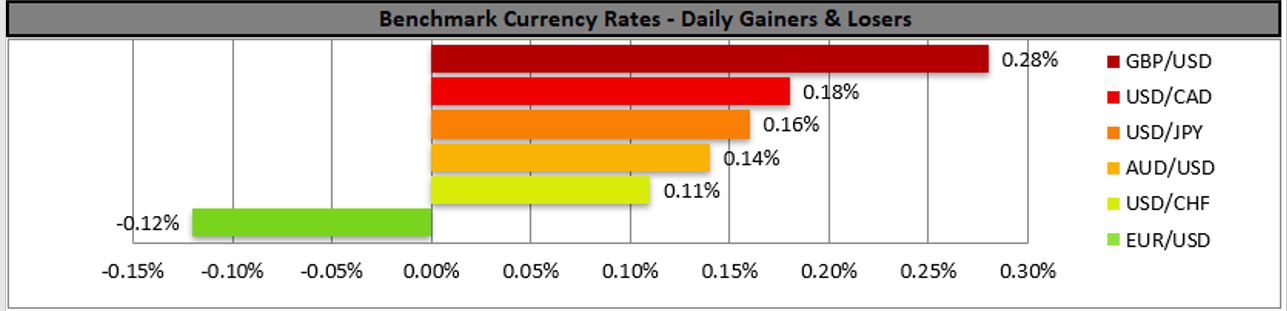
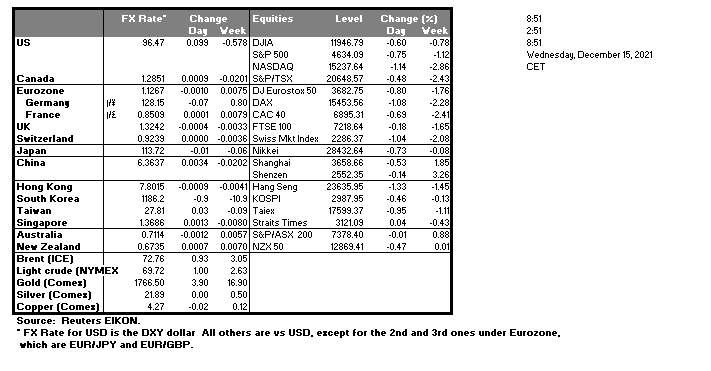
The USD seems to remain stable against its counterparts as the market’s attention is turning towards the Fed’s interest rate decision. Inflationary pressures in the US economy were reaffirmed on Friday as the headline CPI rate reached an almost 40 year high for November on a year-on-year level, tilting the market’s expectations for the Fed towards a more hawkish direction. It should also be noted that the Fed’s Chairman, Jerome Powell, in his testimony before the Senate has confirmed that the bank would discuss an expediting of the tapering of the Fed’s QE program.
Market’s expectations seem to include such an announcement as they also seem to point towards an earlier rate hike, with May 2022 being a possible date. Should the Fed actually proceed according to market expectations we may see the USD getting some support, on the other hand, should the Fed disappoint the markets we may see the USD tumbling. Thus, we expect market focus to be on the release of the accompanying statement, Fed Chairman Powell’s press conference, half an hour later but also the Fed’s projections could generate substantial buzz.
The USD index remained rather stable revolving its price action around the 96.15 (S1) level. We tend to maintain our bias for a sideways motion yet the Fed’s interest rate decision could alter the index’s direction. Should the bulls take over we may see the USD index breaking the 96.65 (R1) resistance line. Should the bears take over we may see the Index breaking the 96.15 (S1) support line and take aim of the 95.60 (S2) level.
CPI rates the main event for the CAD
CAD’s weakening against the USD continued yesterday as cautiousness in the market sentiment due to the faster spreading of the Omicron variant tends to have an adverse effect on the CAD. Also, WTI prices slipped below $70 per barrel given EIA’s warning that the commodity’s supply is to exceed demand levels in Q1 next year, intensifying the bearish sentiment for the Loonie.
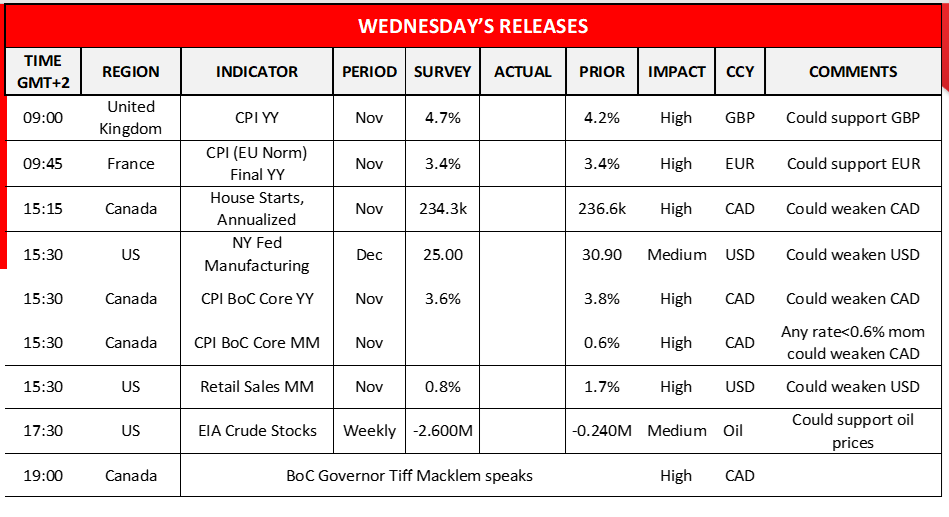
Today we note the release of Canadas’ CPI rates for November and the core rate is forecasted to slow down and reach 3.6% yoy if compared to October’s 3.8% yoy and if so, could weaken the Loonie as the pressure on BoC to act could ease. On second note we would also note the release of the number of House starts for November which is expected to drop and could also contribute to some bearish tendencies for the Loonie. On the monetary front, later we note that BoC Governor Macklem is scheduled to speak and if he expresses the same degree of cautiousness the bank had shown in its last interest rate decision, we may see the CAD’s bearish tendencies intensifying.
USD/CAD’s rise continued as the pair tests the 1.2855 (R1) resistance line. We tend to maintain a bullish outlook for the pair as long as it remains above the upward trendline incepted since the 8th of the month. Should the pair actually find fresh buying orders along its path we may see it breaking the 1.2855 (R1) resistance line and aim for the 1.2950 (R2) level. Should a selling interest be displayed for the pair we may see it aiming if not breaking the 1.2775 (S1) support line.
Other highlights for today
In a busy day, today we note the release of UK’s CPI rates for November, as well as France’s final HICP rate for the same month. In the American session we get from the US the NY Fed Manufacturing Index for December, the retail sales for November and oil traders may keep an eye out for EIA’s weekly crude oil inventories figure. Also we note the release of New Zealand’s GDP rate for Q3, and during Tomorrow’s Asian session, we get from Australia the preliminary PMI figures for December and most importantly November’s employment data, while from Japan we note the release of November’s trading data and December’s preliminary Jibun Bank manufacturing PMI figure.
USD Index H4 Chart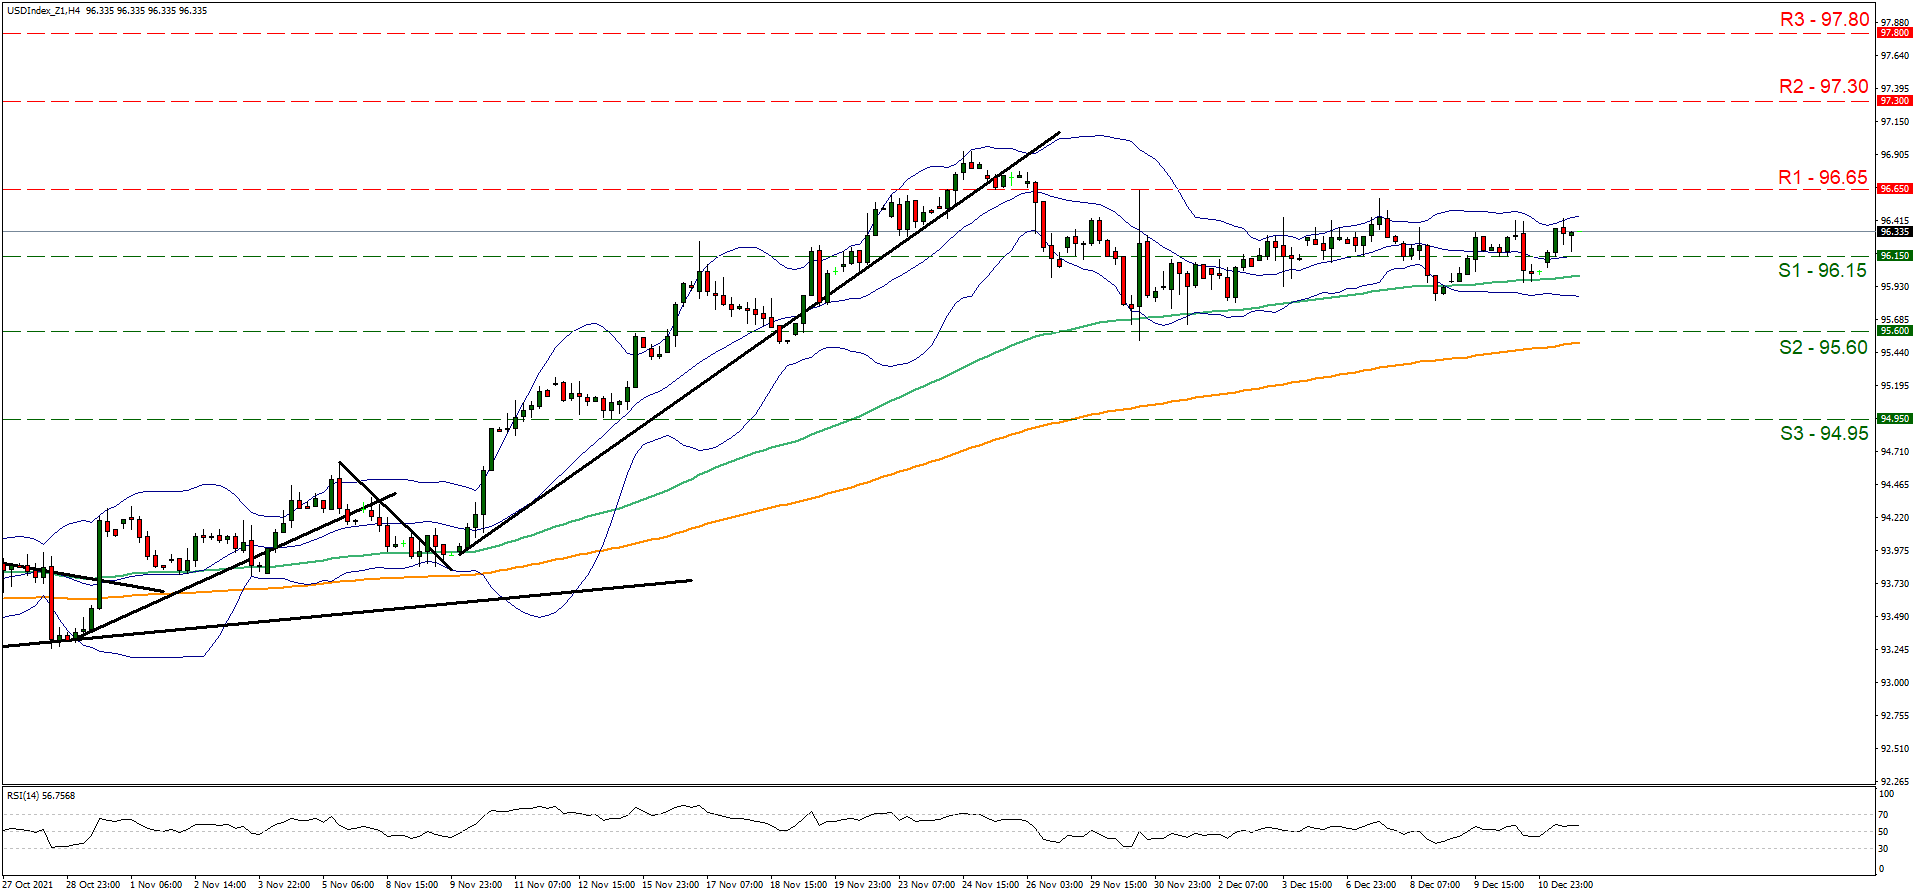
Support: 96.15 (S1), 95.60 (S2), 94.95 (S3)
Resistance: 96.65 (R1), 97.30 (R2), 97.80 (R3)
USD/CAD H4 Chart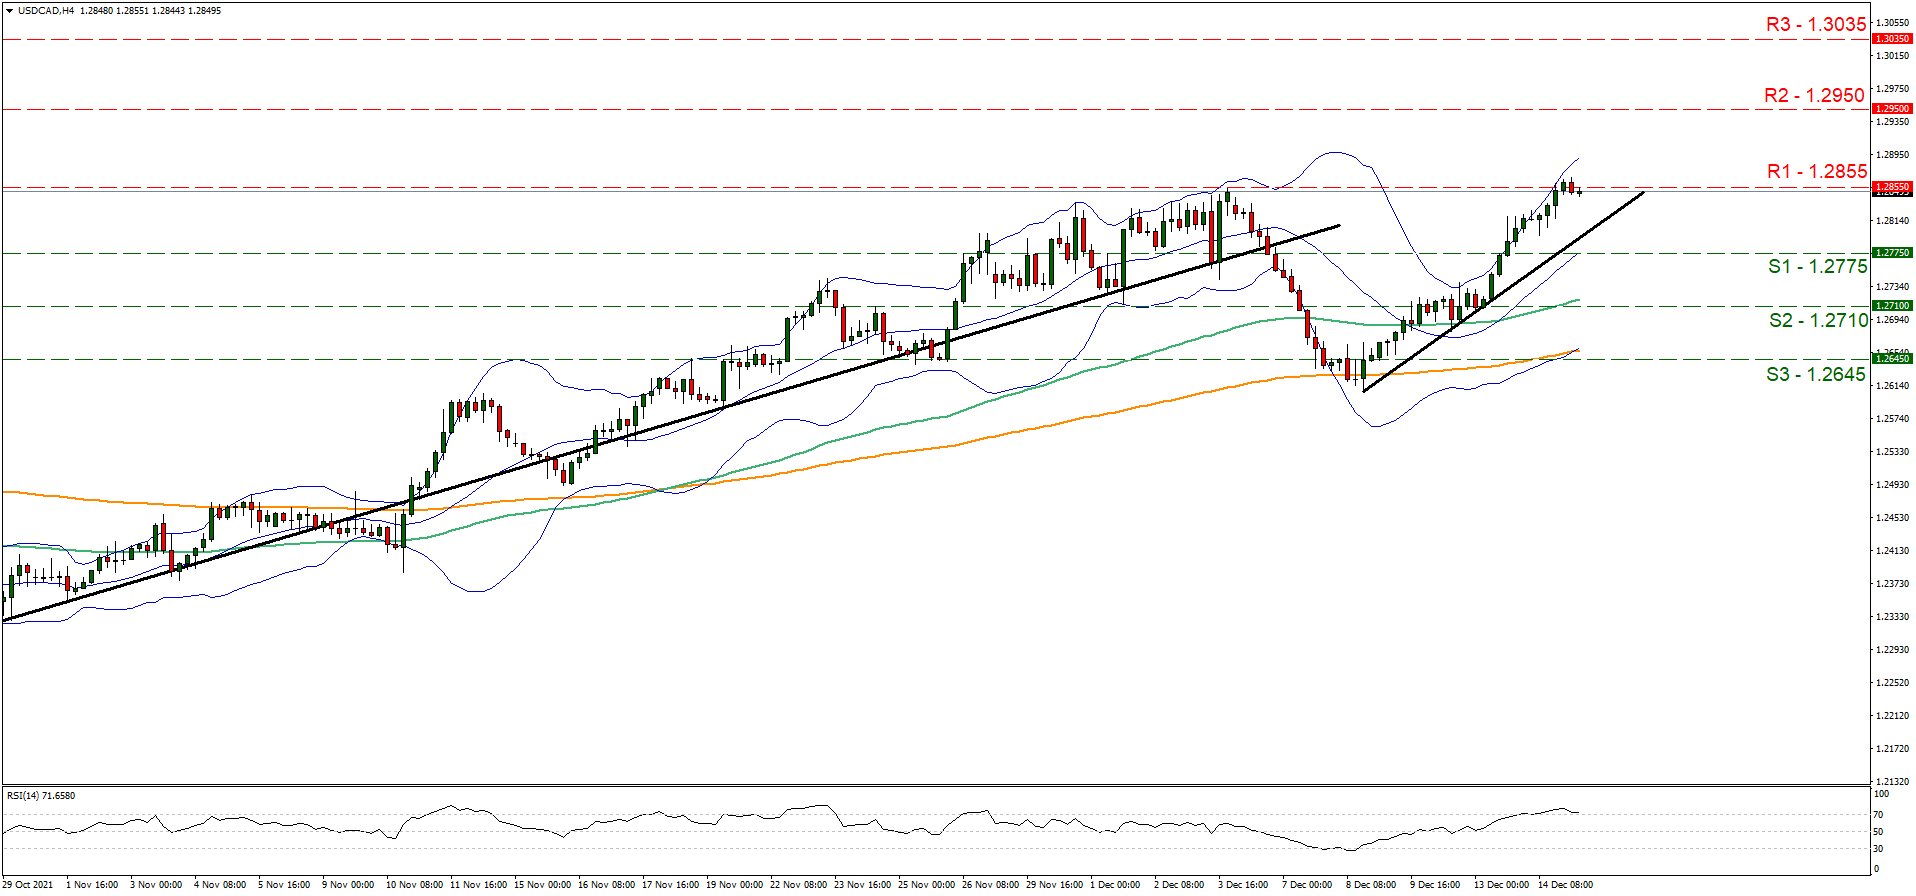
Support:1.2775 (S1), 1.2710 (S2), 1.2645 (S3)
Resistance: 1.2855 (R1), 1.2950 (R2), 1.3035 (R3)
XAUUSD Is Possibly Bearish
Technical analysis
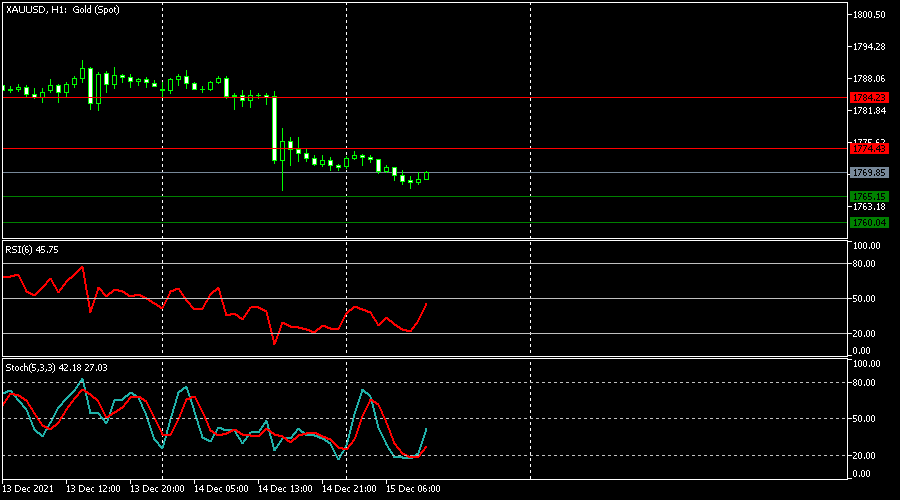
The RSI is below level 50.
The Stochastics left the oversold zone and headed upwards to level 50.
Most likely scenario – SELL
Target prices: 1,765.15 1,760.04
Alternative scenario – BUY
Target prices: 1,774.43 1,784.23
Key levels
Support 1,765.15 1,760.04
Resistance 1,774.43 1,784.23
AUDCHF Plummets To 1-Year Low As Bearish Forces Consolidate
AUDCHF has been trending downwards since April, failing to find significant support. Although the pair adopted a more sideways pattern in the last five months, the short-term picture has started to deteriorate again, and the price is fluctuating close to historical lows.
This bearish short-term picture is also endorsed by the momentum indicators. The stochastic oscillator is sliding sharply, while the RSI is pointing upwards but remains slightly below the 50-neutral mark. Moreover, the price is currently trading significantly beneath the Ichimoku cloud.
Should the selling pressure intensify further, initial support could be encountered at the most recent low of 0.6539. Breaching through this support region, the price might move towards the 0.6507 barrier. Failing to halt there, the spotlight would turn to 0.6415, which held strong twice in December.
In the upside scenario, bullish actions might face resistance at the recent high of 0.6625. Propelling above this barricade, the price may climb towards the 0.6734 obstacle, which overlaps with the 50-day simple moving average (SMA). Higher up, 0.6800 could prove to be a significant resistance point before the bulls target the 200-SMA, currently at 0.6860.
Overall, the long-term outlook for AUDCHF is bearish. Should the price manage to cross below 0.6415, the negative momentum is likely to strengthen, sending the pair to form fresh historical lows.
NASDAQ 100 Slips Hard Ahead Of The FOMC Decision
US stocks fell sharply on Tuesday while bond yields rose as investors waited for the upcoming interest rate decision by the Federal Reserve. Tech stocks were among the worst performers, with the Nasdaq 100 index shedding more than 300 points. The sell-off intensified as it became clear that the Fed does not have an option other than tightening. For example, data published by the government showed that the producer price index (PPI) rose by 9.6% in November. This was the highest increase since 2010. The data came a few days after numbers revealed that consumer inflation jumped to the highest level in more than 40 years.
The US dollar held steady in the overnight session as investors wait for the interest rate decisions by key central banks like the Fed, BOE, SNB, BOJ, and the ECB. The Fed is expected to tighten when it concludes its meeting later today while the other banks will be a bit cautious since the Omicron variant is reportedly rising. Before the Fed decision, the US dollar will react to the latest US retail sales numbers that will come out in the afternoon session. The numbers are expected to show that retail sales retreated slightly in November as prices jumped.
The economic calendar will have some key events today. Earlier on, China released strong economic numbers including retail sales and GDP numbers. In the morning session, the UK will publish the latest inflation numbers. These numbers will come a day after the country published strong employment data. In Europe, France and Italy will publish the final inflation numbers of the year. The Canadian statistics agency will release the latest inflation data while the Energy Information Administration (EIA) will release the latest inventories numbers.
NDX100
The Nasdaq 100 erased most of the gains that it made last week. It tumbled to a low of $15,700, which was the lowest level since December 6th. On the four-hour chart, the pair has moved below the 50-day simple moving average. It is also slightly below the dots of the Parabolic SAR while the Average Directional Index (ADX) has pointed upwards. Therefore, while the overall trend is bearish, there is a likelihood of a bullish rebound after the Fed decision.

EURUSD
The EURUSD pair tilted lower ahead of the Fed decision and after Germany downgraded its economic forecast. The pair is trading at 1.1270, which is along the lower side of the triangle pattern. It is also slightly below the 25-day moving average while the Relative Strength Index (RSI) and the Stochastic Oscillator have pointed lower. Therefore, the pair will likely break out lower ahead of the FOMC decision.

USDCAD
The USDCAD pair has been in a bullish trend since the latest Bank of Canada interest rate decision. The pair is trading at 1.2845, which is substantially higher than last month’s low of 1.2280. On the daily chart, the pair has struggled to move above this level several times since July. It has moved above the 25-day and 50-day moving averages while the MACD is above the neutral level. Therefore, the pair will likely have a bullish breakout.
Sterling Jumps After CPI Jumps Above 5%
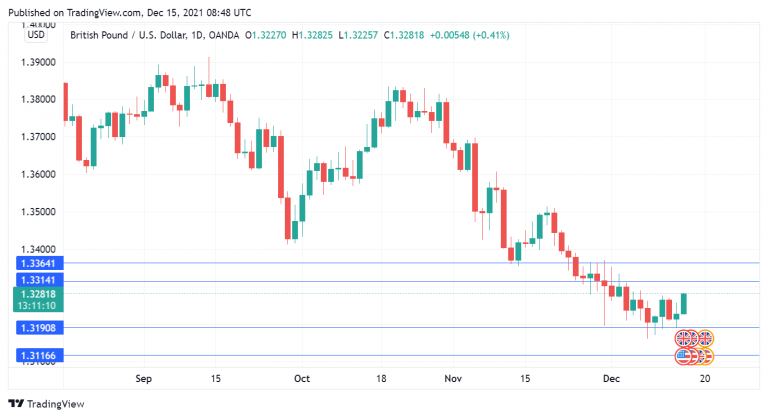
The British pound is up 0.42% on the day, as GBP/USD trades around the 1.3280 line.
UK inflation overperforms
UK inflation for November climbed 5.1% y/y, up sharply from 4.2% a month earlier and ahead of the consensus of 4.7%. Inflation continues to accelerate at a brisk pace, and the release marked the highest level since 2011. Core CPI rose to 4.0%, above the consensus of 3.7% and higher than the October reading of 3.4%.
With inflation well above the BoE’s target rate and showing no signs of easing, in ordinary times a rate hike would be almost a given. However, these are no ordinary times. The surge in inflation is a result of supply bottlenecks and post-lockdown spending, and not due to a strong economy that needs to be reigned in. The Covid pandemic continues to rage, with the new Omicron variant spreading much fast than previous strands of Covid.
The BoE lost some credibility when it signalled a rate hike was coming in November, only to stay on the sidelines. The markets were not pleased, and the pound took a tumble as a result. This time around, the markets have been warier and with the uncertainties surrounding Omicron, the likelihood is that the BoE will not make a move today. The markets have priced in a modest hike of 0.15% at the next policy meeting in February.
Anticipation is high ahead of the FOMC meeting later today. The Fed is widely expected to announce a normalization of monetary policy, as it sets the stage for a rate hike sometime in 2022. First things first – the Fed needs to wind up its bond purchase programme before raising rates. Policymakers are expected to double the tapering pace, from USD 15 billion/mth to USD 30 billion/mth. The dot plot is likely to show that the Fed plans to raise rates two or three times in 2022, followed by three or four times in 2023. This hawkish pivot should support gains by the US dollar.
GBP/USD Technical Analysis
- GBP/USD has support at 1.3190 and 1.3116
- There is resistance at 1.3314 and 1.3364
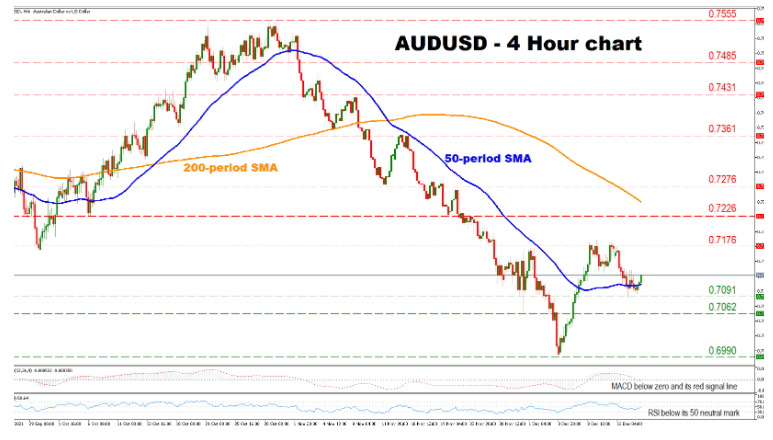
AUDUSD Meets Support At 50-SMA, Bearish Forces Linger
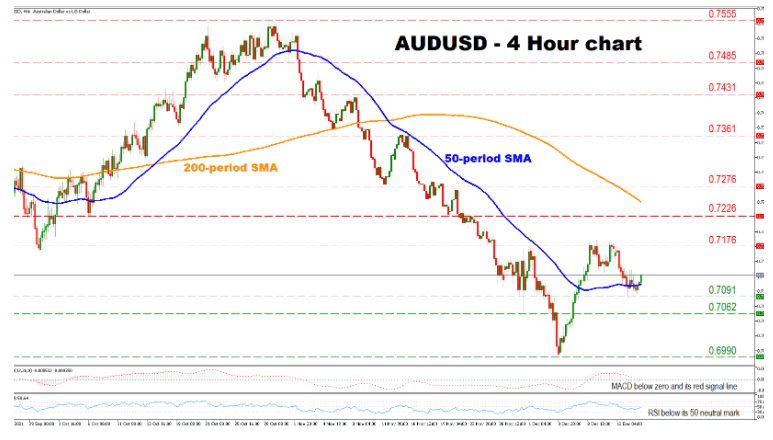
AUDUSD has powered back from its early December low, crossing above the 50-period simple moving average (SMA) and breaking its previous series of successive lower highs. However, the cautiously bearish outlook for the pair is maintained as the price is trading well below its 200-period SMA.
Short-term momentum indicators are reflecting a negative bias for the pair, as the RSI is located below its 50 neutral mark, while the MACD is found below zero and its red signal line.
Should the pair cross below its 50-period SMA currently at 0.7110, selling pressures could intensify, sending the price to test the 0.7091 support. A break below that point could open the door towards the 0.7062 barrier, before the bears shift their attention towards the strong 0.6990 level.
On the flip side, if the bulls resurface, initial resistance might be found at the 0.7176 obstacle. A step higher from there could send the price towards the 0.7226 barrier, before the buyers eye the 200-period SMA, currently found at 0.7250. A decisive move above the latter could turn the fortunes around for the pair, paving the way towards the 0.7276 level.
In brief, the outlook for the pair is cautiously bearish. For sentiment to change, buyers would need to break above the 200-period SMA.