Sample Category Title
Daily Technical Analysis
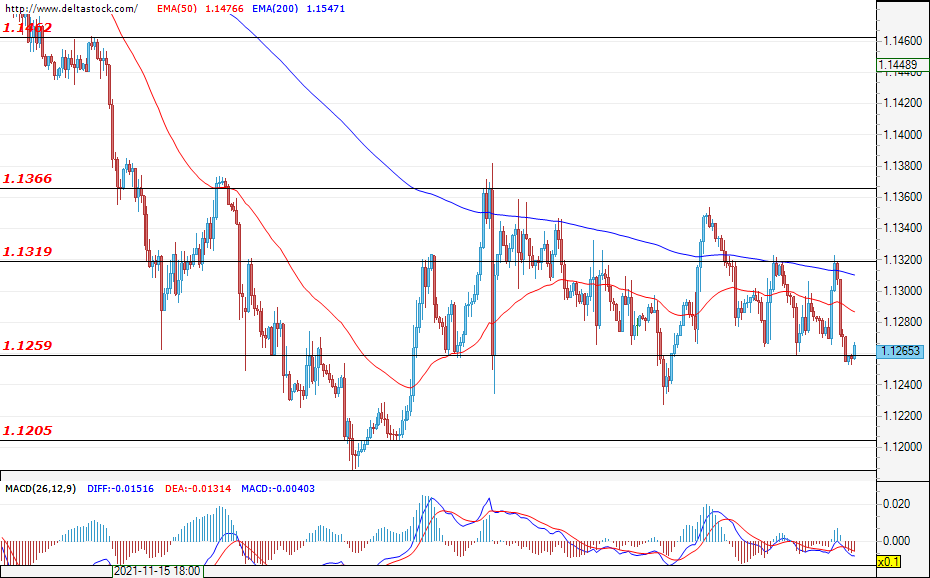
EUR/USD
Current level - 1.1265
After many attempts at breaching the critical support zone at 1.1260, the currency pair is testing this level once again. .However, a successful breach of the mentioned support could be considered as a signal for a resumption of the long-term downtrend, which would pave the way for the pair towards the support at 1.1200. The Fed interest rate decision that will be announced today at 19:00 GMT and the following press conference is expected to greatly influence the value of the U.S. dollar. Sharp movements in either direction can be expected then as we find out if the Fed will take a more hawkish stance and reduce its bond-buying program at a more aggressive pace as a result of the alarmingly high levels of inflation in the U.S. Other economic news that may spark volatility today are the data on the retail sales for the U.S. (13:30 GMT) and on the Empire State manufacturing index (13:30 GMT).
| Resistance | Support | ||
| intraday | intraweek | intraday | intraweek |
| 1.1320 | 1.1460 | 1.1259 | 1.1205 |
| 1.1366 | 1.1500 | 1.1205 | 1.1180 |
USD/JPY
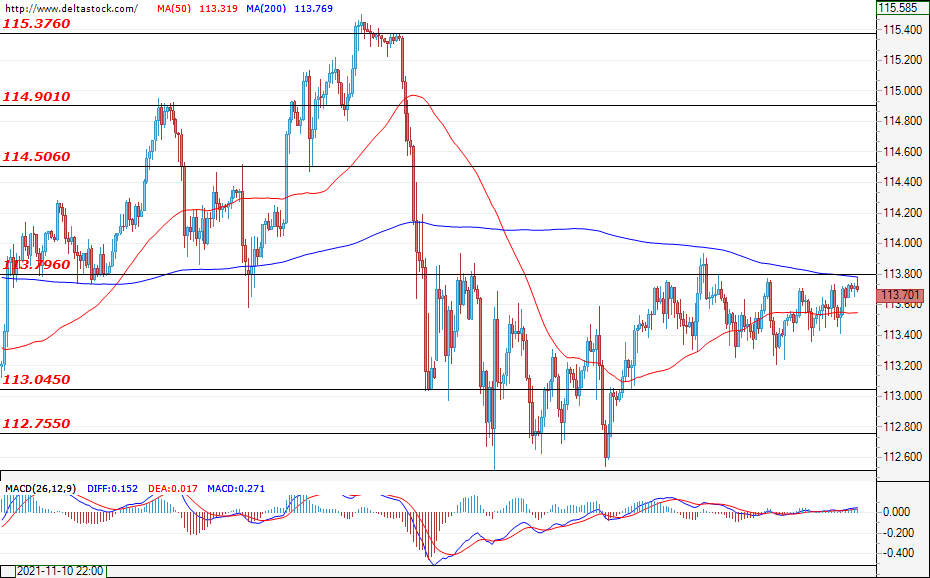
Current level - 113.70
The ninja continues to trade close to the resistance at 113.80 and, at the time of writing, neither the bulls nor the bears are managing to take the upper hand. In case the bulls prevail and successfully breach the resistance level at 113.80, this would probably lead to an appreciation of the U.S. dollar and the next target for the bulls would be the resistance at 114.50. In the opposite direction, if the mentioned resistance crumbles to the bullish pressure, then the pair would most probably head towards a test of the support at 113.05. The data on the FED interest rate is expected to be of great importance when it comes to deciding the future direction of the USD/JPY.
| Resistance | Support | ||
| intraday | intraweek | intraday | intraweek |
| 113.80 | 114.90 | 113.04 | 112.75 |
| 114.50 | 115.37 | 112.75 | 110.80 |
GBP/USD
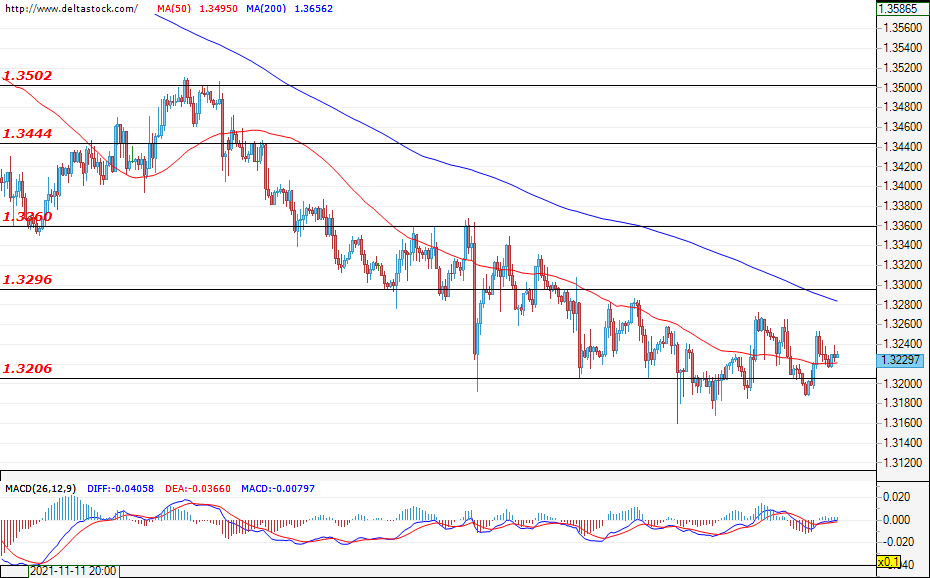
Current level - 1.3230
The psychological support zone at 1.3200 still protects the sterling from further declines, and only a successful breach of this level would head the pair towards a test of the support at 1.3150. If the sell-offs deepen, then the next target would be the support at 1.3100. However, a corrective move towards the resistance at 1.3300 before a possible confirmed breach of the mentioned support is also a possible scenario, which would signal for a resumption of the long-term downtrend.
| Resistance | Support | ||
| intraday | intraweek | intraday | intraweek |
| 1.3206 | 1.3360 | 1.3150 | 1.2900 |
| 1.3296 | 1.3440 | 1.3100 | 1.2800 |
GBP/USD Pair Is Facing A Major Bearish Trend Line With Resistance Near 1.3240
The British Pound is finding bids near the 1.3180 zone against the US Dollar. The GBP/USD pair is recovering and trading above the 1.3200 resistance zone.
It even climbed slightly above the 1.3225 level and the 50 hourly simple moving average. The pair is now facing resistance near the 1.3240 zone and a major bearish trend line on the hourly chart.
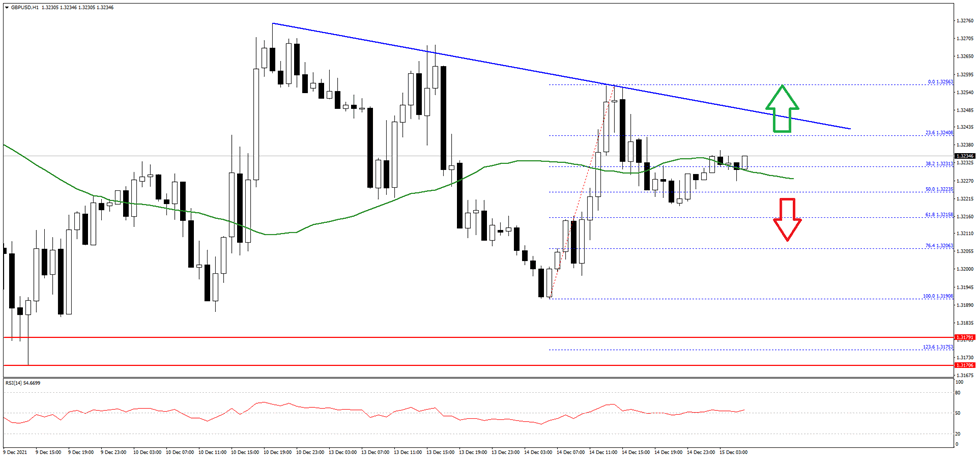
If there is a clear break above the 1.3240 and 1.3250 resistance levels, the pair could climb higher towards 1.3280 on FXOpen. The next key resistance is near the 1.3320 level. Any more gains might push the pair towards the 1.3350 level.
An initial support on the downside is near the 1.3200 level. The main support is forming near the 1.3180 level. A break below the 1.3180 support level could even push the pair below the 1.3120 support.
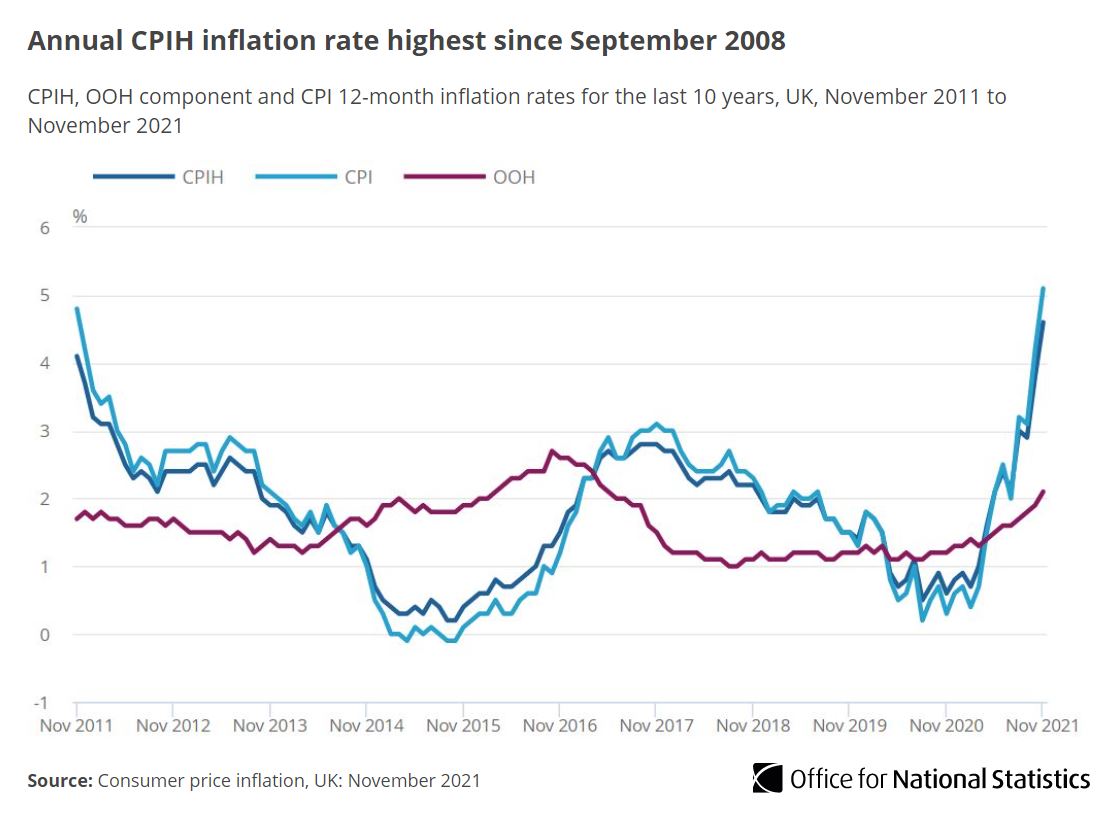
UK CPI rose to 5.1% yoy in Nov, highest since 2011
UK CPI accelerated further to 5.1% yoy in November, up from 4.2% yoy, above expectation of 4.7% yoy. That's also the highest level since September 2011, when it stood at 5.2%. CPI core rose to 4.0% yoy, up from 3.4% yoy, above expectation of 3.8% yoy.
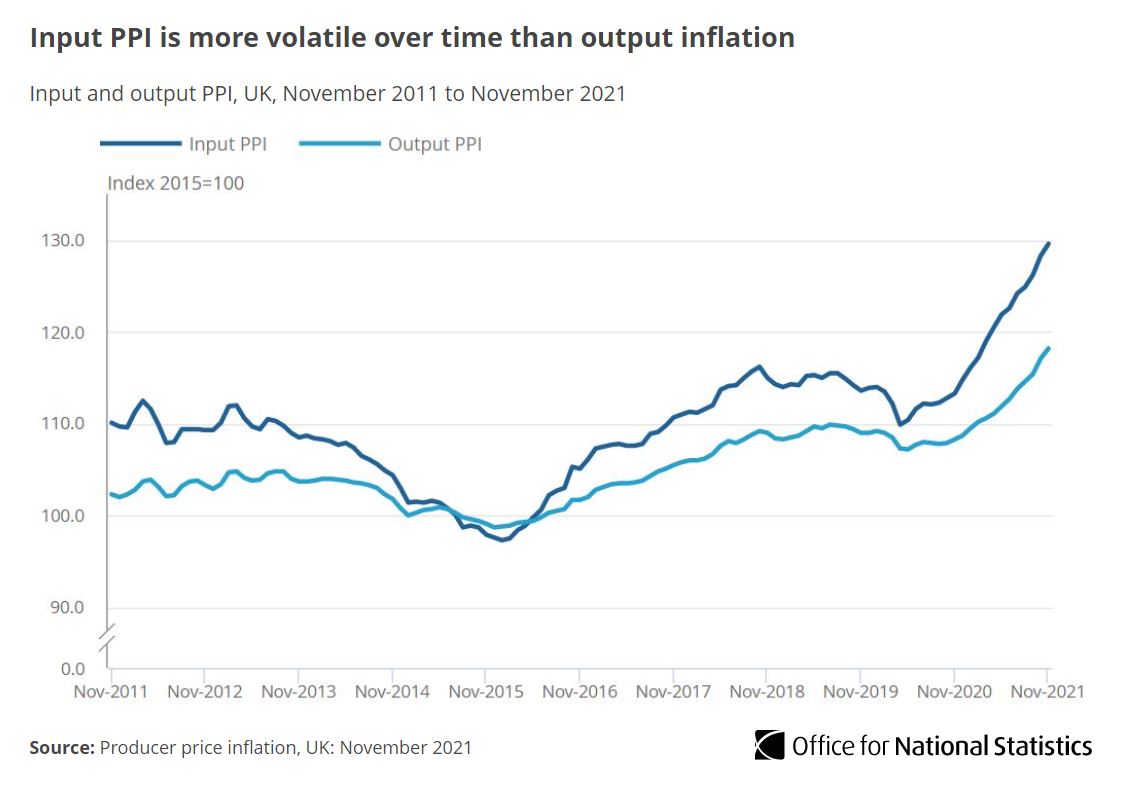
PPI input rose from 13.7% yoy to 14.3% yoy, above expectation of 11.0% yoy. PPI output rose from 8.6% yoy to 9.1% yoy, above expectation of 7.3% yoy. PPI core output also rose from 7.1% to 7.9%, above expectation of 7.1% yoy.
ONS Chief Economist Grant Fitzner said: "A wide range of price rises contributed to another steep rise in inflation, which now stands at its highest rate for over a decade. The price of fuel increased notably, pushing average petrol prices higher than we have seen before. Clothing costs - which increased after falling this time last year - along with prices for good, second-hand cars and increased tobacco duty all helped drive up inflation this month."
"The costs of goods produced by factories and the price of raw materials have continued to increased significantly to their highest rate for at least twelve years."
NZDUSD Pares Some Losses After 13-Month Low
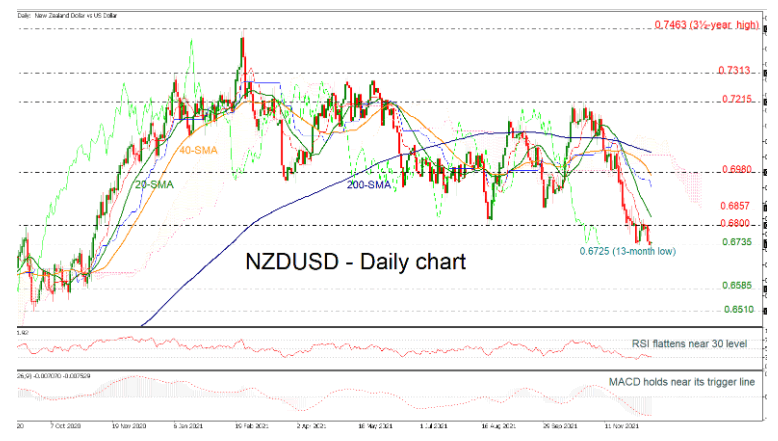
NZDUSD is recouping some losses that were posted earlier in the day after it plummeted to a fresh 13-month trough of 0.6725. The bearish view started following the pullback from the 0.7215 resistance level in the short-term, and the simple moving averages (SMAs) are heading south as well.
According to technical indicators, the RSI is pointing marginally up around the oversold zone, while the MACD is flattening above its trigger line in the negative region. The red Tenkan-sen line is moving below the blue Kijun-sen line, suggesting a negative bias.
If the price dives below the intraday trough, the bearish forces may take the market until the 0.6585 support level, taken from the low in November 2020, ahead of deeper declines to 0.6510.
On the flip side, a successful climb above the 0.6800 psychological mark may send the pair towards the next immediate resistance of 0.6857. Even higher, the 40-day SMA, which overlaps with the 0.6980 barrier, could halt the bullish move.
All in all, NZDUSD has been in a descending movement since October 28; however, any jumps above the 200-day SMA at 0.7047 may shift the outlook to bullish.
EURGBP Buyers Emerge At 0.85 Mark, Neutral Bias Dominates
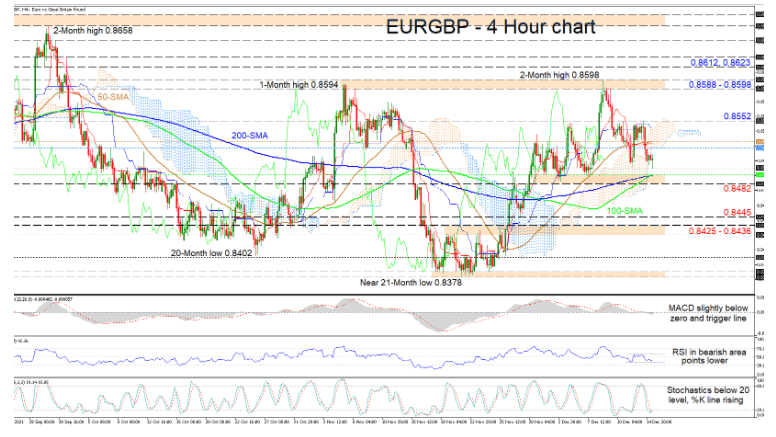
EURGBP has found footing again around the 0.8500 handle after the pullback from the two-month high of 0.8598. The two-week rally from 0.8384 was denied passage past the 0.8600 hurdle, and the pair has now reinstated its neutral tone. The slight incline in the simple moving averages (SMAs) is showing a tendency for the pair to maintain a positive bearing despite the recent downside correction.
The Ichimoku lines are not demonstrating any commanding directional forces, while the short-term oscillators are conveying mixed messages in momentum. The MACD, slightly beneath the zero threshold, is sliding below its red trigger line, while the RSI is gliding a tad lower in the negative zone. On the other hand, the stochastic oscillator’s lines are in oversold territory, but the %K line has overstepped its %D line and is rising, looking set to return above the 20 mark, which may then confirm growing buying interest.
If the price creates traction off the 0.8500 barrier, preliminary resistance could arise between the cloud’s lower band at 0.8522 and the 50-period SMA at 0.8529. Gaining buoyancy, the pair could then tackle the 0.8552 highs. Surpassing this border, the bulls could propel towards the key 0.8588-0.8598 resistance section. Additional advances from here may then target the 0.8612 and 0.8623 nearby obstacles.
Otherwise, if selling pressures increase, the 0.8500 mark and the neighbouring support zone from the 100-period SMA at 0.8492 until the 0.8482 low could behave as tough upside defences. In the event sellers drive the price beneath the latter, which is a reinforced base, the price may dive for the November 29 trough of 0.8445 before battling the 0.8425-0.8436 support boundary.
Summarizing, EURGBP’s short-term neutral bias holds a lower limit at 0.8378 and an upper limit at 0.8598. Nonetheless, for directional impetus to start to mature, the price would need to either slip beneath the 0.8482-0.8492 support zone or jump above the 0.8552 border.
US OIL Seeks Support
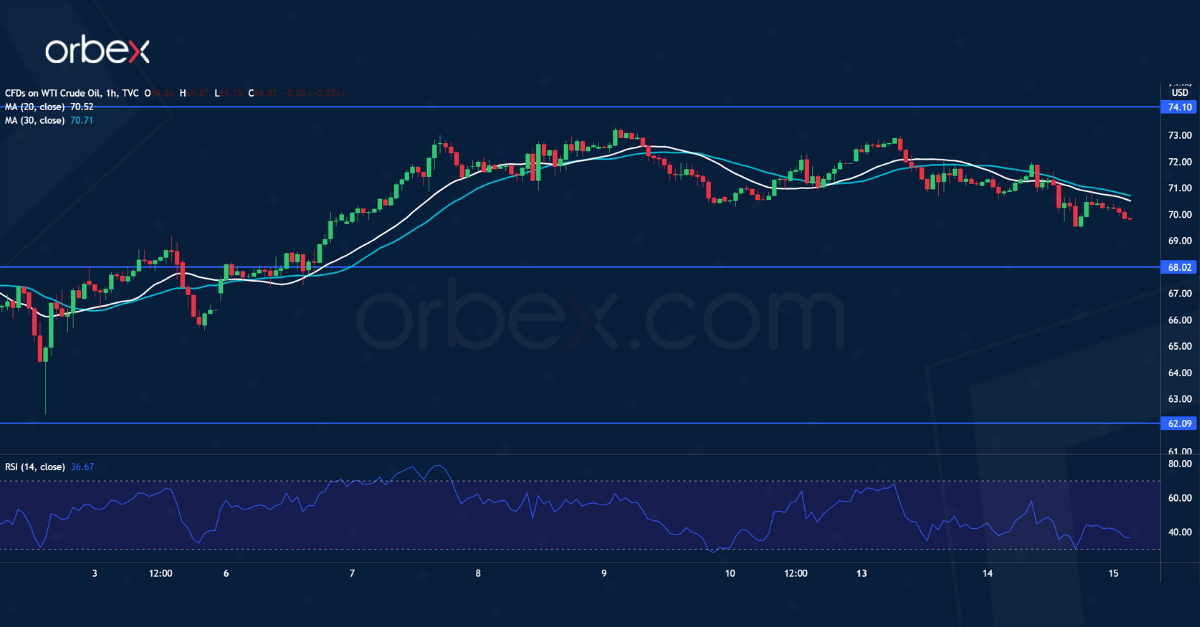
Oil prices struggled after the International Energy Agency said that the omicron strain may threaten global demand.
WTI crude is hovering under the 20-day moving average after the RSI briefly shot into the overbought territory. 74.10 near the 30-day moving average seems to be a tough nut to crack for now.
A bullish breakout would attract momentum buyers and send the price to the daily resistance at 79.00. Otherwise, 68.00 from the latest rally is the support to keep the rebound valid.
GBP/CAD Rises Towards Key Resistance
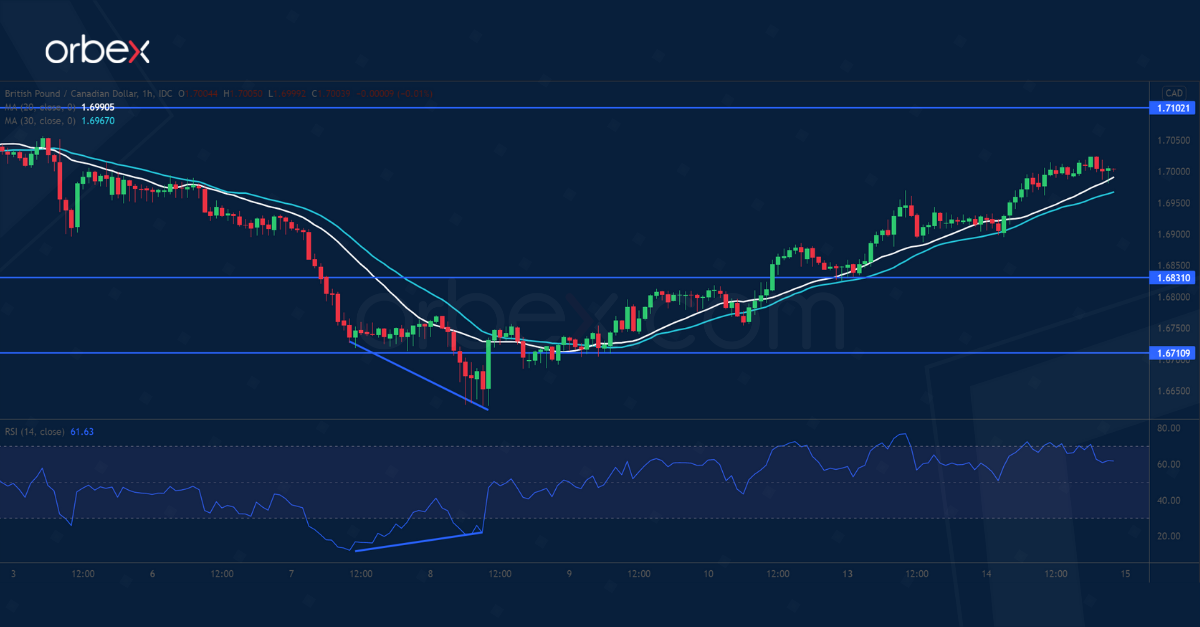
The pound bounced back after Britain showed strong wage growth in the three months to October.
A bullish RSI divergence indicated a loss of momentum in the latest sell-off. A break above 1.6770 and then a bullish MA cross was the confirmation for a reversal.
The pair is heading towards the daily resistance level at 1.7100. Its breach may lead to a broader rally in the medium term. In the meantime, an overbought RSI could temporarily limit the extension. 1.6900 is the closest support in case of a pullback.
XAU/USD Awaits Breakout
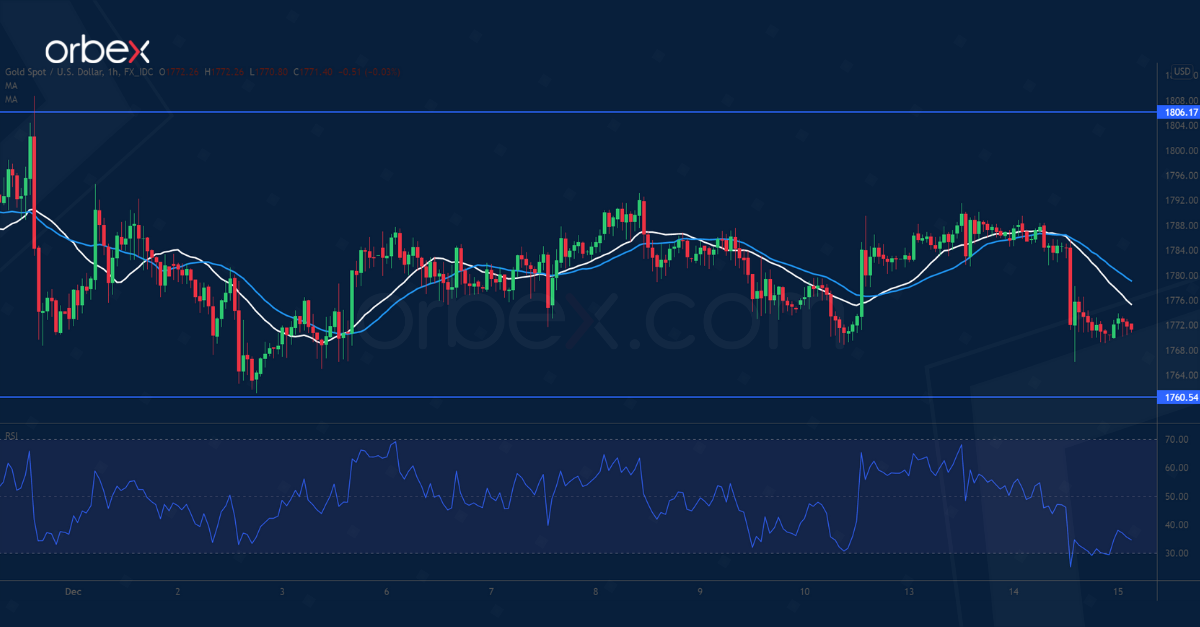
Gold consolidates as traders await the Fed’s monetary policy update. The metal came under pressure after it erased all gains from the November rally.
Price action is stuck in a narrowing range between the daily support at 1760 and 1806. This indicates the market’s indecision.
A bearish breakout would confirm the bearish MA cross on the daily chart and trigger an extended sell-off towards the floor at 1680. On the upside, a rally would send the price to retest the previous peak at 1870.
The Fed Taking A More Decisive Approach On Inflation
Markets
An unexpected acceleration in US PPI inflation (0.8% M/M and 9.6% Y/Y) yesterday triggered a temporary rise in US bond yields, reinforcing the case for decisive Fed action at today’s policy decision. Part of the move was reversed (in a risk-off context). US yields finally finished the session 2.5 bps/3.0bps higher across the curve, with rise solely due to a higher real yield. German yields, also closed 1.0/1.5 bp higher in a technical rebound. The mix of persistent inflation risk and uncertainty on the impact of omicron for (global) growth weighed on risky assets. US equities lost between 0.3% (Dow) and 1.14% (Nasdaq). The dollar gained modestly (DXY close at 96.57, EUR/USD at 1.126). The yen didn’t profit from save haven flows (USD/JPY close 113.70).
Today’s US eco calendar is well filled with data that usually are supposed to have market-moving potential including US retail sales, the Empire manufacturing survey, import prices and NAHB housing confidence. However, any market reaction will be restrained by investors awaiting the final verdict of the FOMC policy decision. The Fed since November reduced asset purchases by $15 bln p/m. Persistent upward inflation surprises ‘forced’ Fed Chair Powell (and other high profile MPC members) to bury the narrative on the transitory nature of inflation and pre-announcing accelerated tapering of asset purchases, probably to $30 bln p/m from January. Net buying might finish at the end of Q1. This gives the Fed ample room of maneuver to asses the start and pace of rate hikes. In this respect, the new Fed dots will be very instructive on how MPC members intend to use the room to start more aggressive anti-inflationary action. Anything less than three projected 2022 rate hikes probably will be a disappointment for markets as frontloading is seen necessary to avoid more aggressive action further out. In this respect, it is also interesting to see the MPC’s insights on the expected length of the cycle and whether it will come close the neutral Fed rate. A favorable employment outlook could put the Fed path well beyond what markets are currently expecting. The Fed confirming to step up its anti-inflationary narrative still should put the onus at the short end of the curve. However, LT real yields recently showed more convincing signs of bottoming (10-y real yield returned >-1.0%). Is this an indication of a bottoming for the aggressive flattening at the long end of the curve? The Fed taking a more decisive approach on inflation and a bottoming in real yields in theory still put the dollar in pole-position. The zone 96.64/94 remains first topside reference for the DXY TW USD index. In EUR/USD 1.1228 marks minor interim support ahead of the key 1.1186 year low. A break of the latter evidently is also conditional to tomorrow’s ECB (re)assessment on inflation.
This morning, UK November CPI inflation is reported at 0.7% M/M and 5.1% Y/Y for the headline and 4.0% Y/Y for the core, both above market expectations. EUR/GBP declines a few ticks. The 0.8500 barrier is within reach.
News headlines
The Chilean central bank as expected raised the policy rate from 2.75% to 4% yesterday. The second hike straight comes amid rising inflation (6.7% y/y in November) and inflation expectations as the economy is expected to expand more than a record 11% this year alone. However, expectations for households and businesses have recently taken a turn for the worse due to spiraling prices, the bank said. The central bank stated clearly the rate “will be further increased in the short term, to exceed its nominal neutral level”. Chile’s peso strengthened vs the USD to USD/CLP 840 yesterday but still trades weak from a historical perspective. Political uncertainty ahead of highly-contested presidential elections batters the currency.
The House of Representatives voted early Wednesday to raise the US’s debt ceiling by $2.5tn to over $31tn. It is expected to extend the government’s borrowing capacity into early 2023, ending months of uncertainty. The 221-209 vote sends the bill to president Biden. The resolution was approved earlier by the evenly split Senate after new legislation approved a one-time process that shields the debt ceiling discussions from a potential Republican filibuster while also allowing it to pass with a simple majority.
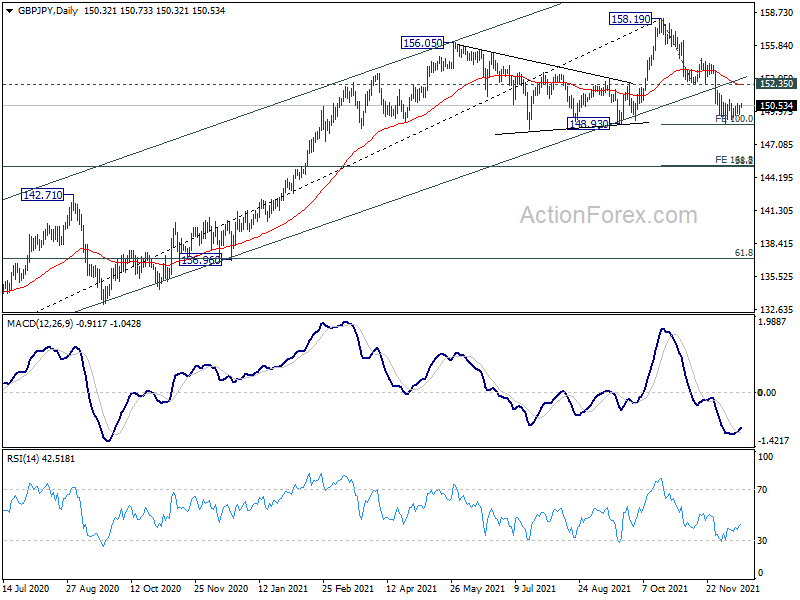
GBP/JPY Daily Outlook
Daily Pivots: (S1) 149.97; (P) 150.27; (R1) 150.77; More...
Range trading continues in GBP/JPY and intraday bias remains neutral first. On the downside, firm break of 148.93 key structural support will carry larger bearish implications. Next target is 161.8% projection of 158.19 to 152.35 from 154.70 at 145.25. On the upside, however, break of 152.35 support turned resistance will argue that the pull back from 158.19 is complete. Intraday bias will be turned back to the upside for retesting 158.19 high.
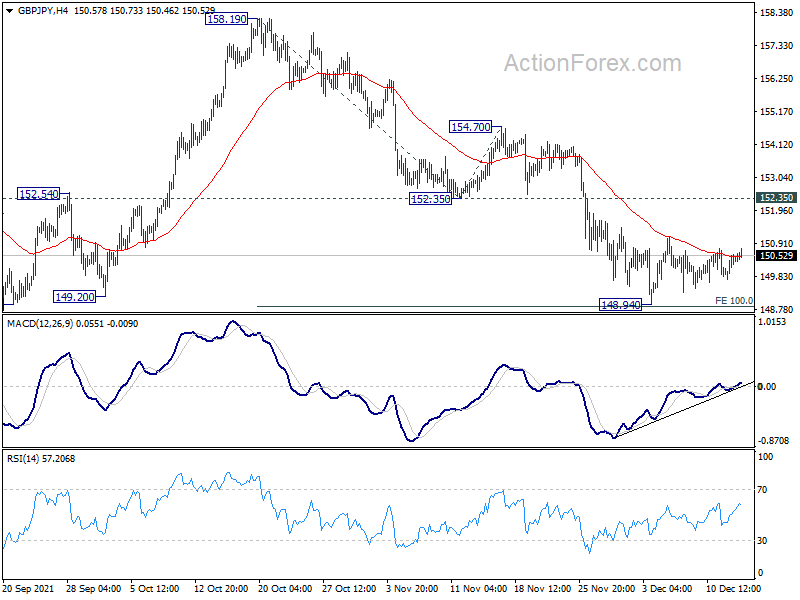
In the bigger picture, the break of medium term channel support, and bearish divergence condition in week MACD are raising the chance of medium term topping at 158.19. Firm break of 148.93 support will argue that GBP/JPY is at least correcting the whole rise from 123.94 (2020 low). In this case, deeper fall would be seen to 38.2% retracement of 123.94 to 158.19 at 145.10. Nevertheless, strong rebound from 148.93 will retain medium term bullishness for another rise through 158.19 at a later stage.