

Sample Category Title
GBPAUD Hits The Upper Bollinger Band, Bullish Forces Persist
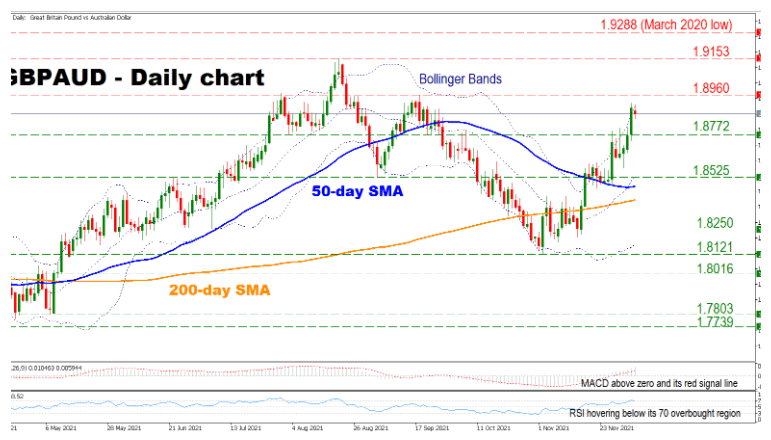
GBPAUD powered back higher after its early November low amid strengthening positive momentum. The price is currently located above the 50- and 200-day simple moving average (SMA), reinforcing the bullish short-term sentiment. However, the pair is trading near its upper Bollinger Band indicating that an immediate pullback should not be ruled out.
Short-term momentum indicators are supporting a positive bias as the RSI is found above its 50 neutral mark, while the MACD is found above zero and above its red signal line.
Should the bulls remain in charge, initial resistance might be found at the 1.8960 level. Surpassing this barrier could open the door towards the 1.9153 obstacle. A decisive move above this point could strengthen the pair’s positive momentum, sending the price to test its March 2020 low of 1.9288.
On the flip side, if the price crosses below the 1.8772 level, immediate support might be found at the 1.8525 barrier. A break below that point could send the pair to test the 50-day SMA currently at 1.8474, before sellers shift their attention towards the 200-day SMA currently located at 1.8407. Breaching the latter could intensify the selling pressure, paving the way towards the 1.8250 obstacle.
In brief, despite the fact that the latest upside move seems overextended, the short-term outlook for the pair is bullish. For sentiment to change, sellers would need to break below the 200-day SMA.
USD Slips From US Employment Report’s Mixed Signals
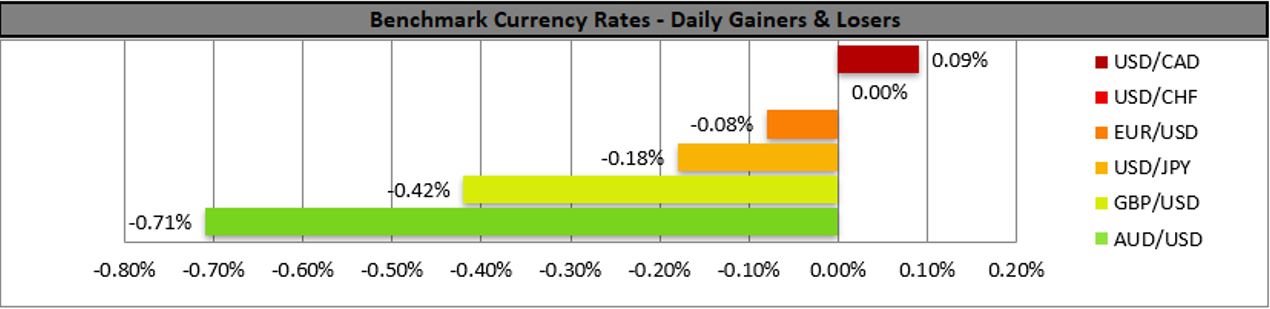
The USD tended to slip against some of its counterparts after mixed signals being sent by November's Employment report yet opened with a positive gap early today albeit volatility seems to remain rather low.
November's employment report tended to send out mixed signals on Friday as the NFP figure came out far lower than October's and what was expected, yet the unemployment rate dropped lower. On the other hand, Canada's November employment data seemed to remain solid as the employment change figure rose substantially and the unemployment rate dropped, showing a tightening of the Canadian employment market. Nevertheless, a risk off sentiment and wobbling oil prices prevented the CAD from capitalising substantially from the releases. Oil prices tended to gain early this morning recovering some ground after Friday's drop as OPEC announced that it will continue with supply adjustments “to ensure we attain stability in the oil market on a sustainable basis” OPEC's Secretary General stated. The EUR seemed to remain steady against the USD, yet bearish tendencies exist for the pair and ECB President Lagarde on Friday reiterated her view of a temporary nature of inflation and that rate hikes are unlikely in 2022. Also we must note that the Aussie's weakening against the USD is continuing as the Omicron variant has hit Australian soil but also the commodity currency traders are eyeing RBA's interest rate decision, due out tomorrow during the Asian session. The bank is widely expected to remain on hold, and should it reiterate that rate hikes are not expected until end of 2023, we may see AUD slipping.
AUD/USD maintained its bearish tendencies as it broke the 0.7045 (R1) support line, now turned to resistance and continued lower to test the 0.6990 (S1) support level, thus reaching a 13 month low level. We intend to keep our bearish outlook for the pair as long as it remains below the downward trendline incepted since the 2nd of November. We also note the RSI indicator below our 4-hour chart that has dropped below the reading of 30 confirming the bears' dominance yet at the same time may imply that the pair has reached oversold levels and is ripe for a correction higher. Should the bears actually maintain control over the pair, we may see it breaking the 0.6990 (S1) and take aim for the 0.6920 (S2) level. Should a correction higher take place, we may see the pair aiming if not breaking the 0.7045 (R1) level.
GBP/USD renewed its bearish tendencies breaking the 1.3280 (R1) support line. We tend to maintain a bearish outlook for the pair as long as it remains below the downward trendline incepted since the 29th of October. Should the selling interest for cable intensify we may see it breaking the 1.3160 (S1) support line and aim for the 1.2990 (S2) level. In an intense bullish momentum we may see cable breaking the 1.3280 (R1) resistance line, the prementioned downward trendline and aim for the 1.3430 (R2) level.
As for the rest of the week
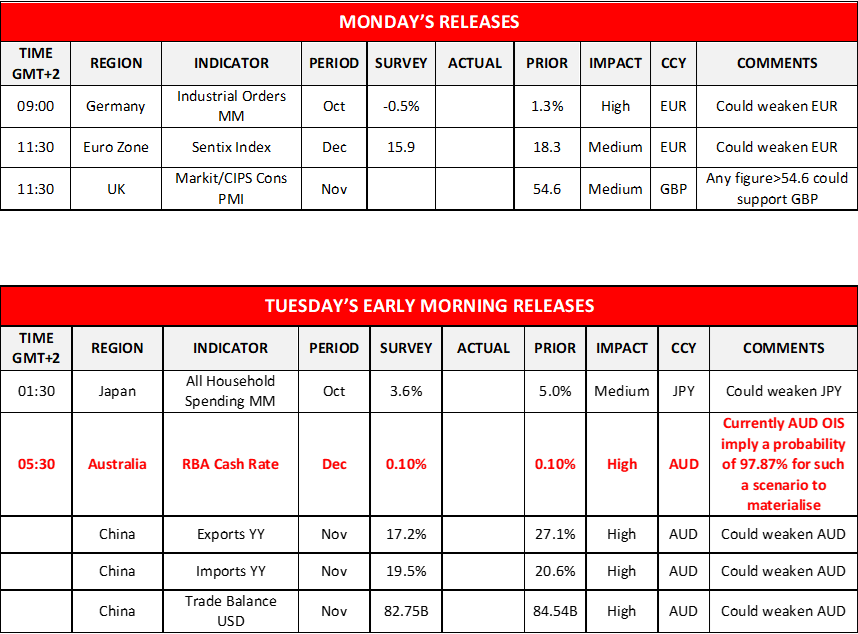
On Monday we have a light calendar with Germany's industrial orders for October and Eurozone's Sentix index for December. On Tuesday, we get China's trade balance for November in the Asian session while Australia's RBA is to release its interest rate decision. In the European session we get Germany's industrial output for October, Germanys' December ZEW indicators and in the American session we get Canada's trade balance for October. On Wednesday we get Japan's revised GDP rates for Q3 and later on from Canada we get BoC's interest rate decision. On Thursday, China's inflation metrics for November, Germany's trade balance and Norway's GDP rate both for October and in the American session the weekly US initial jobless claims figure are due out. On Friday we note the release of Japans' corporate goods prices for November, Germany's final HICP rate for October, UK's GDP rate and manufacturing output rate both for October, Norway's CPI rates for November, while later we get the US inflation measures for November and the preliminary University of Michigan consumer sentiment for December.
AUD/USD H4 Chart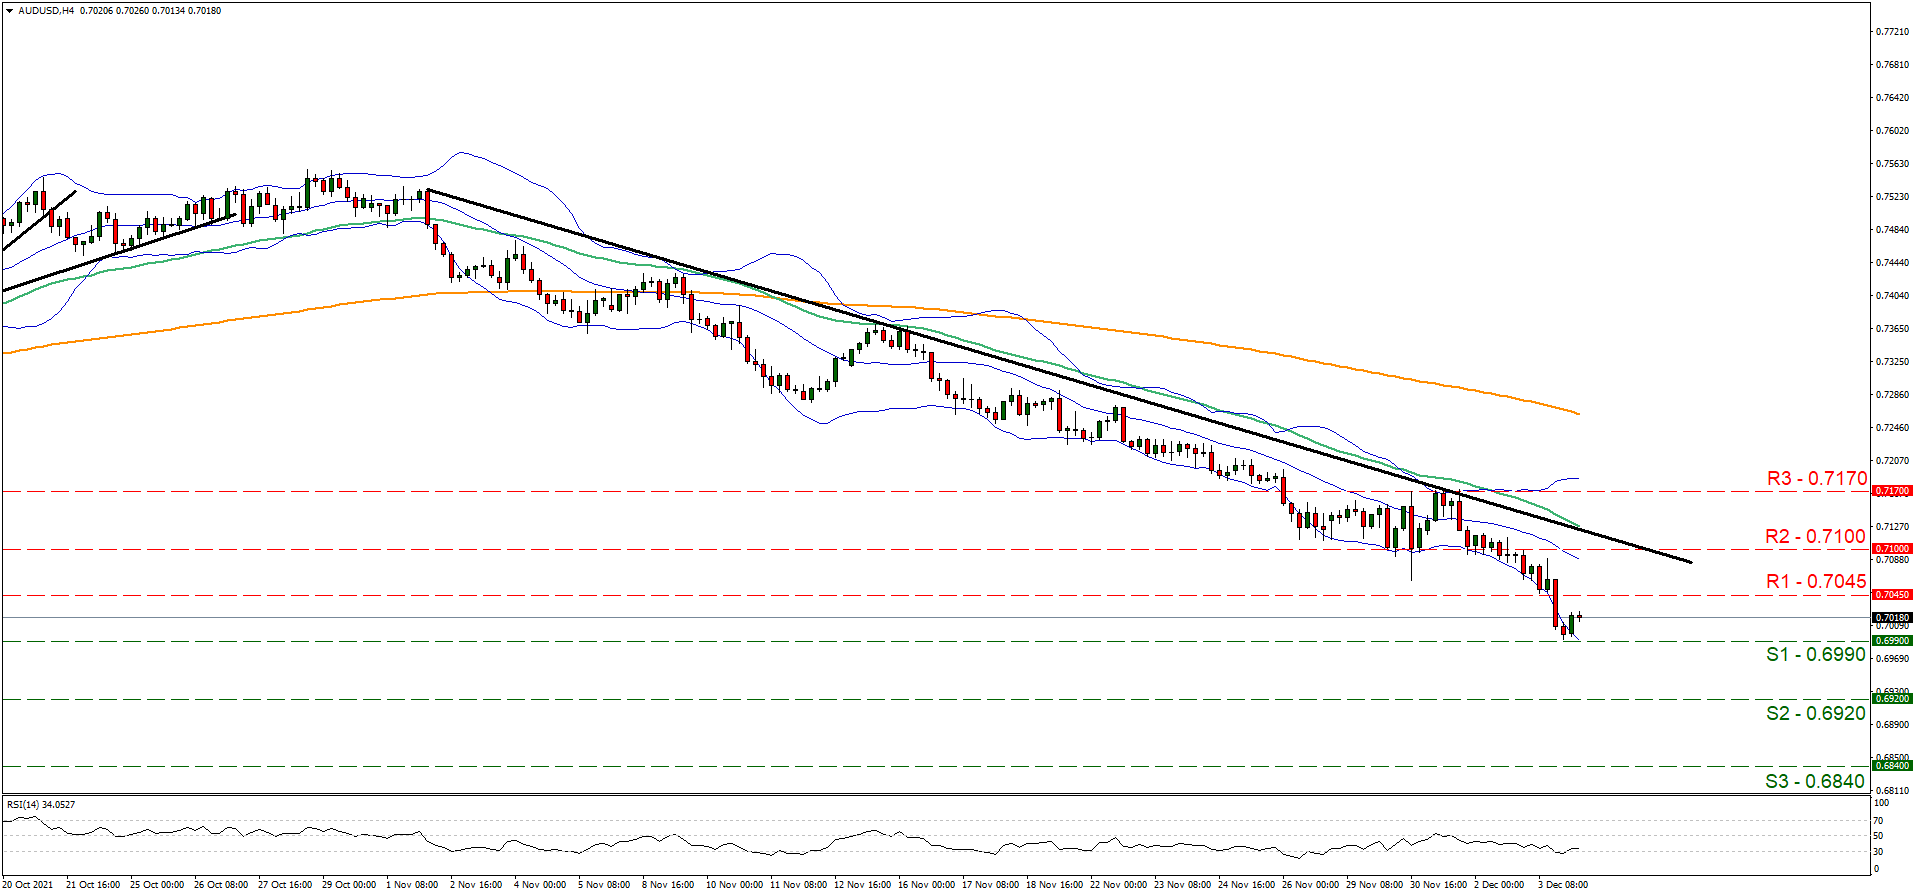
Support: 0.6990 (S1), 0.6920 (S2), 0.6840 (S3)
Resistance: 0.7045 (R1), 0.7100 (R2), 0.7170 (R3)
GBP/USD H4 Chart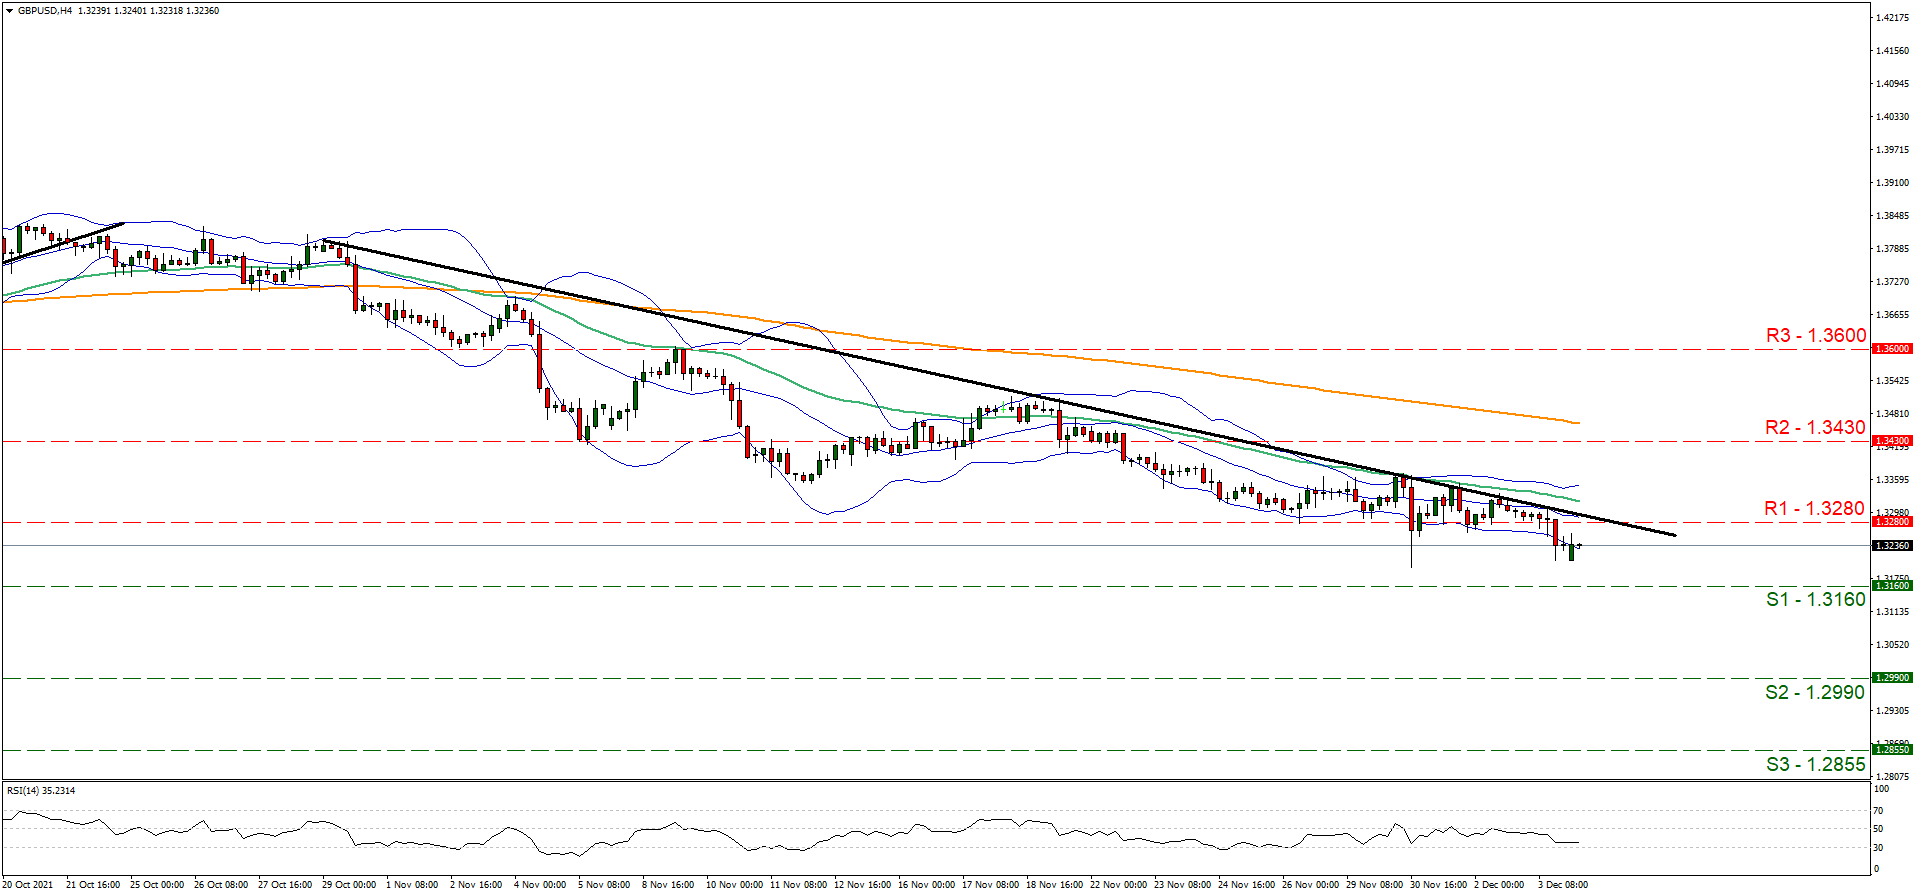
Support: 1.3160 (S1), 1.2990 (S2), 1.2855 (S3)
Resistance: 1.3280 (R1), 1.3430 (R2), 1.3600 (R3)
EUR/USD Outlook: Near-Term Action Is Still Directionless But Larger Picture Remains Bearish
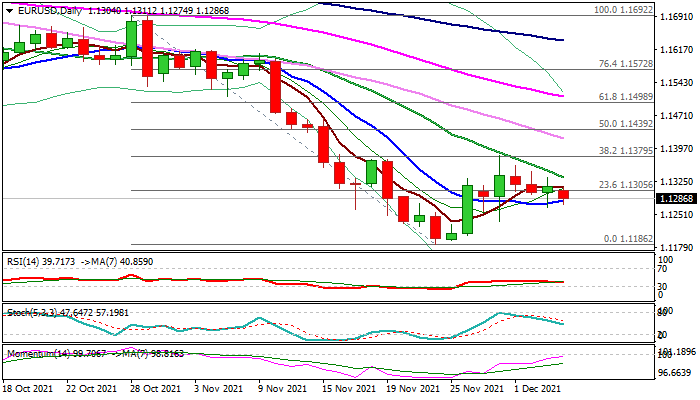
The EURUSD is standing at the back foot in early Monday’s trading and probing again through 10 DMA (1.1281) which marks significant support as the pair has registered six consecutive daily closes above it.
This has generated a positive signal, but near-term action remains without clear direction after the recovery from the new 2021 low (1.1186) was capped by falling 20DMA and continues to move within a narrowing range between two indicators.
Triple weekly failure to close below pivotal Fibo support at 1.1290 (61.8% of 1.0635/1.2349) signals the formation of a bear-trap, which underpins the action, however, the signal still needs confirmation on a break above 20DMA (1.1334) and Fibo barrier at 1.1379 (38.2% retracement of 1.1692/1.1186 bear-leg).
Daily studies remain mixed, but weeklies are in a full bearish setup, adding to a negative outlook.
Expect initial direction signal on break of either barrier, with loss of 10DMA support to confirm bearish continuation and unmask targets at 1.1040/00.
Conversely, a sustained break of 1.1379, would ease downside pressure and allow for a stronger correction towards 1.1439 (50% of 1.1692/1.1186) and 1.1500 zones (Fibo 61.8%/falling 55DMA).
Res: 1.1334, 1.1379, 1.1439, 1.1500.
Sup: 1.1267, 1.1235, 1.1204, 1.1186.
EURUSD Struggles To Surpass 20-Day SMA, Looks Bearish
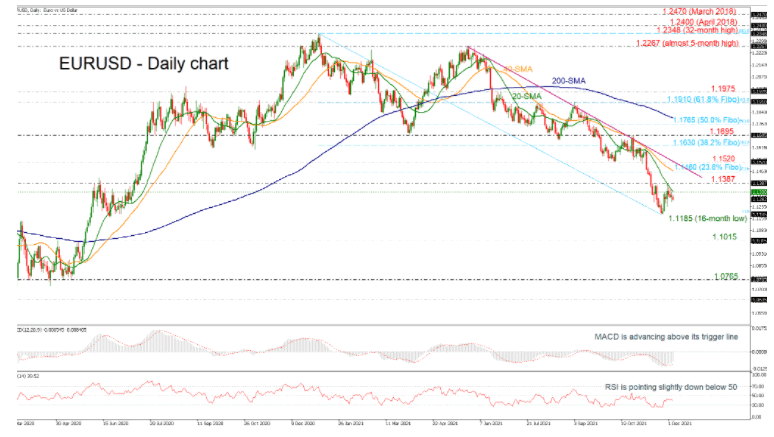
After being rejected from the 1.1387 resistance level, EURUSD remains below the 20-day simple moving average (SMA) in the short-term. The pair is still trading well below the long-term descending trend line, while the technical indicators seem to face contradicting signals. The RSI is still below 50 and is pointing down; however, the MACD is heading upwards despite being in the negative sector and above its red trigger line.
It may be difficult to overcome the significant resistance area between the 20-day SMA at 1.1330 and the 1.1387 barrier. Higher up, the price may reach the 23.6% Fibonacci retracement of the down leg from 1.2348 to 1.11185 at 1.1460 ahead of the 1.1520 resistance level, which overlaps with the downtrend line. The 38.2% Fibonacci retracement level of 1.1630 could be tested if the price breaks through the aforementioned line.
The 1.1015 support, taken from the inside swing high of April 2020, may be the next target if sellers can close decisively below the 16-month low of 1.1185. The 1.0765 barrier may be the next hurdle for bears to overcome if they dive below the latter level.
Overall, the long-term outlook for EURUSD is bearish. The current outlook may shift to neutral if the descending line and the 200-day SMA are breached.
Cryptocurrency Prices Attempt To Rebound After A Volatile Weekend
Cryptocurrency prices declined sharply during the weekend as sentiment in the industry waned. Bitcoin, the biggest cryptocurrency in the world, dropped by as much as 20% on Saturday. Other cryptocurrencies like Ethereum, Solana and Dogecoin also retreated. There was no immediate cause for the sell-off. But some analysts attributed the decline to the sell-off in growth stocks that happened on Friday. The tech-heavy Nasdaq 100 index declined by more than 390 points on Friday. There are concerns that the hawkish Fed will spur investor exodus from tech stocks and risky assets like Bitcoin. Another explanation was the unwinding of heavily shorted derivatives.
The US dollar remained in a tight range on Monday morning as the market reflected on the latest American jobs numbers. Data published by the Bureau of Labor Statistics (BLS) on Friday showed that the country’s unemployment rate continued dropping in November. The rate stands at about 4.2%, which is the lowest it has been since the pandemic started. This happened even as the number of jobs added in November was disappointed. The economy added about 240k jobs in November after it added more than 500k in the previous month. Still, these numbers mean that the Fed will maintain a hawkish sentiment next week.
The economic calendar will be relatively muted today. The only key data to watch will be the latest German factory order numbers. Analysts expect that these orders declined by 0.5% in the previous month. Analysts will be watching how countries will react to the rising number of Omicron variant infections. For example, during the weekend, Germany controversially announced that it will mandate everyone to be vaccinated by February. Meanwhile, investors will focus on the Australian dollar since the RBA started its monetary policy statement today.
EURUSD
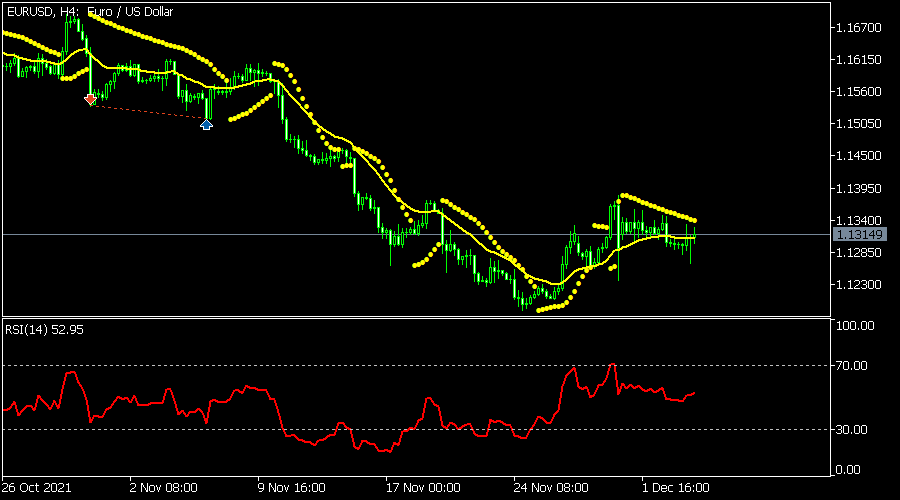
The EURUSD pair has moved sideways in the past few weeks. The pair is trading at 1.1315, where it has been in the past few days. The pair is trading at the 25-day moving average. It has also moved slightly below the dots of the Parabolic SAR indicator while the Relative Strength Index (RSI) is moving sideways. Therefore, the pair will likely remain in the current range in the near term.
GBPUSD
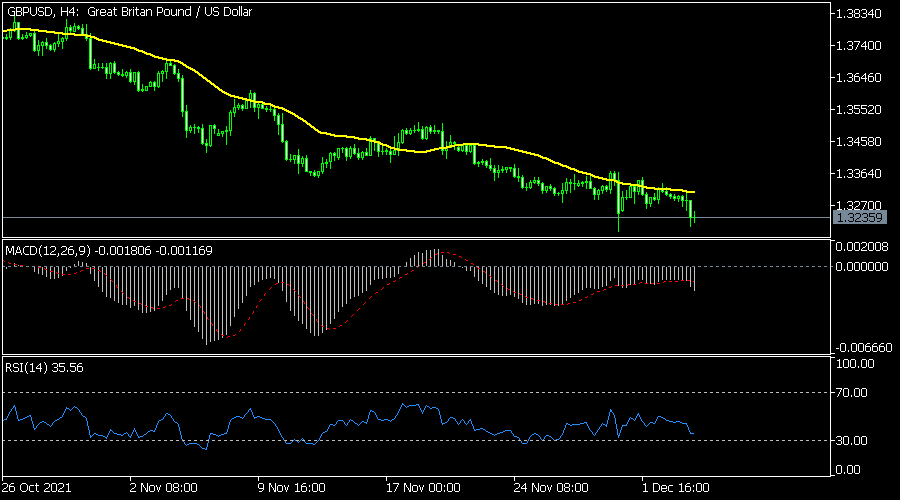
The GBPUSD pair tilted lower as investors assess the next action by the Bank of England (BOE). The pair is trading at 1.3225, which is slightly higher than last week’s low of 1.3200. On the four-hour chart, the pair is below the 25-day moving average. The MACD and the Relative Strength Index (RSI) have also dropped. Therefore, the path of the least resistance is lower since the Fed has already hinted at being hawkish.
AUDUSD
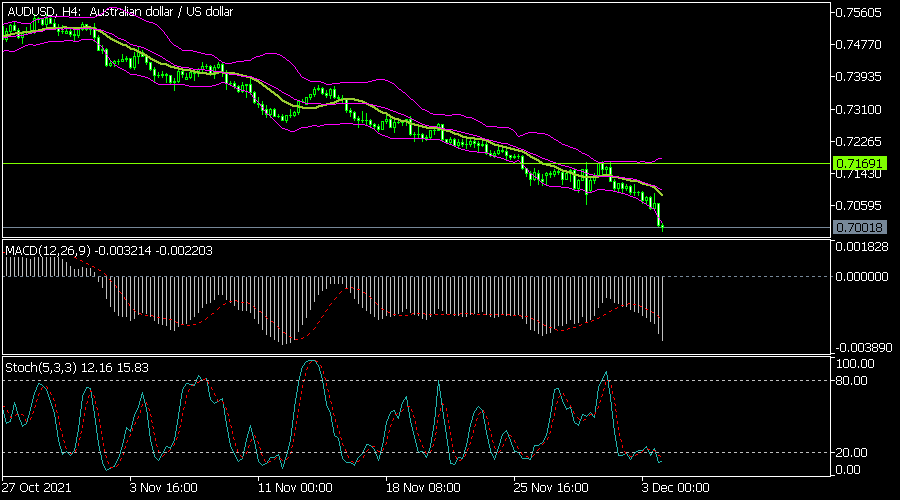
The AUDUSD sell-off accelerated as investors wait for the upcoming RBA interest rate decision. The pair fell to a low of 0.700, which was the lowest level since June last year. On the four-hour chart, the pair is below the 25-day moving average. It is also along the lower line of the Bollinger Bands. Therefore, the pair could see a brief rally ahead of the RBA decision.
GBP/JPY Daily Outlook
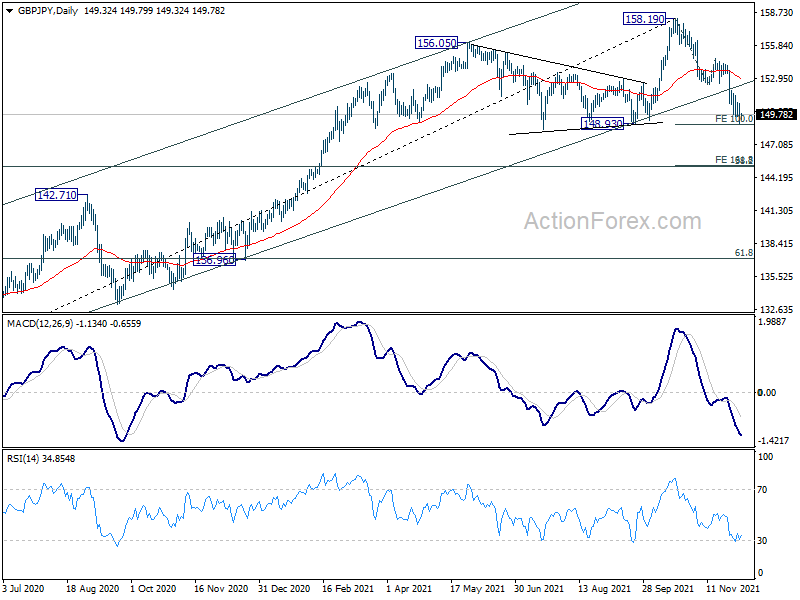
Daily Pivots: (S1) 148.61; (P) 149.69; (R1) 150.39; More...
Intraday bias in GBP/JPY remain son the downside. Focus stays on 100% projection of 158.19 to 152.35 from 154.70 at 148.86, which is close to 148.93 key structural support. Decisive break there will carry larger bearish implication and target 161.8% projection at 145.25 next. In any case, outlook will stay bearish as long as 152.35 support turned resistance holds, in case of recovery.
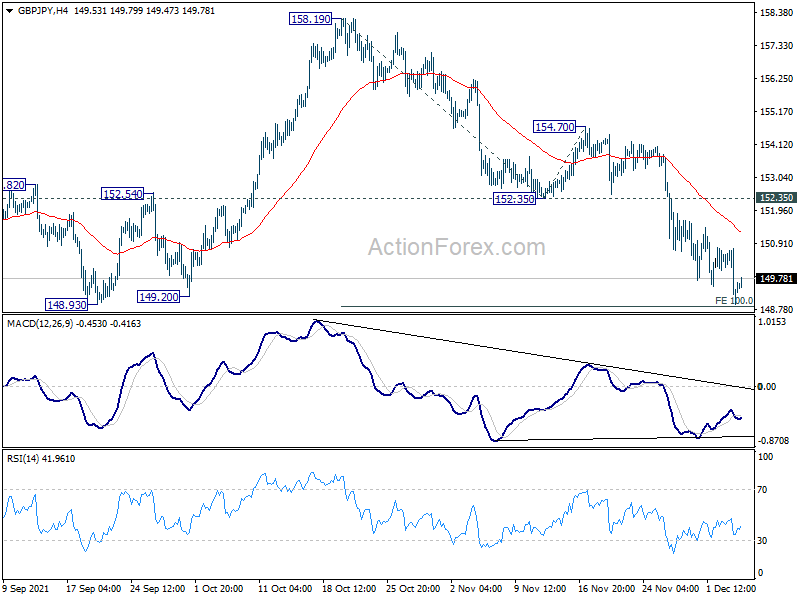
In the bigger picture, the break of medium term channel support, and bearish divergence condition in week MACD are raising the chance of medium term topping at 158.19. Firm break of 148.93 support will argue that GBP/JPY is at least correcting the whole rise from 123.94 (2020 low). In this case, deeper fall would be seen to 38.2% retracement of 123.94 to 158.19 at 145.10. Nevertheless, strong rebound from 148.93 will retain medium term bullishness for another rise through 158.19 at a later stage.
EUR/JPY Daily Outlook
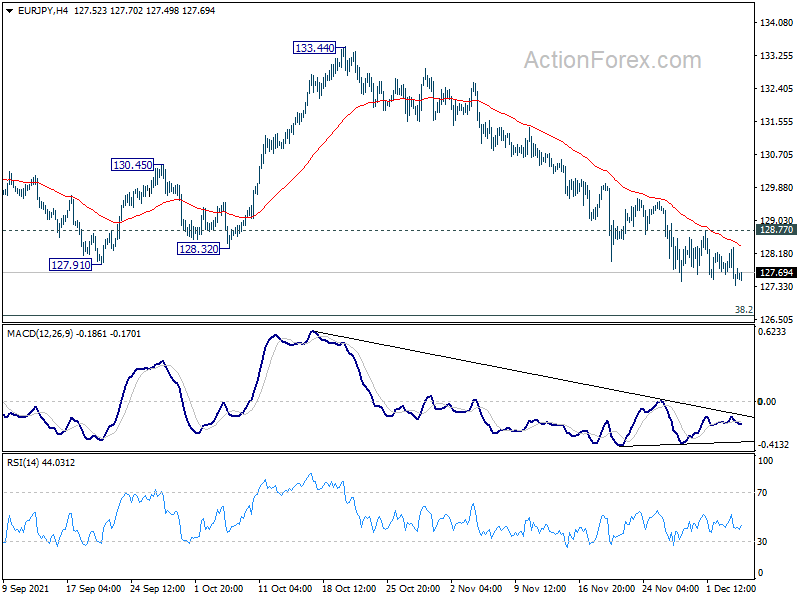
Daily Pivots: (S1) 127.23; (P) 127.78; (R1) 128.18; More....
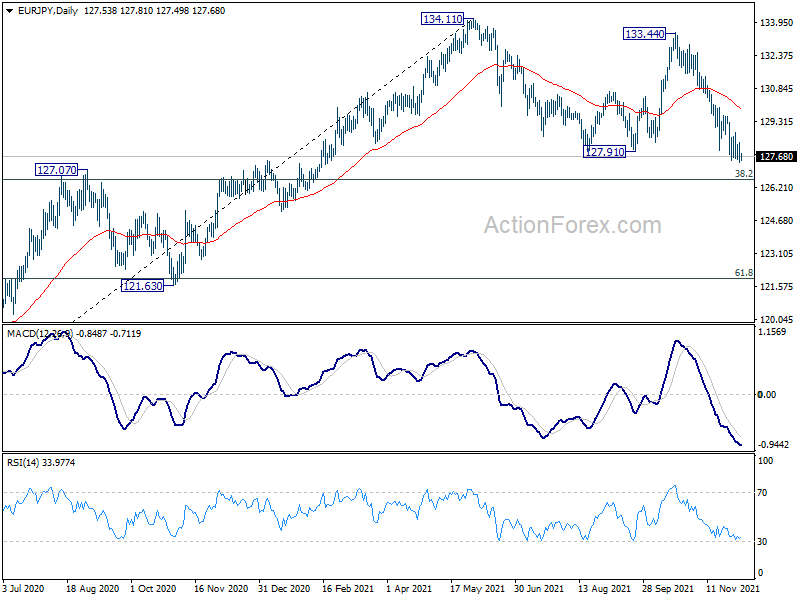
Intraday bias is EUR/JPY remains mildly on the downside for 126.58 medium term fibonacci level. We'd look for some support from there to bring rebound. But sustained break of 126.58 will carry larger bearish implications. On the upside, break of 128.77 resistance will turn bias back to the upside for stronger rebound.
In the bigger picture, as long as 38.2% retracement of 114.42 (2020 low) to 134.11 at 126.58 holds, up trend from 114.42 is still in favor to continue. Break of 134.11 will target long term resistance at 137.49 (2018 high). However, sustained break of 126.58 will raise the chance of medium term bearish reversal. In this case, deeper decline would be seen to 61.8% retracement at 121.94, and possibly below.
Brent Crude Trades Slightly Stronger This Morning Around $71.5/b
Markets
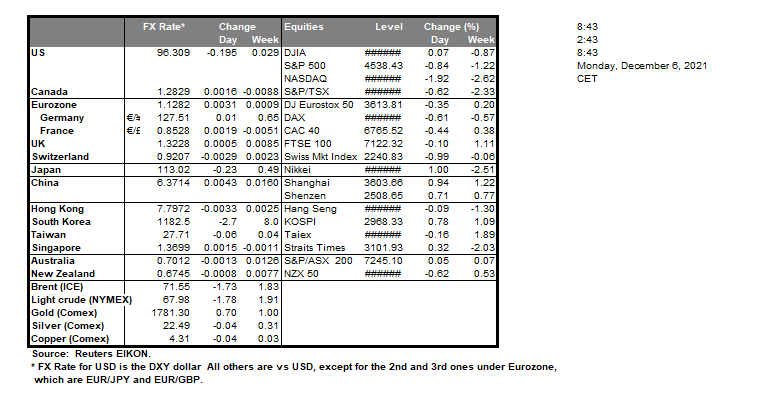
US payrolls may have missed consensus (210k vs 550k) on Friday, the separate household survey was much, much better (1.1m employment increase). Other elements including the unemployment and participation rate were both the lowest/highest since spring 2020. ISM non-manufacturing confidence later hit a new all-time high at 69.1, driven by roaring business activity and incoming orders. The strong batch of data failed to alleviate Omicron's concerns though. Markets didn’t feel like taking many risks ahead of the weekend. US stock indices fell almost 2% (Nasdaq). Core bond yields tumbled. The US outperformed even though the data cemented the Fed’s case for faster taper in December. The curve bull flattened, losing 2.5 bps (2y) to 10.1 bps (10y) with the latter breaking below the 1.41% neckline that supported a double top formation since September. German yields edged up to 3.1 bps lower (30y). Evaporating interest rate support hung in the balance with the risk-off for the dollar. EUR/USD whipsawed to close marginally higher at 1.1315. Japan’s yen and the Swiss franc felt good. USD/JPY finished at 112.8, EUR/CHF closed sub 1.04 for the first time since 2015. An almost 7 bps drop in UK gilt yields bruised sterling as well. EUR/GBP went into the weekend north of 0.85(5). Sentiment over the weekend turned for the better just a little. Premier Li end of last week fueled hopes for a reserve requirement ratio cut “at a proper time” but equity markets are not impressed (up to -2% in China). Besides Omicron, (repeated) defaulting Chinese real estate firms, as well as the tech crackdown, are grabbing most of the headlines. US bond yields do recover more than 4 bps after Friday’s steep drop and moves in the German Bund future suggests a higher yield opening as well. Today’s empty economic calendar suggests trading is at the mercy of sentiment and the technical charts. European/US stock futures are rising up to 1% but it’s too early to call. Regarding the interest rate markets, the (yield) bearish double top formation in the US 10y yield has been confirmed. The German variant finished last week below -0.35%, the November low and 61.8% retracement of the August-October upleg. Both spell more losses short-term and as long as the jury is out on whether the South African variant is a heavier burden for hospitals (thus forcing stronger mobility restrictions) than delta. We’ll be looking for the first clues regarding the matter somewhere by the end of this week. EUR/USD is at risk of losing 1.129 again, suggesting the pair for now is in the first place driven by yield dynamics.
News headlines
Czech National Bank chief economist Kral said in an interview with local daily HN that market expectations for the December policy meeting are in line with the central bank’s forecast. The CNB will likely raise its policy rate (currently 2.75%) by at least another 50 bps at the December 22 policy meeting. Czech money markets currently put the policy rate peak at around 4% in 2022 compared to 3.75% put forward by the CNB last month. Kral confirms that the policy rate will temporarily need to exceed the 3% neutral level to battle inflation. He isn’t worried that this will come with a stronger currency as it won’t hurt the economy. November CPI data will be published on Friday and are expected to show a new acceleration (from 5.8% Y/Y in October). Kral puts the peak at 7%+ in the first months of 2022. EUR/CZK isn’t going anywhere this morning, being stuck near the middle of the 25.20-25.80 trading range in place since May.
Saudi Aramco, the Kingdom’s state oil producer, raised prices for all crude grades that will be shipped to Asia by 60 cents from December and to the US by 40-60 cents. The move had been by and large coming, but nevertheless stings only days after OPEC+ decided to proceed with planned production increases despite uncertainty over the new Covid-outbreak and with the cartel predicting the oil market to shift from supply deficit to supply surplus early next year. Brent crude trades slightly stronger this morning around $71.5/b, extending its rebound from last week’s low just above $65/b.
Daily Technical Analysis
EUR/USD
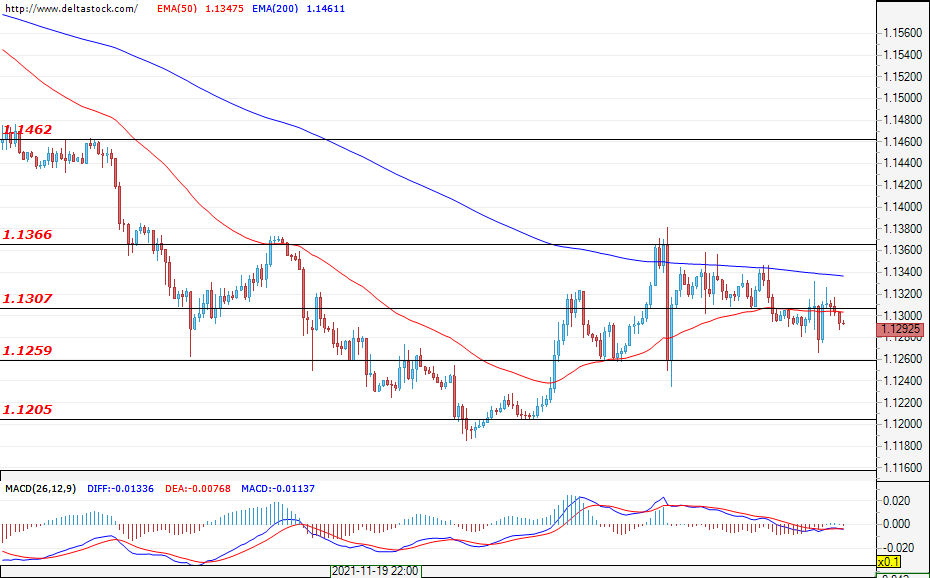
Current level - 1.1292
The euro ended last week almost unchanged against the dollar. The downtrend is violated and it seems that the pair is preparing to change its direction. The bulls managed to form a support at around 1.1260. The first resistance is found at around 1.1307, and the more serious obstacle for the buyers is the level of 1.1366. There is a change in market sentiment and a possible breach of 1.1366 would pave the way for the pair towards 1.1460. In a scenario, in which the bears return to the market and the support at 1.1260 is disrupted, there may be a new wave of sell-offs leading to a breach of 1.1200 and a follow-up attack on 1.1000. This week, increased trading activity can be expected around the announcement of the estimated GDP data for the euro area, scheduled for Tuesday at 10:00 GMT.
| Resistance | Support | ||
| intraday | intraweek | intraday | intraweek |
| 1.1307 | 1.1460 | 1.1259 | 1.1205 |
| 1.1366 | 1.1500 | 1.1259 | 1.1180 |
USD/JPY
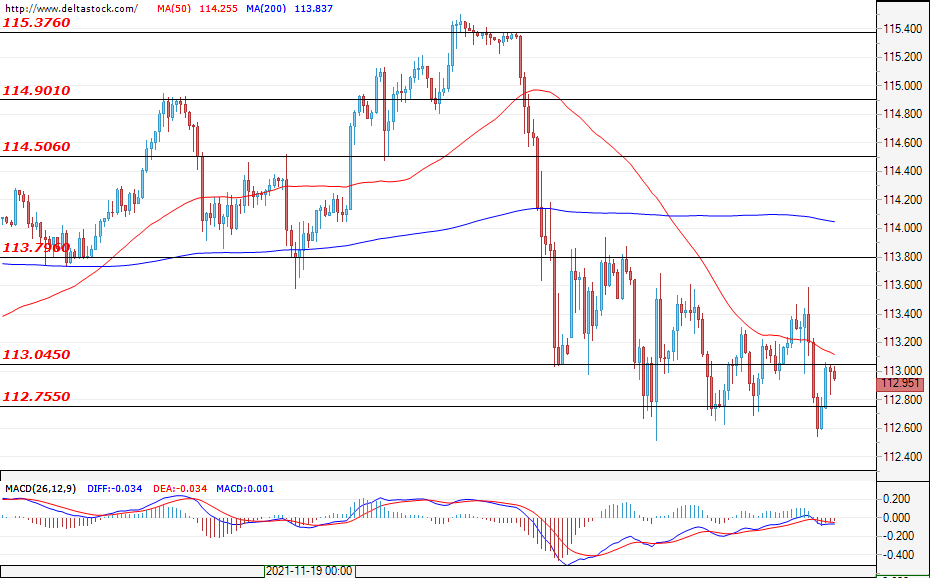
Current level - 112.95
The market currently lacks any clear direction and trading remains locked between the zones of 113.80 and 112.75. It is still possible for the market to renew the initial bearish momentum as, at the time of writing the analysis, prices are hovering just under the resistance at 113.04. At the moment, the 112.75 zone remains the main support. If it is overcome, it is possible that the bears will test the next level at around 112.00.
| Resistance | Support | ||
| intraday | intraweek | intraday | intraweek |
| 113.04 | 114.50 | 112.75 | 112.75 |
| 113.80 | 114.90 | 112.75 | 110.80 |
GBP/USD
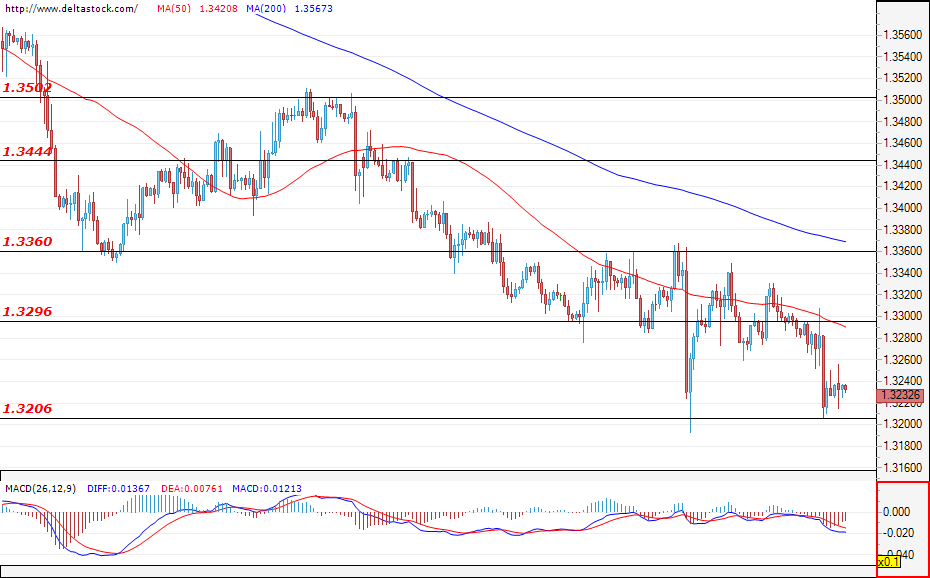
Current level - 1.3232
Difficulties for the sterling continue after the breach of the support at 1.3296. The bears tested the support at around 1.3206 for the second time, but failed to breach this level. The market shows divergence and it is possible that declines could slow down and the market could enter a range phase. When the bulls enter the market, a test and a breach of 1.3296 is a probable scenario. The trend coming from the higher time frames remains negative and new declines are still not ruled out. Should a breach of 1.3206 happen, an attack on the next zone at around 1.3150 can also be expected. Any major pullbacks should remain limited below 1.3360.
| Resistance | Support | ||
| intraday | intraweek | intraday | intraweek |
| 1.3296 | 1.3440 | 1.3206 | 1.3150 |
| 1.3360 | 1.3500 | 1.3206 | 1.3060 |
DAX 40 Bearish Trend Continues As Bears Are Trying To Push It Lower
DAX 40 technical analysis
- Bullish Bounce.
- Resistance Q H5 Strong Zone.
- Entry zone.
- M L4 is the target.
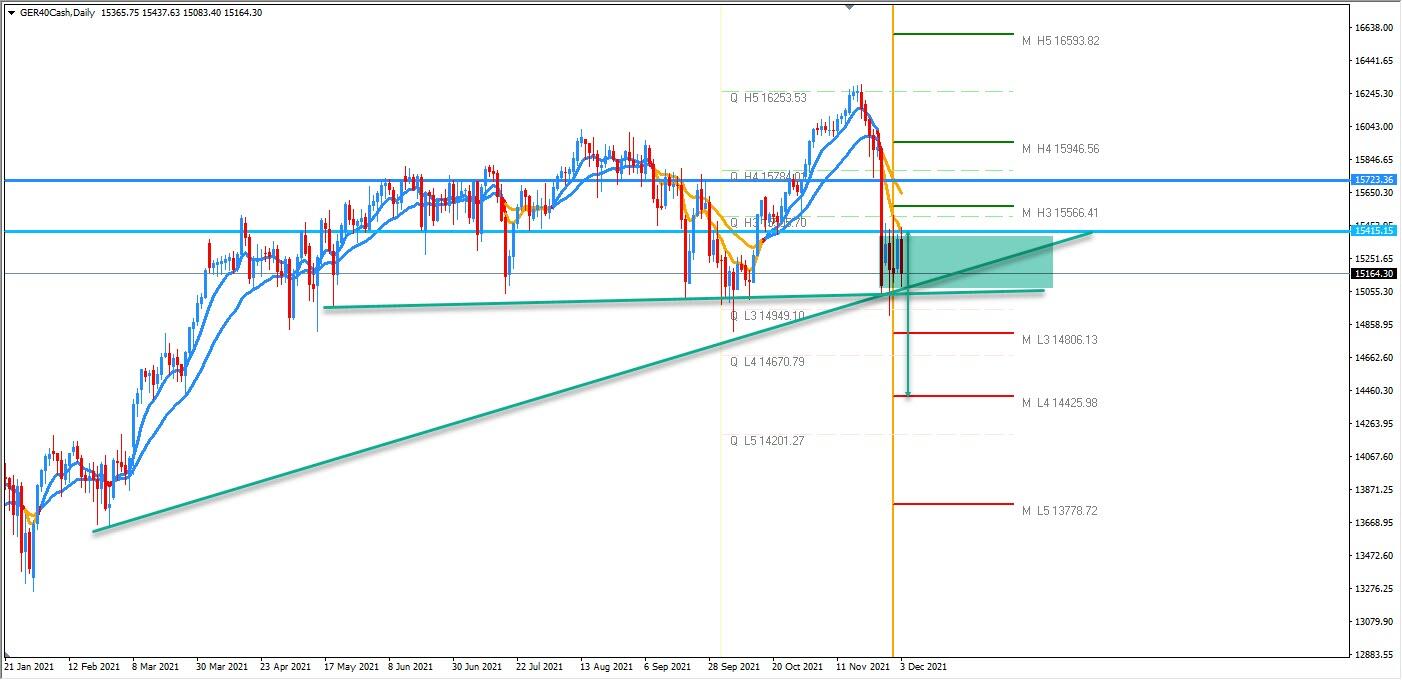
- Bouncing spot & Order block.
- Top of the swing high.
- Entry zone.
- Target.
The DAX is bearish. The market is trying very hard to break the support around 15050. M L3 is support and the target if 15050 is taken out. Equities are correlated to Yen and commodities. When commodities prices go down, Stock Markets go down and there is no demand for positive swaps on AUD pairs currently as opposed to JPY. When its a risk-off environment, usually the opposite occurs, and as a result, the JPY appreciates as foreign flows from Japan are repatriated back to their local currency. We can see that in the DAX which also correlates to EUR and JPY simultaneously. The final target is 14435 if the drop below 15050 happens.