Sample Category Title
GBP/JPY Daily Outlook
Daily Pivots: (S1) 153.31; (P) 153.68; (R1) 154.23; More...
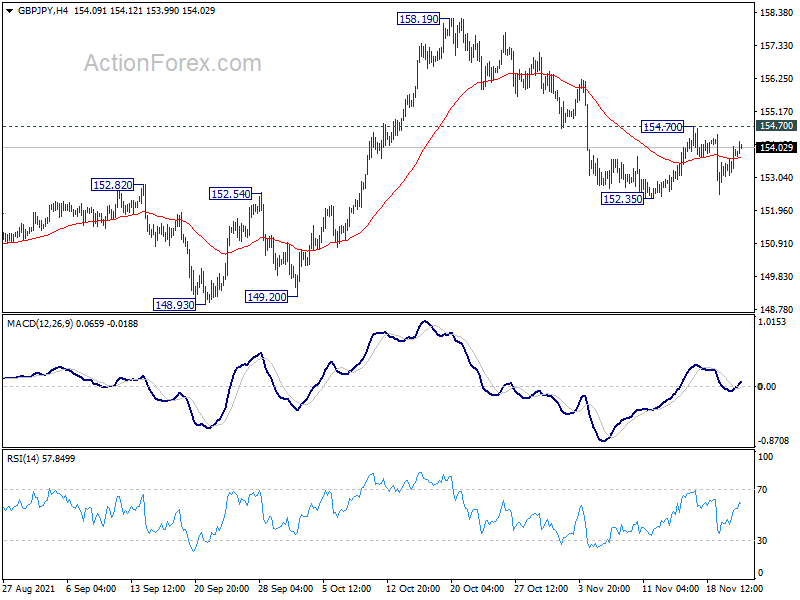
GBP/JPY is still bounded in range of 152.35/154.70 and Intraday bias remains neutral first. Further fall is mildly in favor and break of 152.35 will resume the decline from 158.19 to 148.93 key support next. On the upside, however, break of 154.70 will turn bias back to the upside for retesting 158.19 high instead.
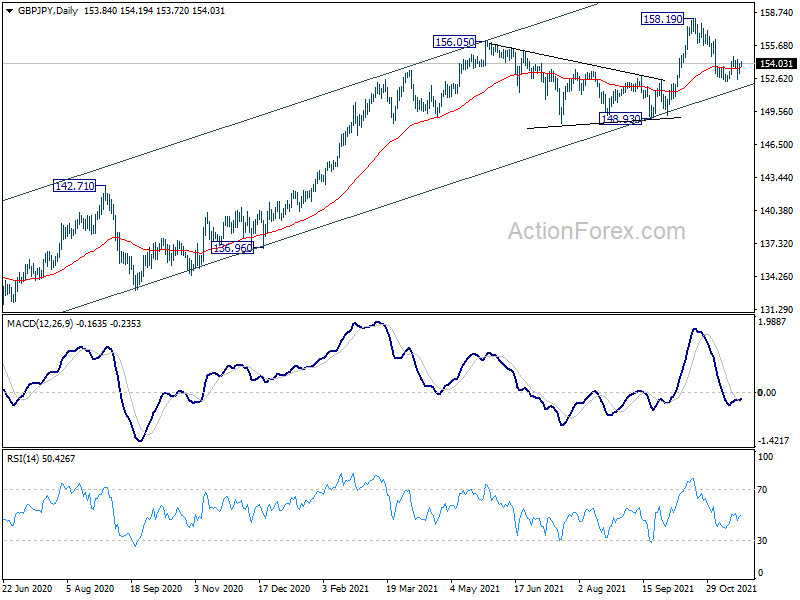
In the bigger picture, rise from 123.94 is seen as the third leg of the pattern from 122.75 (2016 low). Further rally is still expected as long as 148.93 support holds. However, firm break of 148.93 will argue that the medium term trend has reversed and bring deeper fall back to 142.71 resistance turned support first.
EUR/JPY Daily Outlook
Daily Pivots: (S1) 128.65; (P) 128.99; (R1) 129.42; More....
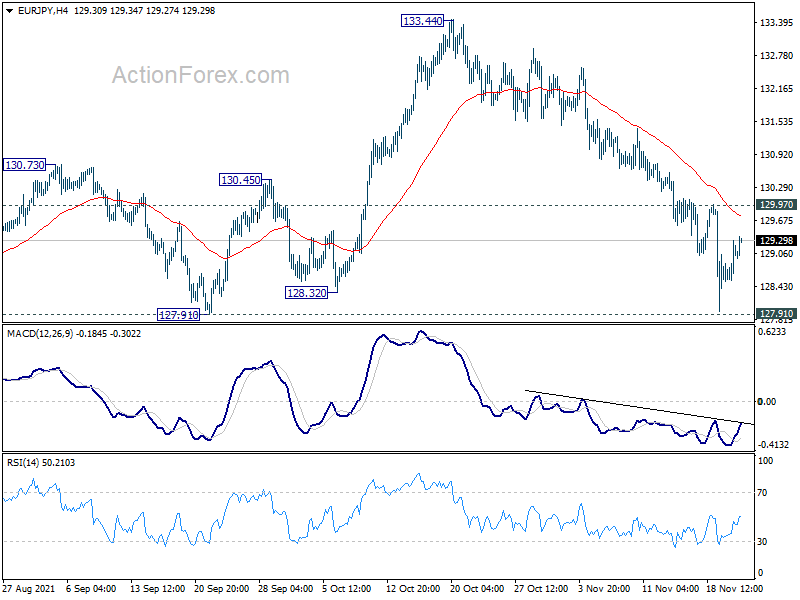
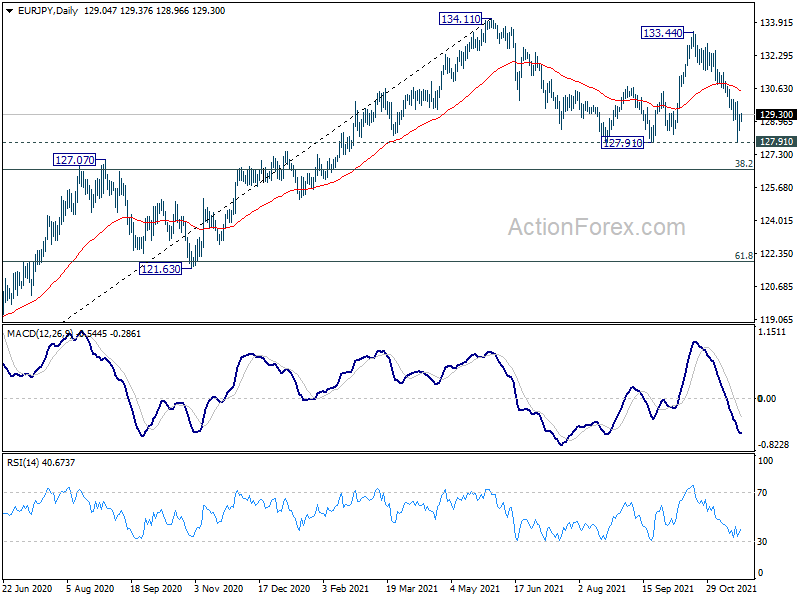
Intraday bias in EUR/JPY is turned neutral for now, as it recovered just ahead of 127.91 key support. On the upside, break of 129.97 will indicate short term bottoming, and turn bias back to the upside for rebound back towards 133.44 high. On the downside, however, break of 127.91 will extend the whole corrective pattern from 134.11, to 126.58 medium term fibonacci level next.
In the bigger picture, as long as 38.2% retracement of 114.42 (2020 low) to 134.11 at 126.58 holds, up trend from 114.42 is still in favor to continue. Break of 134.11 will target long term resistance at 137.49 (2018 high). However, sustained break of 126.58 will raise the chance of medium term bearish reversal. In this case, deeper decline would be seen to 61.8% retracement at 121.94, and possibly below.
EUR/GBP Daily Outlook
Daily Pivots: (S1) 0.8379; (P) 0.8391; (R1) 0.8401; More...
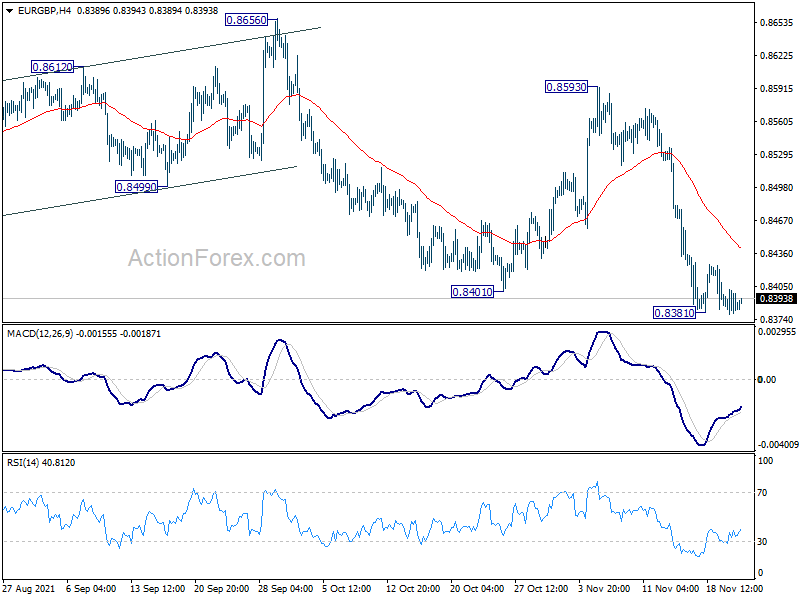
Intraday bias in EUR/GBP stays neutral and consolidation form 0.8381 temporary could extend. In case of another recovery, upside should be limited by 4 hour 55 EMA (now at 0.8440). On the downside, break of 0.8381 will resume larger down trend from 0.9499. Intraday bias will be back to the downside for 0.8276 key long term support.
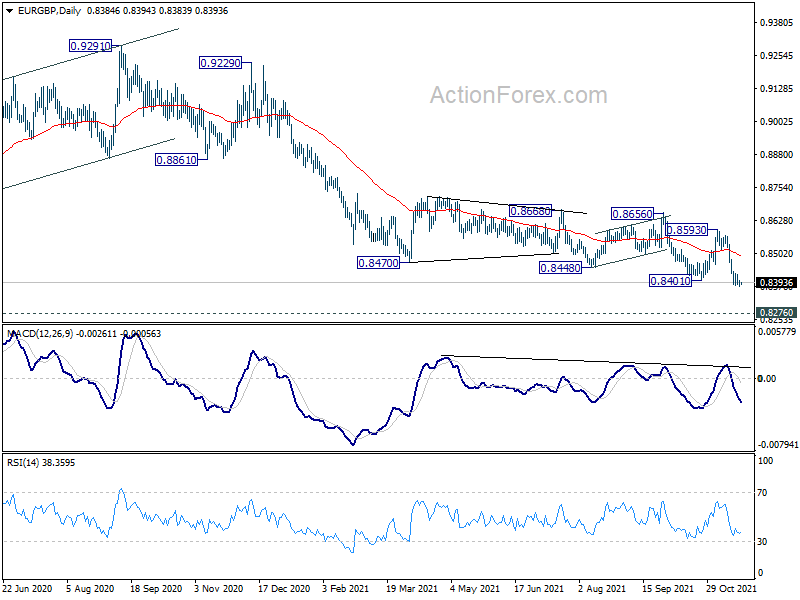
In the bigger picture, price actions from 0.9499 (2020 high) are still seen as developing into a corrective pattern. Deeper fall could be seen as long as 0.8593 resistance holds, towards long term support at 0.8276. We'd look for bottoming signal around there to bring reversal. However, sustained break of 0.8276 will but a sign of long term bearish reversal.
EUR/AUD Daily Outlook
Daily Pivots: (S1) 1.5494; (P) 1.5553; (R1) 1.5614; More...
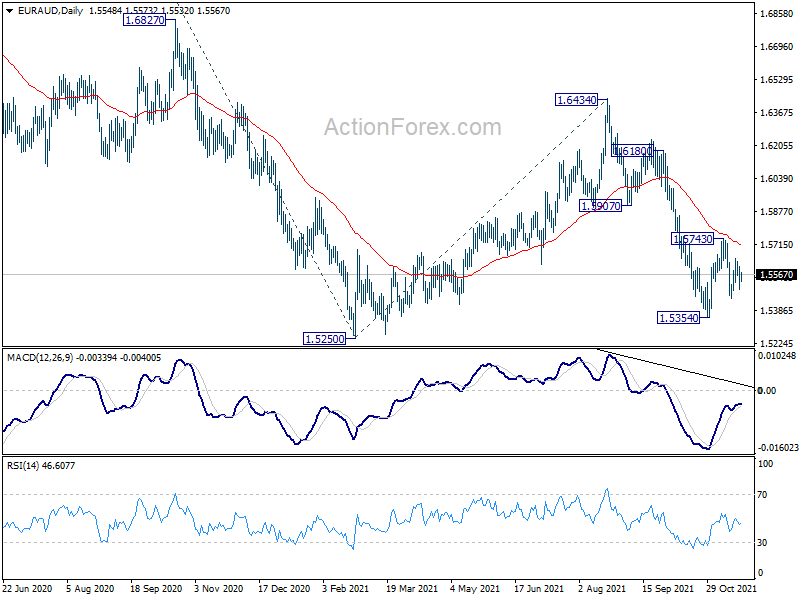
Intraday bias in EUR/AUD remains neutral first. Further fall is expected as long as 1.5743 resistance holds. On the downside, break of 1.5354 will resume whole fall from 1.6434 to retest 1.5250 low. Nevertheless, break of 1.5743 will turn near term outlook bullish for 1.5907 resistance instead.
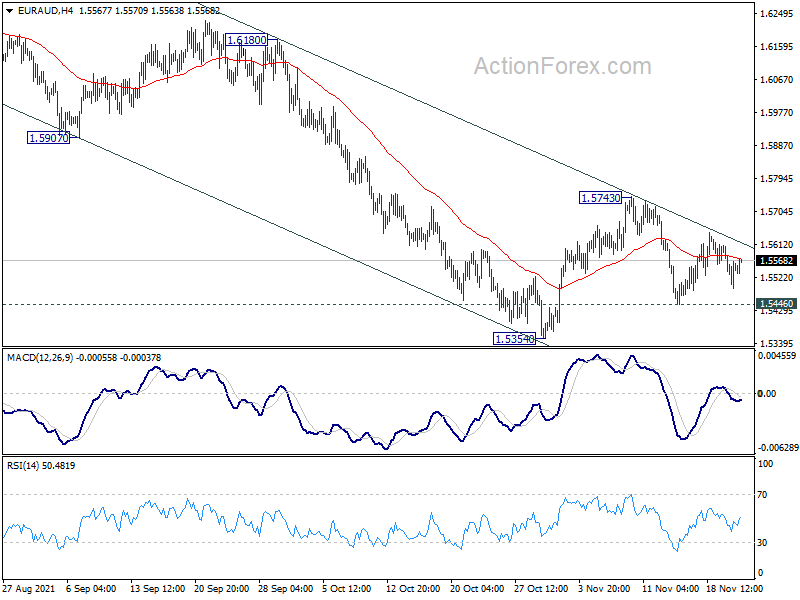
In the bigger picture, the down trend from 1.9799 (2020 high) is in progress. Firm break of 1.5250 low will confirm resumption and target 61.8% retracement of 1.1602 (2012 low) to 1.9799 at 1.4733. Sustained break there could bring more downside acceleration to 61.8% projection of 1.9799 to 1.5250 from 1.6434 at 1.3623. In any case, break of 1.6434 resistance is needed to signal medium term bottoming, or outlook will stay bearish.
EUR/CHF Daily Outlook
Daily Pivots: (S1) 1.0460; (P) 1.0473; (R1) 1.0498; More....
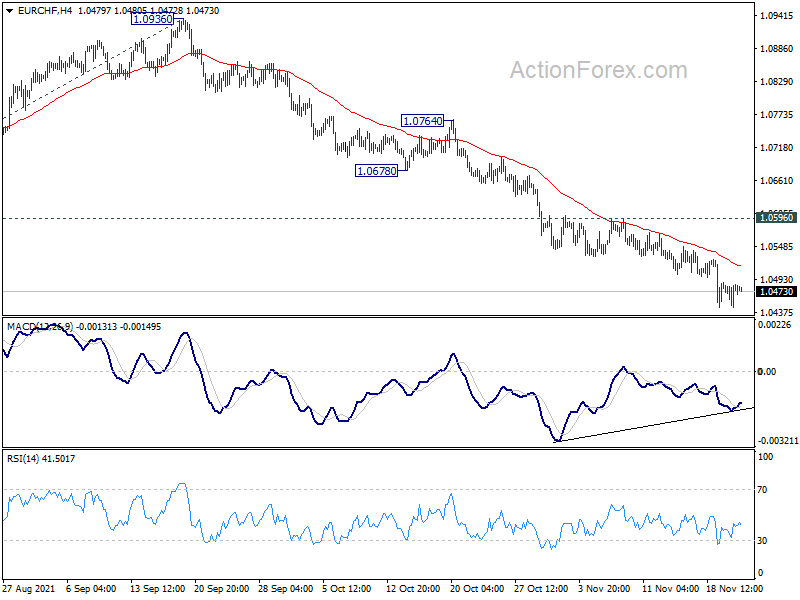
EUR/CHF is losing some downside momentum as seen in 4 hour MACD. But further fall is still expected for now. Current down trend from 1.1149 should now target 161.8% projection of 1.1149 to 1.0694 from 1.0936 at 1.0200 next. On the upside, break of 1.0596 resistance is needed to indicate short term bottoming. Otherwise, outlook will remain bearish in case of recovery.
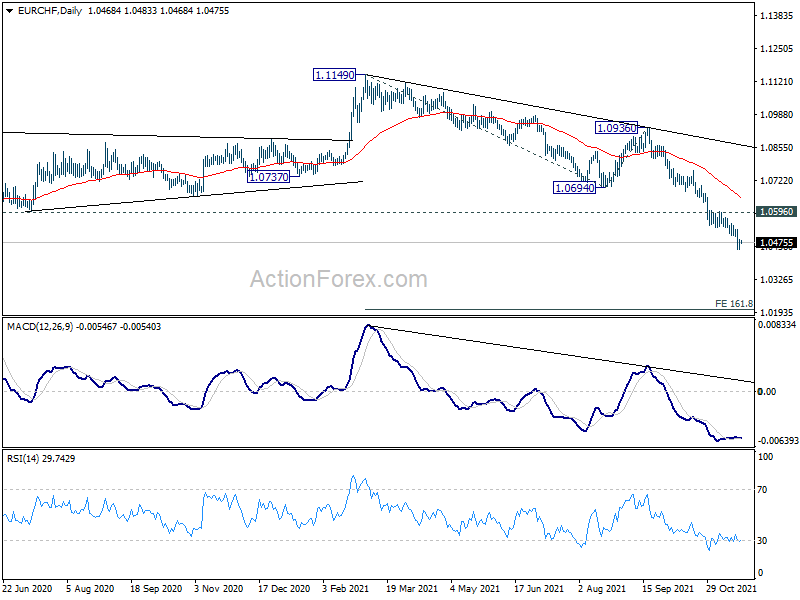
In the bigger picture, down trend from 1.2004 (2018 high) should be resuming with break of 1.0505 (2020 low). Next target is 61.8% projection of 1.2004 to 1.0505 to 1.1149 at 1.0223. On the upside, break of 1.0694 resistance is needed to be the first sign of medium term bottoming. Otherwise, outlook will remain bearish.
AUD/USD Daily Report
Daily Pivots: (S1) 0.7205; (P) 0.7240; (R1) 0.7258; More...
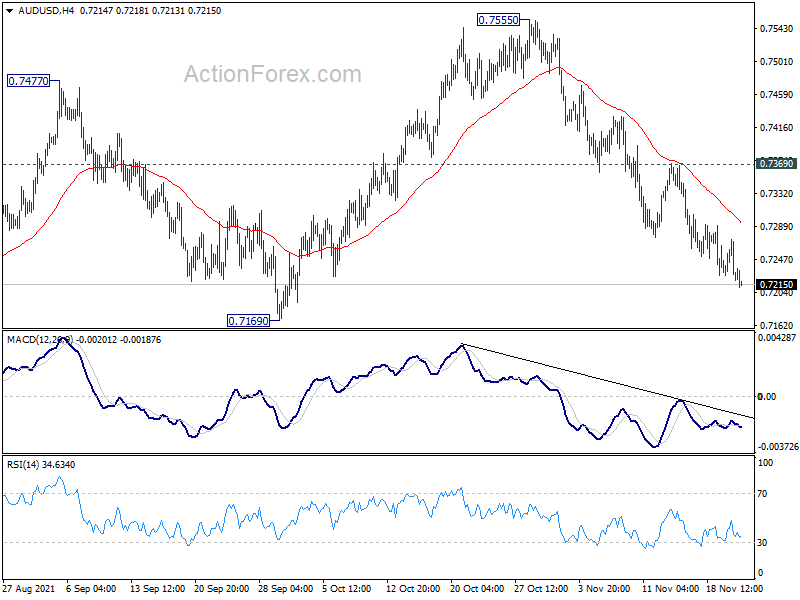
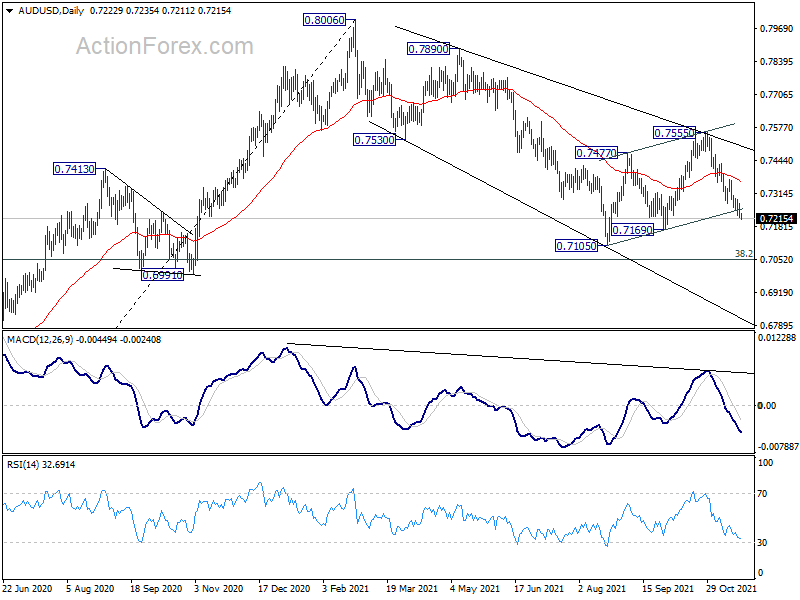
Intraday bias in AUD/USD remains on the downside, as fall from 0.7555 is in progress for 0.7169 support first. Firm break there will affirm the case that larger decline form 0.8006 is resuming. Next target is 0.7105 support for confirmation. On the upside, break of 0.7369 resistance is needed to indicate short term bottoming. Otherwise, outlook will stay mildly bearish in case of recovery.
In the bigger picture, with 0.6991 cluster support (38.2% retracement of 0.5506 to 0.8006 at 0.7051) intact, we're seeing price action from 0.8006 as a correction only. That is, up trend from 0.5506 low would resume after the correction completes. In that case, main focus will be 0.8135 key resistance (2018 high). Sustained break there will carry larger bullish implications. However, sustained break of 0.6991 will argue that the whole medium term trend has indeed reversed.
USD/CAD Daily Outlook
Daily Pivots: (S1) 1.2651; (P) 1.2678; (R1) 1.2729; More...
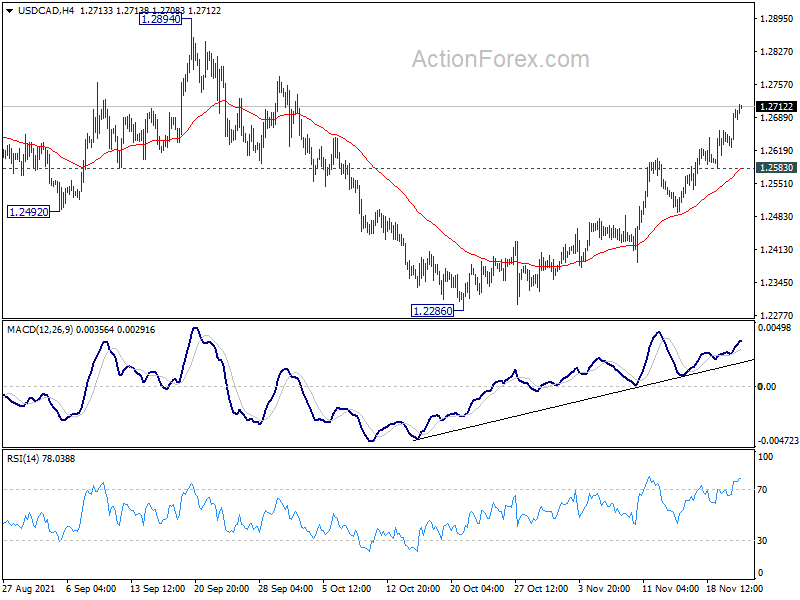
USD/CAD's rise from 1.2286 continues today and hit as high as 1.2715 so far. Intraday bias stays on the upside for 1.2894/2947 resistance zone next. On the downside, break of 1.2583 minor support is needed to be the first sign of short term topping. Otherwise, near term outlook will stay mildly bullish in case of retreat.
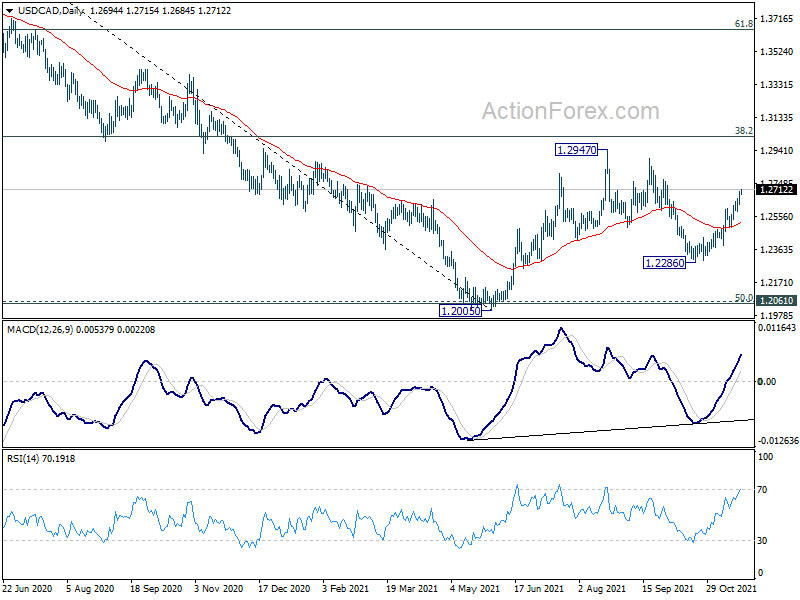
In the bigger picture, medium term outlook is neutral for now. The pair drew support from 1.2061 cluster and rebounded. Yet, upside was limited below 38.2% retracement of 1.4667 to 1.2005 at 1.3022. On the upside, firm break of 1.3022 should affirm the case of medium term bullish reversal. However, break of 1.2286 will turn focus back to 1.2005 low again.
Elliott Wave View: DAX Starting Correction
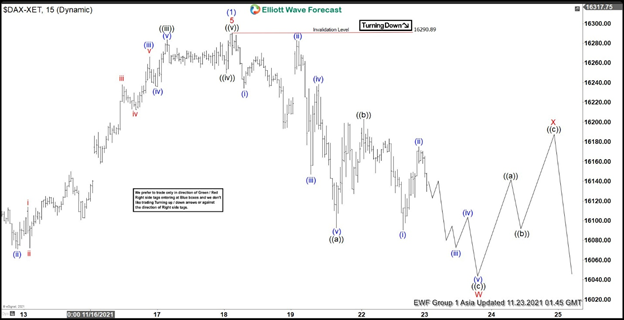
Short-term Elliott wave view in DAX suggests cycle from October 6, 2021 low has ended as an impulse Elliott Wave structure. Up from October 6, wave 1 ended at 15781 and pullback in wave 2 ended at 15495.51. The Index then extends higher in wave 3 towards 16104.13, dips in wave 4 ended at 15985.90, and final leg wave 5 ended at 16290.19. This completed wave (1) in higher degree.
The Index is now correcting cycle from October 6 low in larger degree 7 swing within wave (2). The first 3 swing is in progress as a zigzag from November 18 wave (1) high. Down from there, wave (i) ended at 16234.31 and rally in wave (ii) ended at 16282.87. Index then resumes lower in wave (iii) towards 16146.84, rally in wave (iv) ended at 16238.29, and final leg lower wave (v) of ((a)) ended at 16092.63. Index then corrected in wave ((b)) which ended at 16202.77. Wave ((c)) lower is in progress as another 5 waves. Down from wave ((b)), wave (i) ended at 16090.54 and rally in wave (ii) ended at 16175.05. Expect the Index to continue lower within wave ((c)) as far as rally fails below 16290.89.
DAX 15 minutes Elliott Wave chart
EUR/USD Daily Outlook
Daily Pivots: (S1) 1.1214; (P) 1.1253; (R1) 1.1275; More...
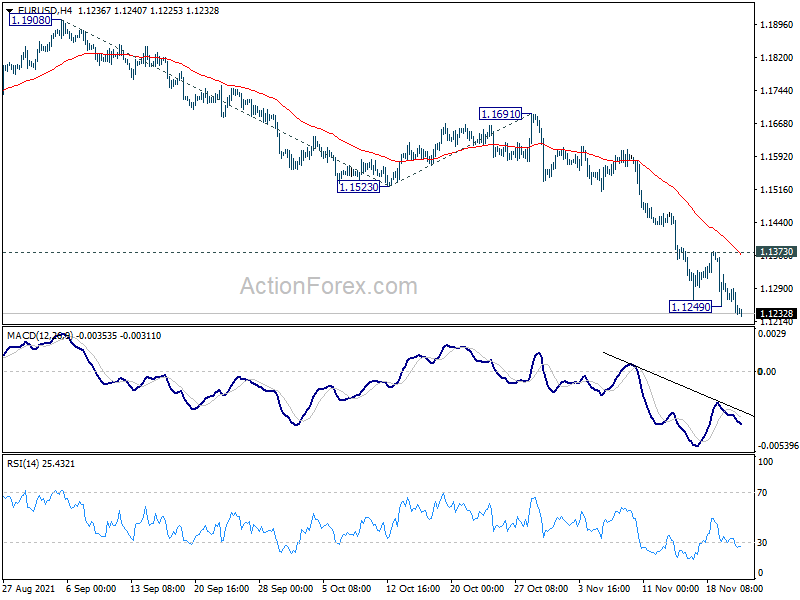
EUR/USD's decline resumes by taking out 1.1249 and intraday bias is back on the downside. Current down trend should target 161.8% projection of 1.1908 to 1.1523 from 1.1691 at 1.1068 next. On the upside, break of 1.1373 resistance is needed to indicate short term bottoming. Otherwise, outlook will stay bearish in case of recovery.
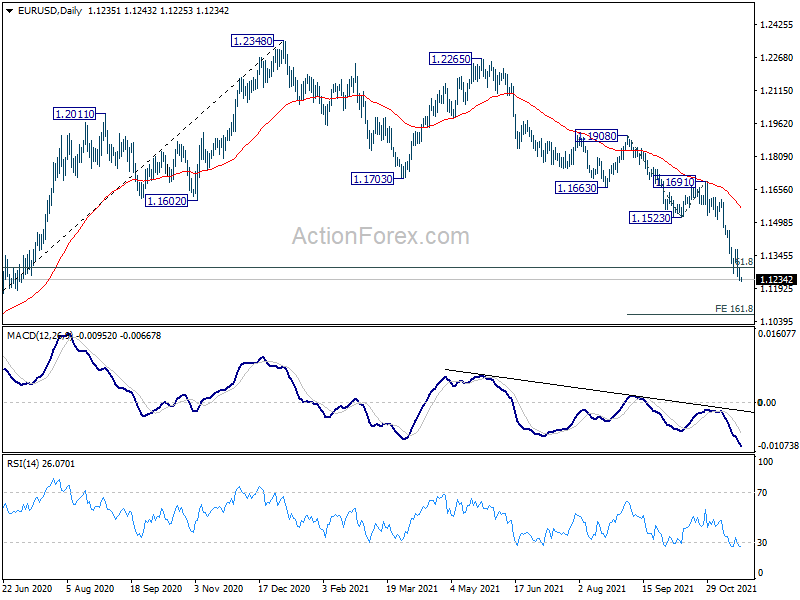
In the bigger picture, there are various ways of interpreting the fall from 1.2348 (2021 high). It could be a correction to rise from 1.0635 (2020 low), the fourth leg of a sideway pattern from 1.0339 (2017 low), or resuming long term down trend. In any case, outlook will now stay bearish as long as 1.1703 support turned resistance holds. Sustained break of 61.8% retracement of 1.0635 to 1.2348 at 1.1289 would pave the way back to 1.0635.
GBP/USD Daily Outlook
Daily Pivots: (S1) 1.3367; (P) 1.3412; (R1) 1.3439; More...
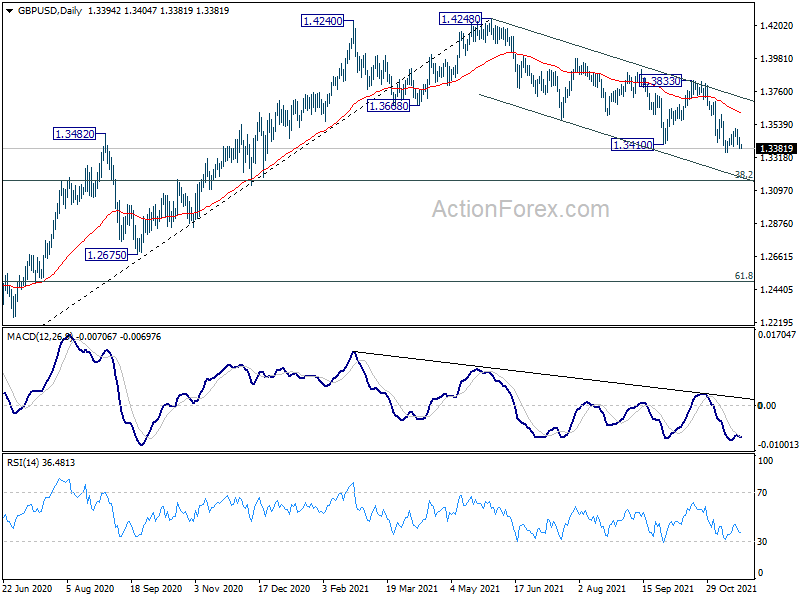
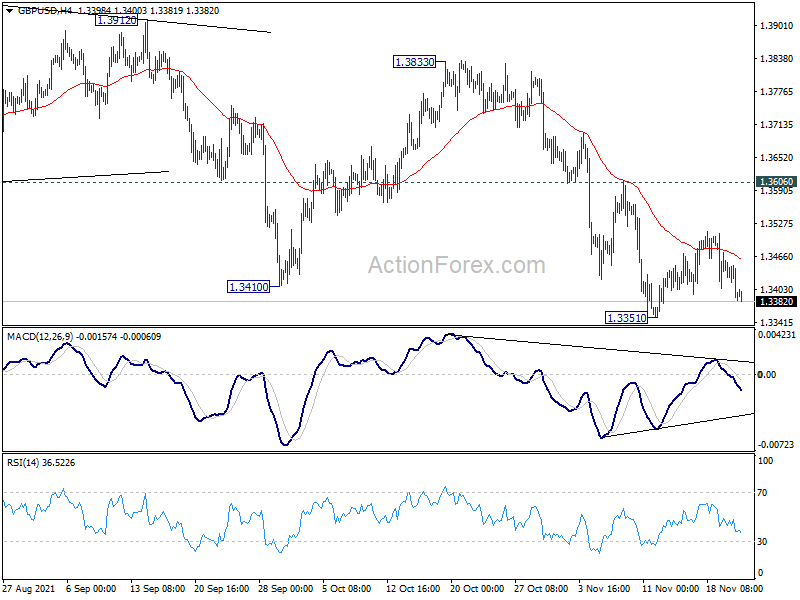
Intraday bias in GBP/USD stays neutral first and consolidation from 1.3351 could extend. In case of another recovery, upside should be limited below 1.3606 resistance. On the downside, break of 1.3351 will extend the decline from 1.4248 to 1.3164 fibonacci level next.
In the bigger picture, the structure of the fall from 1.4248 suggests that it's a correction to the up trend from 1.1409 (2020 low) only. While deeper fall cannot be ruled out yet, downside should be contained by 38.2% retracement of 1.1409 to 1.4248 at 1.3164, at least on first attempt, to bring rebound. On the upside, firm break of 1.4376 key resistance (2018 high) will add to the case of long term bullish reversal. However, sustained trading below 1.3164 will revive some medium term bearishness and target 61.8% retracement at 1.2493.