Sample Category Title
Market Morning Briefing: Aussie Is Stuck Above 0.7450
STOCKS
Important supports are visible below current levels on most indices and while they hold, a rise may be possible in the medium term. Dow and Dax are bullish while above supports at 35500/35000 and 15400 respectively while Nikkei and Shanghai can rise while above 28000 and 3550. Nifty has crucial support at 18000 while Sensex needs to remain above 60000 to head higher. Any break below mentioned supports, if seen would signal bearishness and force us to look for lower targets.
Dow (35677.02, +73.94, +0.21%) has risen and is heading towards the resistance at 36000 which can hold in the initial testing followed by a fall towards 35500-35000. Below 35000, there is another support at 34000. Watch price action near mentioned levels on a fall.
DAX (15542.98, +70.42, +0.46%) has risen today. While above 15400 the view remains bullish to test 15600/800 in the coming sessions. A range of 15800/900-15400 may hold for the near term.
Nikkei (28520.35, -284.50, -0.99%) has fallen. We keep our earlier view intact of a ppossible test of 28000 while below 29500.A range of 28000-29500 is possible before we see a rise above 29500 eventually and a test of 30000/31000 in the longer run.
Shanghai (3594.20, +11.82, +0.33%) has risen slightly since Friday. The view remains bullish while above 3550 to test the level of 3600 and eventually 3700/800.
Nifty (18114.90, -63.20, -0.35%) tested 18314 on Friday, before falling to close at 18114.90.Arange of 18000-18400 can hold for some time before we see a rise towards 18600/800 in the medium term.
Sensex (60821.62, -101.88, -0.17%) has come down sharply after testing the high of 61420.13 last week. The support at 60000 had held well and we can see a bounce towards 61000/62000 in the coming weeks. Failure to hold above 60000, would indicate near term bearishness.
COMMODITIES
Most commodities trade higher except Copper which continues to remain below 4.60 for now. The oil prices are rising due to tight supply in crude while the world is recovering from Pandemic and economies return back to normal slowly. Our view is bullish to see a rise towards 87.36 or even 90 on Brent and 86/87 on WTI for the near term. Gold has risen well and needs to break above 1800 to turn bullish. Silver is headed towards 25-25.50 while Copper can test 4.40/35 while it sustains below 4.55.
Brent (86.30) and WTI (84.65) have both risen sharply. Brent is bullish towards 87.36-90 while above immediate support at 85. WTI on the other hand can test 86/87 on the upside before falling off from there in the near term. Immediate view is bullish.
Gold (1795.90) saw a spike in price to 1815 on Friday which was a surprise as the price remained below 1790 fairly. Our view remains bullish to see a test of 1800/1830 again keeping a near term range of 1750-1830 for the near term.
Silver (24.45) can rise to 25-25.50 before coming off from there.
Copper (4.5475) has come down further today. The price has broken below 4.55 mentioned last week. A break below 4.55 will take it lower to 4.40/35 which would be a support zone below current levels.
FOREX
Dollar Index may fall to 93 taking Euro towards 1.1700/10 in the near term. If Dollar weakens, Aussie and Pound can rise to 0.75 and 1.3850 respectively. EURJPY has scope to fall towards 131.50 while below 133. USDJPY has support near 113.30/15 and while that holds, a rise to 114 is possible. Range of 114-113 may hold for now. USDCNY is ranged within 1.38-1.41. USDINR can be ranged within the narrow 74.70-75 and broad 74.60/50-75.25 for the near term.
Dollar Index (93.627) has not been able to fall below 93.50 over the past few sessions but looks likely to test 93 soon as overall near term trend looks bearish. Anny break above 94 would be contrary to our expectation and less likely.
Euro (1.1644) has not been able to rise past 1.1670 over the past 4-5 sessions and at the same time has not been pushed below 1.1615 on the downside. While above 1.1600-1.1625, we would still look for a slow rise towards 1.17-1.1710 in the near term.
EURJPY (132.41) is holding above 131.9 and a sustained bounce can take the cross pair higher towards 133 again in the near term. But overall unless the cross breaks above 133.50, we may look for a fall towards 131.50-131 slowly.
Aussie (0.7470) is stuck above 0.7450 and needs to fall below 0.7450 to head towards 0.74 on the downside. Else a sharp rise above current levels is needed for Aussie to rise to 0.75 or higher to negate any bearishness from current levels. We would wait for price action from here.
Pound (1.3769) has trend support near 1.3735/30 and if that holds, a bounce back to 1.3850 cannot be negated on the upside. Watch price action near mentioned support.
Dollar-Yen (113.75) has support near 113.30/113.15 and while the pair trades above the mentioned levels, it can rise to 114-114.50 soon. Failure to break above 114 would keep a range of 113-114 for a few sessions.
USDCNY (6.3888) seems to be consolidating within 1.38-1.41 region and while below 6.44, overall view is bearish.
USDINR (74.8950) is likely to consolidate within narrow range of 74.70-75.00 and broad range of 74.60/50-75.25 before any clarity is seen for further direction.
INTEREST RATES
The US Treasury Yields have come-off well at the far-end (10Yr and 30Yr). It will have to be seen if the fall can extend in the coming days and reduce the chances of rising past 1.75% (10Yr) and 2.2% (30Yr). On the German Yields, the 10Yr is at the crucial resistance zone from where we expect a reversal while the 30Yr already turned down from the resistance as expected. We expect a fresh fall in the yields in the coming weeks. The 10Yr GoI has risen back on Friday but needs to be seen if it can sustain. The broader bias is still bearish to see a fall in the coming days. The 5Yr on the other hand looks mixed within its broad 5.66%-5.76% range.
The US 2Yr (0.46%), 5Yr (1.20%), 10Yr (1.65%) and the 30Yr (2.07%) have come-off well at the far-end. But still the 10Yr can test 1.75% while above 1.6% and the 30Yr can rise to 2.2% while above 2%. The 10Yr will have to fall below 1.6% first and then see a decisive break below 1.5% to negate the chances of rising past 1.75% to test 2% and higher levels on the upside over the medium-term.
The German 2Yr (-0.65), 5Yr (-0.43%) and the 10Yr (-0.11%) yields remained stable while the 30Yr (0.23%) had dipped well on Friday. The 10Yr is just below its -0.1%/-0.05% resistance zone which we expect to hold and trigger a reversal to -0.2% and lower in the coming weeks. The 30Yr has already turned down well from its 0.35%-0.45% resistance zone and can see a deeper fall to 0.1%-0% in the coming weeks on a break below 0.2%.
The Indian 10Yr GoI (6.3640%) has risen back above 6.35% but need to be seen if it can sustain the bounce and rise past 6.4% to see a test of 6.45%-6.5%. While below 6.4%, the bias is bearish to see a fall to 6.2% and lower levels. A break below 6.3% can trigger this fall.
The 5Yr GoI (5.7334%) looks mixed and has equal chances of either moving up towards 5.76% or dip to test 5.70% on the downside from current levels. We will have to wait and watch for a few sessions to get a clear idea on the direction of move. For now, the 5.66%-5.76% range remains intact.
EUR/USD Eyes Key Upside Break Above 1.1650
Key Highlights
- EUR/USD is attempting a steady recovery wave above 1.1620.
- A key bullish trend line is forming with support near 1.1640 on the 4-hours chart.
- GBP/USD is struggling to gain momentum above 1.3800.
- The German IFO Business Climate Index could decline from 98.8 to 97.8 in Oct 2021.
EUR/USD Technical Analysis
The Euro started a recovery wave from the 1.1524 low against the US Dollar. EUR/USD cleared the 1.1600 resistance zone to move into a short-term positive zone.
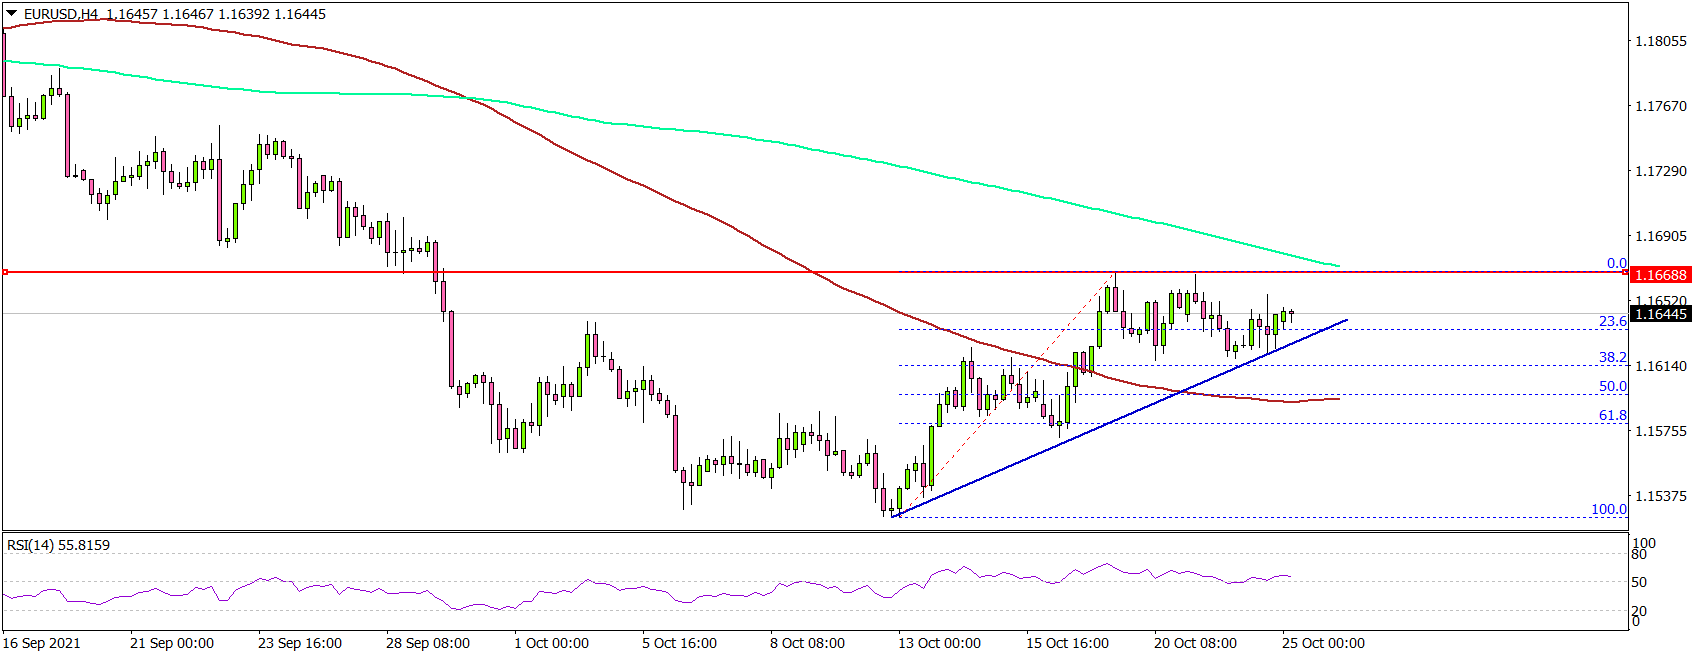
Looking at the 4-hours chart, the pair even traded above the 1.1620 level and the 100 simple moving average (red, 4-hours). However, it seems to be facing resistance near the 1.1650 level.
The 200 simple moving average (green, 4-hours) is also near the 1.1665 level. A clear break above the 1.1665 level could open the doors for more gains. The next major resistance on the upside is near the 1.1720 level.
The next key resistance is near the 1.1750 level, above which the pair could rise towards 1.1800. An immediate support on the downside is near the 1.1640 level.
There is also a key bullish trend line forming with support near 1.1640 on the same chart. The next major support is near 1.1620, below which there is a risk of a larger decline. In the stated case, the pair could decline towards the 1.1550 level.
Looking at GBP/USD, the pair is trading in a positive zone, but it is facing a strong selling interest near the 1.3800 level. Besides, USD/JPY is still trading well above the 113.00 level.
Economic Releases
- German IFO Business Climate Index for Oct 2021 – Forecast 97.8, versus 98.8 previous.
- German IFO Current Assessment Index for Oct 2021 - Forecast 99.3, versus 100.4 previous.
- German IFO Expectations Index for Oct 2021 – Forecast 96.1, versus 97.3 previous.
WTI continues up trend, but overbought condition might limit upside at 88
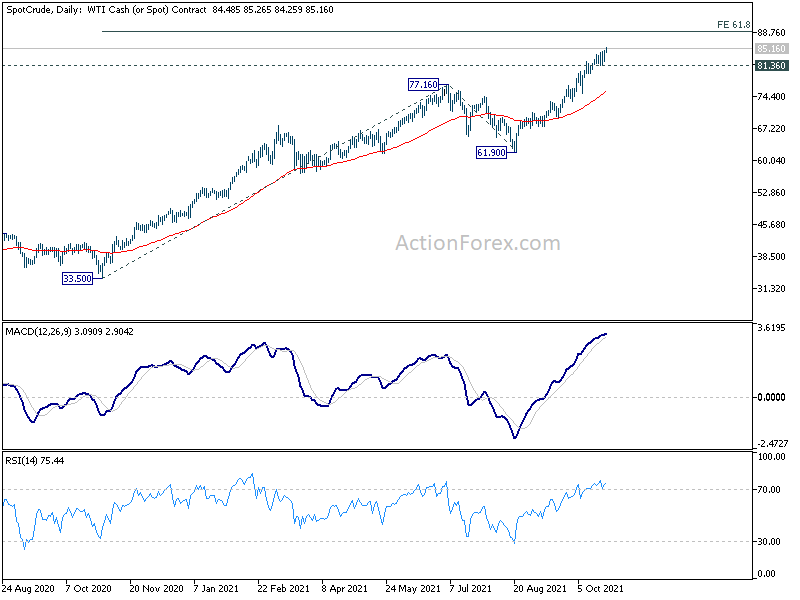
Rally in WTI crude oil continues today and hit another 7-year high at 85.26. Upside momentum remains strong as seen in daily MACD. Further rally is expected to 61.8% projection of 33.50 to 77.16 from 61.90 at 88.88. Nevertheless, considering overbought condition in daily RSI, we'd look for topping signal around there to bring pull back. Meanwhile, break of 8.36 support will argue that a short term top is formed and turn WTI into correction first.
Silver pressing 24.86 resistance, Gold still trying 1800
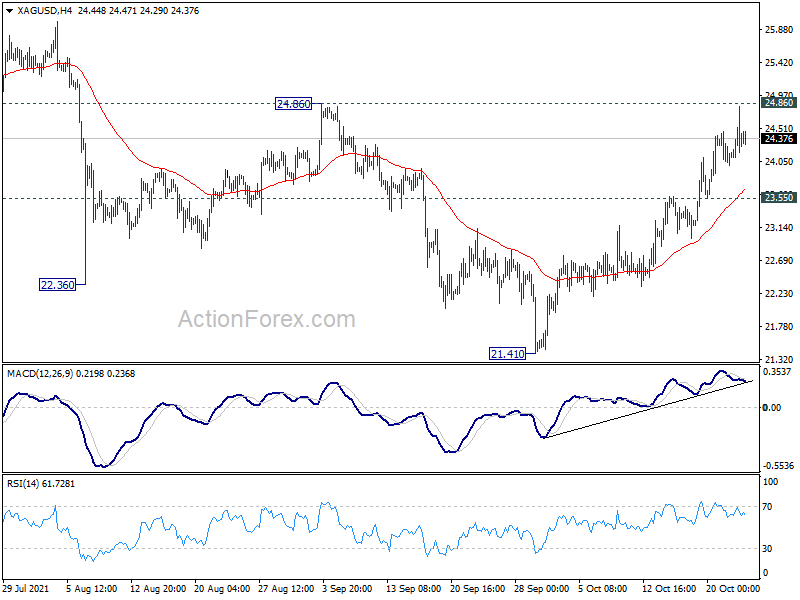
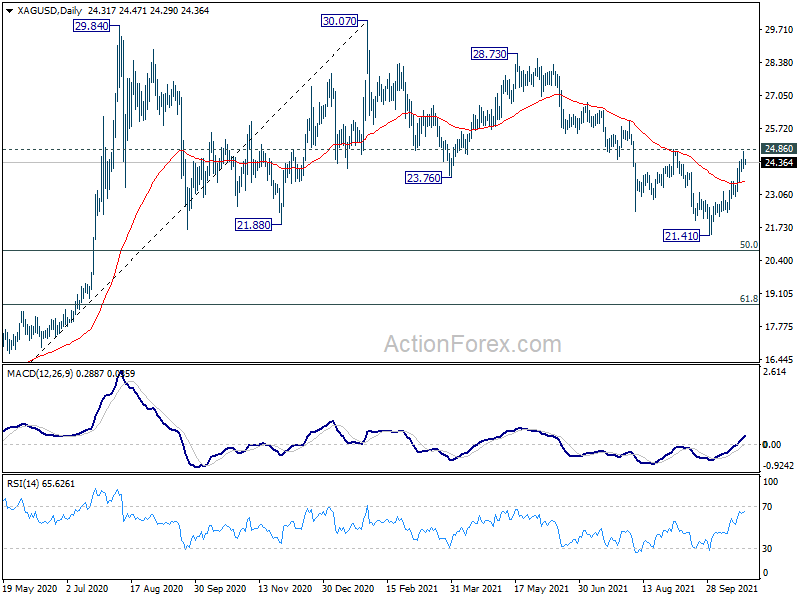
Silver hit as high as 24.81 last week but lost momentum ahead of 24.86 near term resistance. For now, further rise will remain mildly in favor as long as 23.55 minor support intact. Sustained break of 24.86 will argue that whole corrective pattern from 30.07 has completed with three waves down to 21.41. In such case, near term outlook will be turned bullish for 28.73/30.07 resistance zone. However, rejection by 24.86 will retain near term bearishness. Break of 23.55 will bring retest of 21.41 low instead.
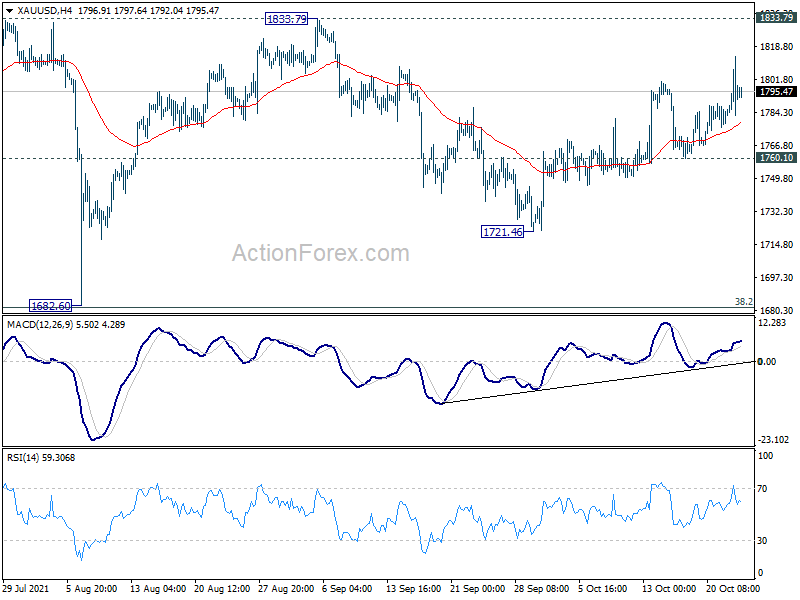
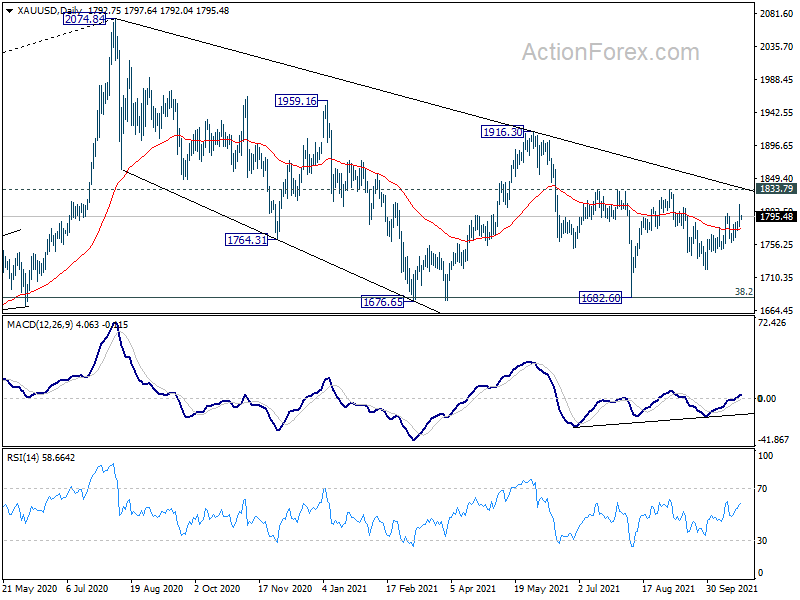
Gold breached 1800 handle last week as the rebound from 1721.46 but quickly lost momentum again. Still, further rise is in favor as long as 1760.01 supports holds, to 1833.79 resistance. Firm break there will resume the rally from 1682.60 to 1916.30 key structural resistance next. however, break of 1760.01 will retain near term bearishness and target 1721.46 support instead.
Eco Data 10/25/21
[php_everywhere instance="1"]
BoC Preview – Further QE Tapering
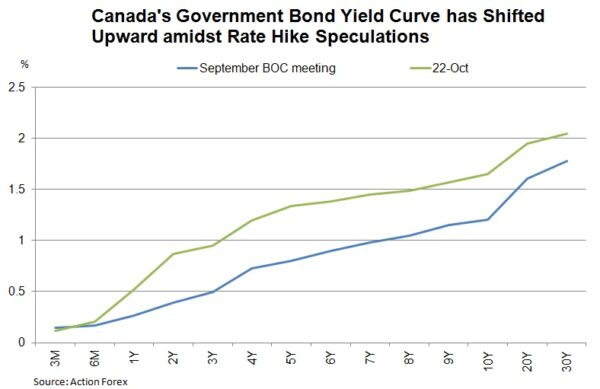
As further QE tapering to CAD 1B/week has been fully priced in, the focus of this week’s BOC meeting is the forward guidance on rate hike. The market has priced in 3 rate hikes in 2022. We expect the central bank to maintain the guidance that a rate hike would come when “economic slack is absorbed so that the 2% inflation target is sustainably achieved”. On economic developments, policymakers should likely acknowledge the persistently strong inflation. They should, however, maintain the stance that the phenomenon had been driven by temporary factors.
Economic Developments
While Canada’s economy stays below the pre-pandemic level, the gap is narrowing. The flash estimate for GDP growth expanded +0.7% m/m in August, following a -0.1% decline a month ago. Economic activity was projected to be -1 ppt below pre-pandemic level in February 2020. In July, the gap was about -2 ppt.
Inflation continued its restive rally. Headline CPI accelerated to a 18-month high of +4.4% y/y in September, from +4.1% a month ago. Core inflation also accelerated to +3.7%, from August’s +3.5%. BOC’s preferred core inflation gauges averaged at +4% in September, up from +3.9% a month ago. Elevated price levels have proved more persistent than previously anticipated.
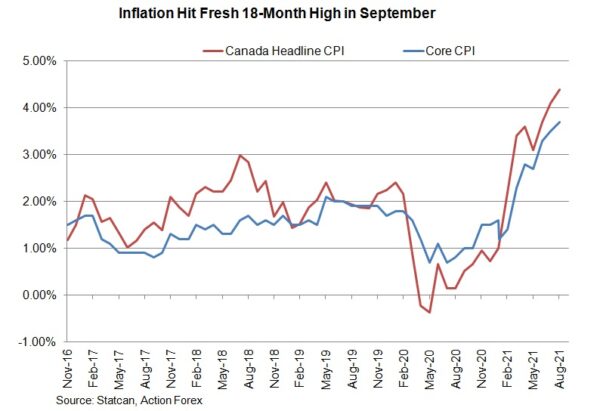
Inflation expectations remain firm. As suggested in the latest quarterly business outlook survey (BOS), 45% of businesses forecasts CPI to average above +3% in 2 years’ time, compared with BOC’s +2% midpoint target. Household expectations are at +3% during the period.
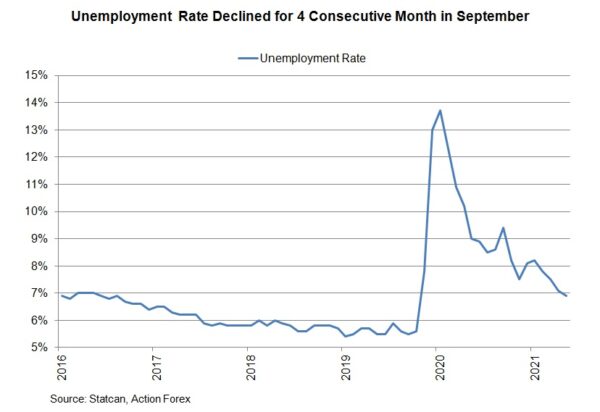
The job market is resilient with the number of payrolls up +157.1K in September, following a +90.2K addition a month ago. This beat consensus of an increase of +65K. The unemployment rate slipped -0.2 ppt to +6.9% during the month. The BOS indicated that “most firms see labour markets as tighter than last year” and “labour shortages are preventing more firms from meeting growing demand”.
Monetary Policy
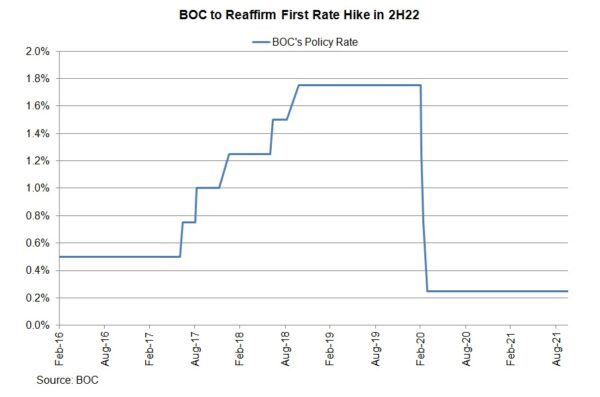
Against this backdrop, the BOC is in progress to further trim its asset purchases to CAD1B/week in October. The overnight rate will stay unchanged at 0.25%. Concerning the outlook to rate hike, we expect the central bank to reiterate that the policy rate would stay at "the effective lower bound until economic slack is absorbed so that the 2 percent inflation target is sustainably achieved". A more hawkish guidance could come in December, should the economy continues to improve as more pandemic-related restrictions are lifted.
Forex and Cryptocurrencies Forecast
EUR/USD: In a State of Uncertainty
When giving their forecast a week ago, 20% of analysts were in favour of a decline in EUR/USD, 50% voted for it to rise, and 30% were neutral. As a result, 80% of those who pointed north and east were right. After starting at 1.1600, the pair first rose to 1.1668, then fell to 1.1616, and then moved sideways in this channel. After Friday's speech by the Fed Governor, the pair dropped to the bottom of this trading range but finished almost in its middle at 1.1643.
According to Reuters, Jerome Powell said it was time to start reducing asset purchases but added that it was not yet time to raise rates. In his view, high inflation is likely to continue into next year, but the central bank expects it to return to the 2% target.
The figures coming in the week from the US labour market could be considered positive. This was due to a larger revision of the previous data on repeated claims for unemployment benefits, from 2.593K to 2.603K. Thus, the current number of 2.481K showed a decrease of 122K instead of the forecast 118K.
Such "tricky" mathematics improved data on primary benefit claims as well. As a result of revising previous results, they decreased by 6K instead of increasing by 2K.
However, all this positive has not helped the dollar much, as US Treasury yields remain around 2.15%, while the probability of its growth towards 3.0% remains.
Weaker Markit PMI in German and Eurozone manufacturing sectors could push the EUR/USD pair down on Friday 22 October. But they turned out to be multi-colored. The European index turned into the red, dropping from 56.2 to 54.3 against a forecast of 55.2. But the index of the main locomotive of the European housekeeper, Germany, on the contrary, is green at 58.2 against the forecast 56.5.
The fact that the US labour market continues to improve should, in the end, provide more support to the dollar. Fed Governor Jerome Powell has repeatedly stressed that the monetary stimulus (QE) program is aimed at stabilizing the labor market, among other things. This task, although not fully accomplished, is very close to the goal. Consequently, there is nothing preventing the Fed from starting to reduce monetary stimulus in the near future.
So, what to expect from EUR/USD in the near future? Whereas 55% of the oscillators on D1 were painted red, 15% green and 30% neutral grey a week ago, the picture has changed now. 50% of the indicators are pointing up, 20% have taken a neutral position, 15% are looking down, and the remaining 15% are signaling that the pair is overbought. As for trend indicators, their readings have also been affected by the sideways movement of recent days, resulting in a draw of 50% by 50%.
The overwhelming majority of analysts expect the dollar to strengthen by the end of the year. But their opinions are almost equally divided about the forecast for the coming week. 45% of experts vote for the bullish scenario, as much as bearish, and 10% have taken a neutral stance.
Support levels are 1.1615, 1.1585, 1.1560, 1.1520, 1.1485 and 1.1450. Resistance levels are 1.1670 1.1715, 1.1800, 1.1910.
As for next week's events, the Eurozone Bank Lending Report which will be published on Tuesday 26 October should be noted. Capital and durable goods orders are due from the US on Wednesday October 27. We are expecting quite a lot of macro statistics on Thursday and Friday, including consumer markets and GDP data from the Eurozone, Germany and the United States. In addition, the European Central Bank will meet on October 28. The interest rate is likely to remain unchanged at 0%. Therefore, the subsequent press conference and commentary by the ECB management on monetary policy is of much greater interest.
GBP/USD: Wherever the Euro Goes, the Pound Goes
Last week's GBP/USD chart is very similar to the EUR/USD chart: sideways movement with some advantage to bulls and finish just above the start level, at 1.3758. This stems from the absence of many serious drivers from the other side of the Atlantic, as well as from the statistics from the UK itself.
UK consumer price growth slowed from 3.2 per cent to 3.1 per cent, which is a good signal for investors fearing global inflation. However, the market has hardly reacted to these figures, keeping a close eye on gas prices, as the energy crisis is now a major threat not only for the United Europe but also for the UK that separated from it. Inflation is certainly very important, but the country is repeating the path already taken by the Eurozone and the United States, where it was followed by strong growth following a slight decline.
The Markit Business Activity Index (PMI) in the British services sector published on Friday, October 22, rose from 55.4 to 58.0 instead of the expected decline. This didn't help the pound. The dollar, with the help of Jerome Powell, who made a speech shortly before the markets closed, strengthened not only against the euro, but also against the British currency.
Unlike its European counterpart, the pound had been growing since September 29. And this could not but affect the readings of the indicators on D1, among which the advantage is still on the side of the green. Among the oscillators, these are 55%, 25% are grey and 20% signal that the pair is overbought. Among the trend indicators, 60% are looking north, 40% have already turned south.
As far as experts are concerned, there is no discernible advantage: 35% vote for the pair's growth, 25% for its decline, and 40% for movement in the side channel.
The supports are located at levels 1.3740, 1.3675, 1.3600, 1.3575, 1.3525 and 1.3400. The resistance levels and bull targets are 1.3770, 1.3810, 1.3835, 1.3900 and 1.4000.
USD/JPY: Return to 2017
USD/JPY upgraded its four-year high on October 20 to reach 114.70 high, the very point where it was in November 2017. After that, the enthusiasm of the bulls subsided, and the pair returned to the values of a week ago.
While the dollar has strengthened against the euro and the British pound since Fed Governor Jerome Powell's speech on October 22, it has weakened a bit against the yen as a safe haven currency. As a result, the final chord sounded at around 113.42.
As we know, the pair's performance is strongly influenced by the yield of US government bonds, which hovers around 2.15% so far. However, if it rises, USD/JPY will see a new rise in volatility.
At this stage, 65% of analysts expect the pair to first return to the 113.00 horizon, and then drop to the 111.00-112.00 zone by the end of November. The remaining 35% of experts adhere to the opposite point of view, expecting the next update of multi-year highs and the rise of the pair to the range 115.00-116.00.
The resistance levels are 114.45, 114.70 and 115.50, the long-term target of the bulls is the December 2016 high of 118.65. Support levels are 113.25, 112.00 and 111.65.
As for the events of the coming week, one could note the meeting of the Bank of Japan, which will be held on the same day as the meeting of the ECB, on Thursday October 28. However, it is highly likely to bring no surprises, and the interest rate will remain negative at minus 0.1% as before.
CRYPTOCURRENCIES: $66,925: Bitcoin's New High
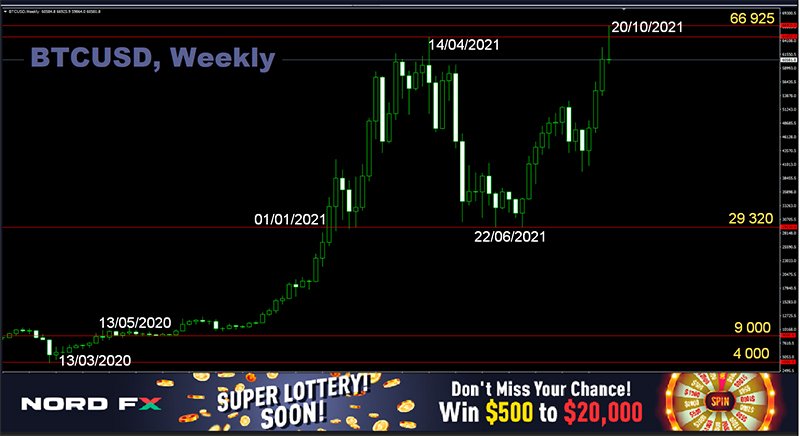
Bitcoin hit $64,850 on April 14, followed by a 55% pullback to $29,230. And now what crypto investors have been waiting for has finally happened. After months of anxiety and anticipation, the BTC/USD pair not only regained what it had lost, but also upgraded its historic high, peaking at $66,925 on October 20. Ethereum also reached its all-time high: the ETH/USD pair was noted at a height of $4,363.
Analysts say the reasons for the current rise are two. The first is the launch of Bitcoin ETFs (exchange-traded investment funds). First, the US Securities and Exchange Commission (SEC) approved a Bitcoin futures ETF from ProShares, followed by approval of VanEck's application to launch a similar ETF.
The second and main reason for the bullish trend was investors' concerns about inflation. Experts at JPMorgan Chase, the largest banking conglomerate, pointed out that real gold, unlike digital gold, has hardly responded to inflationary concerns. This suggests bitcoin's renewed role as the best capital protection tool for investors and supports the bullish outlook for BTC until the end of the year.
Many other analysts agree with JPMorgan Chase, who are optimistic about the performance of the main cryptocurrency until the end of December. But at the same time, they urge investors to be extremely cautious in early 2020 as the big four-year BTC cycle is about to end. So Scion Capital hedge fund founder Michael Burry, who predicted the 2007 mortgage crisis, has already thought about opening a short bitcoin position.
Finder conducted a survey of 50 fintech industry experts with representatives from Cypherpunk Holdings, Bitcoin Reserve, Kraken, Arcane and CryptoQuant, as well as 7 professors, representing universities in Asia, Europe and Australia. In their opinion, the BTC rate will peak at a level slightly above $80,000 within the next two months, and the flagship cryptocurrency will end the year around $71,400.
The levels indicated by these experts turned out to be significantly lower than the forecasts of analysts of Standard Chartered and Bloomberg, who believe bitcoin could exceed $100,000 this year.
Popular crypto analyst Willy Woo believes that the next phase of the bitcoin market will be more volatile than previous bullish periods, implying a longer time frame for the current cycle. recall that this analyst wrote in a series of Twitter posts a year ago that, according to his model, $200,000 per bitcoin by the end of 2021 is a conservative forecast. However, he did not exclude the likelihood that BTC will soar up to $300,000.
Morgan Creek Capital Management CEO Mark Jusko calls the numbers similar to Willie Woo's predictions. He suggests that the price of the oldest cryptocurrency could soar to the level of $250,000, only to happen not in 2021, but in the next 5 years. In doing so, he acknowledged that the path to such a peak may not be easy.
In the meantime, there is a rollback in the crypto market. The most cautious investors close long positions. Bitcoins are also sold by those who bought them at the spring highs. They have earned a little and do not want to risk again. A glitch in the algorithm on the Binance.US exchange added fears as well, when the price immediately collapsed by 87%. However, the performance of other exchanges and brokers was not affected by this, and the BTC/USD pair was trading at $61,000 at the time of writing. The total crypto market capitalization is $2.6 trillion, and the Bitcoin Dominance Index is 45.94%. The Crypto Fear & Greed Index is in the Greed zone at 75 points. However, this does not mean that the market is strongly overbought, and, in the opinion of the index developers, it can still be dangerous to open short positions in this situation.
EUR/USD Weekly Outlook
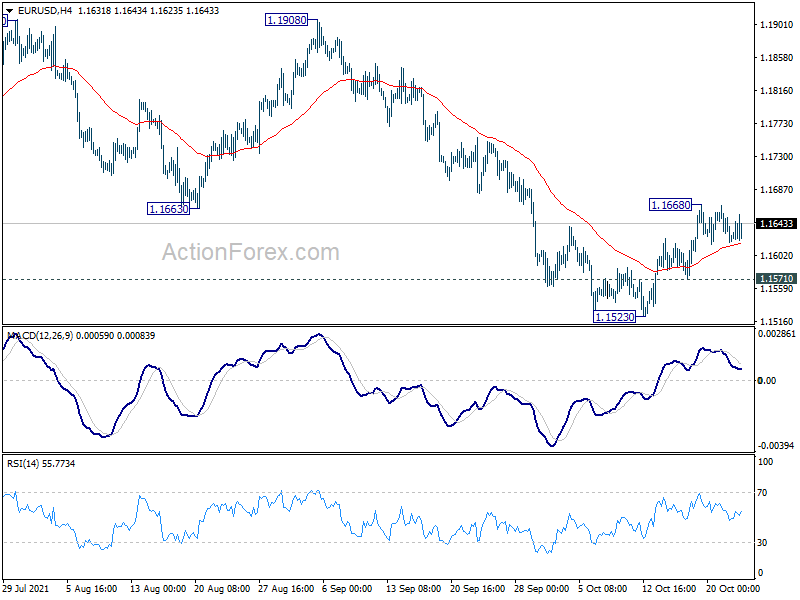
EUR/USD rebounded further to 1.1668 last week and turned sideway since then. As a temporary top was formed, initial bias remains neutral this week first. Further rally is expected as long as 1.1571 support holds. Break of 1.1668 will target 55 day EMA (now at 1.1702). Sustained break there will be a sign that larger correction from 1.2348 has completed. Stronger rally would be seen to 1.1908 resistance for confirmation. On the downside, though, break of 1.1571 minor support will turn bias back to the downside for 1.1523 support instead.
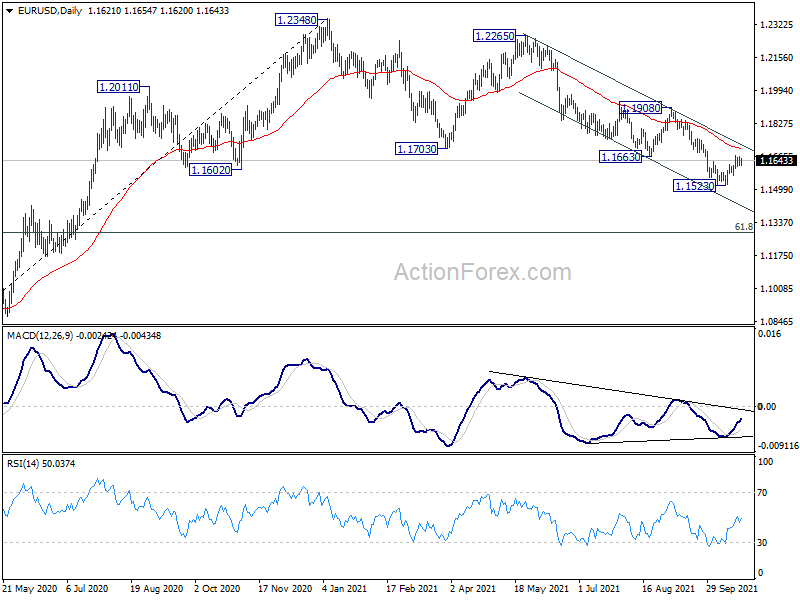
In the bigger picture, price actions from 1.2348 should at least be a correction to rise from 1.0635 (2020 low). As long as 1.1908 resistance holds, deeper fall would be seen to 61.8% retracement of 1.0635 to 1.2348 at 1.1289. Nevertheless break of 1.1908 resistance will revive medium term bullishness and turn focus back to 1.2348 high.
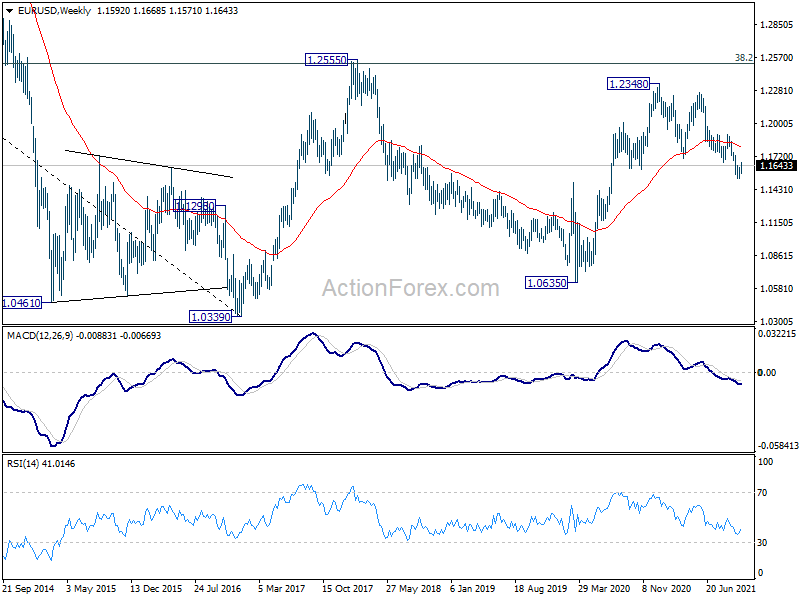
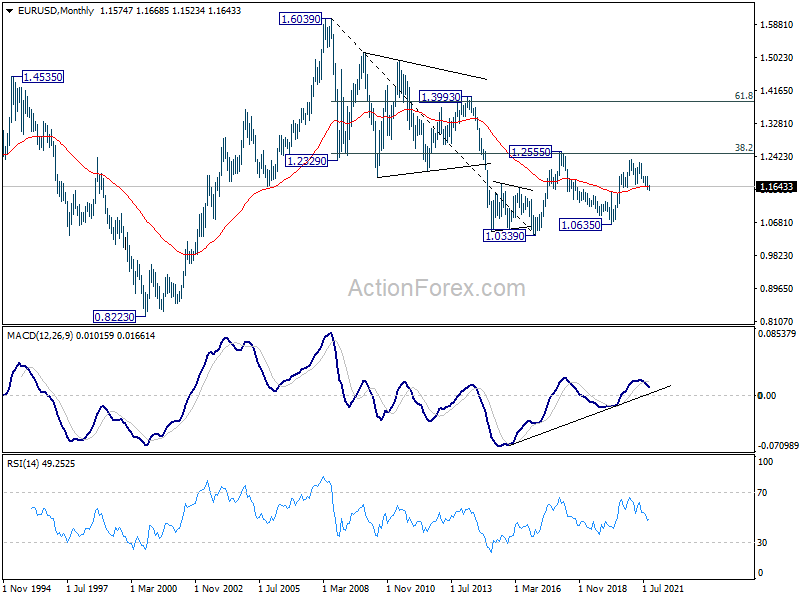
In the long term picture, EUR/USD has possibly failed 1.2555 cluster resistance (38.2% retracement of 1.6039 to 1.0339 at 1.2516) already. Long term outlook will remain neutral as sideway pattern from 1.0339 (2017 low) is extending with another medium term fall. For now, we'd hold back from assessing the chance of downside breakout, and monitor the momentum of the decline from 1.2348 first.
USD/JPY Weekly Outlook
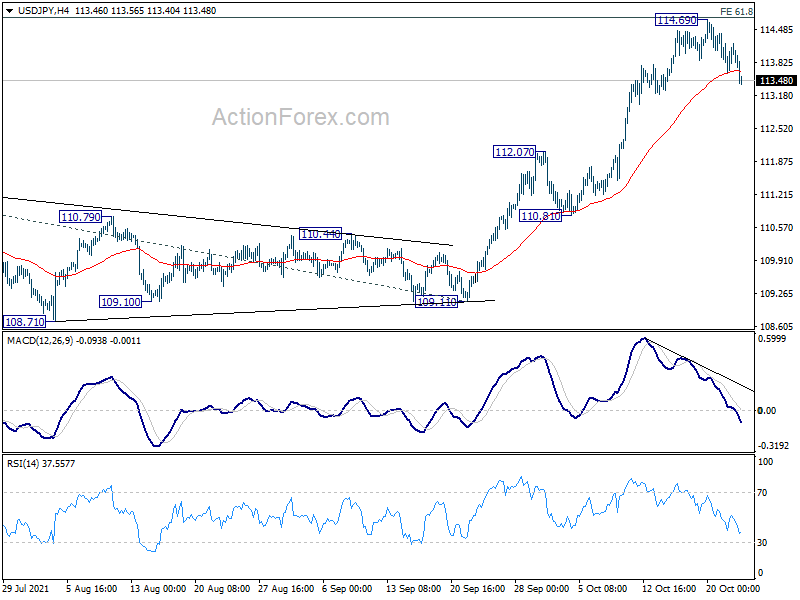
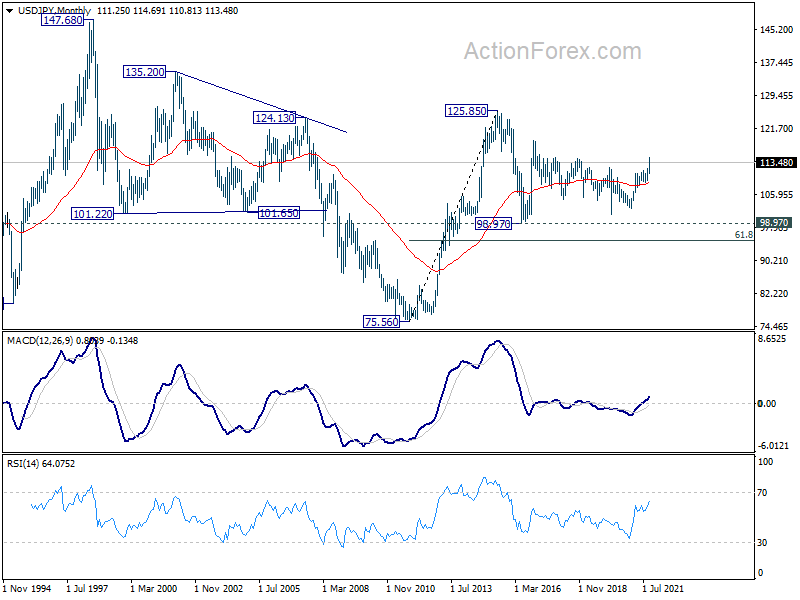
USD/JPY edged higher to 114.69 but retreated just ahead of 61.8% projection of 102.58 to 111.65 from 109.11 at 114.71. Initial bias is mildly on the downside this week for pull back. But downside should be contained above 112.07 resistance turned support to bring rise resumption. On the upside, firm break of 114.71 will pave the way to 100% projection at 118.18 next.
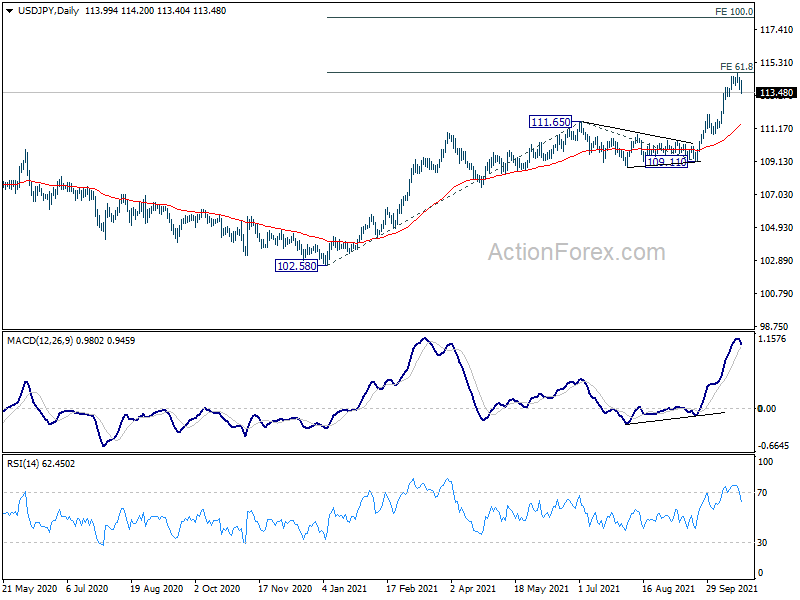
In the bigger picture, corrective decline from 118.65 (2016 high) should have completed at 101.18 already. Rise from the 102.58 is seen as the third leg of the up trend from 101.18. Next target is 114.54 resistance and then 118.65 high. This will now be the preferred case as long as 109.11 support hold, even in case of deep pull back.
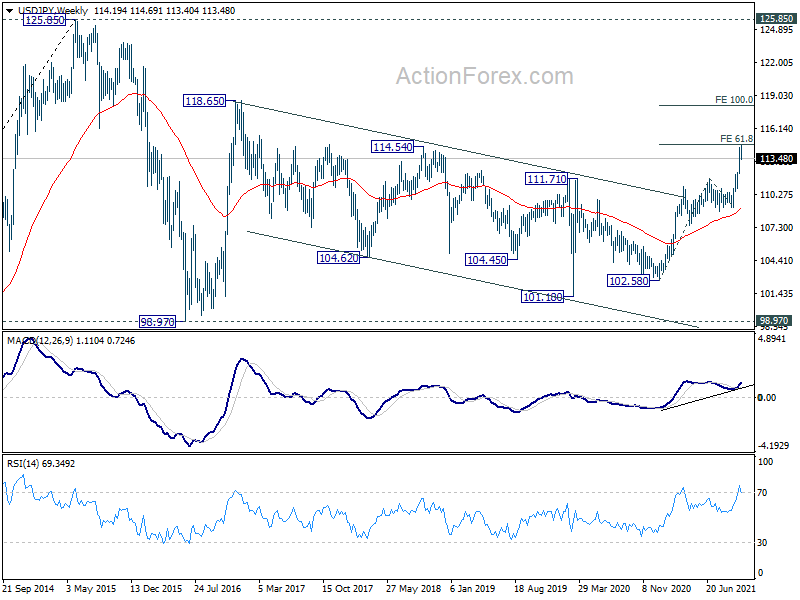
In the long term picture, the rise from 75.56 (2011 low) long term bottom to 125.85 (2015 high) is viewed as an impulsive move, no change in this view. Price actions from 125.85 are seen as a corrective pattern which could still extend. In case of deeper fall, downside should be contained by 61.8% retracement of 75.56 to 125.85 at 94.77. Up trend from 75.56 is expected to resume at a later stage for above 135.20/147.68 resistance zone.
GBP/USD Weekly Outlook
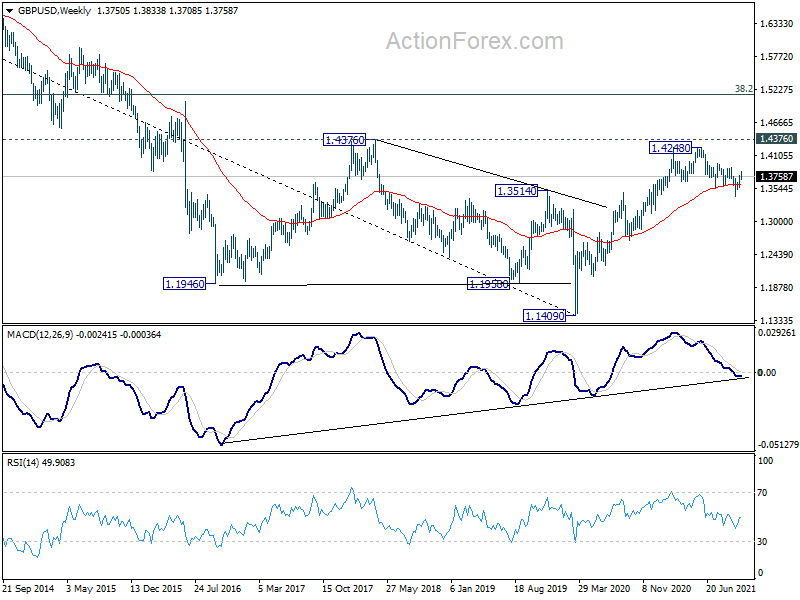
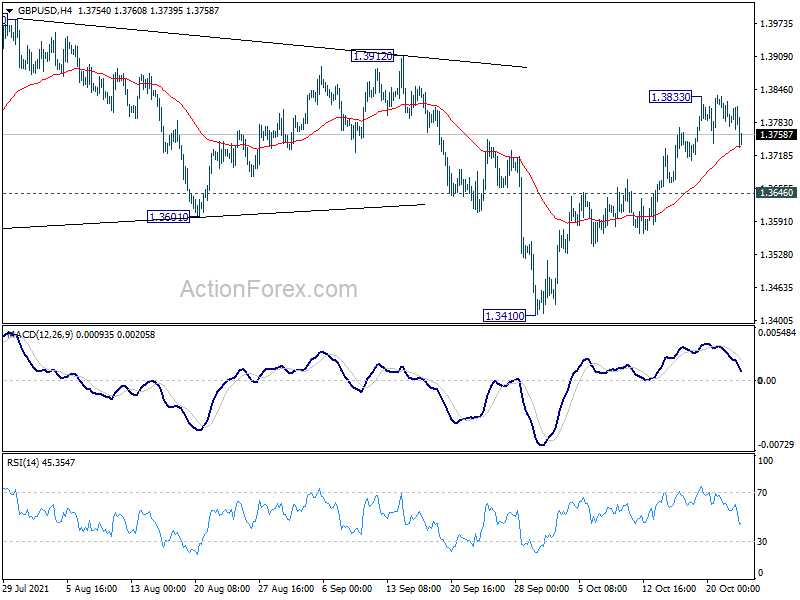
GBP/USD edged higher to 1.3833 last week but turned sideway again. Initial bias is neutral this week for consolidations first. But further rally is expected as long as 1.3646 support holds. Above 1.3833 will target 1.3912 key structural resistance. Firm break there will indicate that the correction from 1.4248 is complete with three waves down to 1.3410. Further rally would then be seen to retest 1.4248 high. However, break of 1.3646 will turn bias to the downside for retesting 1.3410 low.
In the bigger picture, the structure of the fall from 1.4248 suggests that it's a correction to the up trend from 1.1409 (2020 low) only. While deeper fall cannot be ruled out yet, downside should be contained by 38.2% retracement of 1.1409 to 1.4248 at 1.3164, at least on first attempt, to bring rebound. On the upside, firm break of 1.4376 key resistance (2018 high) will add to the case of long term bullish reversal. However, sustained trading below 1.3164 will revive some medium term bearishness and target 61.8% retracement at 1.2493.
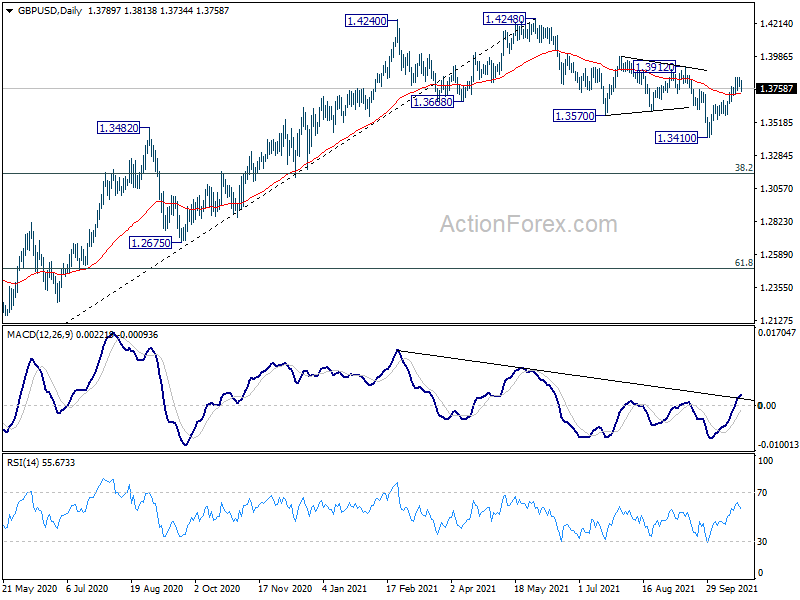
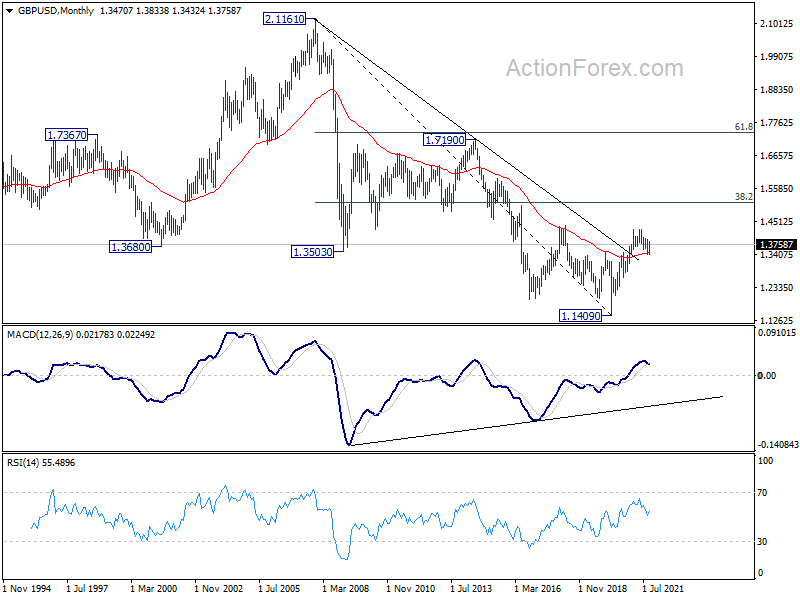
In the longer term picture, a long term bottom should be in place at 1.1409, on bullish convergence condition in monthly MACD. Rise from there would target 38.2% retracement of 2.1161 to 1.1409 at 1.5134. Reaction from there would reveal whether rise from 1.1409 is just a correction, or developing into a long term up trend.