

Sample Category Title
USD/CHF Weekly Outlook
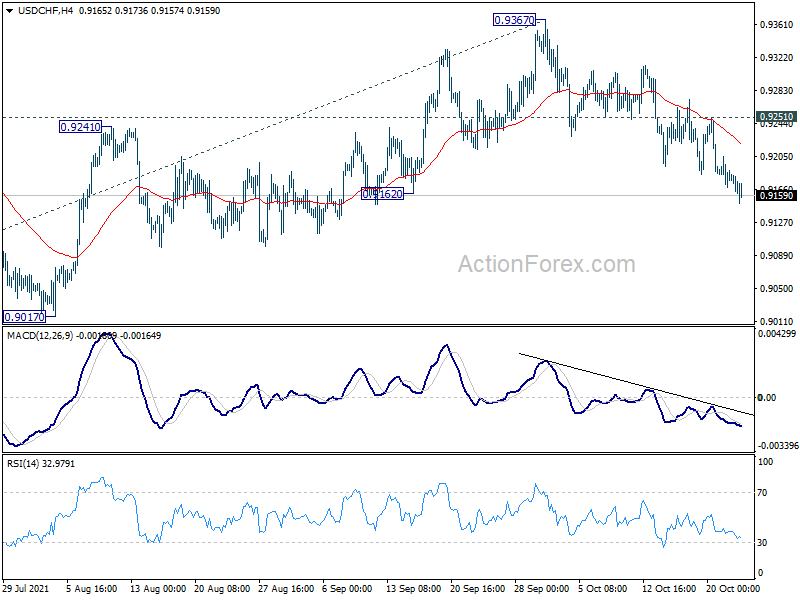
USD/CHF's fall from 0.9367 extended lower last week. The development now suggest that rebound form 0.8925 has completed with three waves up to 0.9367, on bearish divergence condition in daily MACD. Initial bias remains on the downside this week for 0.9017 support first. Break will target 0.8925 next. On the upside, however, break of 0.9251 minor resistance will turn bias back to the upside for retesting 0.9367 instead.
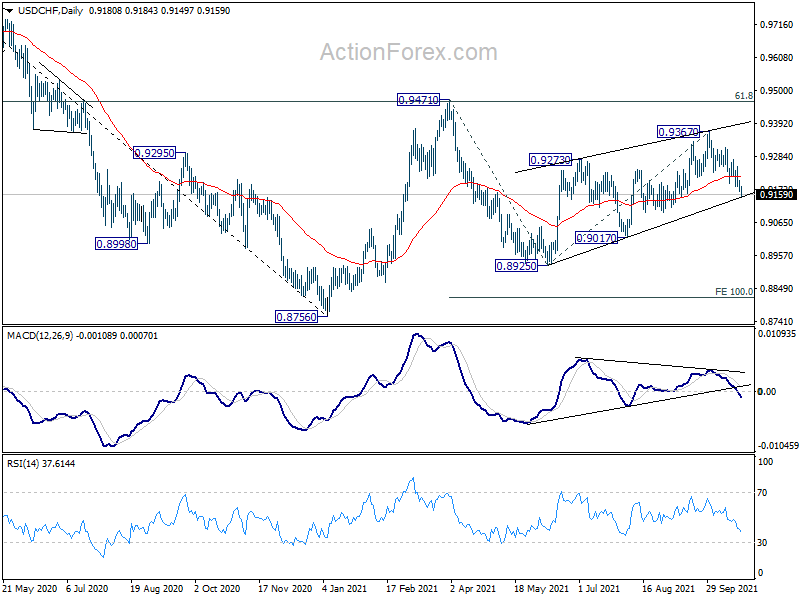
In the bigger picture, the corrective structure of the rebound from 0.8925 argues that fall from 0.9471 is not completed yet. It could either be the second leg of pattern from 0.8756 (2021 low), or resuming larger down trend from 1.0237 (2018 high). We'd pay attention to the downside momentum and assess the odds later. But for now, medium term outlook will be neutral at best as long as 0.9471 resistance holds.
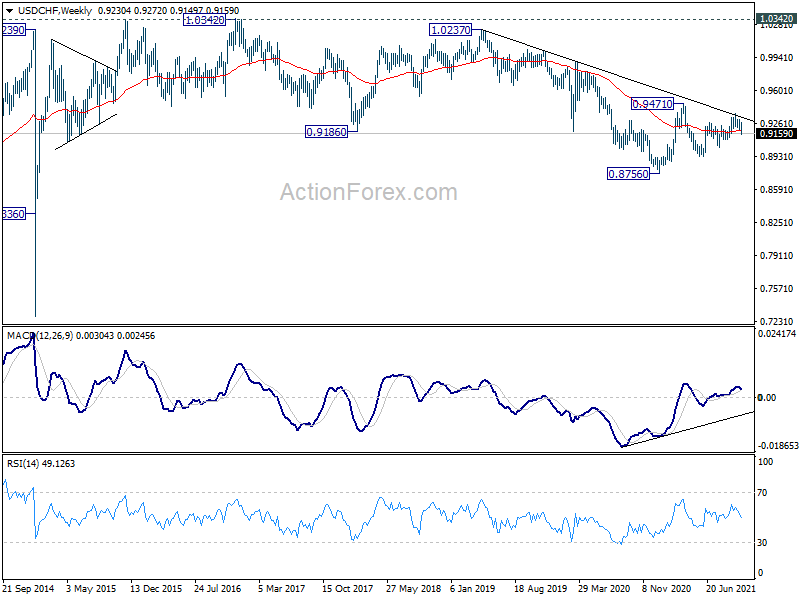
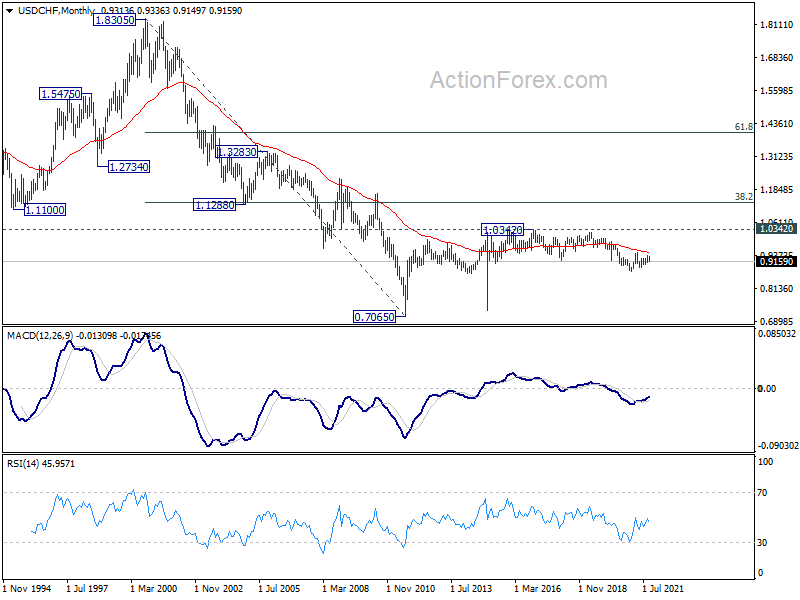
In the long term picture, price actions from 0.7065 (2011 low) are currently seen as developing into a long term corrective pattern, at least until a firm break of 1.0342 resistance.
AUD/USD Weekly Outlook
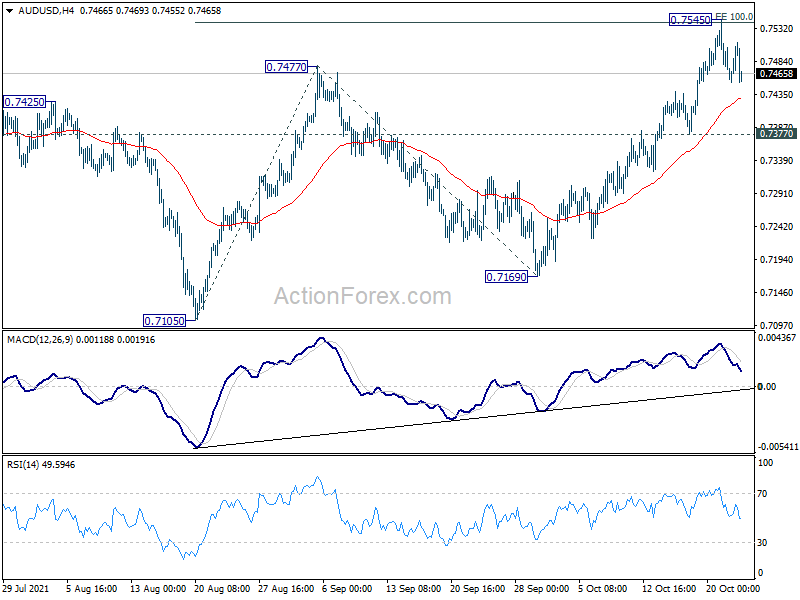
AUD/USD rose further to 0.7545 last week and met 100% projection of 0.7105 to 0.7477 from 0.7169 at 0.7541. But as a temporary top was formed, initial bias is neutral this week for consolidations first. Downside of retreat should be contained by 0.7377 support to bring another rally. Break of 0.7545 will target 161.8% projection at 0.7771.
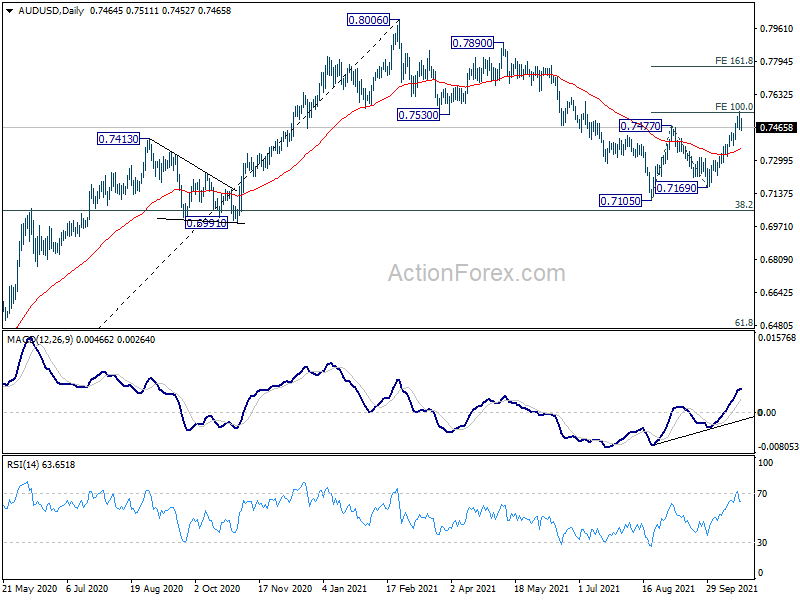
In the bigger picture, with 0.6991 cluster support (38.2% retracement of 0.5506 to 0.8006 at 0.7051) intact, we're seeing price action from 0.8006 as a correction only. That is, up trend from 0.5506 low would resume after the correction completes. In that case, main focus will be 0.8135 key resistance (2018 high). Sustained break there will carry larger bullish implications. However, sustained break of 0.6991 will argue that the whole medium term trend has indeed reversed.
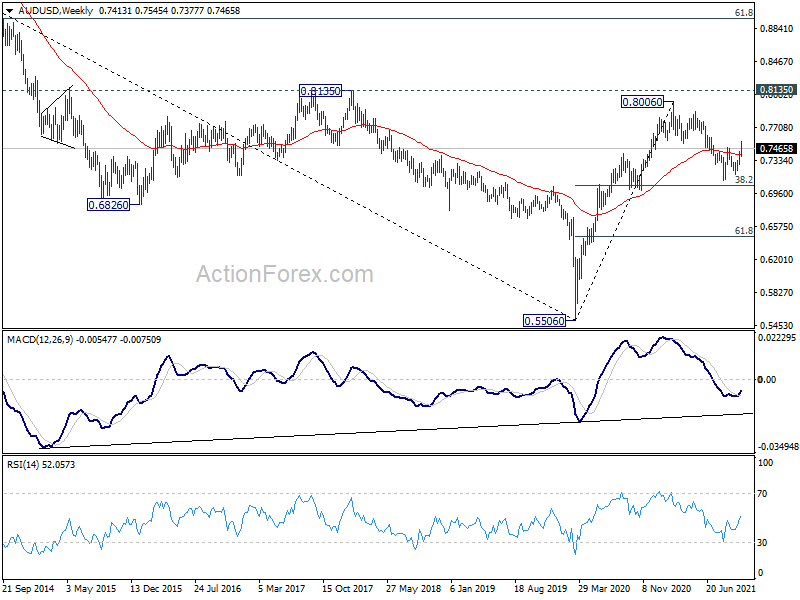
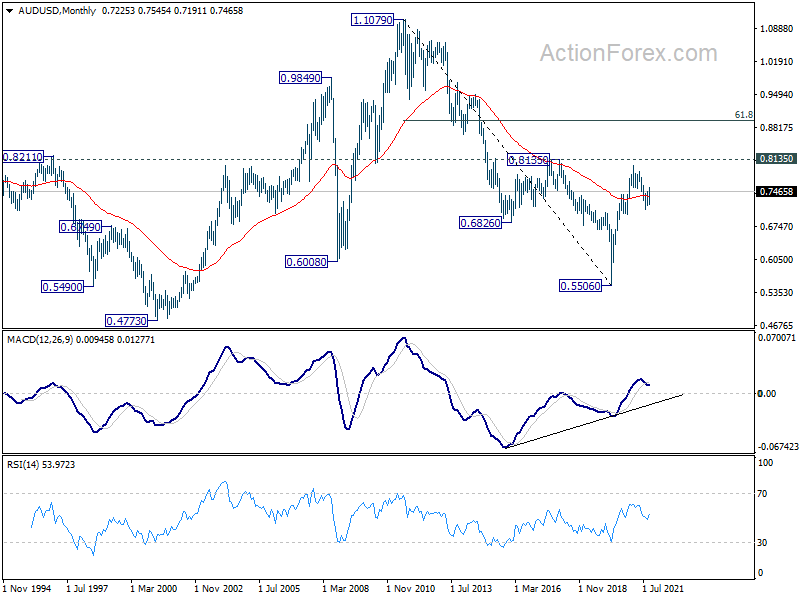
In the longer term picture, focus remains on 0.8135 structural resistance. Decisive break there will argue that rise from 0.5506 is developing into a long term up trend that reverses whole down trend from 1.1079 (2011 high). In that case, further rally would be seen to 61.8% retracement of 1.1079 to 0.5506 at 0.8950 and possibly above. Rejection by 0.8135 will keep long term outlook neutral at best.
USD/CAD Weekly Outlook
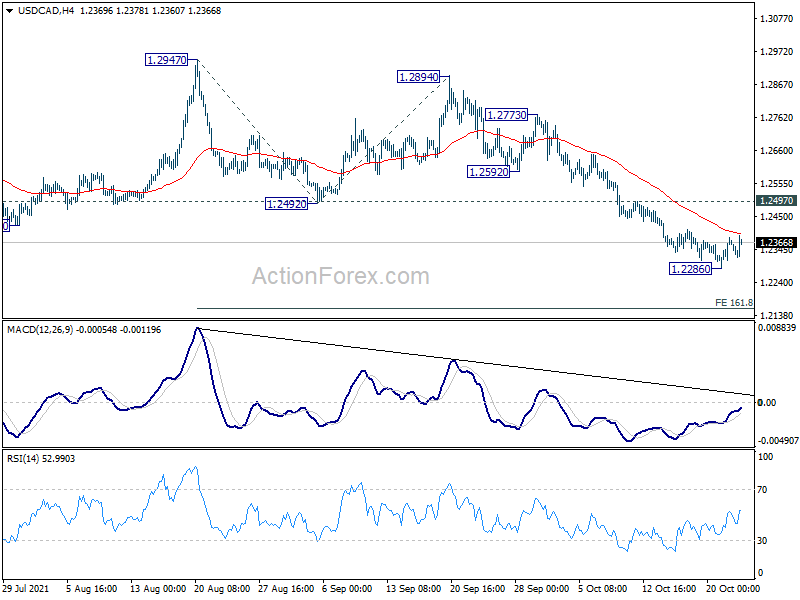
USD/CAD edged lower to 1.2286 last week but turned sideway since then. Initial bias remains neutral this week for consolidation first. Upside of recovery should be limited by 1.2497 resistance to bring fall resumption. On the downside, break of 1.2286 will resume the fall from 1.2947 to 161.8% projection of 1.2947 to 1.2492 from 1.2894 at 1.2158 next.
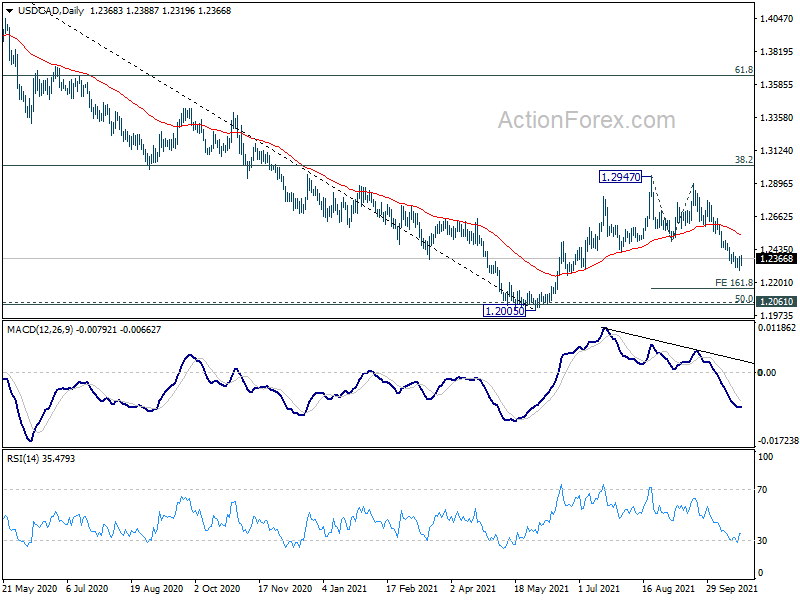
In the bigger picture, the rejection by 38.2% retracement of 1.4667 to 1.2005 at 1.3022 argues that rebound from 1.2005 is merely a corrective rise, which is complete. More importantly, the down trend from 1.4667 (2020 high) is not over yet. Sustained break of 1.2005 will extend the down trend to next long term fibonacci level at 61.8% retracement of 0.9406 to 1.4689 at 1.1424. In any case, outlook will not turn bullish as long as 1.2947 resistance holds.
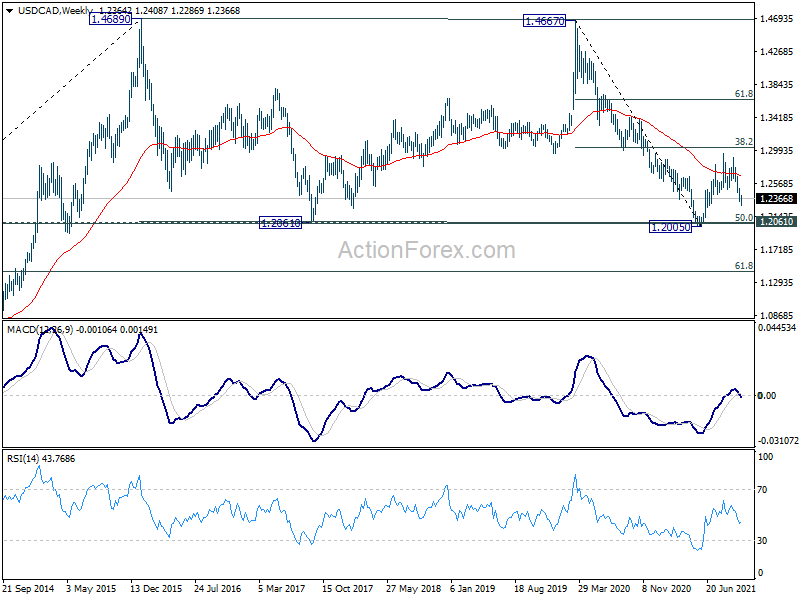
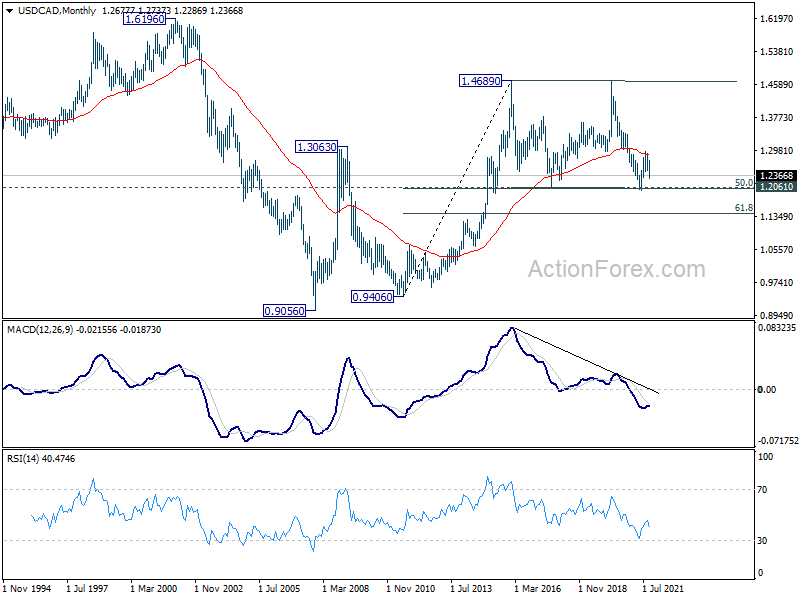
In the longer term picture, we're viewing price actions from 1.4689 as a consolidation pattern. Thus, up trend from 0.9506 (2007 low) is still expected to resume at a later stage. This will remain the favored case as long as 1.2061 support holds, which is close to 50% retracement of 0.9406 to 1.4689 at 1.2048. However, rejection by 55 month EMA, follow by firm break of 1.2061 support, will argue that USD/CAD has already started a long term down trend. Next target is 61.8% retracement of 0.9406 to 1.4689 at 1.1424.
GBP/JPY Weekly Outlook
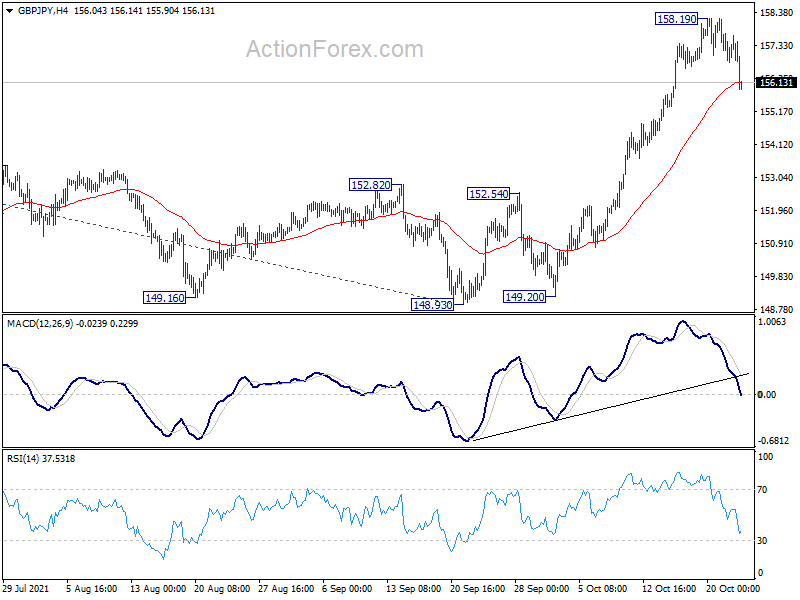
GBP/JPY rose to 158.19 last week but retreated notably since then. Initial bias is now on the downside this week for pull back towards 55 day EMA (now at 152.90). On the upside, break of 158.19 will resume larger up trend from 123.94.Next target will be 61.8% projection of 136.96 to 156.05 from 148.93 at 160.72.
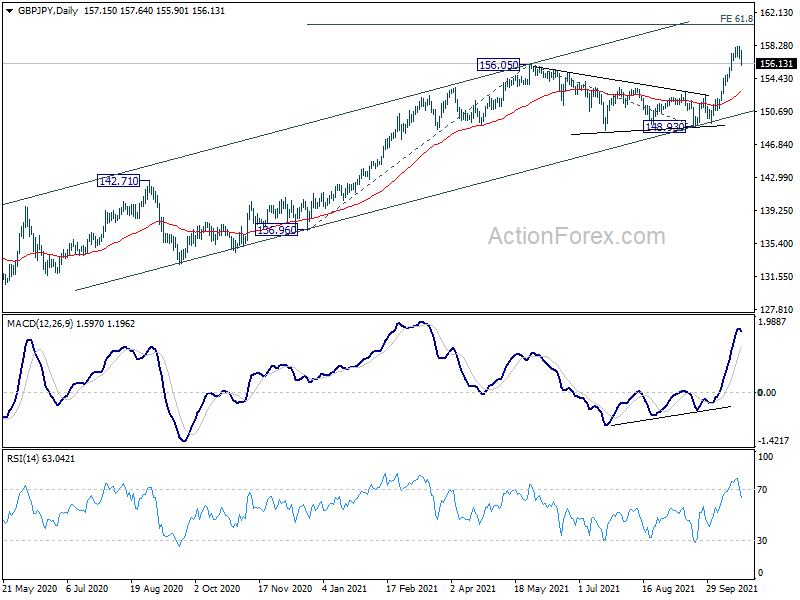
In the bigger picture, rise from 123.94 is seen as the third leg of the pattern from 122.75 (2016 low). The stay above 55 week EMA affirms medium term bullishness. Current rise should now target 61.8% retracement 195.86 (2015 high) to 122.75 at 167.93 next. In any case, outlook will remain bullish as long as 148.93 structural support hold, even in case of deep pull back.
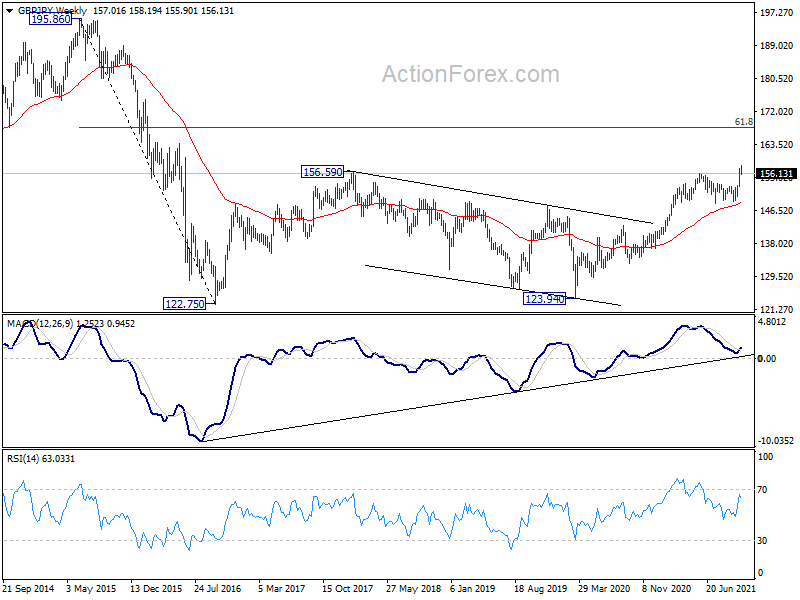
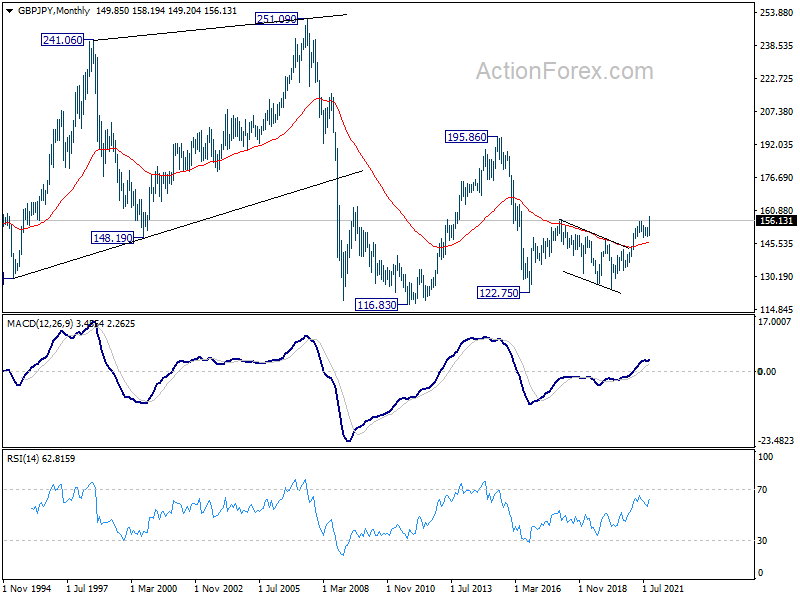
In the longer term picture, GBP/JPY could have set up a long term up trend already with break of 156.69 resistance, and the stay above 55 month EMA. Current rise from 122.75 could target a test on 195.86 (2015 high).
EUR/JPY Weekly Outlook
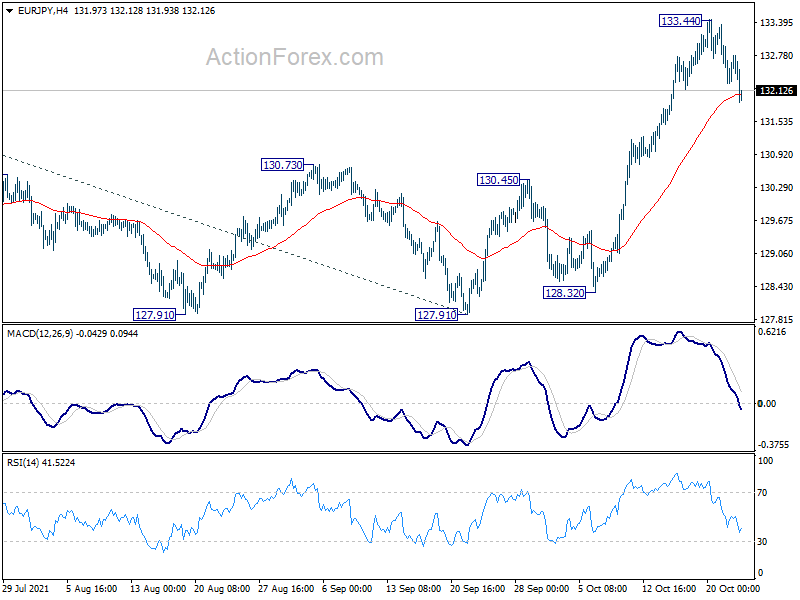
EUR/JPY rose to 133.44 last week but retreated notably since then. Initial bias is now mildly on the downside this week for deeper pull back to 55 day EAM (now at 130.38). On the upside, above 133.44 will target 134.11 high first. Firm break there will resume larger up trend from 114.42. Next target is 61.8% projection of 121.63 to 134.11 from 127.91 at 135.62.
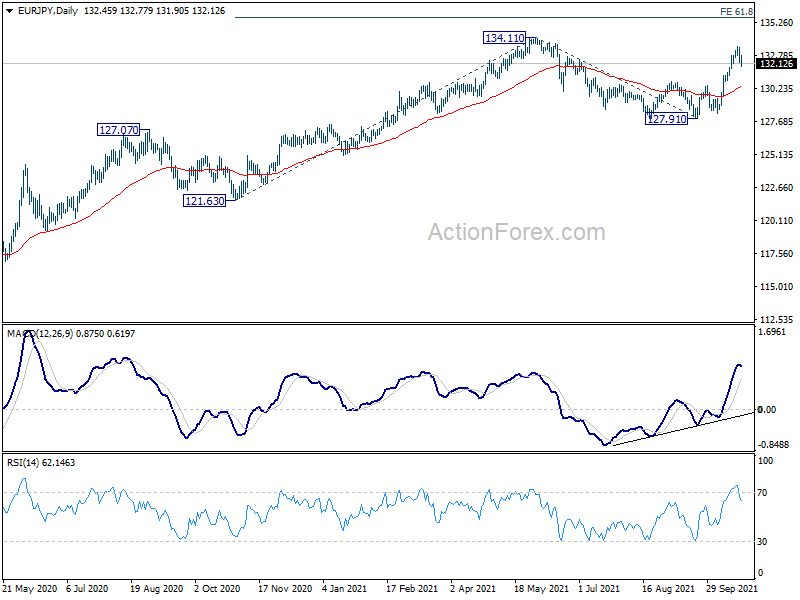
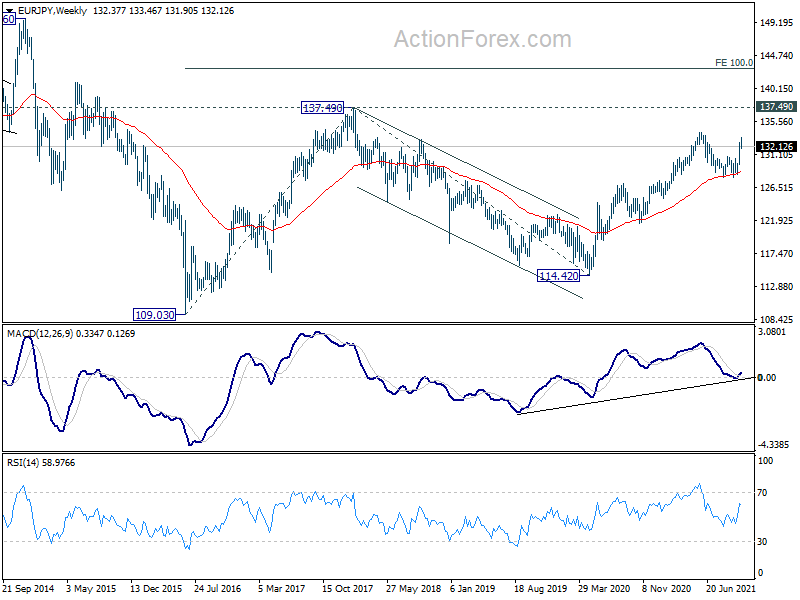
In the bigger picture, rise from 114.42 (2020 low) is still in progress and the strong support support from 55 week EMA affirms medium term bullishness. Further rise would be seen to retest 137.49 (2018 high). Decisive break there will resume the whole long term rise from 109.03 (2016 low). Next target will be 100% projection of 109.03 to 137.49 from 114.42 at 142.88. This will now remain the favored case as long as 127.91 support holds.
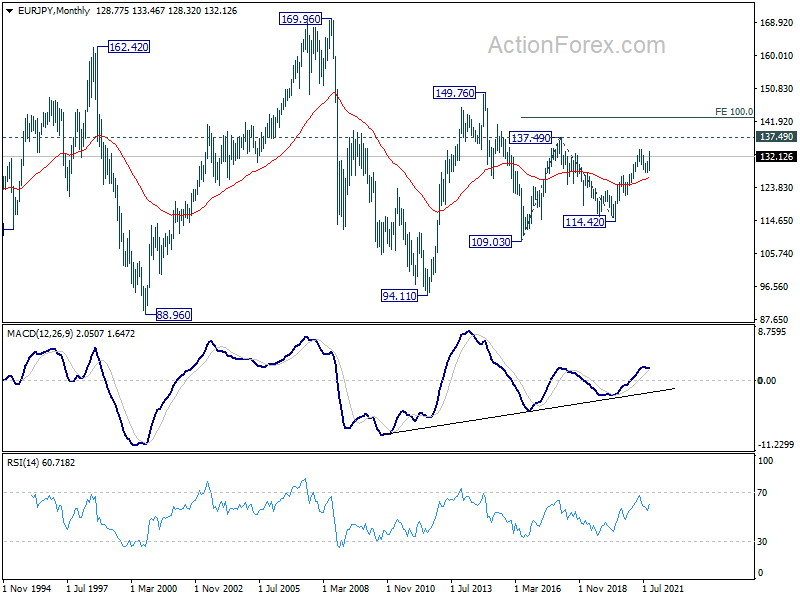
In the long term picture, EUR/JPY is staying in long term sideway pattern, established since 2000. Another rising leg in progress for 137.49 resistance and above.
EUR/GBP Weekly Outlook
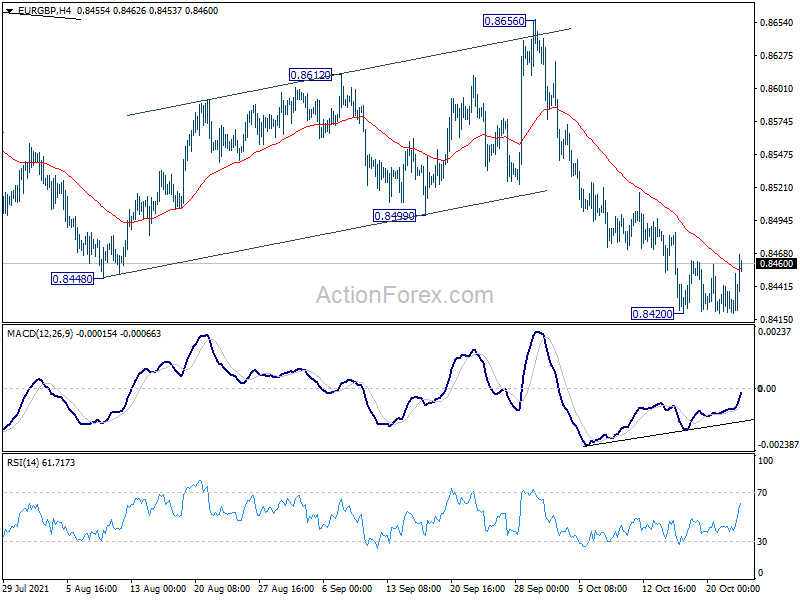
EUR/GBP stayed in range above 0.8420 last week and outlook is unchanged. Initial bias remains neutral this week first. On the downside, break of 0.8420 will resume the larger down trend from 0.9499 to 0.8276 key long term support next. On the upside, though, sustained break of 55 day EMA (now at 0.8523) will bring stronger rebound back to 0.8656 resistance.
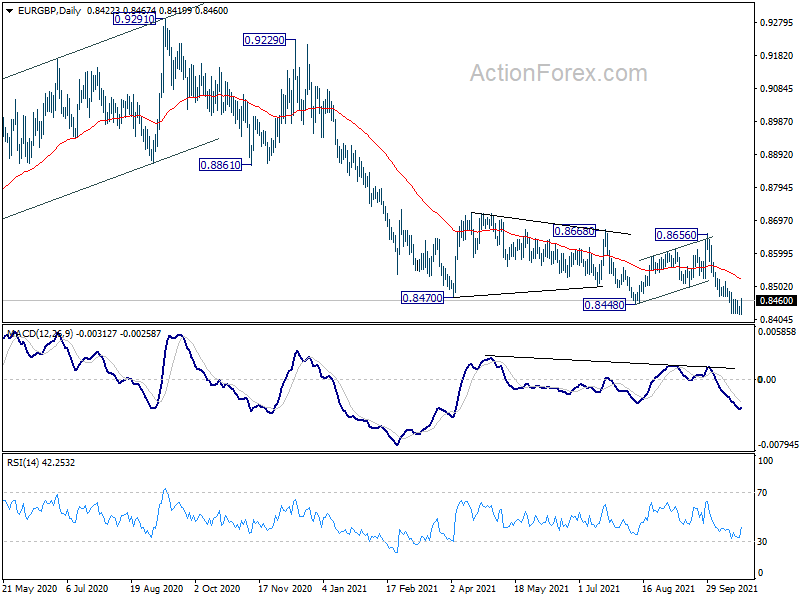
In the bigger picture, price actions from 0.9499 (2020 high) are still seen as developing into a corrective pattern. Deeper fall could be seen as long as 0.8656 resistance holds, towards long term support at 0.8276. However, firm break of 0.8656 resistance would argue that a medium term bottom was already formed. Stronger rise would be seen to 0.8861 support turned resistance to confirm completion of the corrective pattern.
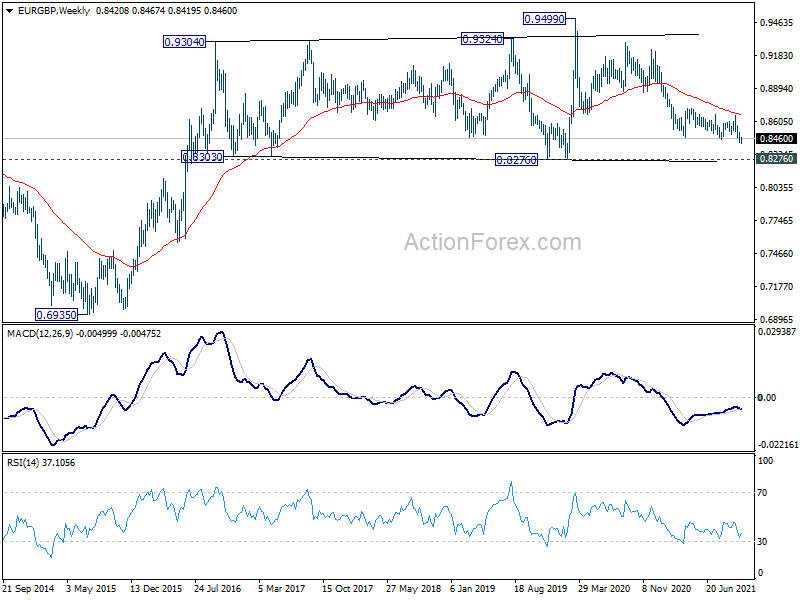
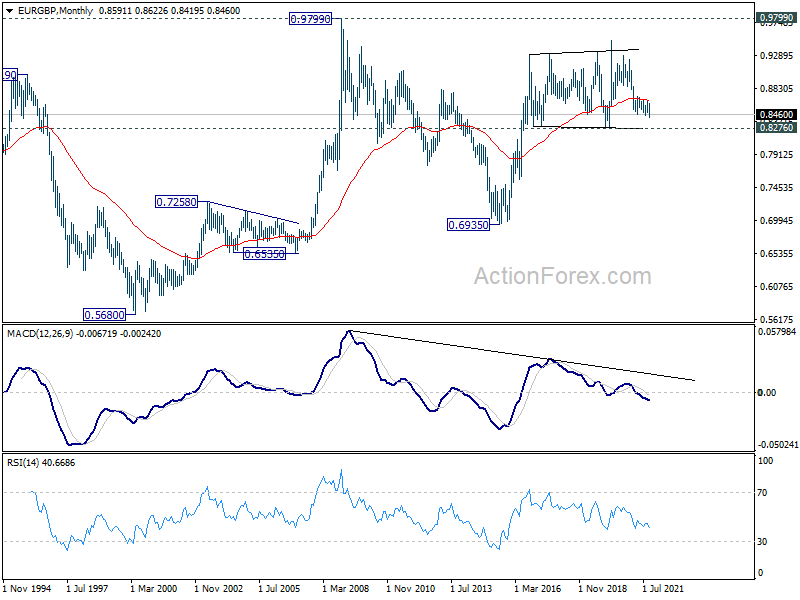
In the long term picture, outlook will stay bullish as long as 0.8276 support holds. Break of 0.9499 is in favor at a later stage, to resume the up trend from 0.6935 (2015 low).
EUR/AUD Weekly Outlook
EUR/AUD dropped further to as low as 1.5456 last week, but formed a temporary low there and recovered. Initial bias remains neutral this week for consolidations first. On the downside, break of 1.5456 will resume the fall from 1.6434 to 161.8% projection of 1.6434 to 1.5907 from 1.6232 at 1.5379 next. Break there will target 1.5250 low. Nevertheless, break of 1.5716 will turn bias to the upside for stronger rebound to 55 day EMA (now at 1.5893).
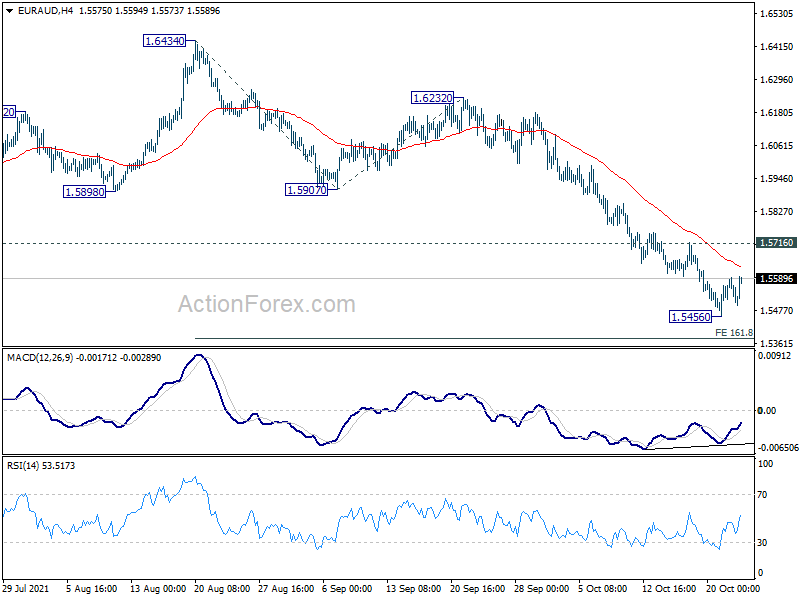
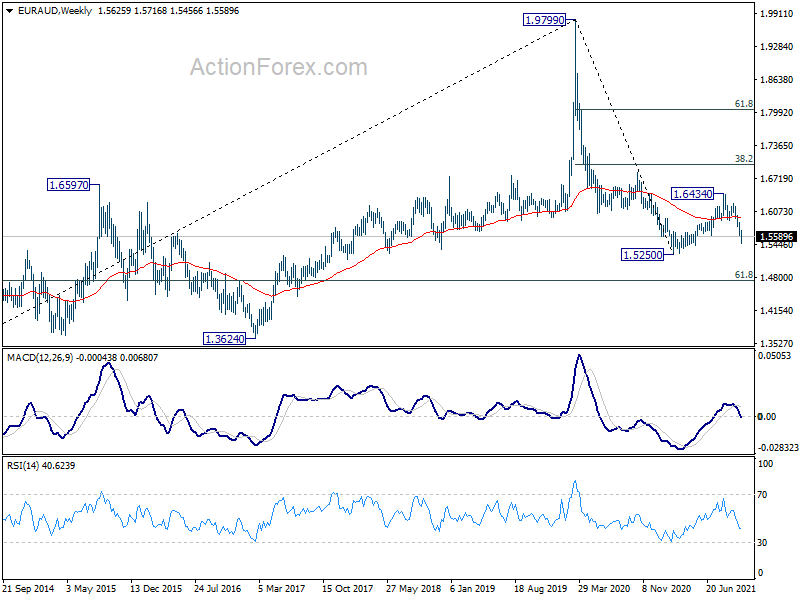
In the bigger picture, with 38.2% retracement of 1.9799 to 1.5250 at 1.6988 intact, the down trend from 1.9799 (2020 high) is expected to resume at a later stage. Firm break of 1.5250 will target 61.8% retracement of 1.1602 (2012 low) to 1.9799 at 1.4733. In any case, sustained break of 1.6988 fibonacci level is needed to indicate long term reversal.
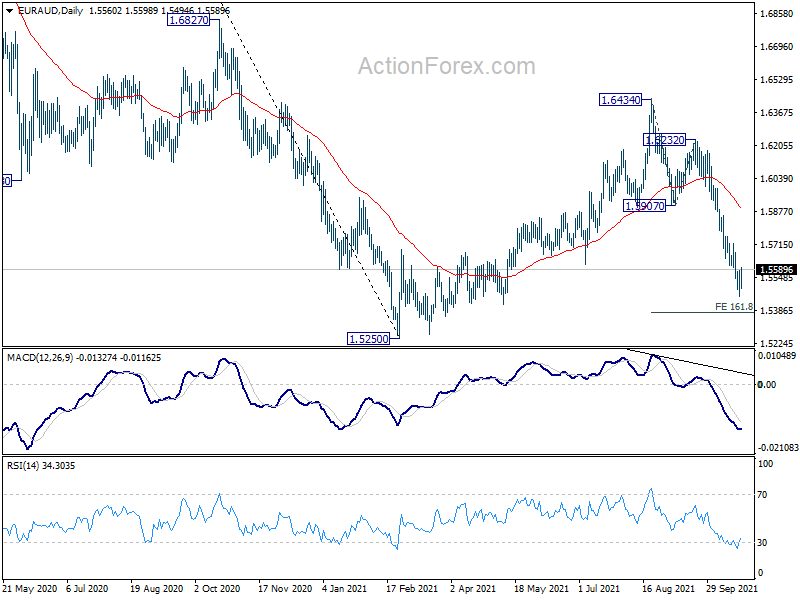
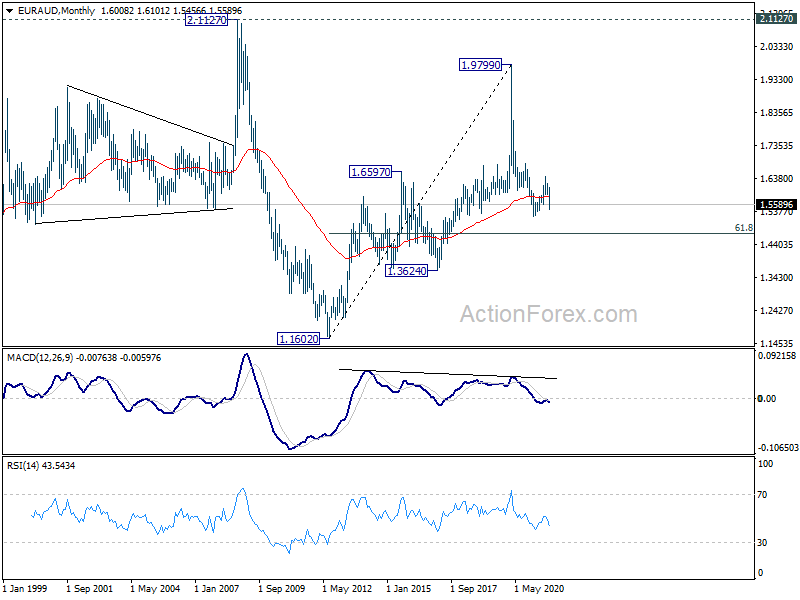
In the longer term picture, rise from 1.1602 (2012 low) should have already completed with three waves up to 1.9799 (2020 high). Fall from there is seen as a medium term to long term down leg as a long term down trend, or a sideway pattern. In either case, break of 1.5250 will target 61.8 retracement of 1.1602 to 1.9799 at 1.4733. Break there will target 1.3624 long term support.
EUR/CHF Weekly Outlook
EUR/CHF's down trend resumed after brief recovery and hit as low as 1.0657. Initial bias stays on the downside this week. Firm break of 61.8% projection of 1.1149 to 1.0694 from 1.0936 at 1.0655 will target 100% projection at 1.0481, which is close to 1.0505 key long term support. On the upside, break of 1.0764 resistance is needed to indicate short term bottoming. Otherwise, outlook will stay bearish in case of recovery.
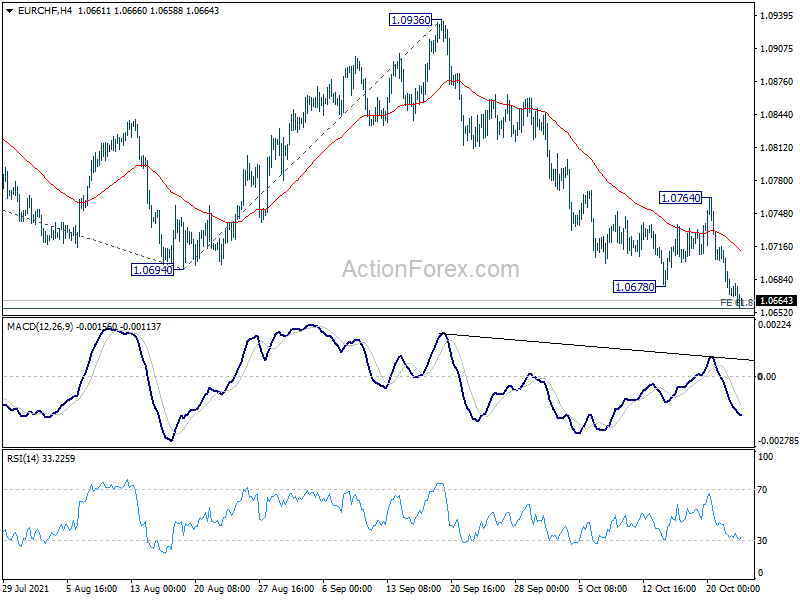
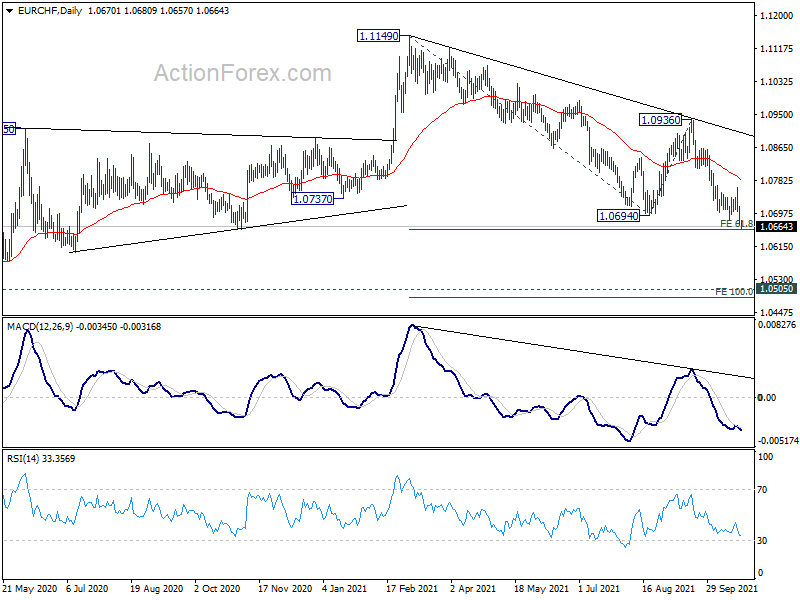
In the bigger picture, fall from 1.1149 (2021 high) is currently seen as the second leg of the patter from 1.0505 (2020 low) first. Hence, in case of deeper fall, we'd look for strong support from 1.0505 to bring rebound. However, sustained break of 1.0505 will resume the long term down trend from 1.2004 (2018 high). Also, medium term outlook will now be neutral at best as long as 1.0936 resistance holds.
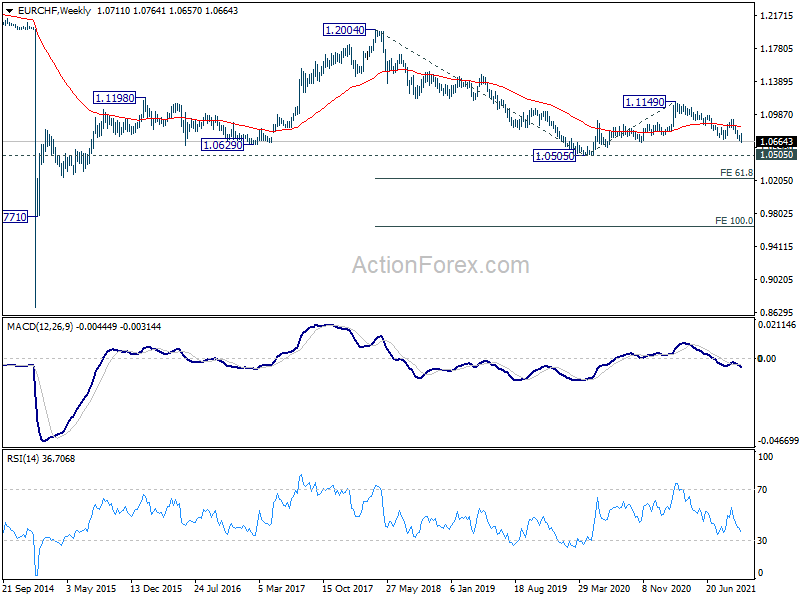
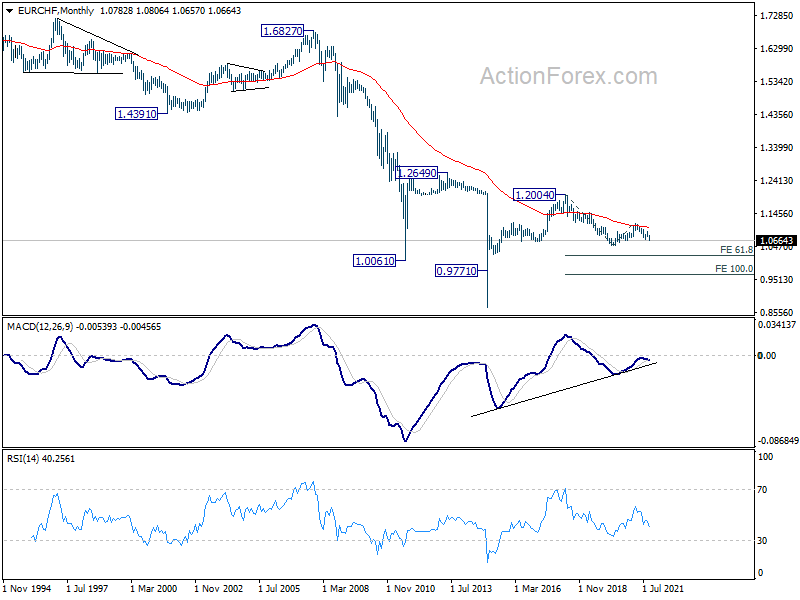
In the long term picture, rejection by 55 month EMA (now at 1.1037) maintains long term bearishness. Break of 1.0505 low will resume the down trend from 1.2004 to 61.8% projection of 1.2004 to 1.0505 to 1.1149 at 1.0223.
Dollar Ended Lower Despite Increasing Bets on Fed Hike, US Stocks Hit New Records
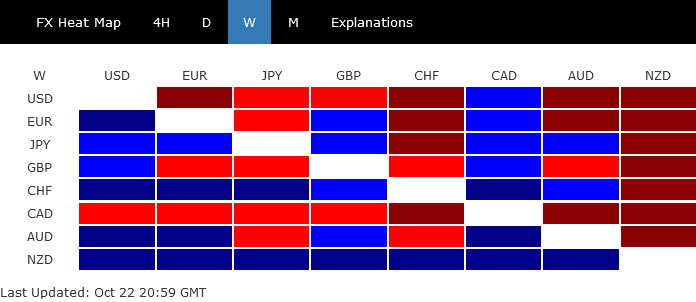
The markets have turned a bit mixed last week and have likely entered into a near term consolidative mode already. Dollar ended broadly lower even though traders continued to add their bet on a Fed rate hike next year. Indeed, the odds for a hike by June is now higher than not. Canadian Dollar was worse despite oil's persistent strength.
Yen was recovering while Swiss Franc strengthened with rising treasury yields in the background. Germany 10-year yield hit at -0.1% finally and Japan 10-year JGB yield was on track to 0.1% handle. US stocks also hit new record highs, even though the breakouts weren't clean. New Zealand Dollar was the strongest on increasing expectation of another imminent RBNZ hike, but buying didn't follow through.
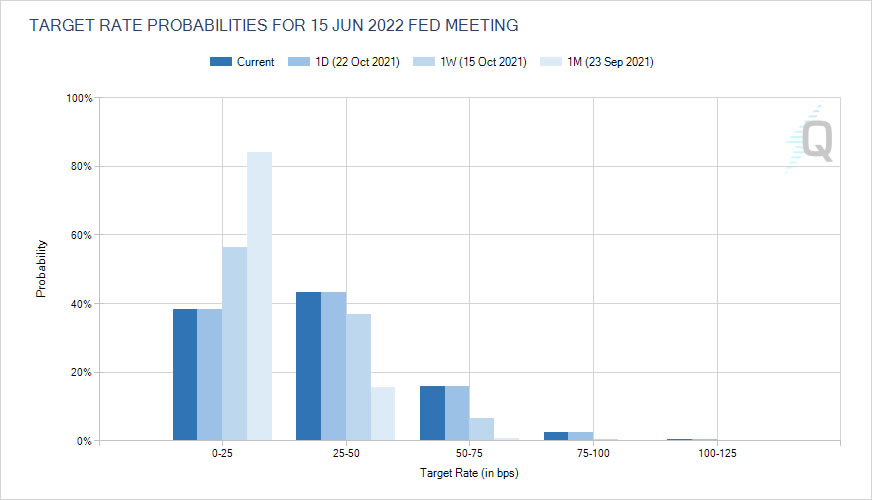
Markets pricing in 62% chance of a Fed hike by June next year
Overall, comments from Fed officials last week further confirmed that tapering is on the way to be announced in November. While it's not time for interest rate hike yet, there are increasing concerns that supply bottlenecks and high inflation is going to last longer. Hence, Fed could pull ahead a rate hike earlier.
In particular, Fed Chair Jerome Powell indicated on Friday, "the risks are clearly now to longer and more persistent bottlenecks and, thus, to higher inflation". He pointed out, "our policy is well positioned to manage a range of plausible outcomes. We need to watch, and watch carefully, and see if the economy is evolving consistent with our expectations, and adapt policy accordingly." That is seen by the markets as opening the door for an early rate hike.
According to fed fund futures, traders are now pricing in only 38% chance of federal funds rate staying at 0-0.25% by June next year. That is, there is 62% chance of a hike by then, comparing to less than 20% a month a ago.
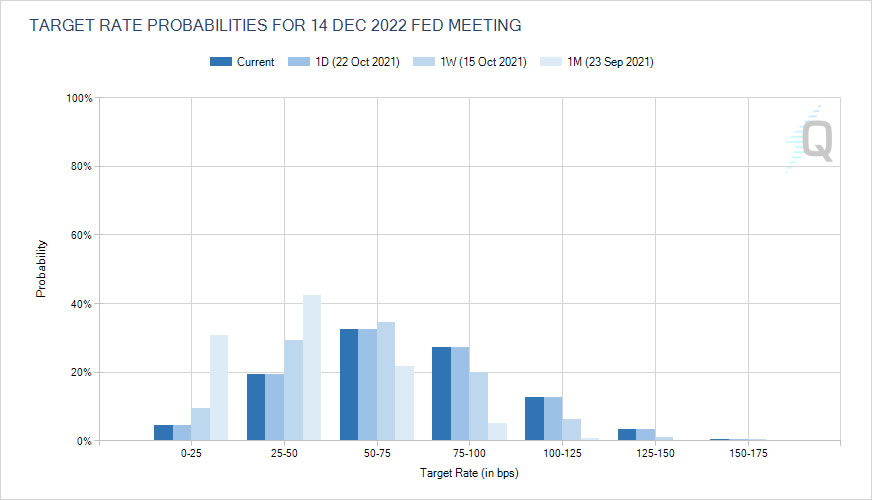
The chance for federal funds staying at 0-0.25% by the end of 2022 has now dropped to just 4.52%. That is, traders are pricing in over 95% of a hike by then.
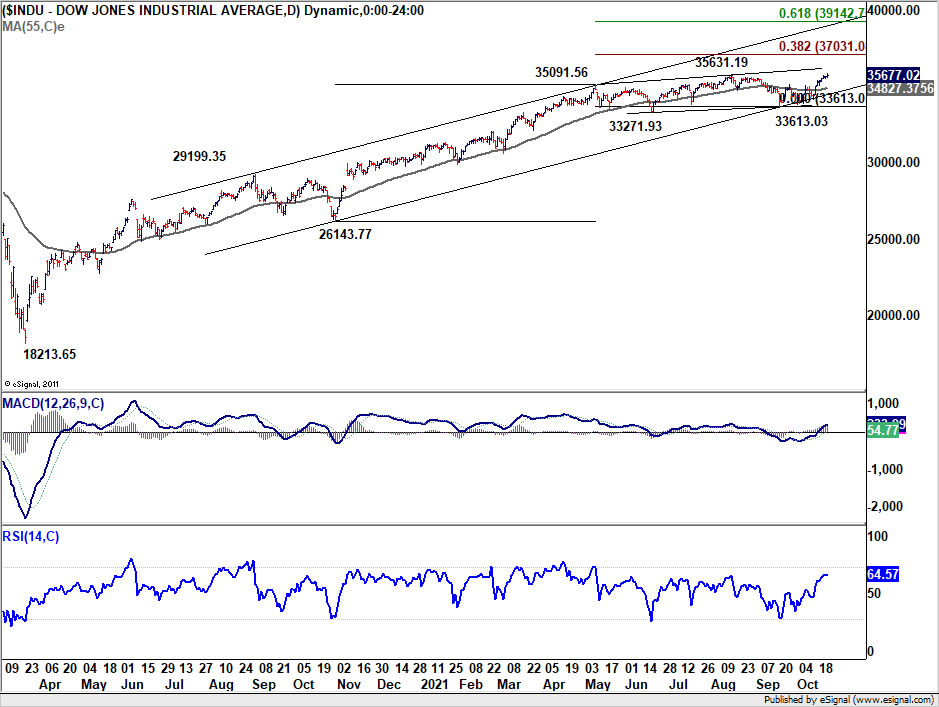
DOW and S&P 500 eked out new record highs
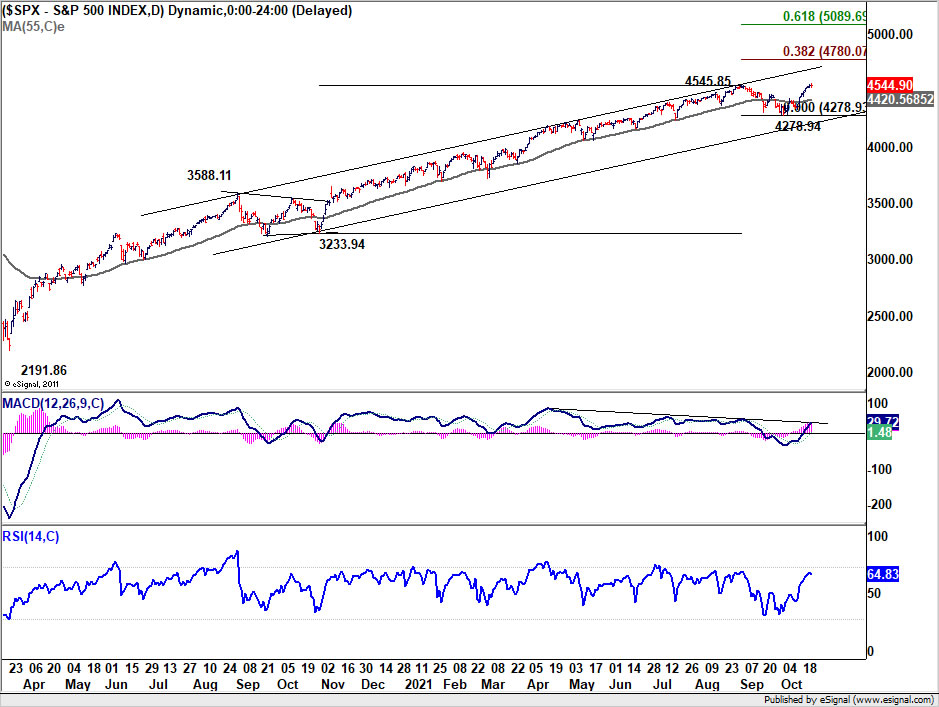
Both DOW and S&P 500 eked out new record highs last week but the breakouts were not too convincing yet. Nevertheless, near term outlook in DOW should stay bullish as long as 55 day EMA (now at 34827.37) holds. Next near term target will be 38.2% projection of 26143.77 to 35091.56 from 33613.03 at 37031.08. Firm break there should secure medium term upside momentum. Such development, together with rising yields and increasing expectation of Fed hike, would be rather bullish.
The equivalent level for S&P 500 would be 55 day EMA (now at 4420.56), and 38.2% projection of 3233.94 to 4545.85 from 4278.94 at 4780.07.
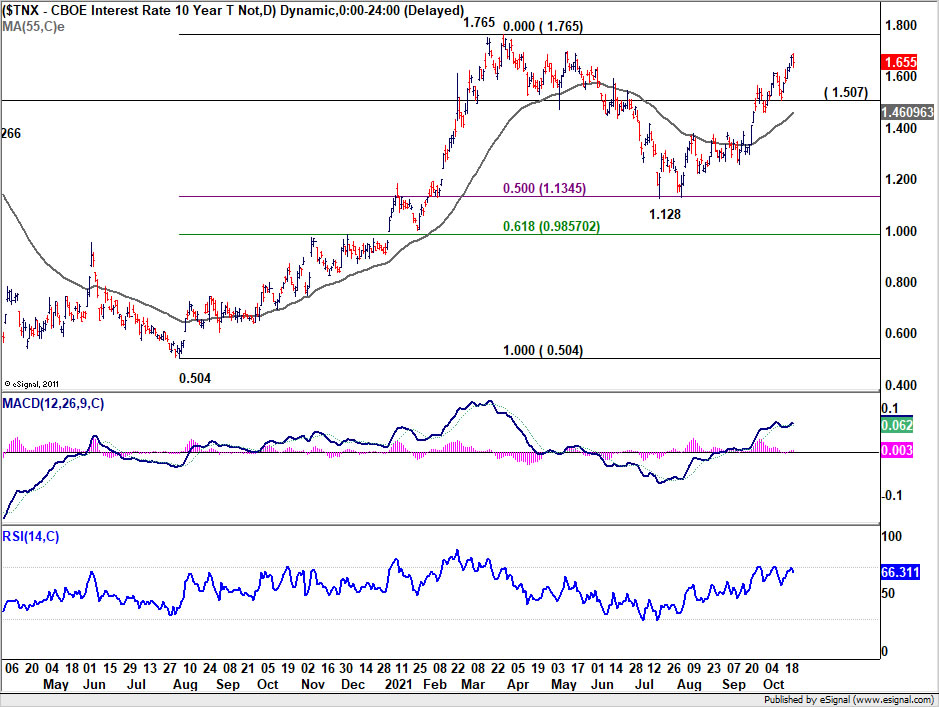
10-year yield extending rally towards 1.765 high
10-year yield's rally continued last week to close at 1.655. But further rise would remain in favor as long as 1.507 support holds, to retest 1.765 high. At this point, upside momentum as indicated in daily MACD is just steady, and doesn't warrant a decisive break there. The development could firstly cap Dollar's rebound and secondly, slow Yen's selloff. In particular USD/JPY would need a firm break of 1.765 in TNX to aid it through 115 handle.
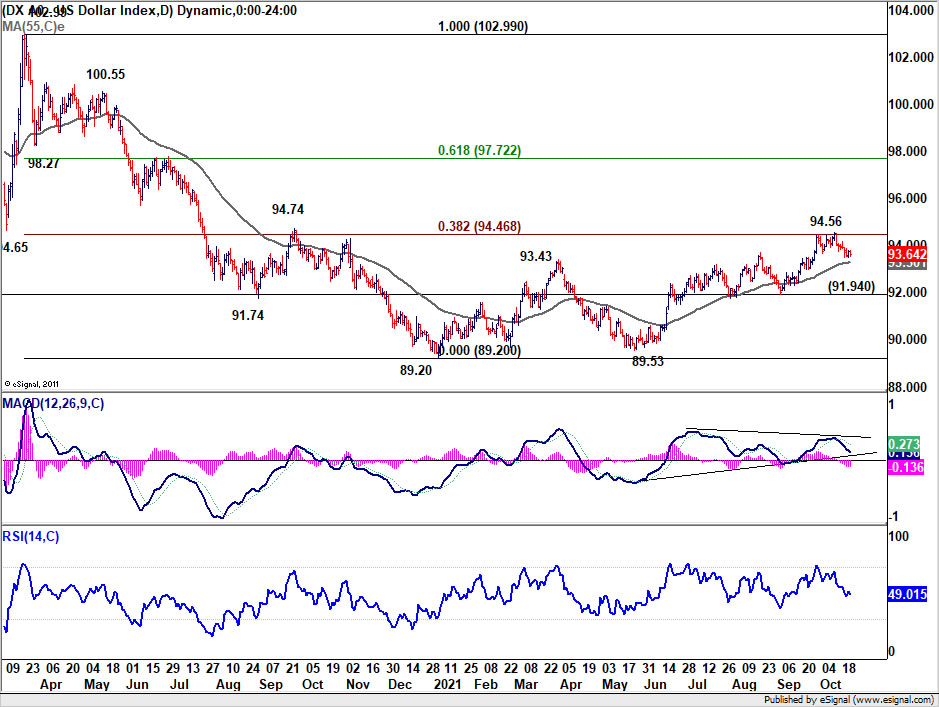
Dollar index extending pull back from 94.56
Dollar index extended the pull back from 94.56 in spite of rising yields and increasing expectation of Fed hike next year. As long as 55 day EMA (now at 93.30) holds, recent rise form 89.53 is still in favor to continue. Yet, 38.2% retracement 102.99 to 89.20 at 94.46 will remain a key hurdle to overcome, unless TNX could break through 1.765 high. Meanwhile, firm break of the 55 day EMA will suggest that Dollar's weakness is spreading from against commodity currencies to against everyone.
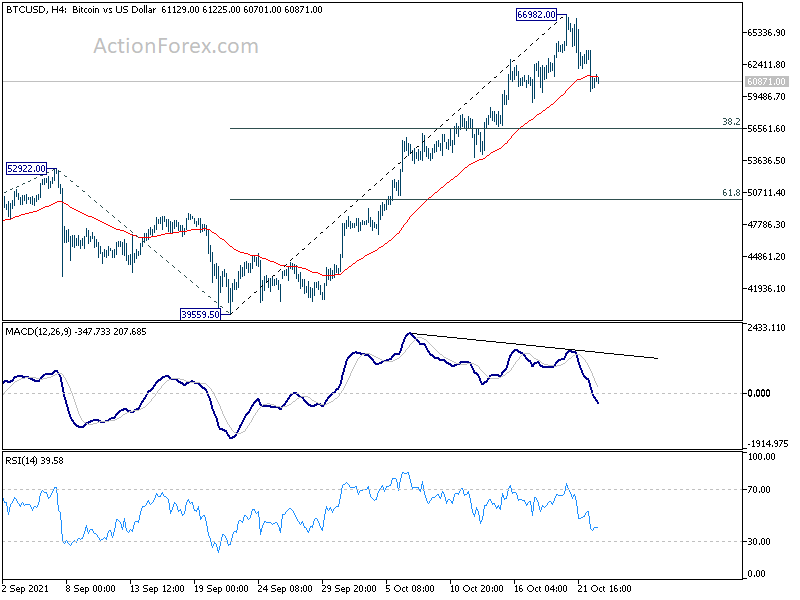
Bitcoin hit new record, near term consolidations to follow
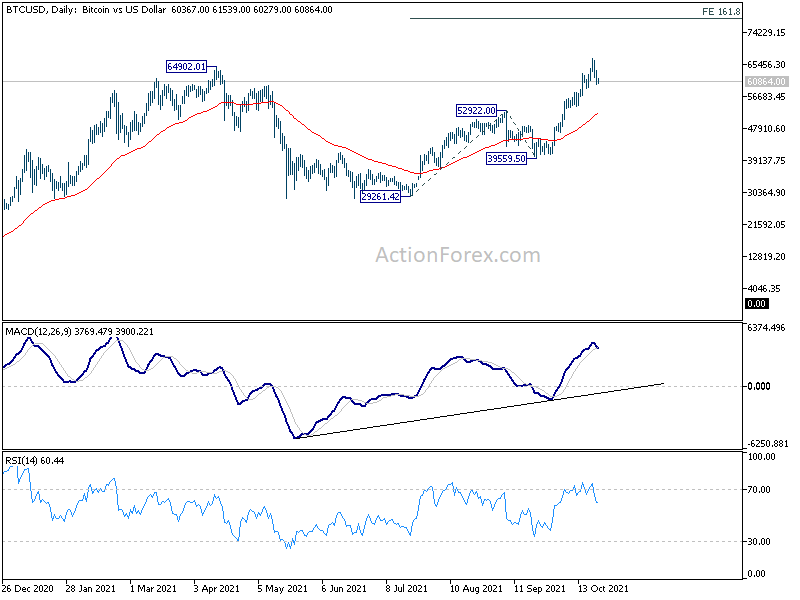
Bitcoin surged to new record high at 66982 last week but lost momentum since then. Considering bearish divergence condition in 4 hour MACD, a short term top should be formed and some more consolidations should follow in the near term. Though, we'd expect strong support from 38.2% retracement of 39559 to 66982 at 56506 to contain downside and bring rebound. And upside breakout is expected later to 161.8% projection of 29261 to 52922 from 39559 at 77842.
USD/CHF Weekly Outlook
USD/CHF's fall from 0.9367 extended lower last week. The development now suggest that rebound form 0.8925 has completed with three waves up to 0.9367, on bearish divergence condition in daily MACD. Initial bias remains on the downside this week for 0.9017 support first. Break will target 0.8925 next. On the upside, however, break of 0.9251 minor resistance will turn bias back to the upside for retesting 0.9367 instead.
In the bigger picture, the corrective structure of the rebound from 0.8925 argues that fall from 0.9471 is not completed yet. It could either be the second leg of pattern from 0.8756 (2021 low), or resuming larger down trend from 1.0237 (2018 high). We'd pay attention to the downside momentum and assess the odds later. But for now, medium term outlook will be neutral at best as long as 0.9471 resistance holds.
In the long term picture, price actions from 0.7065 (2011 low) are currently seen as developing into a long term corrective pattern, at least until a firm break of 1.0342 resistance.
CFTC Commitments of Traders – Relentless Rally Sent Crude Oil Price to 7 Year High
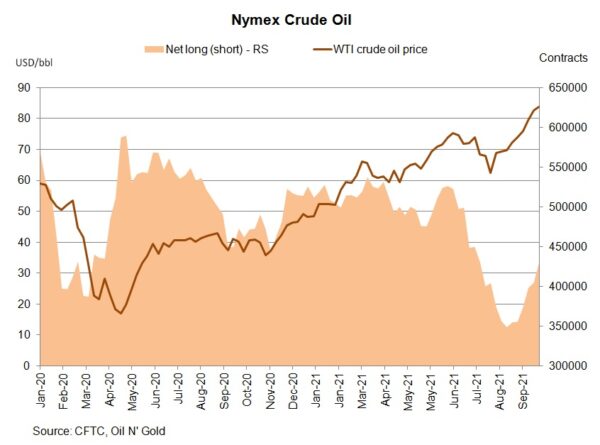
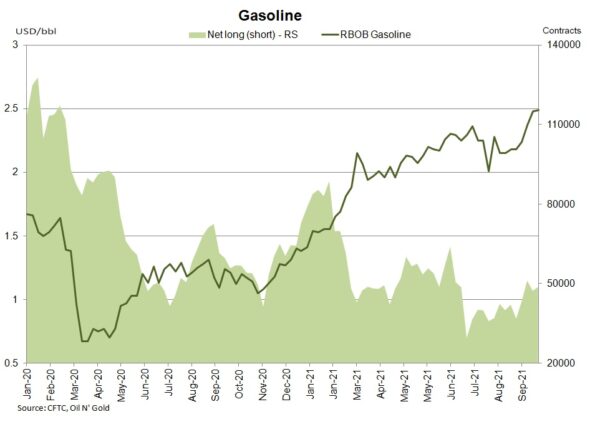
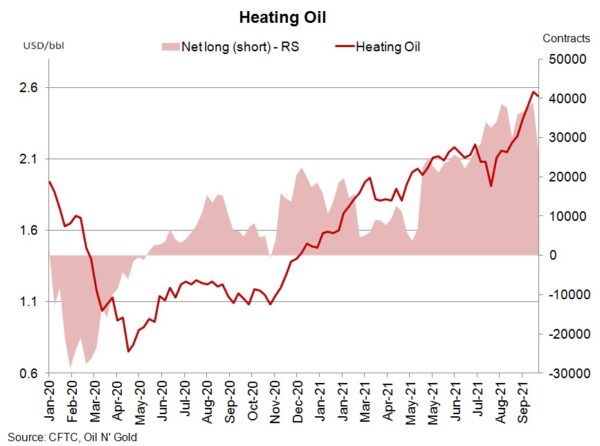
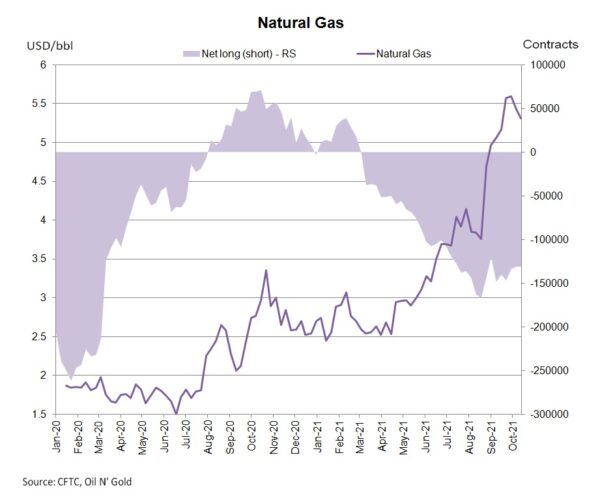
According to the CFTC Commitments of Traders report for the week ended October 19, NET LENGTH of crude oil futures jumped +24 818 contracts to 429 594. Speculative longs added +1 719 contracts but shorts plunged -23 099 contracts. The front-month WTI crude contract rallied 7 weeks in a row to a level last seen in 2014 on power shortage. For refined oil products, NET LENGTH for heating oil declined -12 696 contracts to 26 441, while that for gasoline added +1 449 contracts to 48 642. NET SHORT of natural gas futures climbed +168 contracts to 131 070 during the week.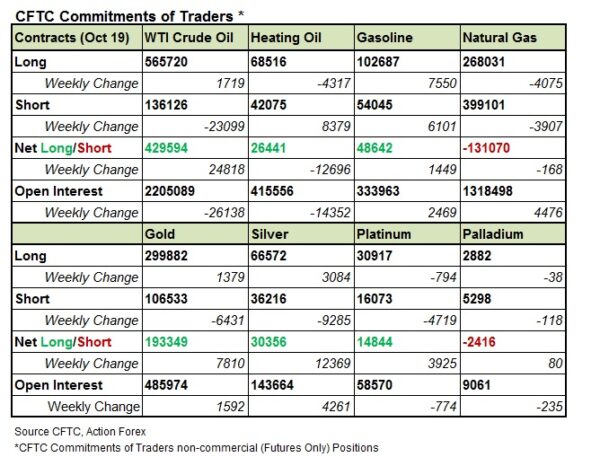
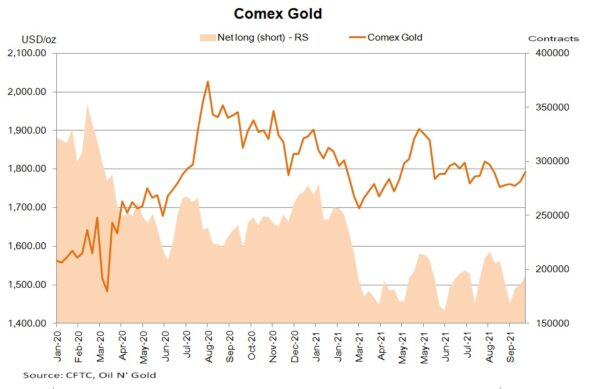
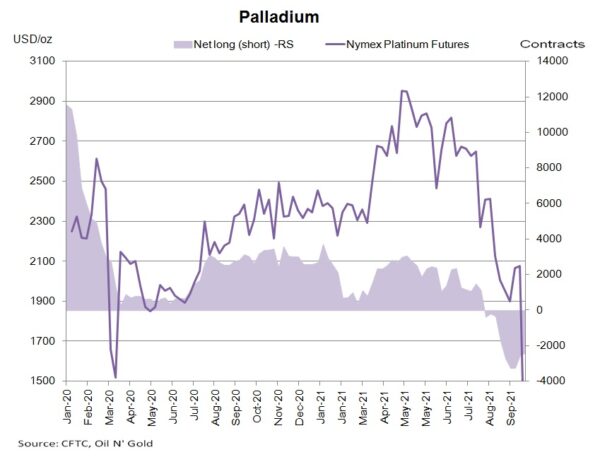
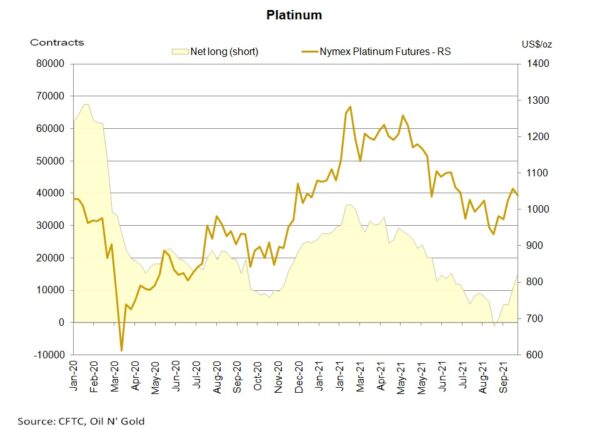
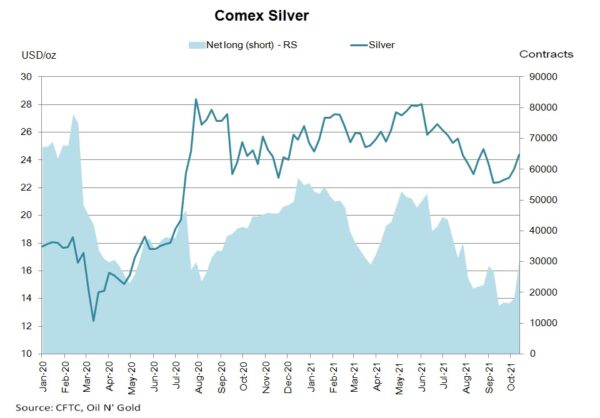
Gold futures’ NET LENGTH rose +7 810 contracts to 193 349. Silver futures’ NET LENGTH jumped +12 369 contracts to 30 356. For PGMs, NET LENGTH of Nymex platinum futures gained +3 925 contracts to 14 844, while NET SHORT for palladium futures slipped -80 contracts to 2 416.