

Sample Category Title
AUDUSD Bounces Off 1-Month Low Below 0.72
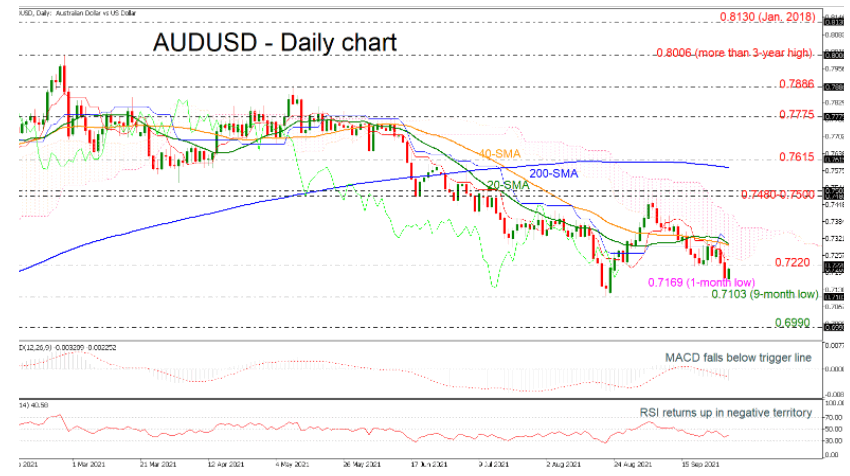
AUDUSD has been underperforming in the past two days, diving to a one-month low of 0.7172 and remaining below the Ichimoku cloud and the short-term simple moving averages (SMAs). However, today, the price is ticking up again with the RSI mirroring this latest movement. The MACD is still moving downwards with strong momentum beneath its trigger and zero lines.
The next target to the downside is the nine-month low of 0.7103. At this stage the market would likely a resumption of the downtrend from the 0.7886 peak and put in place a lower low at 0.6990.
Upside moves are likely to find resistance at the 20- and 40-day SMAs around the 0.7300 psychological mark. There is an important zone between 0.7480 and 0.7500 so, rising above this area would help shift the focus to the upside towards the 200-day SMA at 0.7590. Breaking this level could see a re-test of the 0.7615 high and turn the bias to neutral.
In the short-term, the bearish phase remains in play, especially if prices continue to trade below the SMAs and the 0.7220 barrier. In the bigger picture, the market is neutral to bearish as long as the 0.7103 level holds.
USD/CAD Daily Outlook
Daily Pivots: (S1) 1.2693; (P) 1.2734; (R1) 1.2798; More...
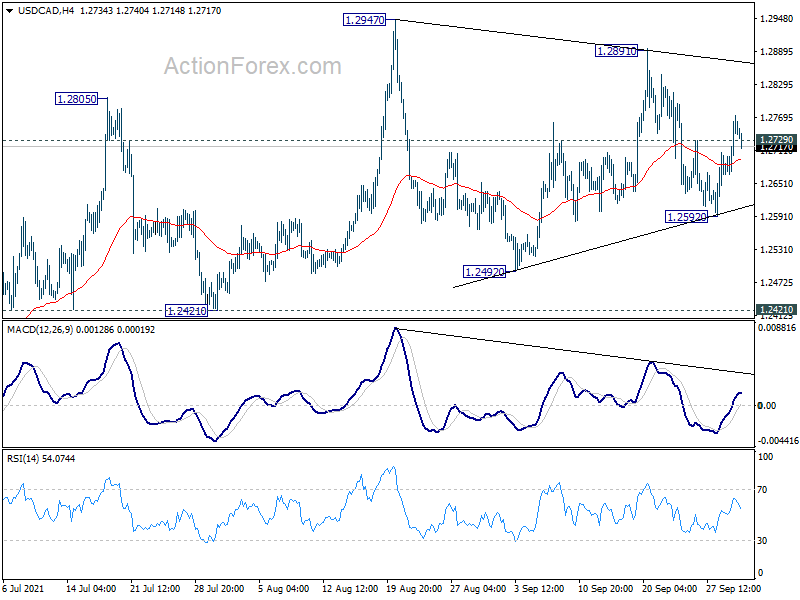
Intraday bias in USD/CAD is turned back to the upside with break of 1.2729. Further rise would be seen back to 1.2891 resistance first. On the downside, break of 1.2592 support will extend the fall from 1.2891, as the third leg of the pattern from 1.2947, to 1.2492 and possibly below. Overall, with 1.2421 support intact, rise from 1.2005 should still be in progress for another rally through 1.2947 at a later stage.
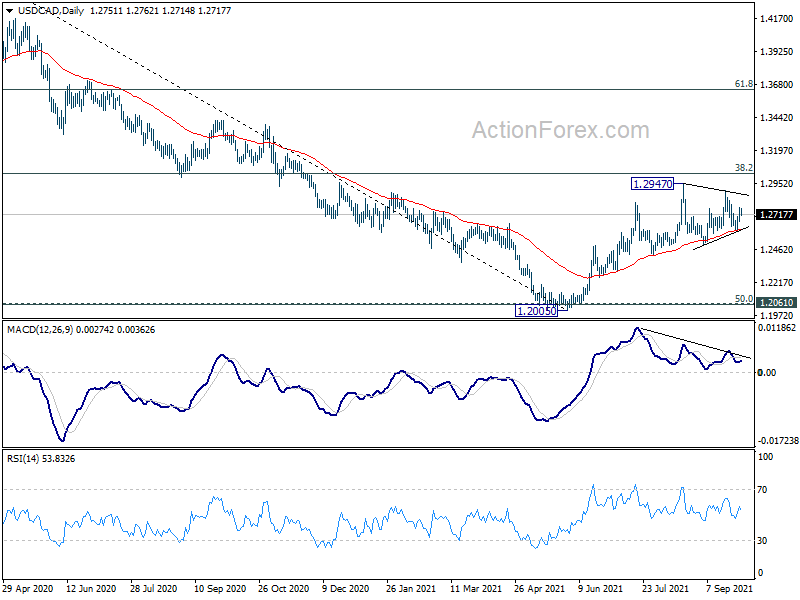
In the bigger picture, fall from 1.4667 is seen as the third leg of the corrective pattern from 1.4689 (2016 high). It should have completed after hitting 1.2061 (2017 low) and 50% retracement of 0.9406 to 1.4689 at 1.2048. Sustained break of 38.2% retracement of 1.4667 to 1.2005 at 1.3022 will pave the way to 61.8% retracement at 1.3650 and above. Overall, medium term outlook remains neutral at worst with 1.2048/61 support zone intact.
US Oil Seeks Support
WTI crude dipped after the EIA reported an increase in US inventories.
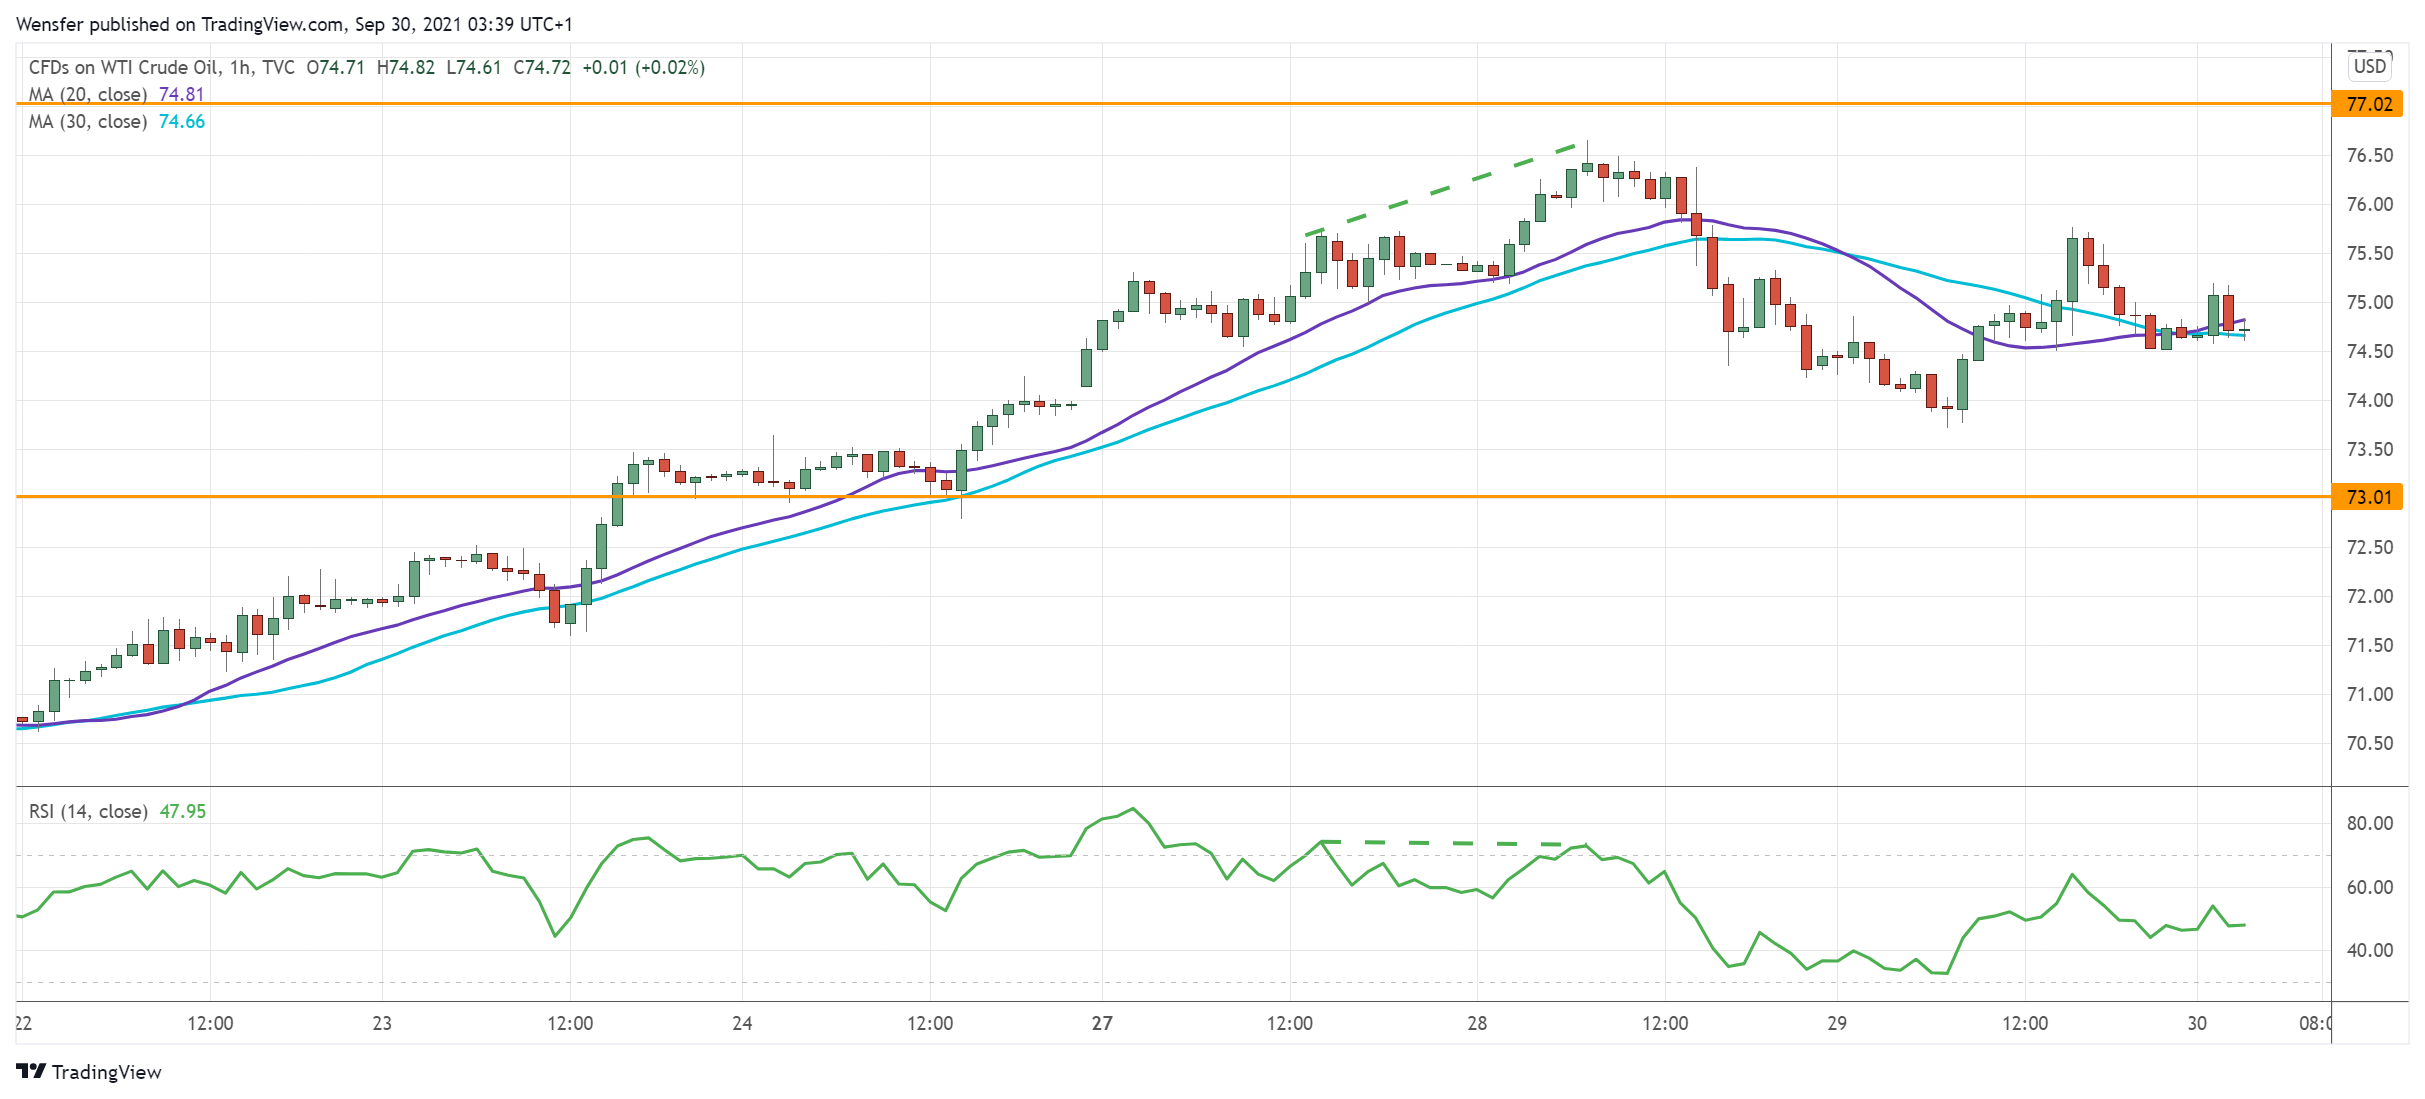
The rally has met stiff selling pressure near July’s high (77.00). The RSI’s bearish divergence signaled a halt in the upward momentum.
Then a combination of profit-taking and fresh selling has pushed the price below the first support at 75.20. A bearish MA cross also points to a U-turn.
A pullback is necessary to let the bulls catch their breath. The resistance-turned-support at 73.00 would be a key level to keep the sentiment unscathed.
NAS 100 Tests Crucial Support
The Nasdaq 100 tumbles as surging bond yields weigh on growth stocks.
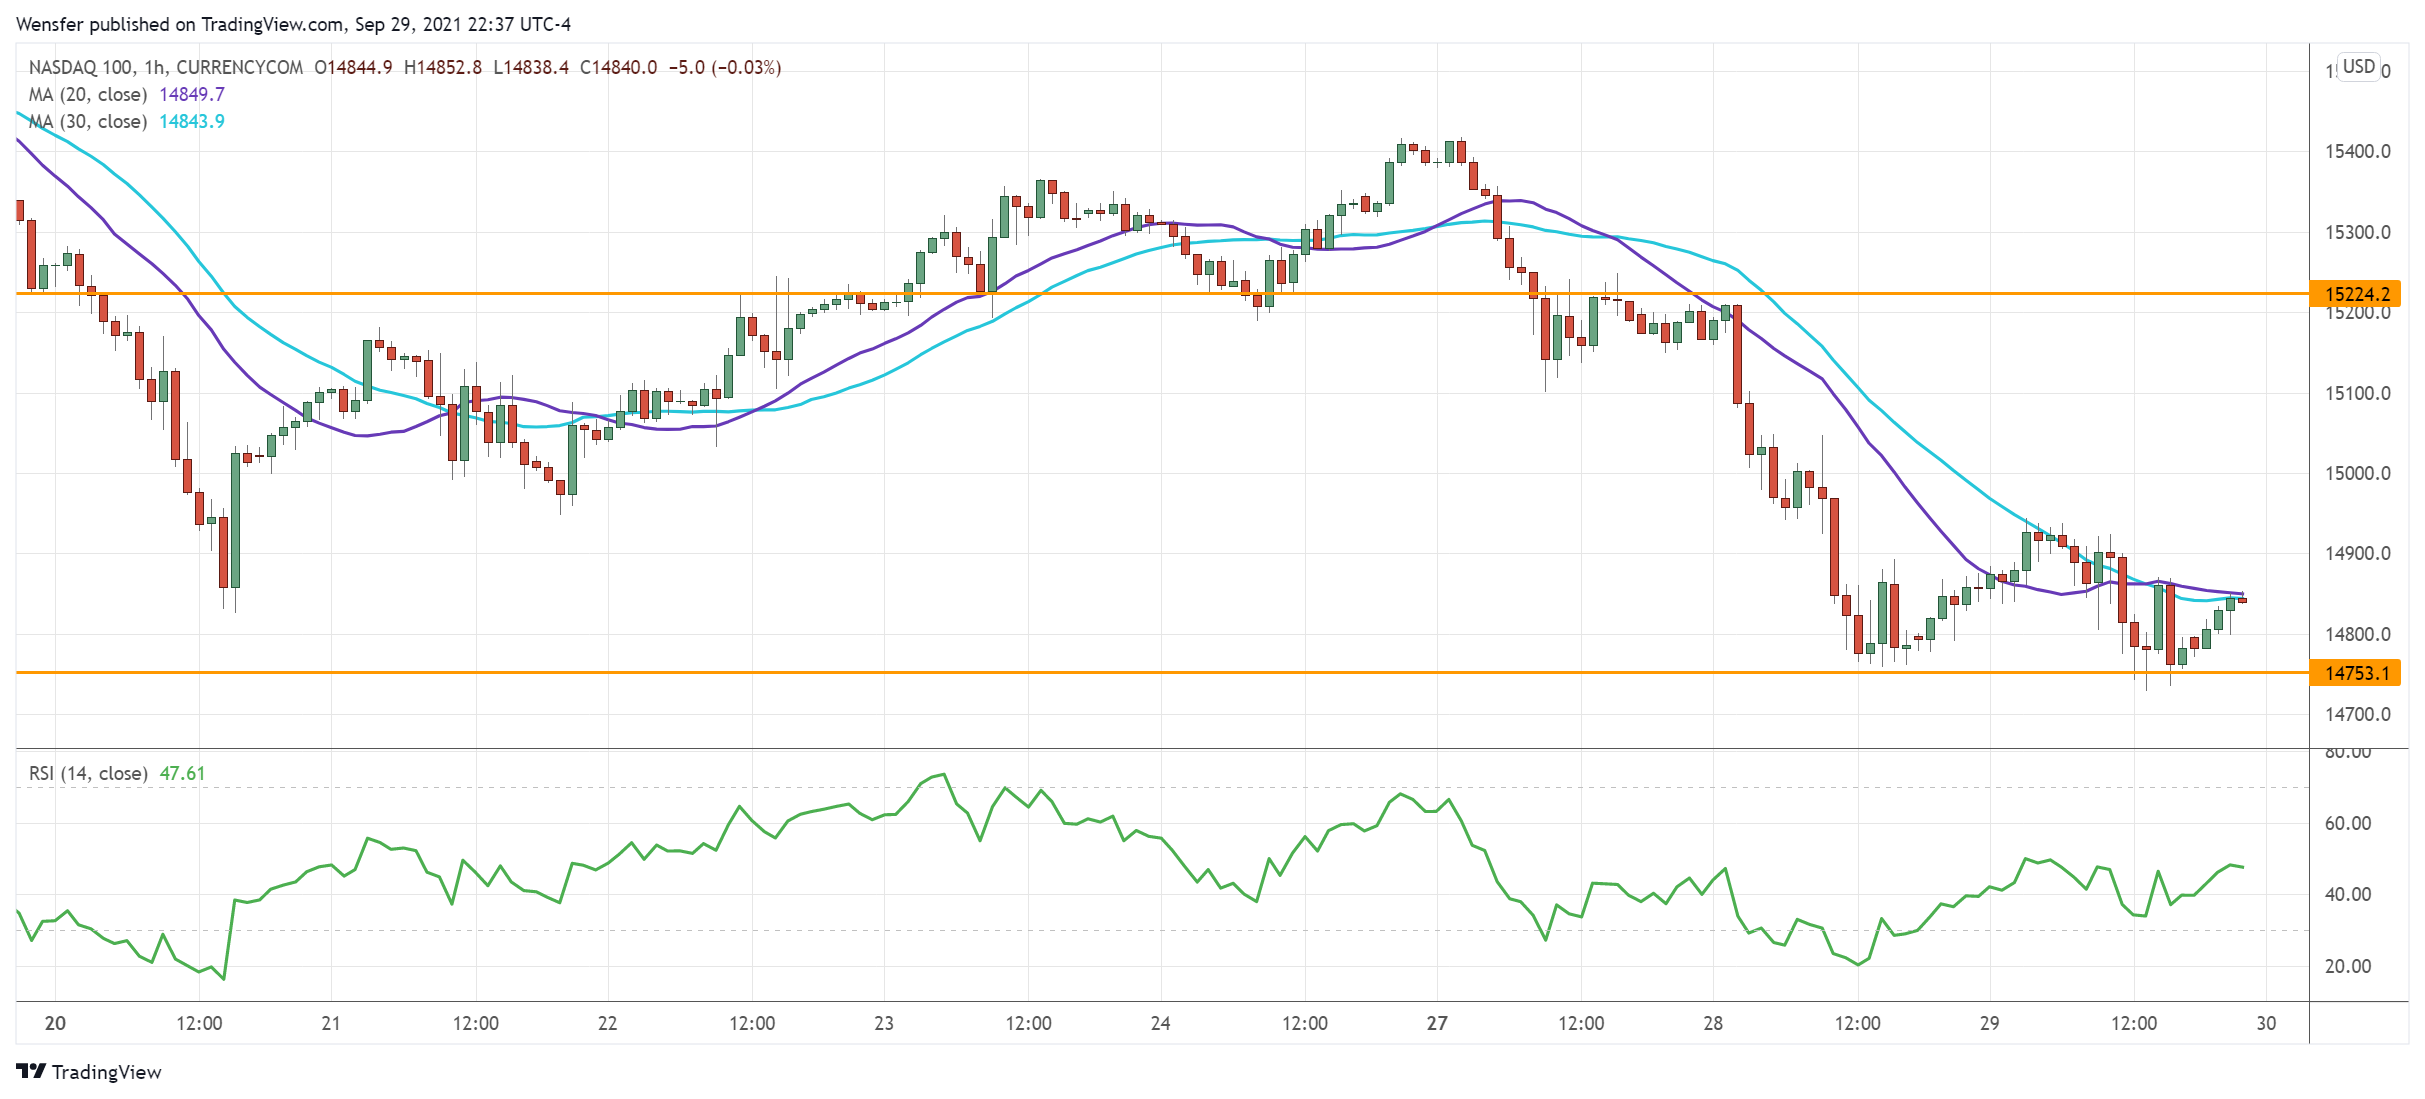
The retest of the demand zone around 14750 from the daily chart has put the bulls under pressure. The break below 14850 has invalidated last week’s rebound, raising the odds for another round of sell-off.
The RSI’s double-dip into the oversold area has offered some temporary respite. However, unless buyers can lift 15220, a rebound would be an opportunity to sell. Below the said critical floor, the index could be vulnerable to a plunge towards 14500.
GBP/USD Turns Bearish
The sterling struggles to stabilize as the UK braces for a fuel supply shock.
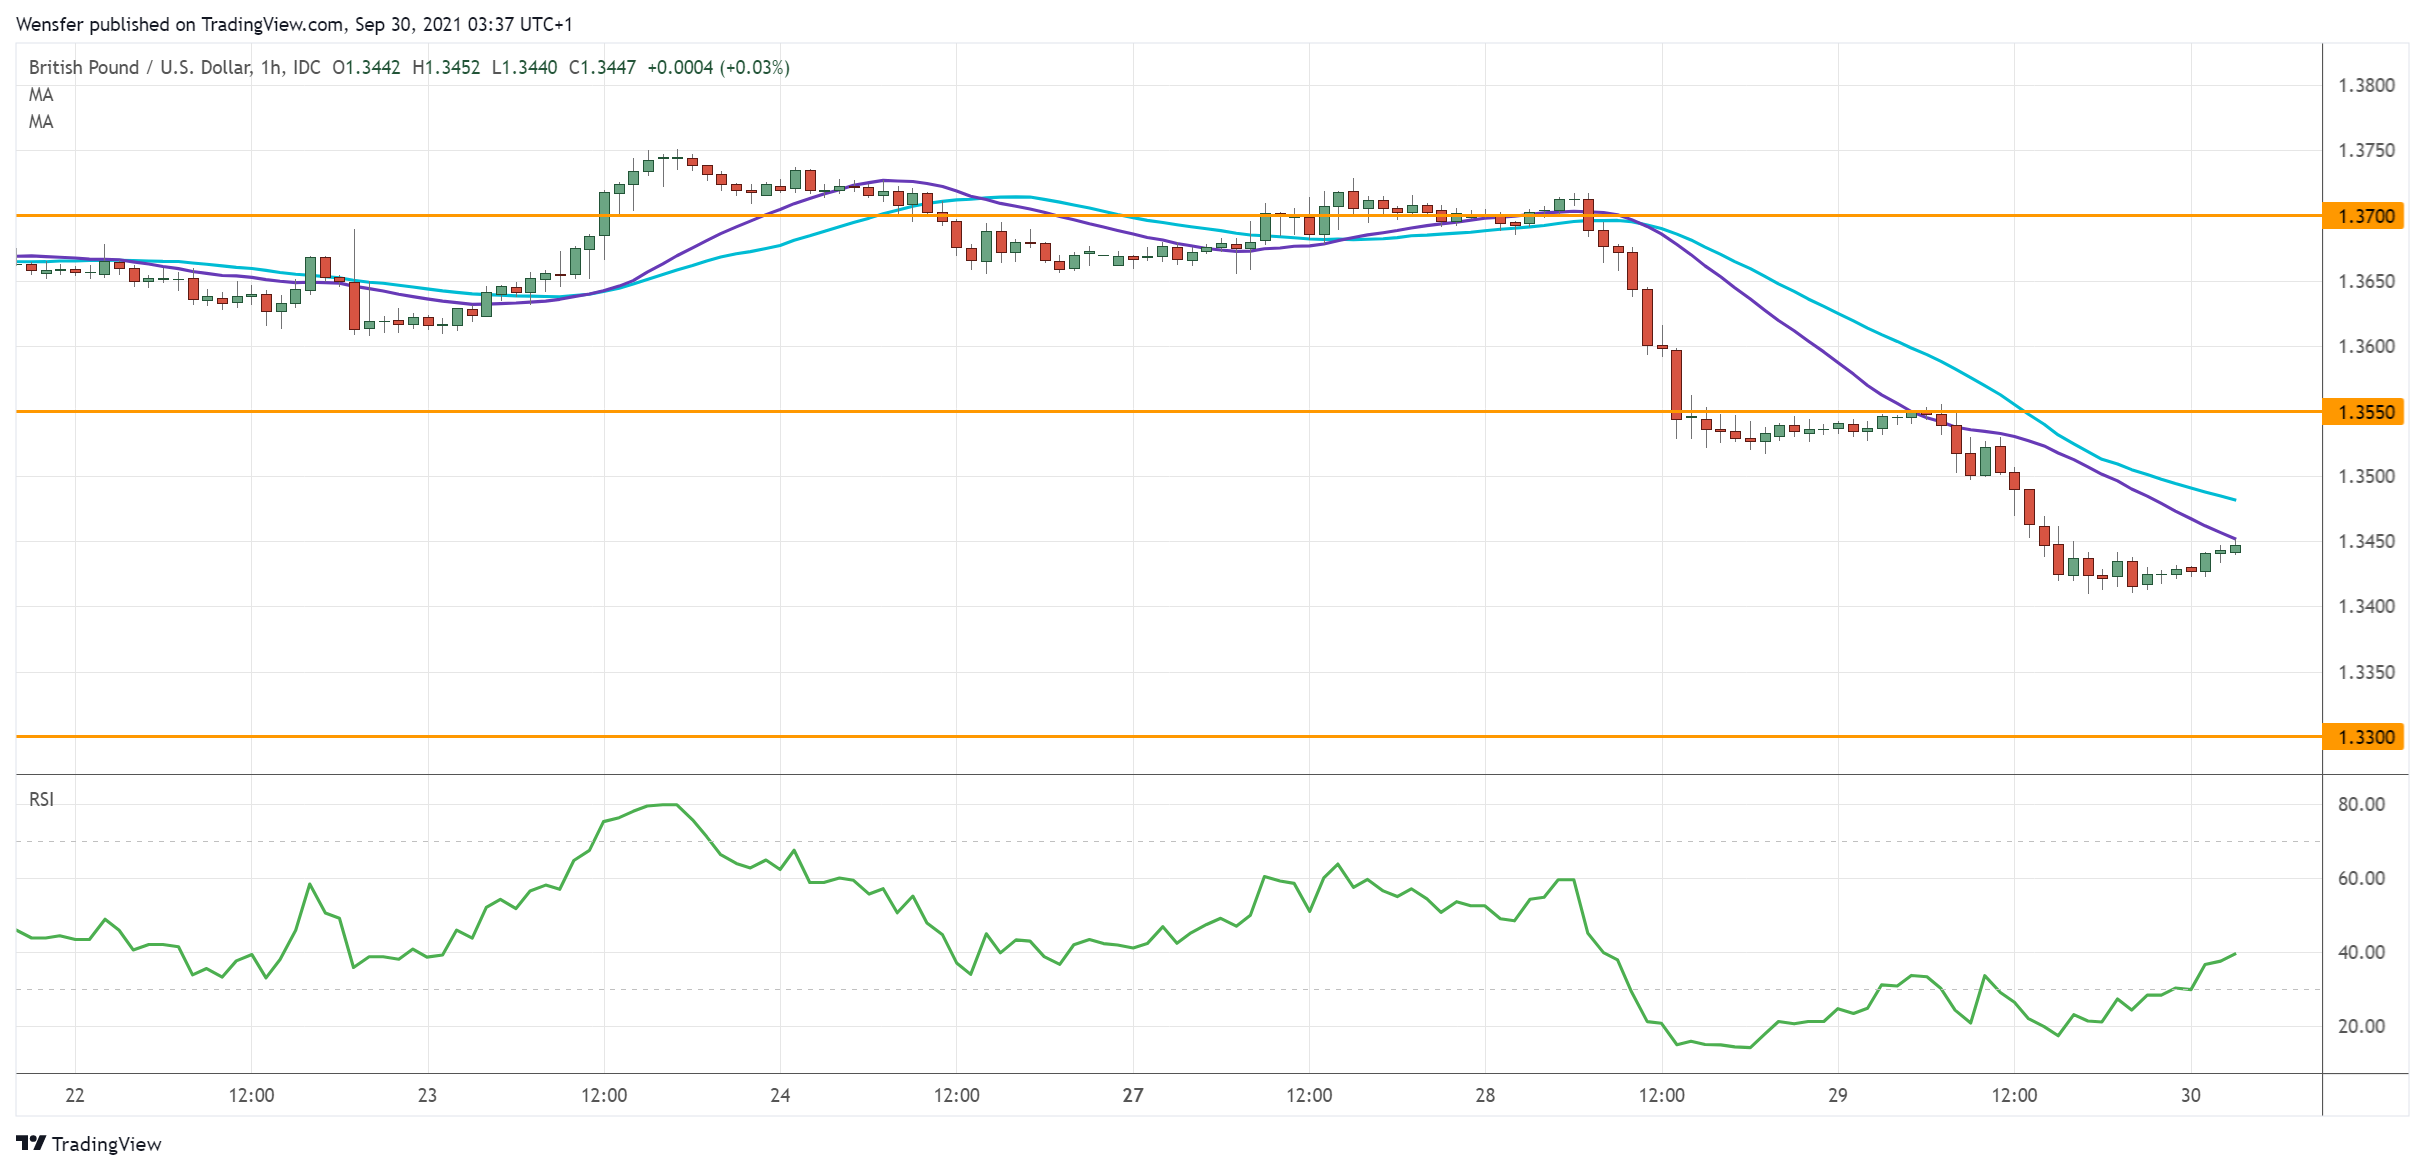
After three months of sideways action, the break below the daily support at 1.3600 could be the confirmation that the pound has sunk into a downtrend.
Strong momentum suggests that those who bought the dips had to bail out. 1.3300 is the next target.
A deeply oversold RSI would cause a limited rebound when short-term sellers take profit. 1.3550 is likely to cap the bounce with bears waiting to sell into strength.
AUD/USD Daily Report
Daily Pivots: (S1) 0.7142; (P) 0.7203; (R1) 0.7236; More...
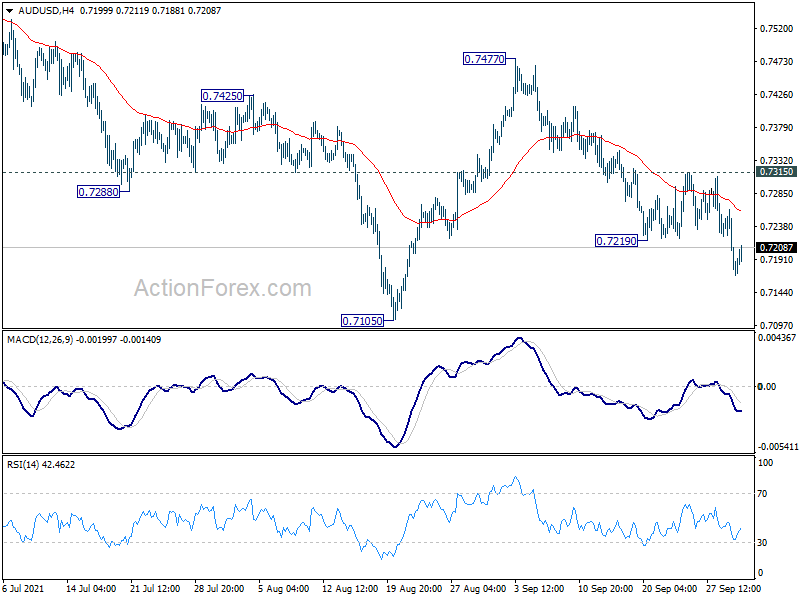
AUD/USD's fall from 0.7477 resumes by breaking 0.7219 temporary low. Intraday bias is back on the downside for retesting 0.7105 low. Firm break there will resume whole decline from 0.8006 for 0.6991 support next. On the upside, break of 0.7315 resistance will turn bias back to the upside for 0.7477 resistance instead.
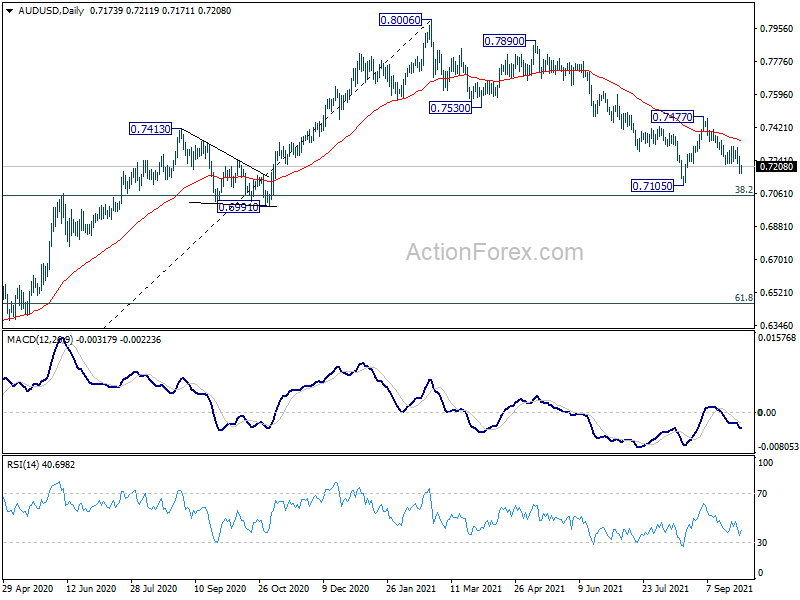
In the bigger picture, with 0.6991 cluster support (38.2% retracement of 0.5506 to 0.8006 at 0.7051) intact, we're seeing price action from 0.8006 as a correction only. That is, up trend from 0.5506 low would resume after the correction completes. In that case, main focus will be 0.8135 key resistance (2018 high). Sustained break there will carry larger bullish implications. However, sustained break of 0.6991 will argue that the whole medium term trend has indeed reversed.
EUR/USD Daily Outlook
Daily Pivots: (S1) 1.1560; (P) 1.1625; (R1) 1.1661; More...
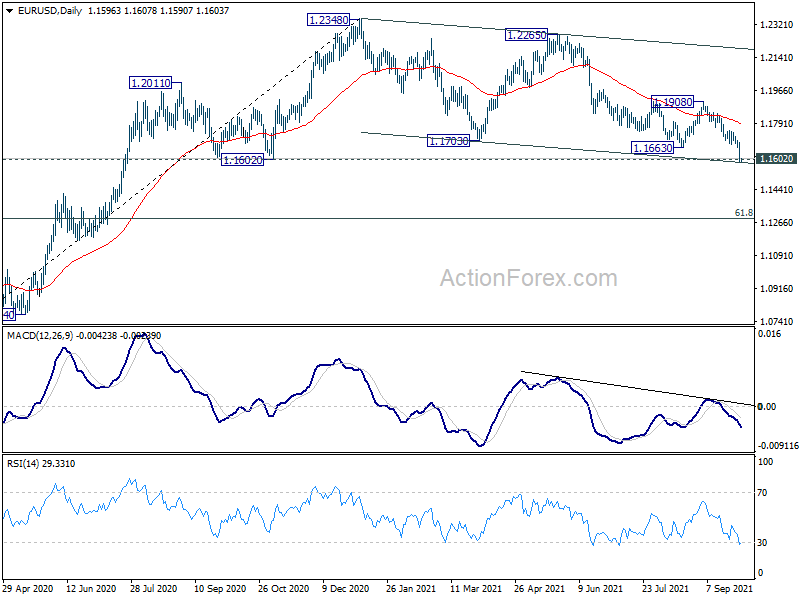
EUR/USD's fall continues today and reaches as low as 1.1588 so far. Sustained break trading below there will argue that it's at least in a deeper correction to rise from 1.0635 and target 1.1289 medium term fibonacci level. On the upside, above 1.1683 minor resistance will turn intraday bias neutral and bring consolidations first. But risk will stay on the downside as long as 1.1908 resistance holds.
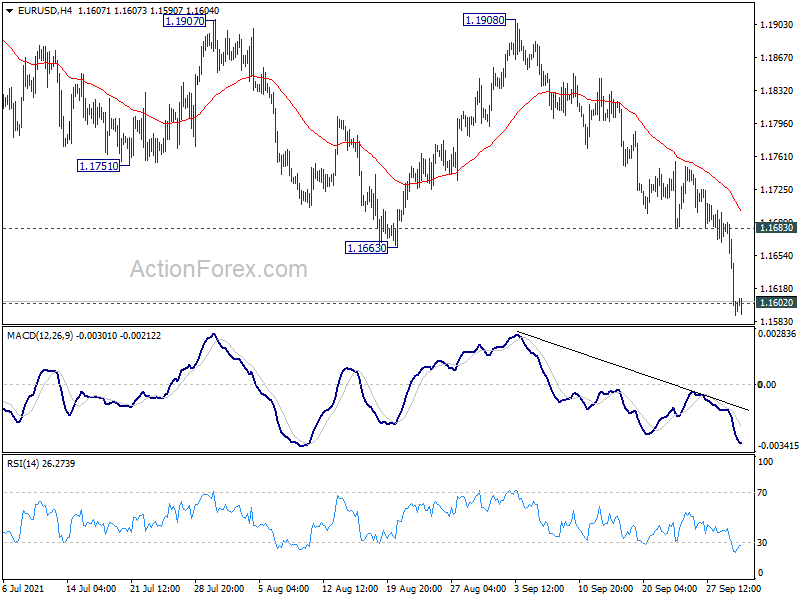
In the bigger picture, sustained break of 1.1602 will argue that rise from 1.0635 (2020 low) has completed at 1.2348. Deeper fall would be seen to 61.8% retracement of 1.0635 to 1.2348 at 1.1289. Note also that the firm break of 55 week EMA (1.1830) also carries medium term bearish implication. Firm break of 1.1289 will pave the way to retest 1.0635 low. On the upside, though, break of 1.1908 resistance will revive medium term bullishness and turn focus back to 1.2348 high.
GBP/USD Daily Outlook
Daily Pivots: (S1) 1.3373; (P) 1.3464; (R1) 1.3516; More...
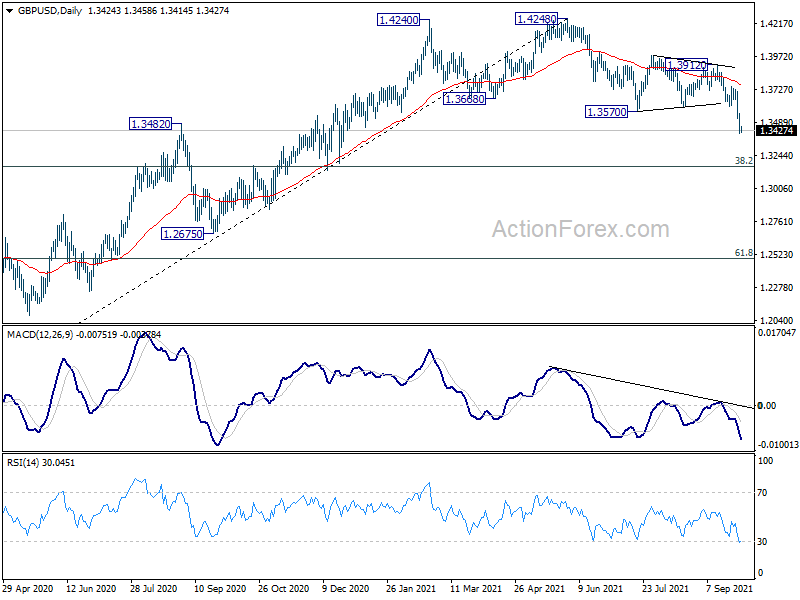
Intraday bias in GBP/USD remains on the downside at this point. Current fall from 1.4248 is in progress for 1.3163 medium term fibonacci level next. On the upside, above 1.3554 minor resistance will turn intraday bias neutral and bring consolidation, before staging another decline.
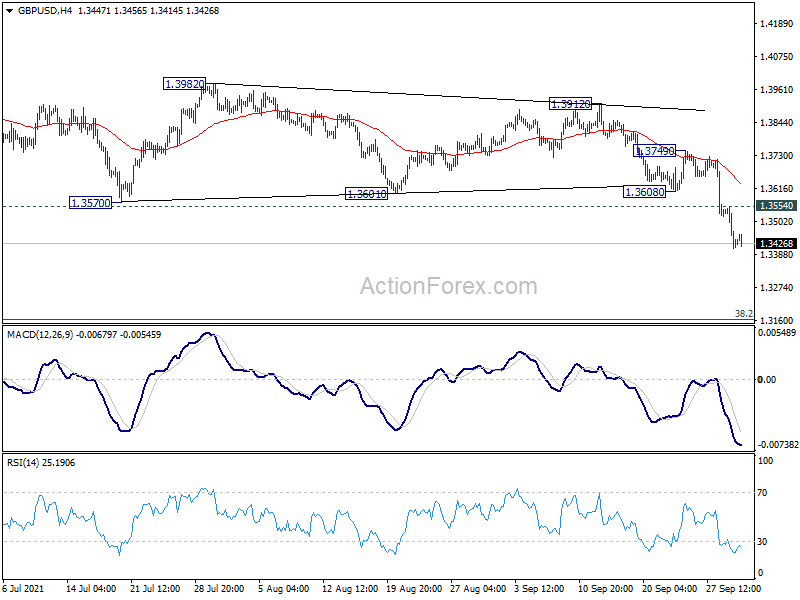
In the bigger picture, fall from 1.4248 is at least a correction to the up trend from 1.1409 (2020 low). Such correction could extend to 38.2% retracement of 1.1409 to 1.4248 at 1.3164 before completion. However, considering the rejection by 1.4376 key resistance (2018 high), sustained trading below 1.3164 will argue that it's indeed a bearish trend reversal and would target 61.8% retracement at 1.2493. Nevertheless, break of 1.3912 resistance will revive medium term bullishness and target 1.4248/4376 resistance zone again.
USD/CHF Daily Outlook
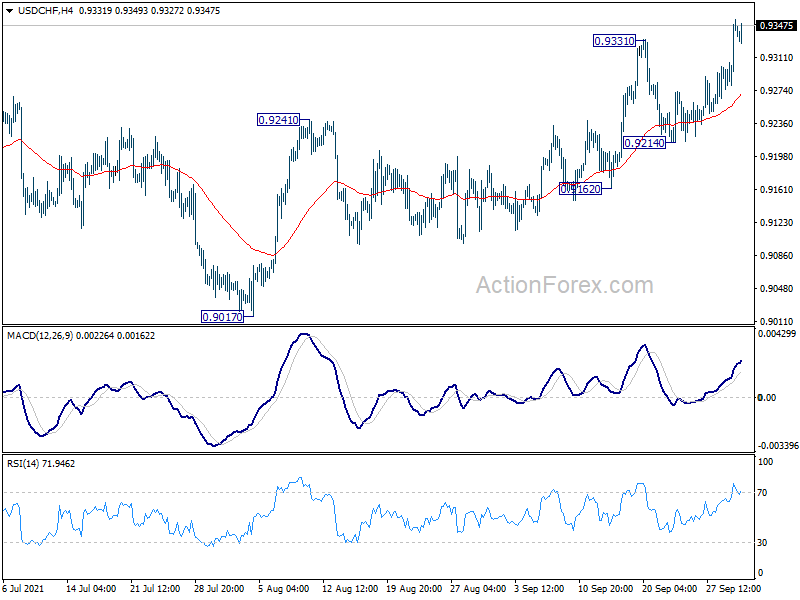
Daily Pivots: (S1) 0.9300; (P) 0.9327; (R1) 0.9375; More....
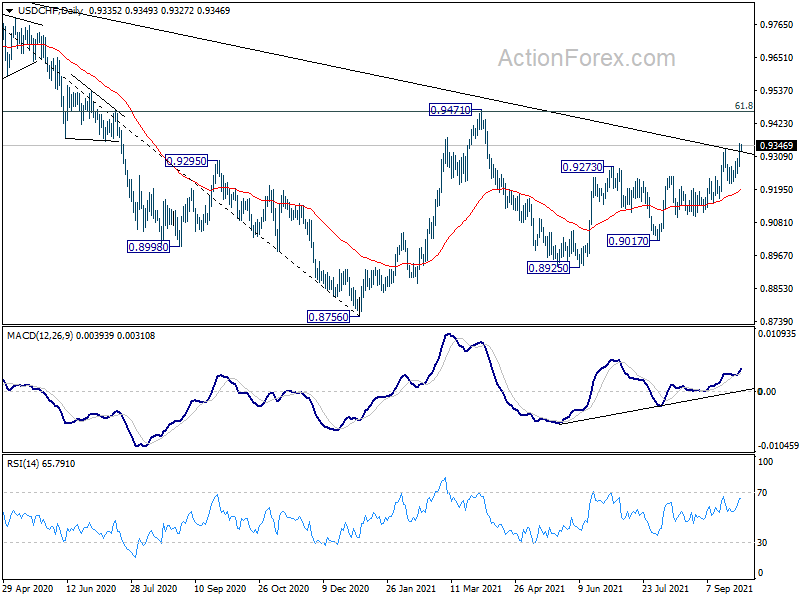
USD/CHF's rally resumes by taking out 0.9331 resistance and intraday bias is back on the upside. Rise from 0.8925 is in progress for 0.9471 resistance. Sustained break there will carry larger bullish implications. For now, further rally will remain in favor as long as 0.9214 support holds, in case of retreat.
In the bigger picture, the strong rally above 55 week EMA (now at 0.9190) now tilts favor to the case of bullish trend reversal. That is, decline from 1.3042 (2016 high) is probably completed at 0.8756 already. Sustained break of 0.9471 resistance should confirm this case and pave the way to retest 1.0342 ahead. However, rejection by 0.9471 will mix up the outlook again and retain some medium term bearishness.
Fuel Price Spike Boosts Dollar’s Shine
One by one, Dollar bulls beat out stops in one key currency pair, taking the US currency to multi-month highs. The dollar index climbed to a high of precisely one year, reaching 94.4 by advancing against its main rivals, the Euro and Yen. At the same time, the pressure on the Pound is still in place.
Over Wednesday, the Euro lost 0.8% against the Dollar, briefly falling under 1.1600, its lowest since July 2020. The decisive break of established ranges with a lower bound near 1.1700 indicates the seriousness of dollar buyers' after a prolonged consolidation at 1.16–1.22 since the middle of last year. Lacking significant technical headwinds, the Euro may slide rather quickly towards 1.12–1.14, where we saw the previous tug-of-war between the bulls and the bears last June and July. The bears might aim at 1.07-1.10, which received methodical buyers' demand at the beginning of last year.
The British Pound remained under increased pressure on Wednesday after a more than 1% plunge the day before. On Thursday morning, GBPUSD is trying to claw its way to levels near 1.3440. By pulling back to this level, sterling has given up half of its gains against the Dollar from last September's rally to this year's February and June peaks. However, a move out of the sustainable range opens a straight path for GBPUSD into the 1.3000 area over the next couple of months.
In addition, against the Japanese currency, the Dollar rose to 112 at one point. From these levels, the pair has repeatedly reversed to the downside since early 2019, trading higher for only a few hours. The chances of the bulls consolidating above that mark this time will be higher if the stock markets manage to separate the Dollar's rise from the flight from risky assets.
Yesterday they did, and key US stock indices managed to claw their way into rising territory in a desperate attempt, despite a sharp strengthening of the Dollar – a scarce and shaky combination.
Apart from technical factors and the triggering of stop orders outside of established ranges, fundamentally, the Euro, Pound and yen are also under pressure from the softer stance of national central banks relative to the Fed.
In addition, in the eurozone, the UK and Japan, we expect import costs to rise sharply due to a jump in energy prices. This could also have a noticeable negative impact on business and consumer activity in the coming months, further pushing back the central bank's policy normalisation plans. At the same time, the US imports energy to a much lesser extent and a jump in oil and gas prices promises to spur drilling activity.