Sample Category Title
AUD/JPY Bounces Off Support
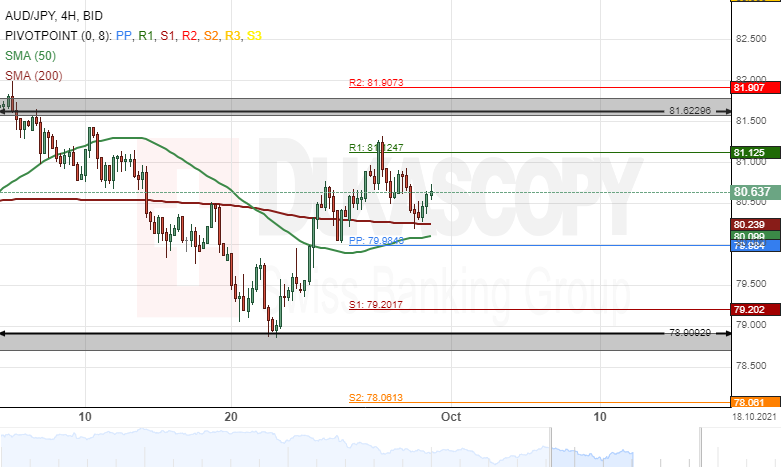
The Australian Dollar edged higher by 2.90% against the Japanese Yen since September 22. The currency pair breached the 50– and 200– period SMAs during this week's trading sessions.
All things being equal, the exchange rate could continue to surge during the following trading sessions. The potential target for the AUD/JPY pair would be near the 83.50 level.
However, the currency exchange rate could encounter resistance at 81.62 could in the nearest future.
Gold Analysis: Is Pushed Down By SMA
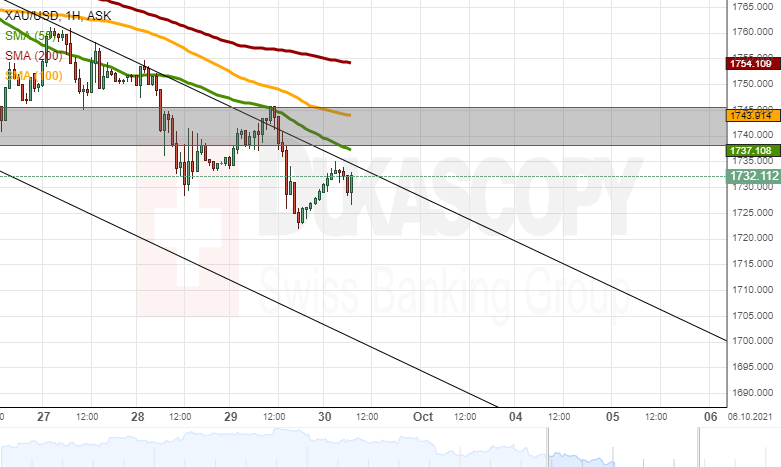
The yellow metal pierced the upper trend line of the channel down pattern on Wednesday. However, the 55-hour simple moving average almost immediately provided resistance and caused a drop of the metal's price. The drop shortly reached below the 1,725.00 before the price began to recover.
On Thursday, the bullion retraced back to the previously pierced upper trend line of the channel down pattern. It appeared by mid-day that the price had resumed to respect the channel's borders.
In the case of a surge, the bullion would test the upper trend line of the channel down pattern and the 55-hour simple moving average near 1,735.00. Above the 1,735.00 level, the 100-hour SMA could provide resistance near 1,740.00.
Meanwhile, a potential decline of the commodity price would find support in round price levels, as it had done throughout this week.
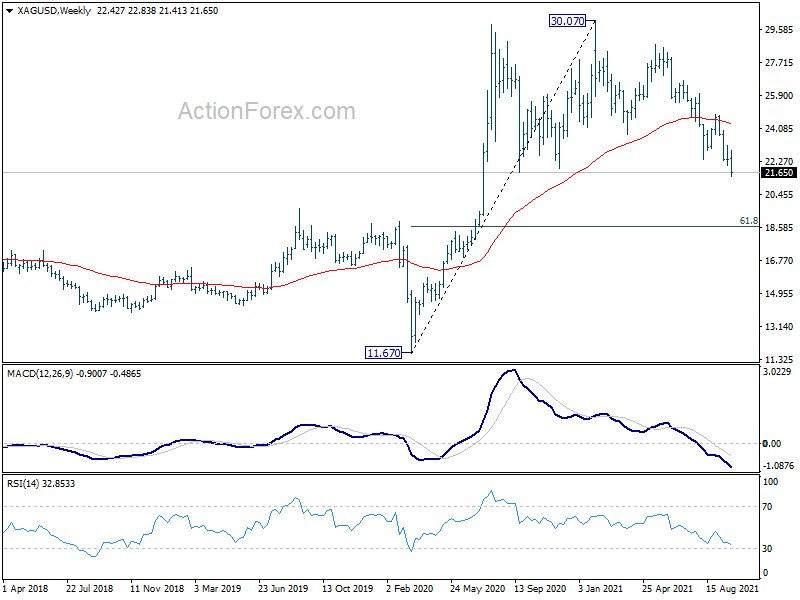
Silver’s down trend continues, targeting 20.92 projection level
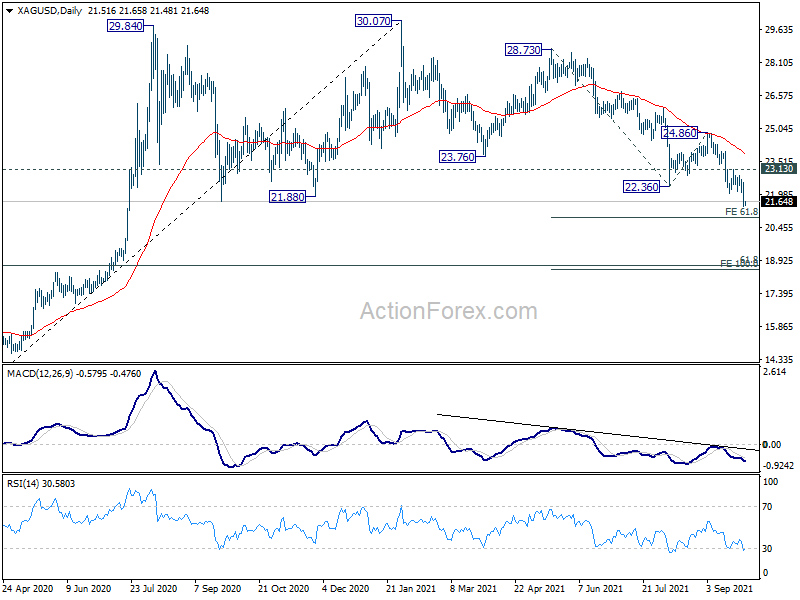
Silver's down trend resumes this week and hits as low as 21.41 so far. The larger down trend from 30.07 is in progress for 61.8% projection of 28.73 to 22.36 from 24.86 at 20.92 next. Also prior rejection both 55 day and 55 week EMA affirmed near term and medium term bearishness. Firm break of 20.92 will target 61.8% retracement of 11.67 to 30.07 at 18.69 before completing the current down trend.
Meanwhile, break of 23.13 resistance is needed to be the first sign of short term bottoming. Otherwise, outlook will stay bearish in case of recovery.
USD/JPY Analysis: Finds Support In SMA
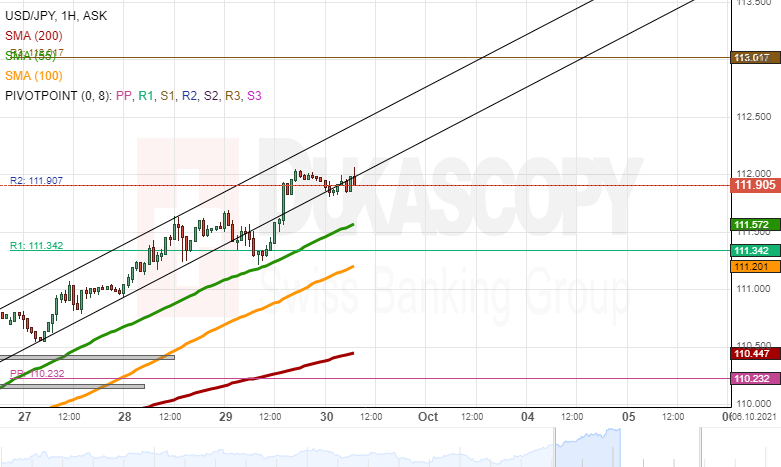
After breaking the channel up pattern, the USD/JPY declined. However, the decline was short, as the pair found support in the 55-hour simple moving average. The SMA provided enough support to cause a surge, which reached the 112.00 level.
By the middle of Thursday's trading, the currency exchange rate fluctuated sideways below the 112.00 mark.
In the near term future, the sideways trading could be ended by the approaching support of the 55-hour simple moving average. A surge above the 112.00 level would have no technical resistance as high as the weekly R3 simple pivot point at 113.02. Meanwhile, note that the 112.50 and 113.00 levels were highly likely going to provide resistance.
On the other hand, a bounce off from the resistance of the 112.00 level and a decline would have to pass the support of the 55-hour SMA at 111.57, the weekly R1 simple pivot point at 111.34 and the 100-hour SMA at 111.20.
GBP/USD Analysis: Extends Decline
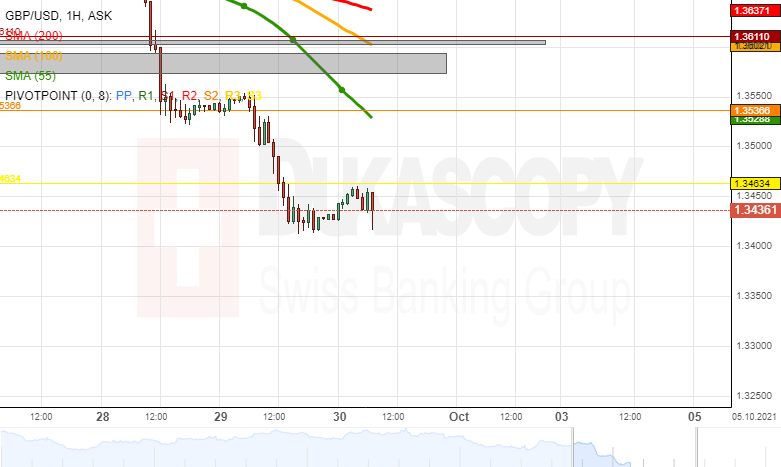
The decline of the GBP/USD eventually stopped on Wednesday. Namely, the rate found support in the 1.3415 level and retraced back up to the weekly S3 simple pivot point at 1.3463. Up to early hours of Thursday's trading, the pair fluctuated sideways in the 1.3415/1.3463 zone.
In theory, the rate should continue to decline, as it has no technical or historical price support levels close by. However, take into account that round exchange rate levels like the 1.3400, 1.3350 and 1.3300 could provide support and stop a decline.
On the other hand, the GBP/USD can be considered oversold, as it has left far above it the hourly simple moving averages. The most close by SMA was the 55-hour SMA at the 1.3530 level. Note that a potential recovery to the SMA would face the resistance of the weekly S3 simple pivot point at 1.3463.
EUR/USD Analysis: Drops Below 1.1600
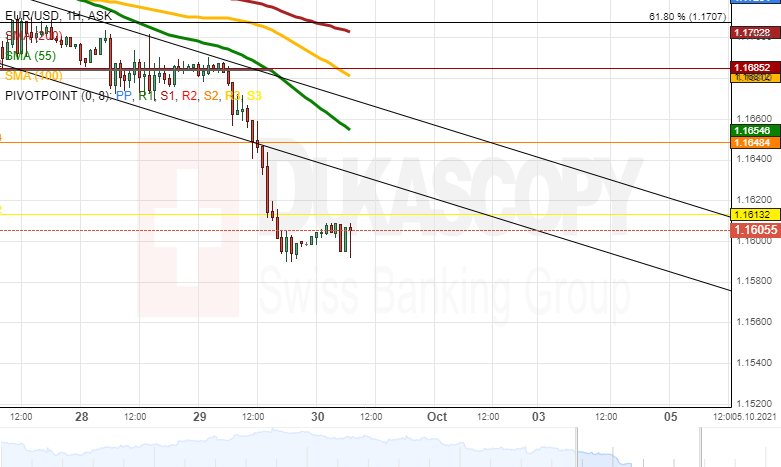
At mid-day on Wednesday, the EUR/USD plummeted, as it passed one weekly simple pivot point after another until it found support in the 1.1590 level. By Thursday's European morning hours, the rate had been consolidating by trading sideways between the 1.1590 and 1.1610 levels.
In the near term future, the rate was most likely going to decline, as it had no technical support. Due to that reason, round exchange rate levels are highly likely going to provide support. Namely, the 1.1550 and 1.1500 could stop a potential decline of the EUR/USD.
However, the rate can be considered oversold, as it has left far above it the 55, 100 and 200-hour simple moving averages. In the case of a potential recovery, the pair would face the resistance of the weekly S3 and S2 simple pivot points at 1.1613 and 1.1648.
BoJ Kuroda: Timing and pace of recovery in consumption remains highly uncertain
BoJ Governor Haruhiko Kuroda reiterated in a speech that "consumption is expected to pick up if further progress in vaccinations allow society to curb infections, while resuming economic activity."
"But the timing and pace of recovery in consumption remains highly uncertain and could change depending on how the pandemic unfolds," he added.
"We will scrutinise the impact of the pandemic on the economy and take additional easing steps without hesitation if needed," he pledged again.
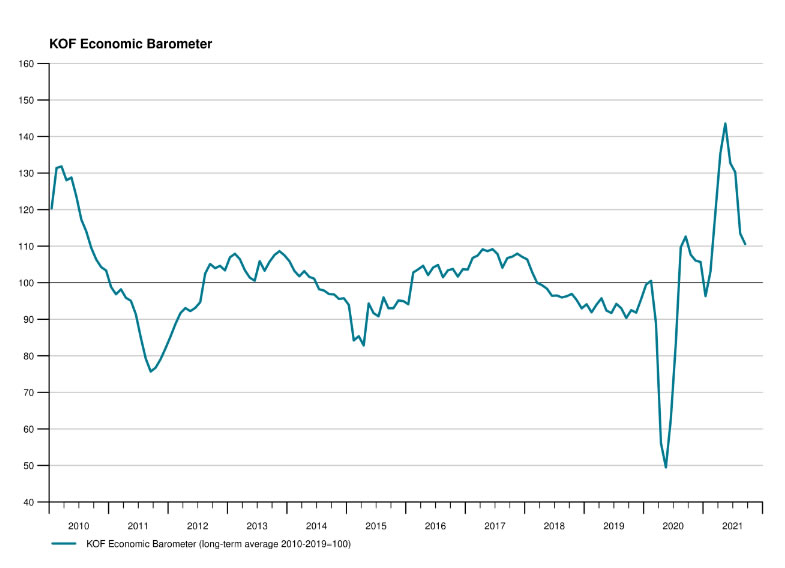
Swiss KOF dropped to 110.6 in Sep, slowdown likely to continue in coming months
Swiss KOF Economic Barometer dropped from 113.5 to 110.6 in September, slightly above expectation of 110.3. That's the fourth decline in a row. The index remains above its long-term average, but the slowing in recovery is "likely to continue in the coming months".
KOF also said: "The recurring decline is primarily attributable to bundles of indicators concerning foreign demand. Indicators of the manufacturing sector send an additional negative signal, followed by indicators of the economic sector other services. By contrast, indicators from the finance and insurance sector are providing slightly positive impulses."
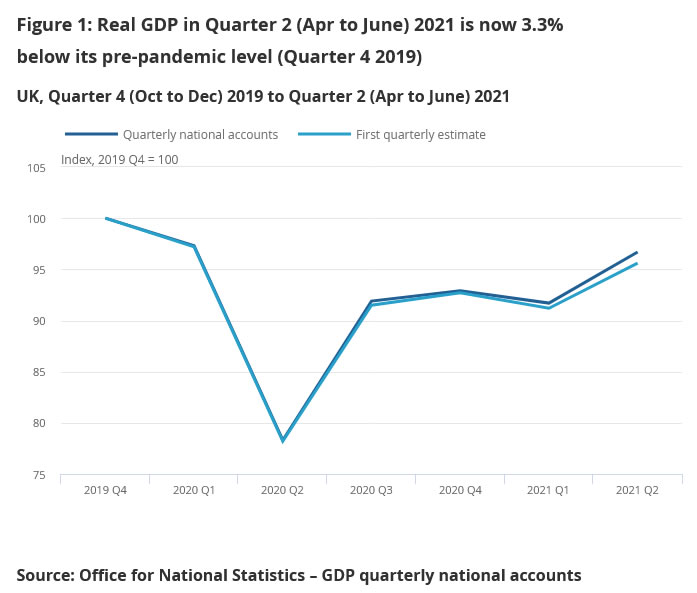
UK Q2 GDP growth finalized at 5.5% qoq, still -3.3% below pre-pandemic level
UK Q2 GDP growth was finalized at 5.5% qoq, revised up from 4.8% qoq. GDP remained -3.3% below the pre-pandemic level at Q4 2019.
In output terms, the largest contributors to this increase were from wholesale and retail trade, accommodation and food service activities, education and human health, and social work activities.
There were increases in all main components of expenditure, with the largest contribution from household consumption.
The Analytical Overview Of The Main Currency Pairs
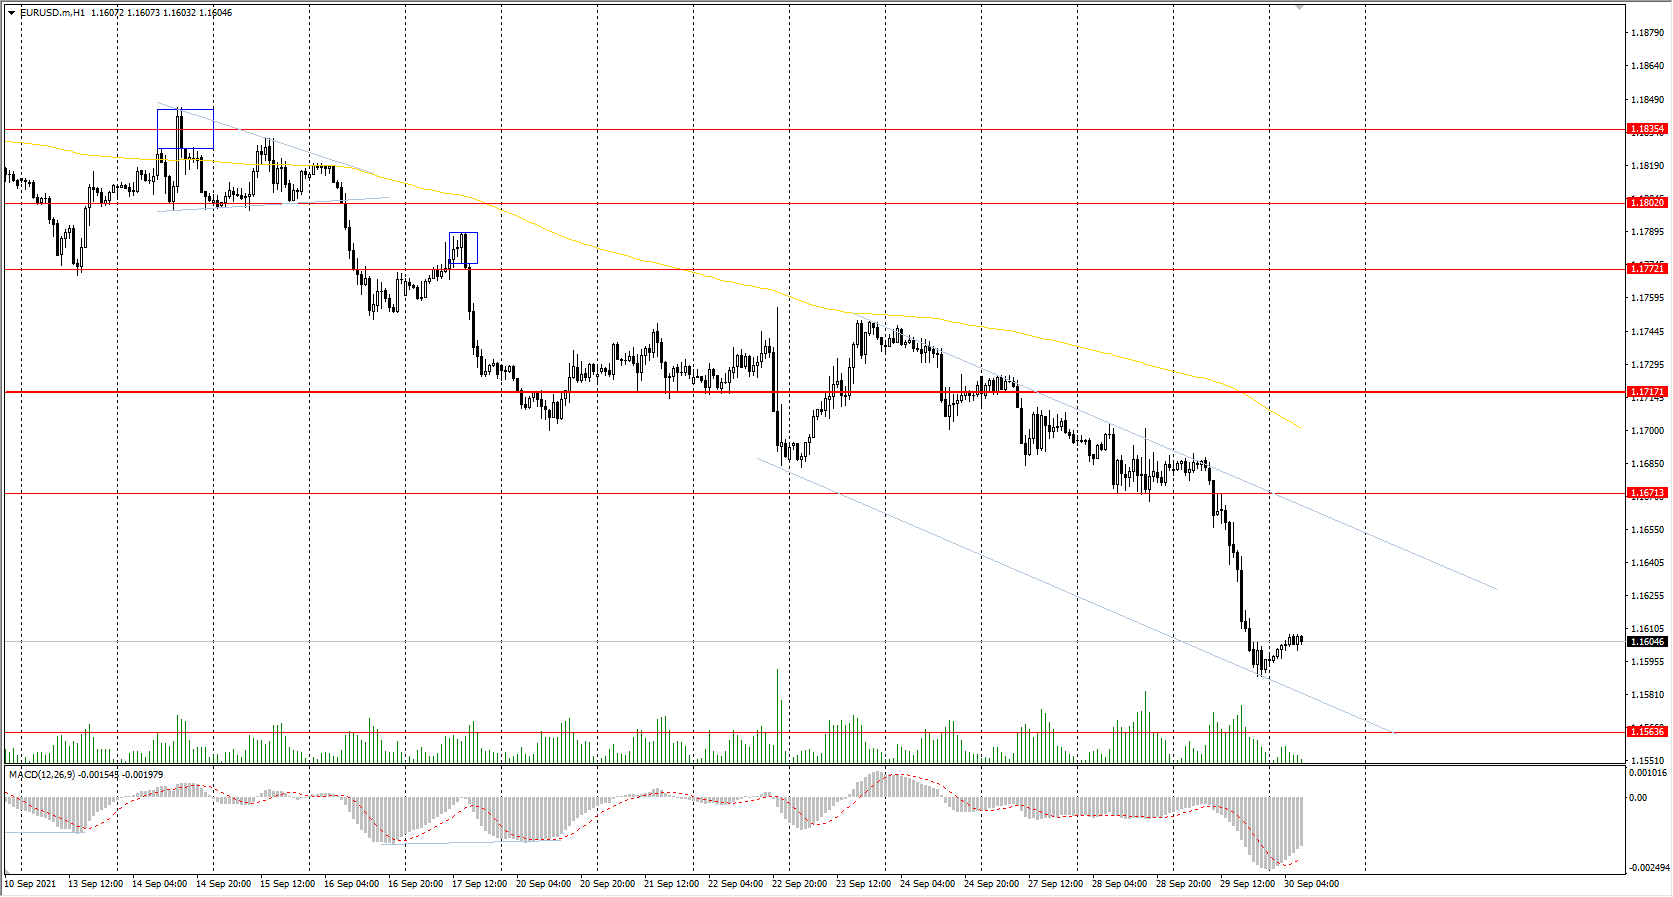
The EUR/USD currency pair
Technical indicators of the currency pair:
Prev Open: 1.1682
Prev Close: 1.1596
% chg. over the last day: -0.74%
The EUR/USD exchange rate decreased to its lowest level in 14 months as the energy crisis in Europe, caused by a sharp increase in natural gas prices, raises concerns about the strength of the economic recovery in the Eurozone and increases negative pressure on the currency.
Trading recommendations
Support levels: 1.1564, 1.1453
Resistance levels: 1.1671, 1.1717, 1.1772, 1.1802, 1.1835
From the technical point of view, the EUR/USD trend has changed to bearish. On the background of the weakness of the European currency, the quotes went down sharply. The price has broken through and consolidated below the priority change level. Under such market conditions, traders should consider sell deals from the resistance levels near the moving average, as the price has deviated strongly from the middle line. Buy trades should be considered only from the support levels with additional confirmation in the form of a buyers' initiative.
Alternative scenario: if the price breaks out through the 1.1717 resistance level and fixes above, the mid-term uptrend will likely resume.
News feed for 2021.09.30:
- German Unemployment Rate (m/m) at 10:55 (GMT+3);
- Eurozone Unemployment Rate (m/m) at 12:00 (GMT+3);
- US Initial Jobless Claims (w/w) at 15:30 (GMT+3);
- US GDP (q/q) at 15:30 (GMT+3);
- US Chicago PMI (m/m) at 16:45 (GMT+3);
- US FOMC Member Williams’s Speech at 17:00 (GMT+3);
- US FOMC Member Bostic’s Speech at 18:00 (GMT+3).
The GBP/USD currency pair
Technical indicators of the currency pair:
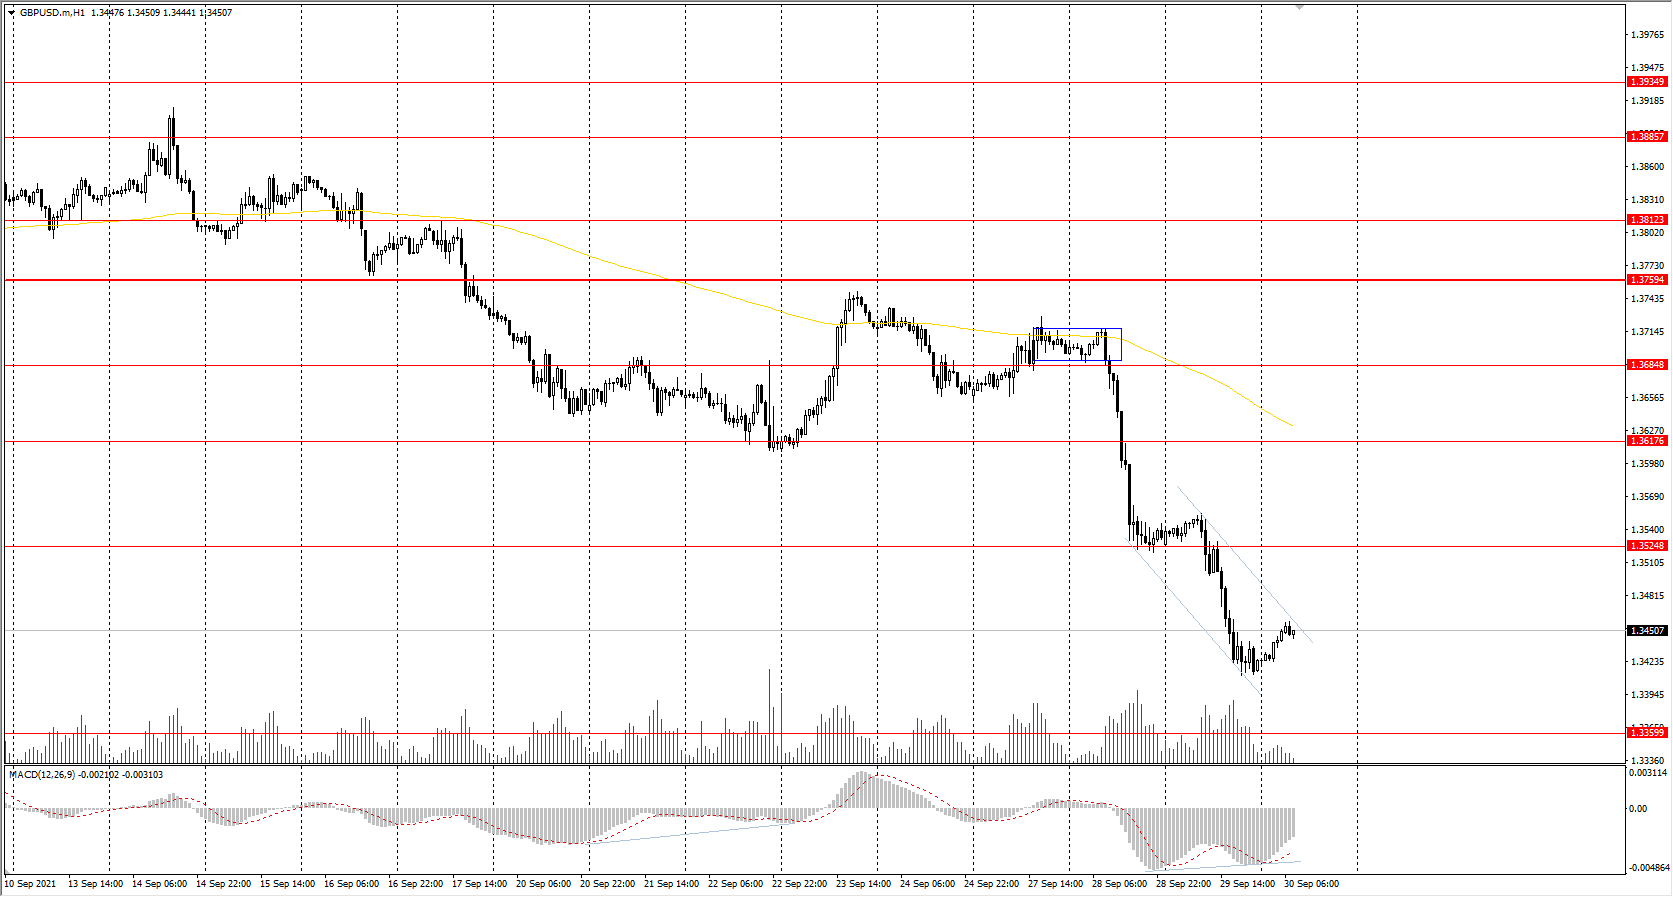
Prev Open: 1.3527
Prev Close: 1.3425
% chg. over the last day: -0.75%
The British pound is also rapidly losing its position amid the dollar index rising. In addition to problems with getting food to the store shelves and fuel to the gas stations, energy problems have also been added. Three more power suppliers in the UK have stopped working.
Trading recommendations
Support levels: 1.3360, 1.3282
Resistance levels: 1.3525, 1.3617, 1.3685, 1.3759, 1.3812, 1.3886
On the hourly time frame, the GBP/USD trend is bearish. The MACD indicator is negative, but there are signs of overselling and divergence. Buy trades should be considered only throughout the day and only with short targets from the support levels after the buyer’s initiative. Sell trades can be found at the resistance levels near the moving average line, as the price has deviated from the average values.
Alternative scenario: if the price breaks out through the 1.3759 resistance level and consolidates above, the bullish scenario will likely resume.
News feed for 2021.09.30:
- UK GDP (q/q) at 09:00 (GMT+3).
The USD/JPY currency pair
Technical indicators of the currency pair:
Prev Open: 111.46
Prev Close: 111.97
% chg. over the last day: +0.46%
The Japanese Yen futures continue to decline as a result of the strengthening dollar index and a slowdown in the economic recovery in Japan. Japan's industrial production fell by 3.2% month-on-month in August due to the weak automotive production against the background of a global shortage of chips and failures in supply chains.
Trading recommendations
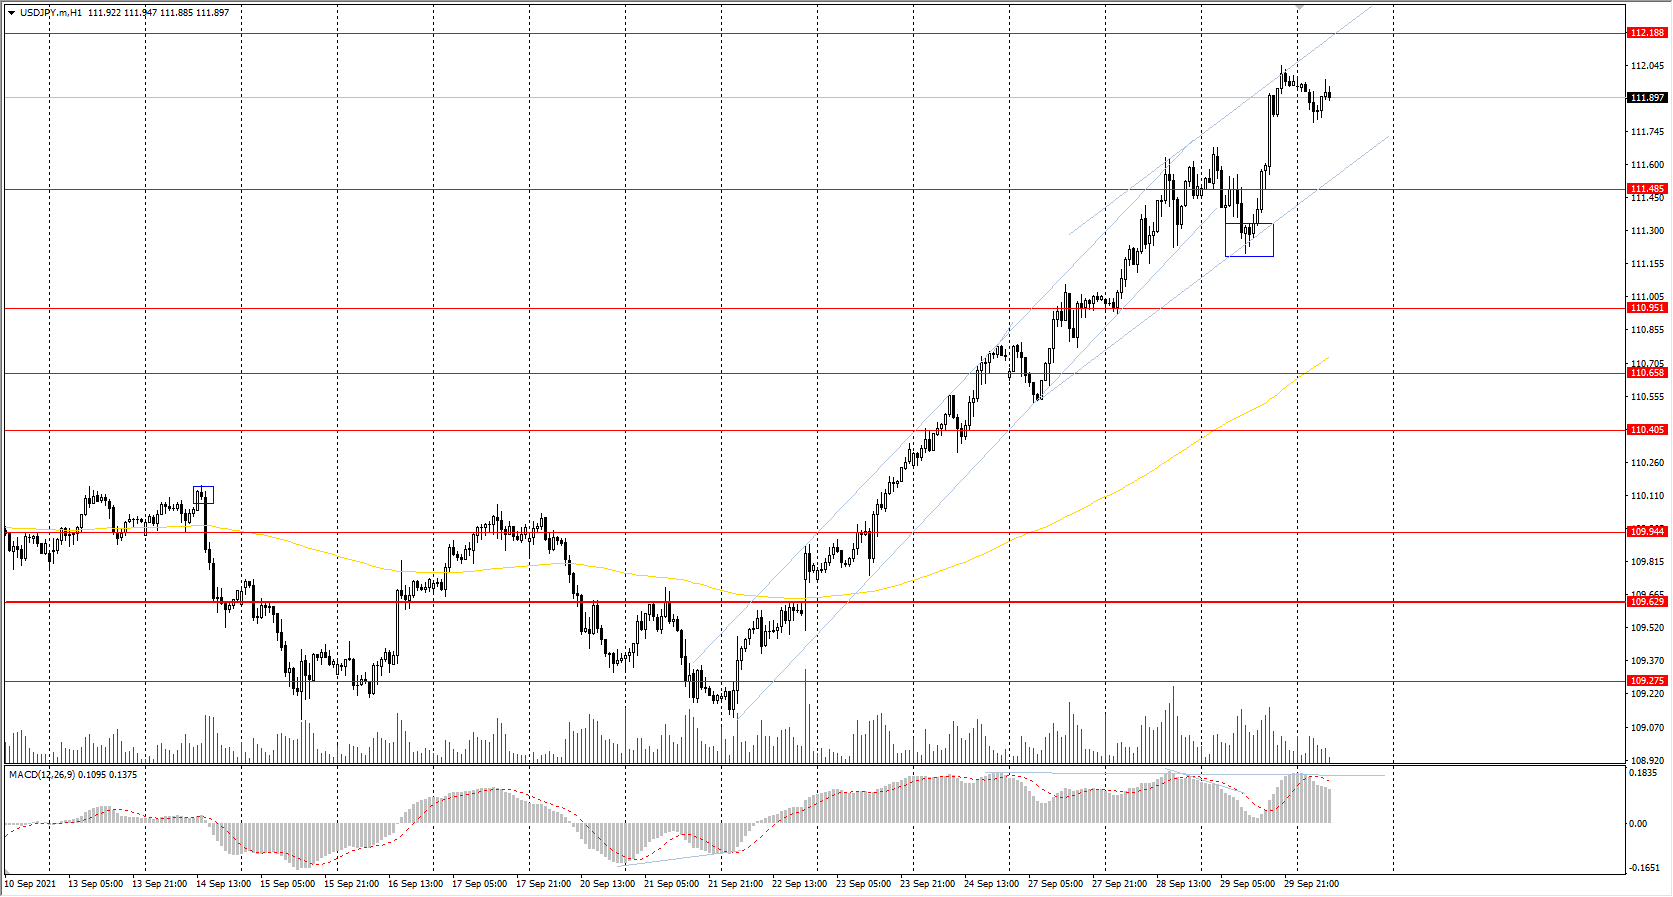
Support levels: 111.49, 110.95, 110.65, 110.40, 109.95, 109.63, 109.27
Resistance levels: 112.19
The main trend of the USD/JPY currency pair is bullish. Against the background of the Japanese Yen weakness and strengthening of the dollar index, the USD/JPY quotes continue to grow. The angle of the ascending channel has decreased, while the MACD indicator continues to signal overbuying and divergence. All these are signs of the buyer's weakness. Under such market conditions, it’s better to look for buy positions from the support levels after a small pullback. The price has deviated strongly from the moving average, and now there is a high probability of decline. Sell positions should be considered only throughout the day from the resistance levels in conjunction with the sellers' initiative.
Alternative scenario: if the price falls below 110.45, the uptrend is likely to be broken.
News feed for 2021.09.30:
- Japan Industrial Production (m/m) at 02:50 (GMT+3);
- Japan Retail Sales (m/m) at 02:50 (GMT+3);
- Japan BoJ Gov Haruhiko Kuroda’s Speech at 10:10 (GMT+3).
The USD/CAD currency pair
Technical indicators of the currency pair:
Prev Open: 1.2686
Prev Close: 1.2754
% chg. over the last day: +0.53%
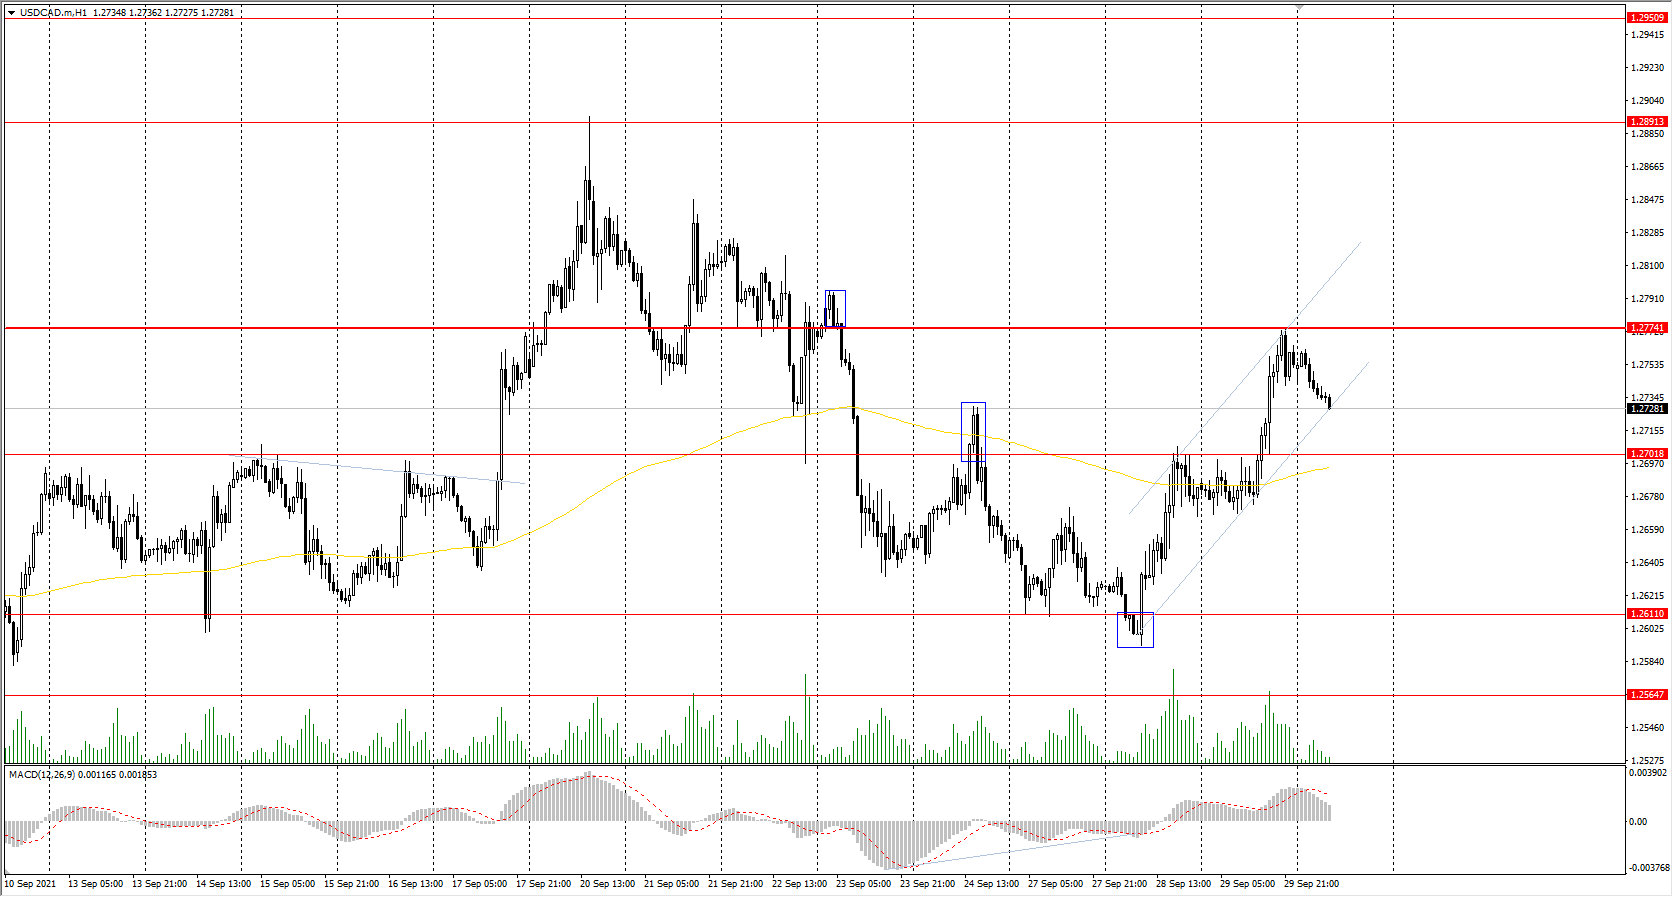
The Canadian dollar is a commodity currency, so USD/CAD is highly dependent on the dynamics of the dollar index and oil prices. The dollar index sharply jumped yesterday, while oil prices remained unchanged. As a result, the USD/CAD quotes increased due to the weakness of the Canadian currency.
Trading recommendations
Support levels: 1.2701, 1.2611, 1.2565, 1.2518, 1.2425
Resistance levels: 1.2774, 1.2891
From the technical point of view, the trend on the USD/CAD currency pair is bearish. But the local trend is bullish and the price has approached the priority change level. The MACD indicator has returned to the positive zone, there are signs of buyers. Under such market conditions, it is better to look for buy deals from the support levels, but only with short targets. It is best to look for sell deals from the resistance levels after the sellers' initiative in the form of an impulse movement.
Alternative scenario: if the price breaks out through the 1.2774 resistance level and fixes above, the uptrend will likely resume.