Sample Category Title
GBP/JPY Daily Outlook
Daily Pivots: (S1) 149.77; (P) 150.49; (R1) 151.05; More...
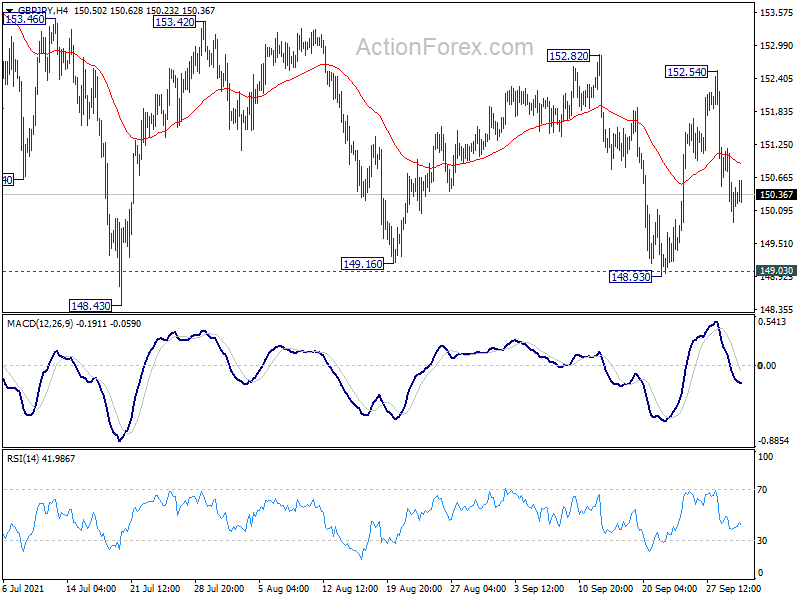
Intraday bias in GBP/JPY is mildly on the downside for retesting 149.03 key support level. Firm break there will carry larger bearish implications. On the upside, firm break of 152.82 will suggest that correction from 156.05 has completed, and turn near term outlook bullish for retesting this high.
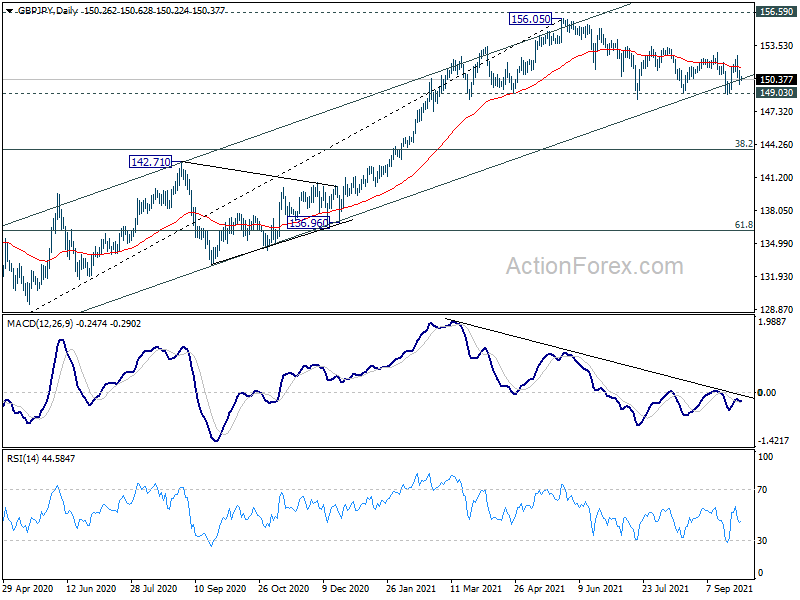
In the bigger picture, rise from 123.94 is seen as the third leg of the pattern from 122.75 (2016 low). As long as 149.03 support holds, such rise would still resume at a later stage. However, sustained break of 149.03 support will indicate rejection by 156.59. Fall from 156.05 would be at least correcting the whole rise from 123.94. Deeper fall would be seen back 38.2% retracement of 123.94 to 156.05 at 143.78 first.
EUR/JPY Day Outlook
Daily Pivots: (S1) 129.53; (P) 130.01; (R1) 130.33; More....
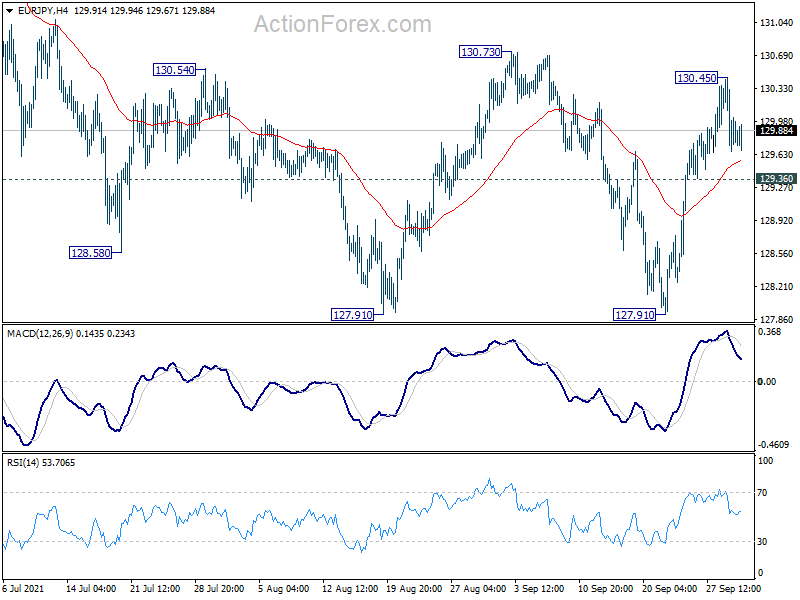
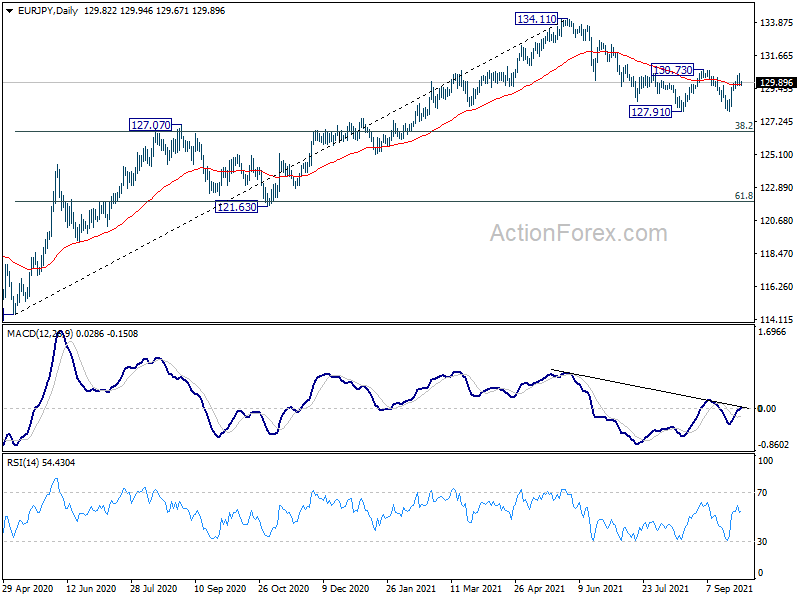
Intraday bias in EUR/JPY is turned neutral with current retreat. On the upside, firm break of 130.73 resistance will argue that correction from 134.11 has completed and turn near term outlook bullish for retesting this high. On the downside, break of 129.36 minor support will turn bias back to the downside for retesting 127.91 instead.
In the bigger picture, rise from 114.42 is seen as a medium term rising leg inside a long term sideway pattern. As long as 127.07 resistance turned support holds, further rise is still expected to retest 137.49 (2018 high). However, firm break of 127.07 will argue that the medium term trend has reversed, deeper fall would be seen to 61.8% retracement of 114.42 to 134.11 at 121.94.
EUR/GBP Daily Outlook
Daily Pivots: (S1) 0.8615; (P) 0.8636; (R1) 0.8660; More...
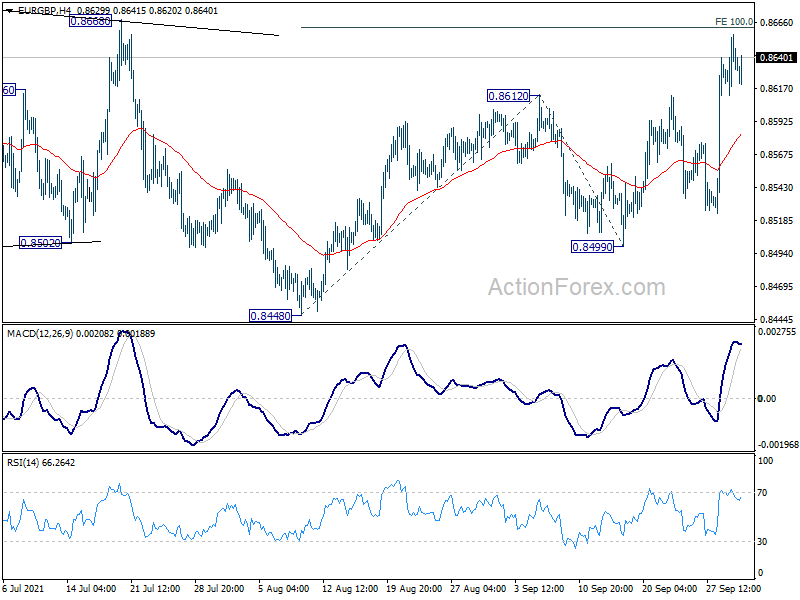
Intraday bias in EUR/GBP remains on the upside as rise form 0.8448 is in progress for 0.8668 key structural resistance. Sustained break there will be a strong sign of larger bullish reversal. Next target will be 161.8% projection of 0.8448 to 0.8612 from 0.8499 at 0.8764. On the downside, break of 0.8499 support is needed to confirm completion of the rebound. Otherwise, further rise will remain mildly in favor in case of retreat.
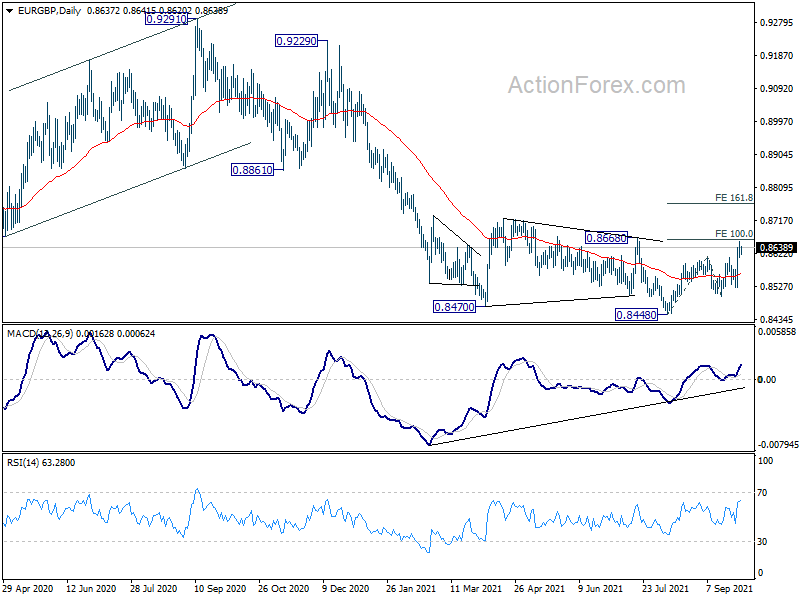
In the bigger picture, price actions from 0.9499 (2020 high) are still seen as developing into a corrective pattern. Deeper fall could be seen as long as 0.8668 resistance holds, towards long term support at 0.8276. However, firm break of 0.8668 resistance would argue that a medium term bottom was already formed. Stronger rise would be seen to 0.8861 support turned resistance to confirm completion of the corrective pattern.
EUR/AUD Daily Outlook
Daily Pivots: (S1) 1.6092; (P) 1.6137; (R1) 1.6207; More...
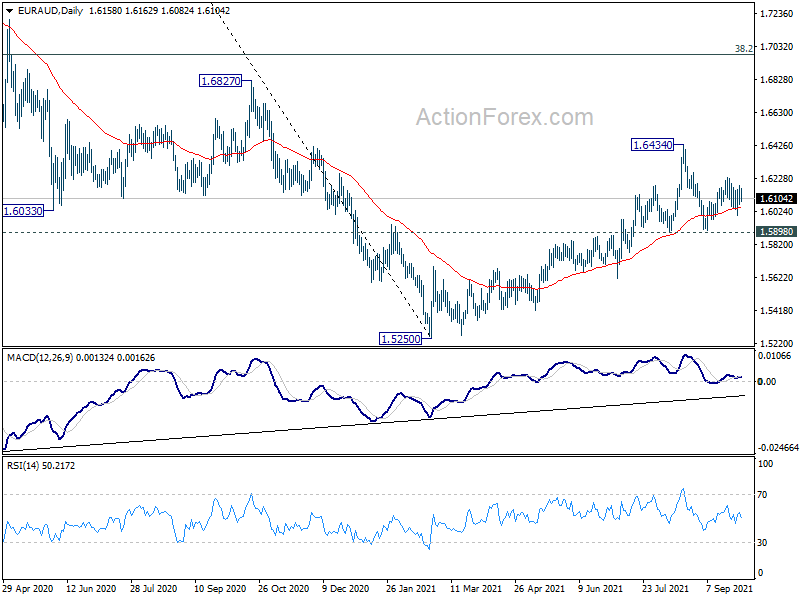
Intraday bias in EUR/AUD remains neutral for the moment. On the upside, above 1.6232 will resume the rebound from 1.5907 to retest 1.6434 high. Overall, rise from 1.5250 is still in favor to continue as long as 1.5898 support holds. However, sustained break of 1.5898 will argue that whole rise from 1.5250 has completed, and turn near term outlook bearish.
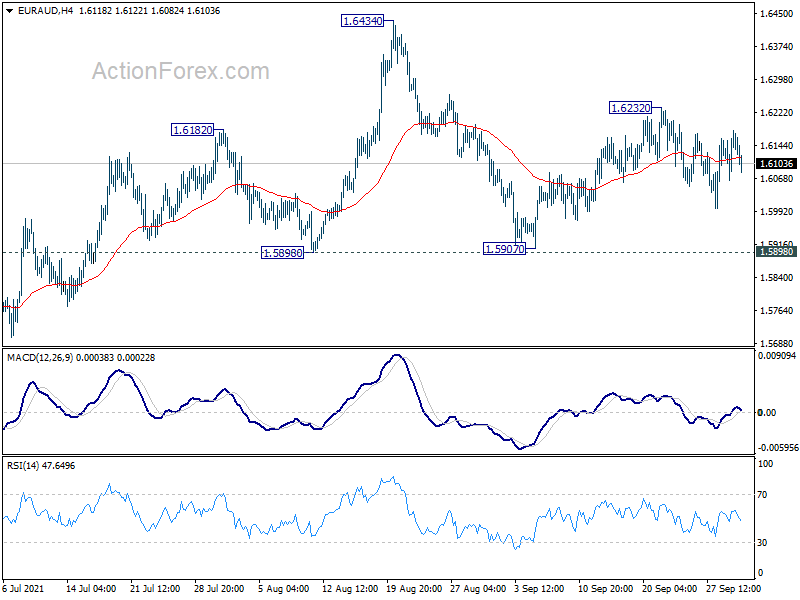
In the bigger picture, rise from 1.5250 medium term bottom is currently seen as a correction to the down trend from 1.9799 first. Stronger rise could be seen to 38.2% retracement of 1.9799 to 1.5250 at 1.6988 next. We'd tentatively expect strong resistance from there to limit upside, at least on first attempt. Meanwhile, break of 1.5898 support will indicate that the rebound has completed. Larger down trend from 1.9799 might be ready to resume through 1.5250 low.
EUR/CHF Daily Outlook
Daily Pivots: (S1) 1.0819; (P) 1.0841; (R1) 1.0860; More....
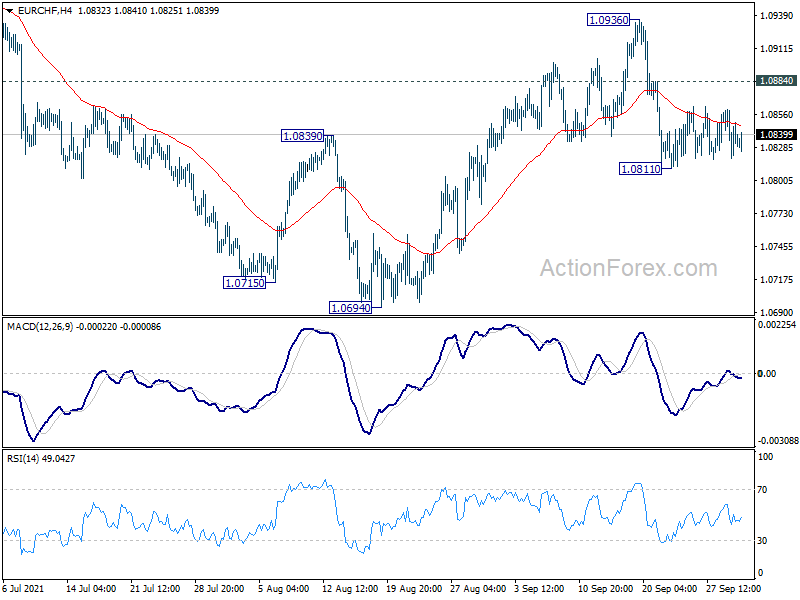
Intraday bias in EUR/CHF remains neutral as consolidation from 1.0811 continues. Outlook is unchanged that rebound from 1.0694 has possibly completed at 1.0936 already. Break of 1.0811 will turn bias to the downside and resume the fall for retesting 1.0694 low. On the upside, however, above 1.0884 minor resistance will turn bias back to the upside for 1.0936 resistance instead.
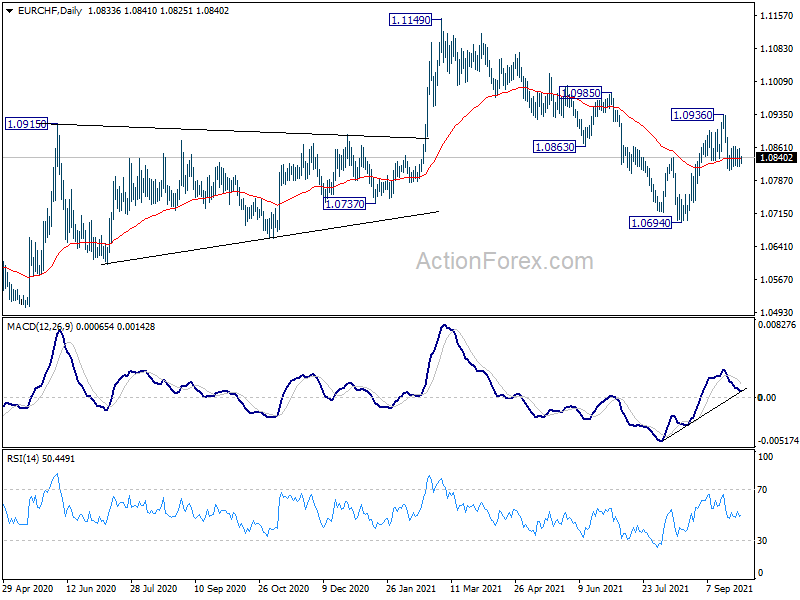
In the bigger picture, the stronger than expected rebound from 1.0694 and break of 55 week EMA (now at 1.0861) mixes up the medium term outlook. On the upside, break of 1.1149 will resume the whole rise from 1.0505 (2020 low). On the downside, break of 1.0694 will revive some medium term bearishness for 1.0505 and below.
AUDUSD Bounces Off 1-Month Low Below 0.72
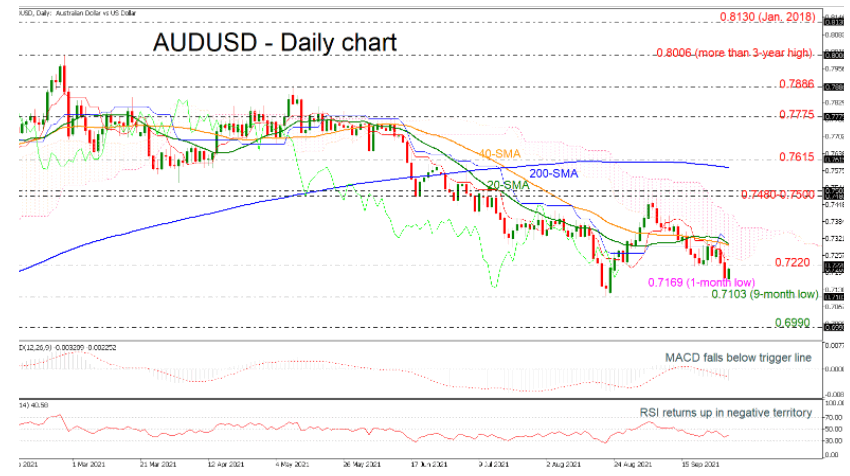
AUDUSD has been underperforming in the past two days, diving to a one-month low of 0.7172 and remaining below the Ichimoku cloud and the short-term simple moving averages (SMAs). However, today, the price is ticking up again with the RSI mirroring this latest movement. The MACD is still moving downwards with strong momentum beneath its trigger and zero lines.
The next target to the downside is the nine-month low of 0.7103. At this stage the market would likely a resumption of the downtrend from the 0.7886 peak and put in place a lower low at 0.6990.
Upside moves are likely to find resistance at the 20- and 40-day SMAs around the 0.7300 psychological mark. There is an important zone between 0.7480 and 0.7500 so, rising above this area would help shift the focus to the upside towards the 200-day SMA at 0.7590. Breaking this level could see a re-test of the 0.7615 high and turn the bias to neutral.
In the short-term, the bearish phase remains in play, especially if prices continue to trade below the SMAs and the 0.7220 barrier. In the bigger picture, the market is neutral to bearish as long as the 0.7103 level holds.
USD/CAD Daily Outlook
Daily Pivots: (S1) 1.2693; (P) 1.2734; (R1) 1.2798; More...
Intraday bias in USD/CAD is turned back to the upside with break of 1.2729. Further rise would be seen back to 1.2891 resistance first. On the downside, break of 1.2592 support will extend the fall from 1.2891, as the third leg of the pattern from 1.2947, to 1.2492 and possibly below. Overall, with 1.2421 support intact, rise from 1.2005 should still be in progress for another rally through 1.2947 at a later stage.
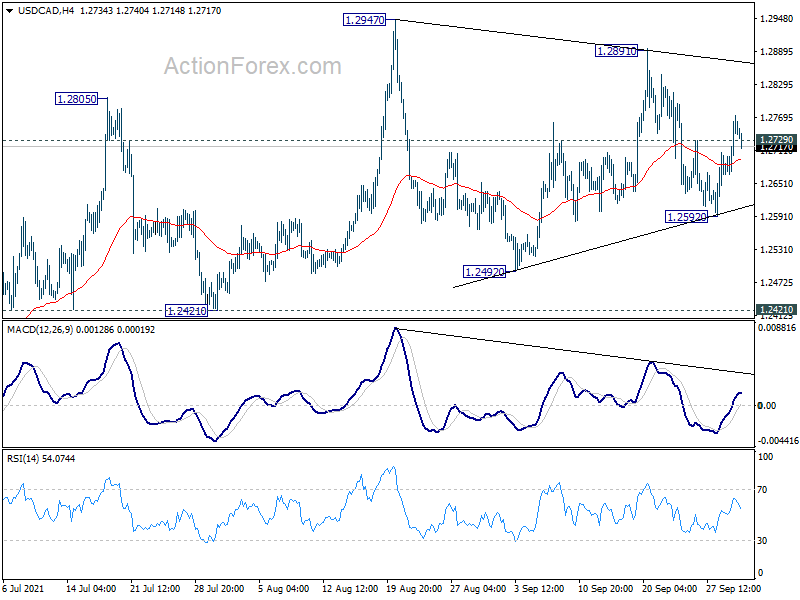
In the bigger picture, fall from 1.4667 is seen as the third leg of the corrective pattern from 1.4689 (2016 high). It should have completed after hitting 1.2061 (2017 low) and 50% retracement of 0.9406 to 1.4689 at 1.2048. Sustained break of 38.2% retracement of 1.4667 to 1.2005 at 1.3022 will pave the way to 61.8% retracement at 1.3650 and above. Overall, medium term outlook remains neutral at worst with 1.2048/61 support zone intact.
US Oil Seeks Support
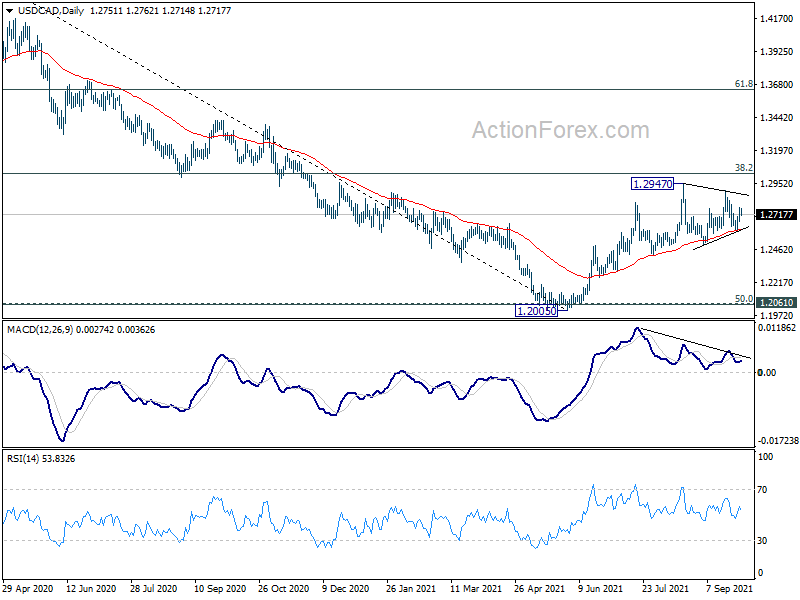
WTI crude dipped after the EIA reported an increase in US inventories.
The rally has met stiff selling pressure near July’s high (77.00). The RSI’s bearish divergence signaled a halt in the upward momentum.
Then a combination of profit-taking and fresh selling has pushed the price below the first support at 75.20. A bearish MA cross also points to a U-turn.
A pullback is necessary to let the bulls catch their breath. The resistance-turned-support at 73.00 would be a key level to keep the sentiment unscathed.
NAS 100 Tests Crucial Support
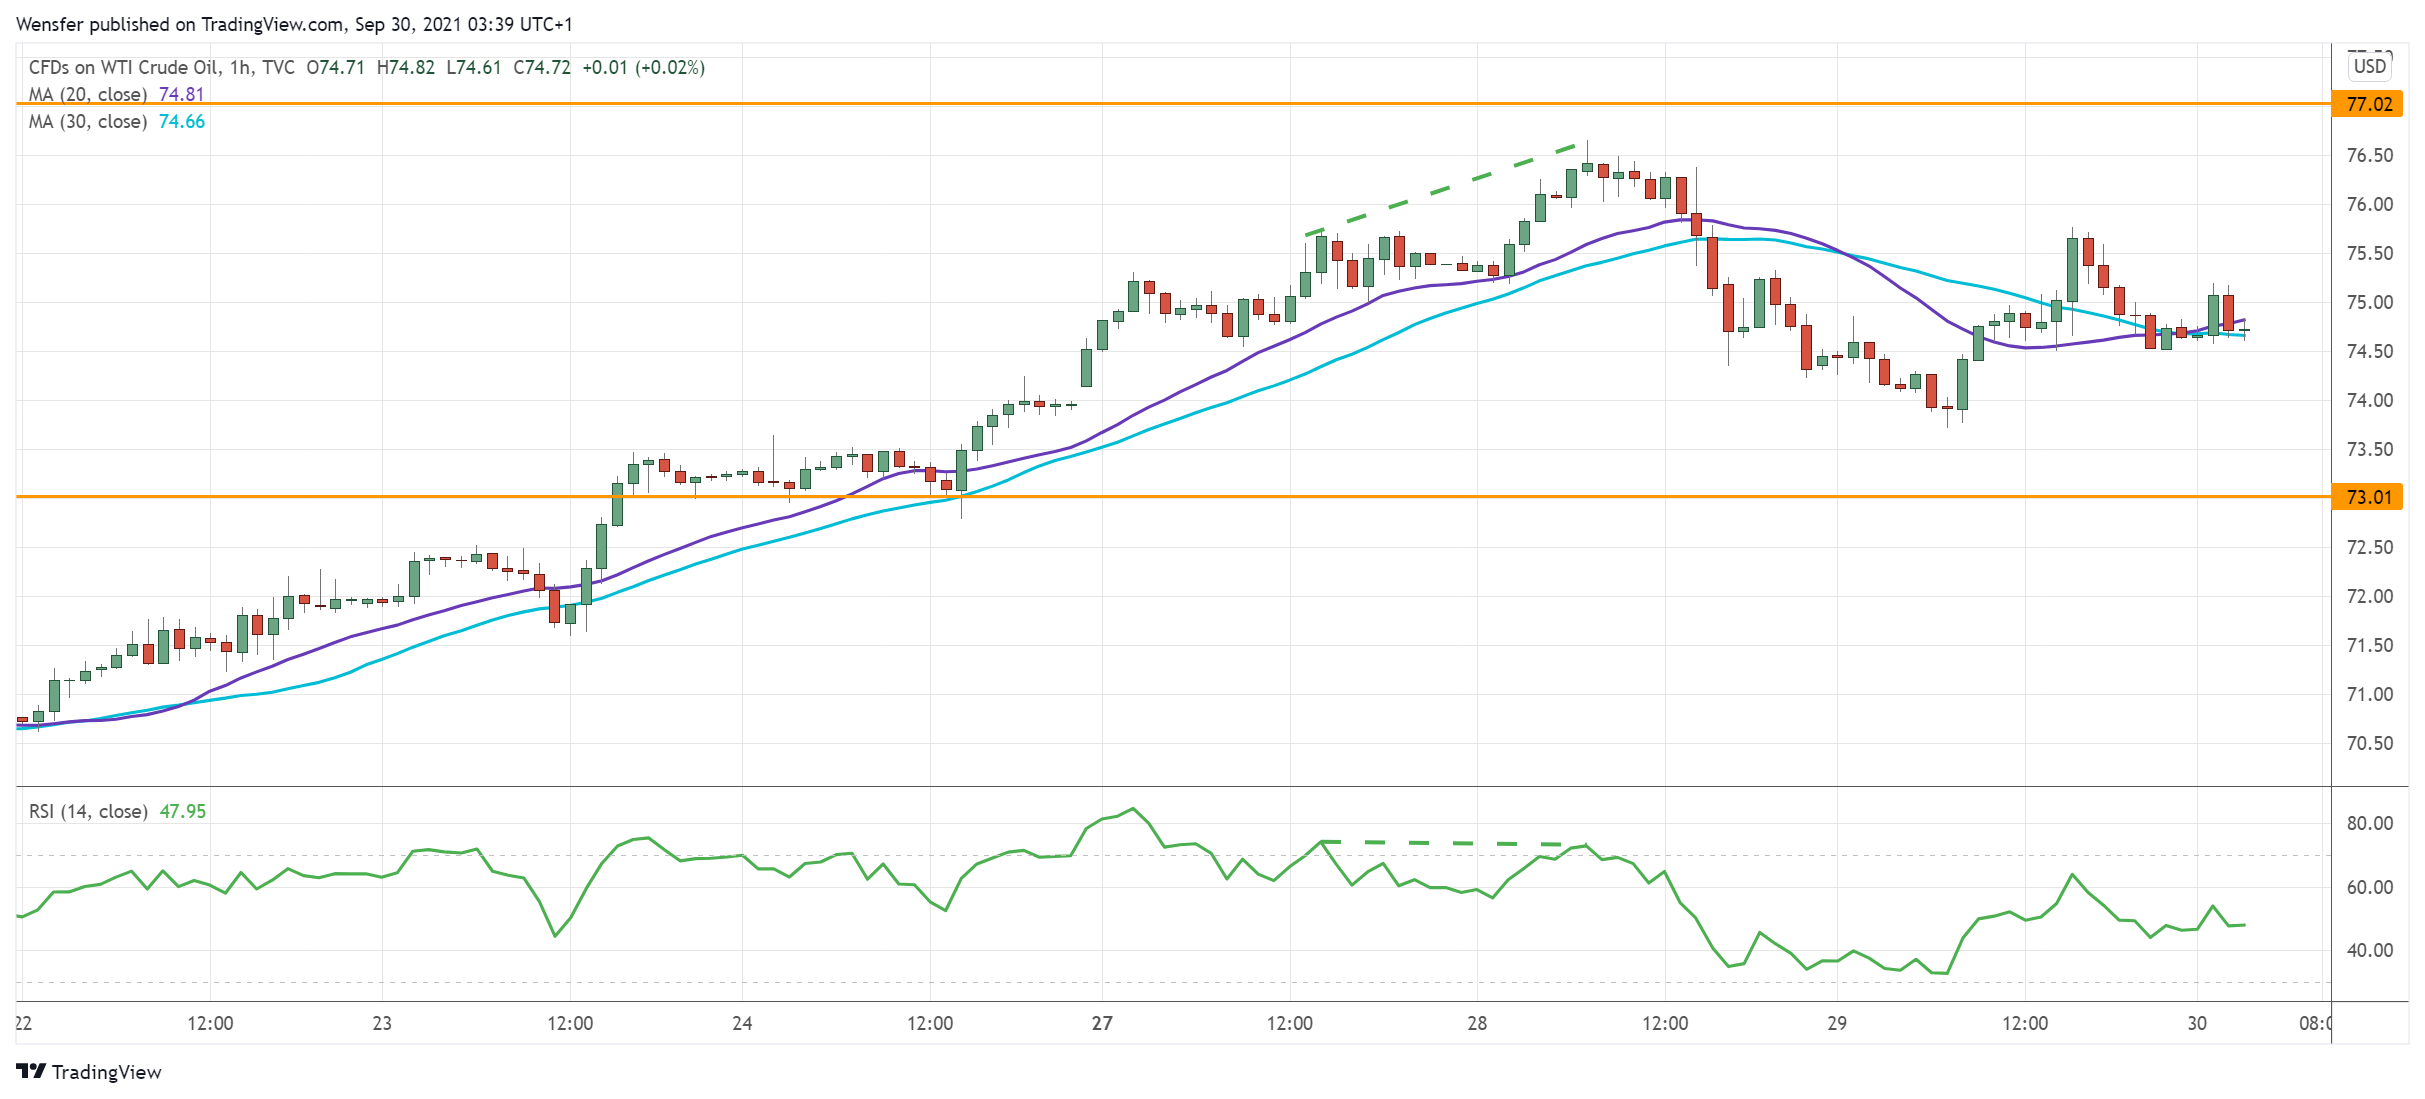
The Nasdaq 100 tumbles as surging bond yields weigh on growth stocks.
The retest of the demand zone around 14750 from the daily chart has put the bulls under pressure. The break below 14850 has invalidated last week’s rebound, raising the odds for another round of sell-off.
The RSI’s double-dip into the oversold area has offered some temporary respite. However, unless buyers can lift 15220, a rebound would be an opportunity to sell. Below the said critical floor, the index could be vulnerable to a plunge towards 14500.
GBP/USD Turns Bearish
The sterling struggles to stabilize as the UK braces for a fuel supply shock.
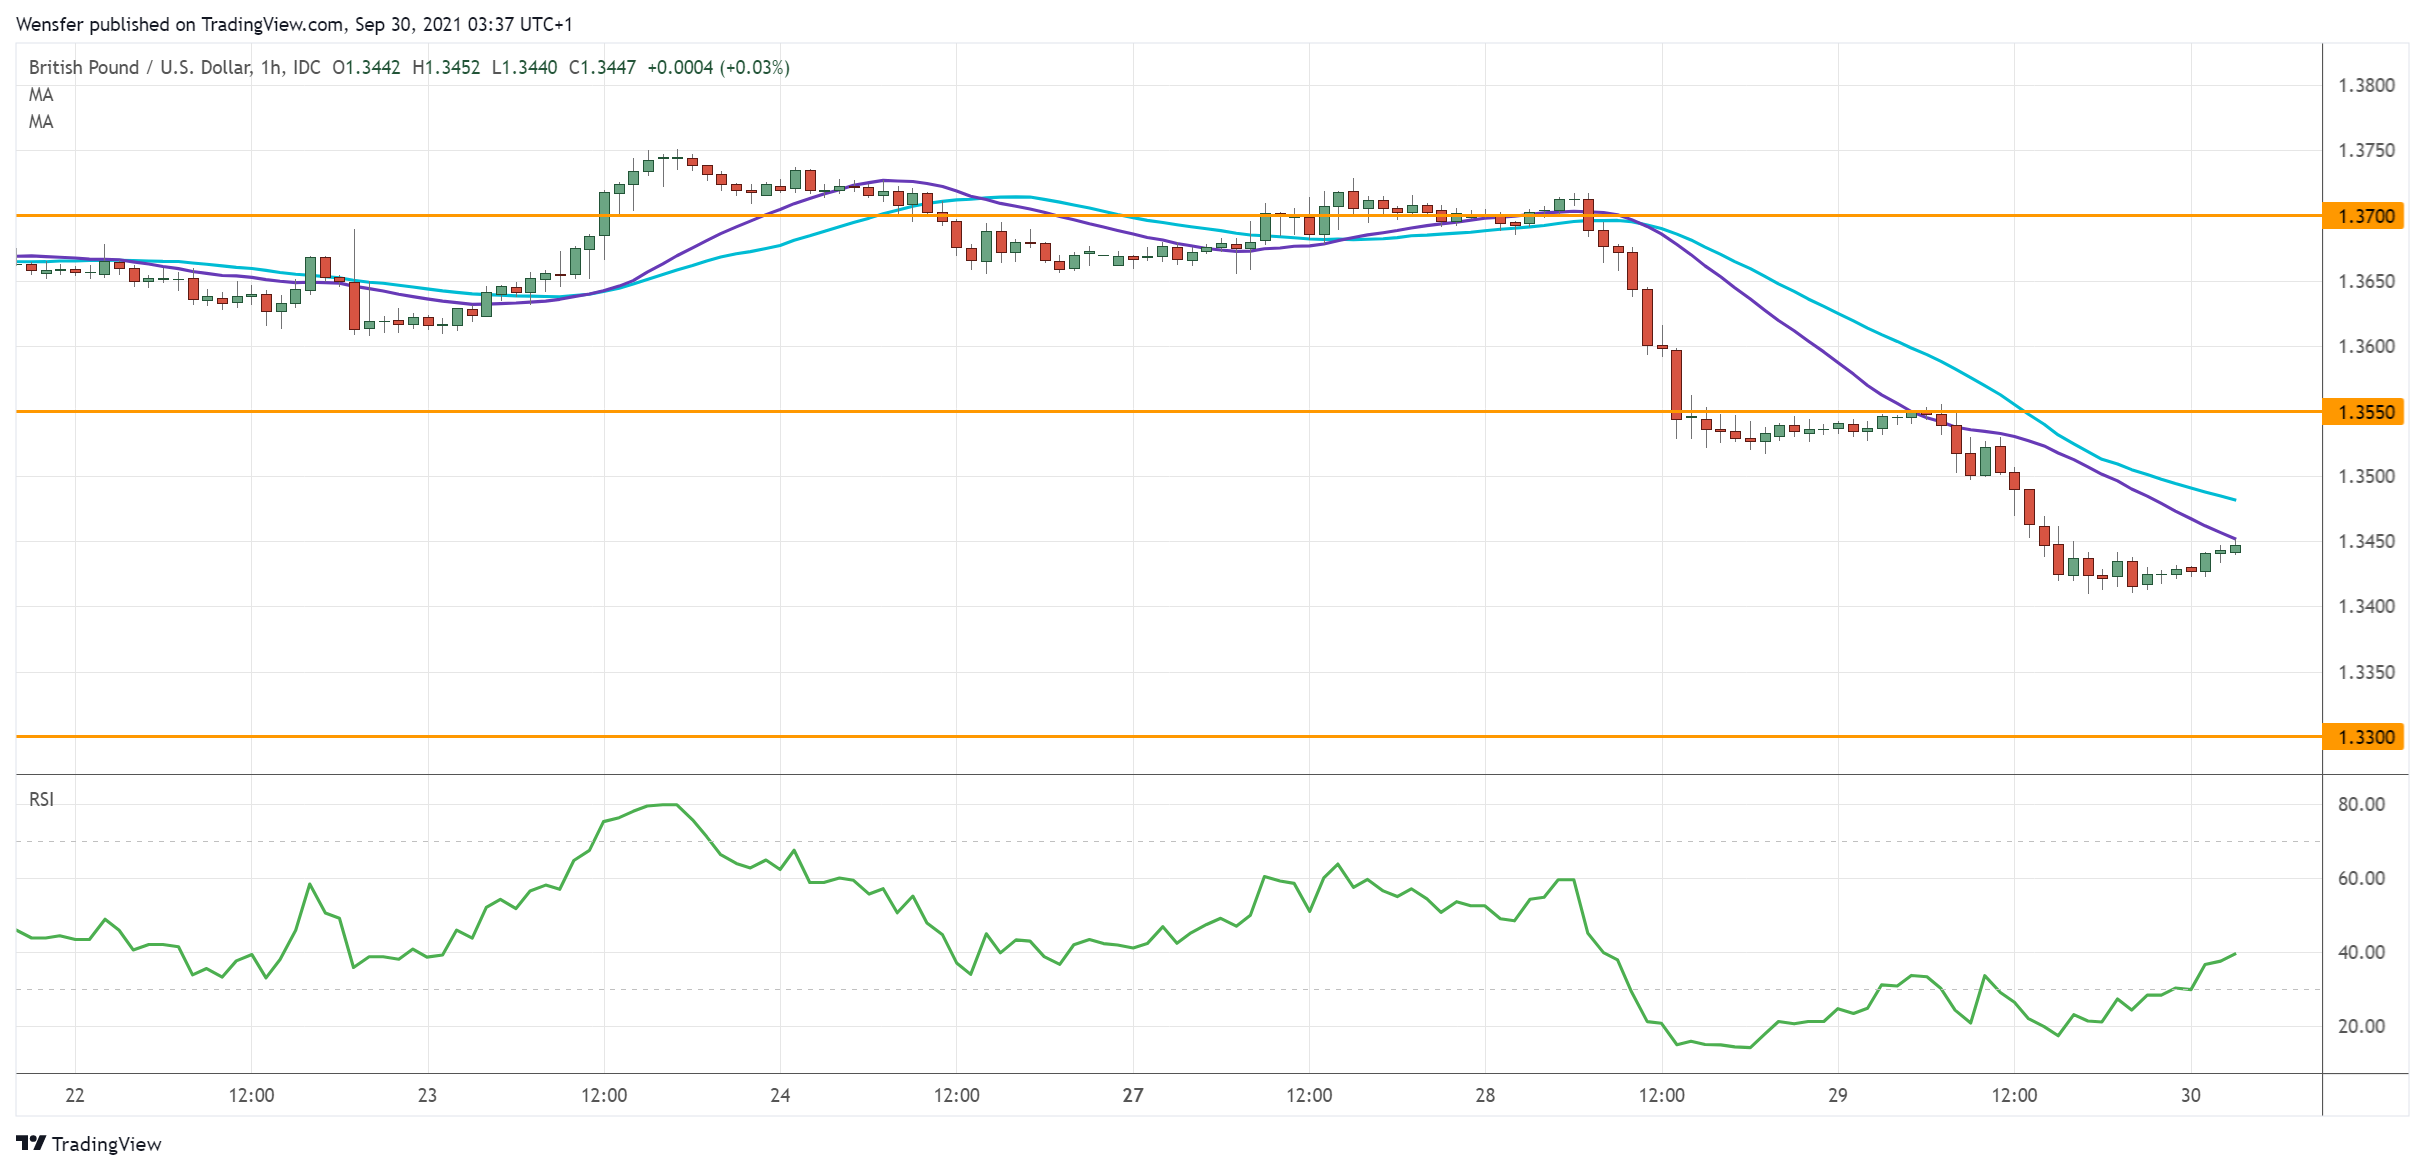
After three months of sideways action, the break below the daily support at 1.3600 could be the confirmation that the pound has sunk into a downtrend.
Strong momentum suggests that those who bought the dips had to bail out. 1.3300 is the next target.
A deeply oversold RSI would cause a limited rebound when short-term sellers take profit. 1.3550 is likely to cap the bounce with bears waiting to sell into strength.