Sample Category Title
S&P 500 Rally Pauses Before Fed, Nikkei 225 Eyeing 70,000, Crude Oil Plunges to 3-Month Low
Key takeaways
- Global markets paused ahead of the Federal Reserve meeting, with investors reducing risk exposure before Fed Chair Kevin Warsh’s first policy decision and updated economic projections. The S&P 500 slipped 0.6%, while the Nasdaq 100 fell 1.9%.
- The collapse in crude oil prices continues to reshape the macro narrative, as WTI plunged to a three-month low below US$77 per barrel on expectations of a formal US-Iran agreement and the reopening of the Strait of Hormuz, significantly reducing near-term inflation pressures.
- A sharp rotation is underway beneath the surface, with technology and semiconductor stocks underperforming while financials, industrials, and defensive cyclicals drive the Dow Jones Industrial Average to fresh record highs.
- Chart of the day: Nikkei 225’s minor bullish acceleration trend remains intact above 68,735/089 key short-term pivotal support
Chart of the day - Nikkei 225’s bullish acceleration trend towards a fresh all-time high
Fig. 1: Japan 225 minor trend as of 17 Jun 2026 (Source: TradingView). The information presented is historical information, and past performance is not indicative of future performance.
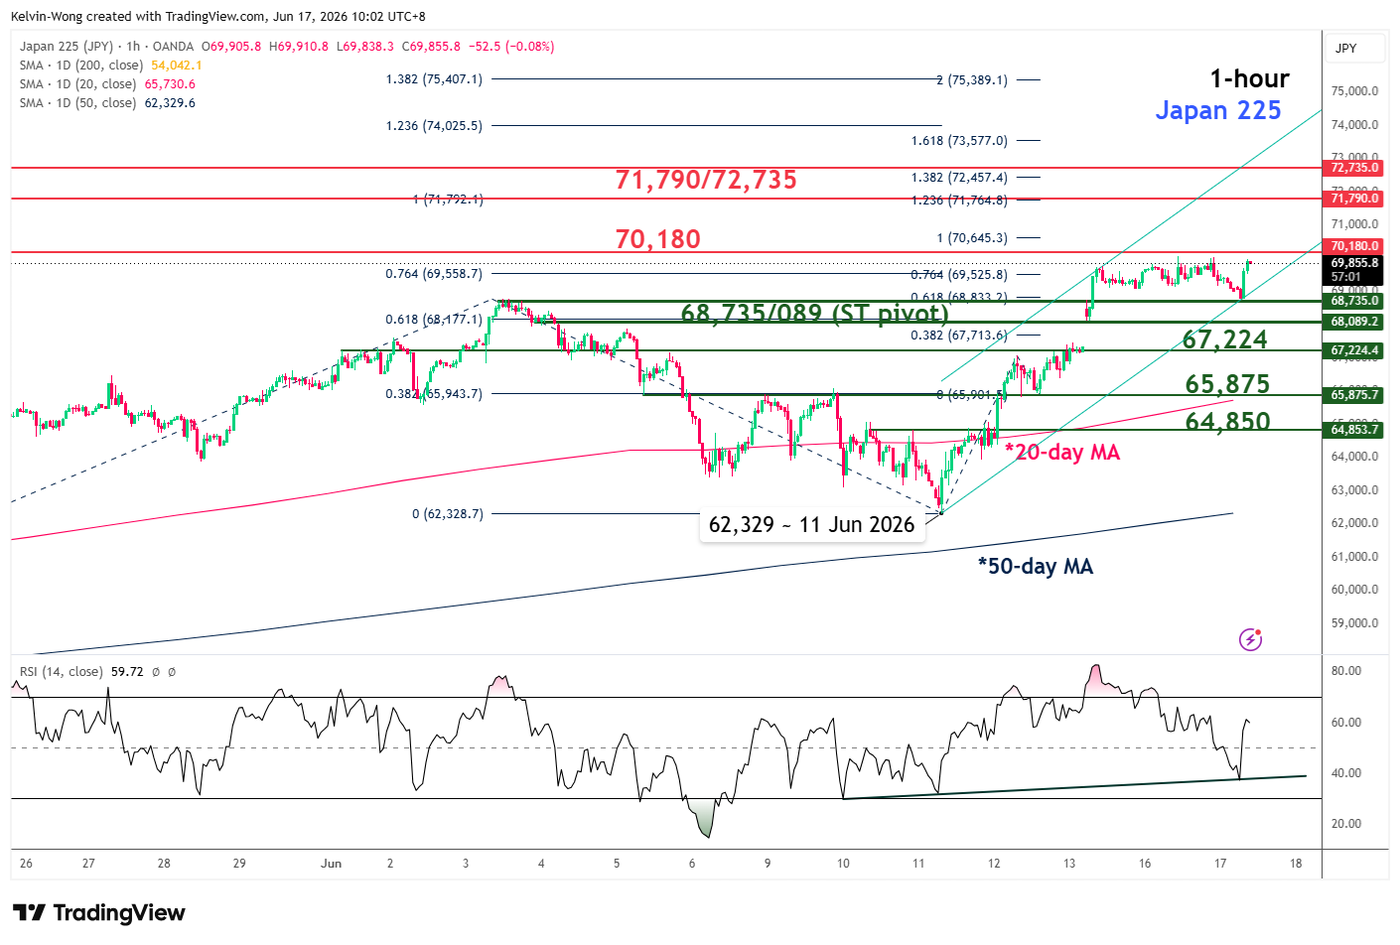
The minor uptrend phase of the Japan 225 CFD (a proxy for the Nikkei 225 futures) remains intact since the 11 June 2026 intraday low of 62,329, supported by a renewed bullish momentum condition in the hourly RSI (see Fig. 1)
Watch the 68,735/089 key short-term pivotal support to maintain the bullish bias to seek out the next intermediate resistances at 70,180 and 71,790/72,735 (Fibonacci extension cluster).
However, failure to hold and an hourly close below 68,089 negates the bullish tone, opening scope for a retracement to retest the next intermediate supports at 67,224 and 65,875 (also the 20-day moving average).
Top macro headlines
- S&P 500 rally falters on eve of new Fed Chair Kevin Warsh’s debut: A sweeping rally that brought equities to the edge of all-time highs paused on Tuesday, 17 June. Trading desks trimmed exposures ahead of the highly anticipated Federal Reserve interest rate decision, marking newly appointed Chair Kevin Warsh’s inaugural policy showcase. The S&P 500 slipped 0.6%, and the Nasdaq 100 underperformed, down 1.9%, as technology giants led a pre-meeting corrective decline. In contrast, the Dow Jones Industrial Average outperformed, rallied by 0.6% to a record high, led by Goldman Sachs (+1.35%) and Caterpillar (+1.24%).
- Crude oil plunges to 3-month low as Strait of Hormuz reopening nears: Energy markets faced a massive liquidation amid heightened expectations of a finalised peace accord between Washington and Tehran. Brent crude broke down below $80 to close at $79.33/bbl, and West Texas Intermediate (WTI) plummeted by 5.6% to settle at $76.61/bbl, marking a fresh 3-month low as the world prepares for the formal reopening of the Strait of Hormuz on Friday.
- SpaceX post-IPO Surge extends to $2.66 trillion to threaten tech giants: Highlighting robust speculative appetite, shares of Elon Musk’s rocket company extended their post-IPO rally. SpaceX surged more than 8% in intraday heavy trading, before settling at a gain of 4.8% on Tuesday, 16 June. The newly public firm surpassed Amazon.com Inc. as the world’s fifth-largest company, with a market capitalisation of $2.66 trillion, about $10 billion more than Amazon's. Underwriters additionally exercised their greenshoe option, inflating total IPO proceeds to $85.7 billion.
- US housing construction activity slides to lowest volume since pandemic: Reflecting ongoing macro headwinds in the domestic real estate space, US housing starts plummeted a sharp 15.4% m/m. The housing indicator fell below the consensus projection of -2% to its lowest level since May 2020.
Key macro themes
- The Fed’s critical crossroads in forward guidance: The global macro landscape is pinned entirely on the conclusion of the June FOMC meeting. Markets are pricing a near-certain probability that rates will remain paused at 3.50% to 3.75%, but the true focus remains on Kevin Warsh’s upcoming press conference and the updated summary of economic projections. Most economists expect the median dot plot to reflect an upward revision in inflation metrics alongside a drop in the committee’s traditional easing bias. Any hawkish baseline shift by Chair Warsh’s press conference could drastically redefine the global cost of capital heading into the second half of 2026.
- Extraction of the war premium and global supply chain recovery: With hundreds of stranded tankers preparing to move through the Persian Gulf following the preliminary US-Iran peace breakthrough, the deflation of the global energy crunch is rapidly filtering into cross-asset assets. While it will take months for infrastructure and shipping schedules to fully optimise, front-month futures are fast-tracking the extraction of the conflict premium. This supply shock reversal provides central banks with significant breathing room regarding headline price metrics but triggers immediate asset allocation out of defensive resource equities and back into cyclical growth.
- China’s domestic bifurcation and industrial divergence: Macro numbers from the Asia-Pacific region reveal a severe disconnect within the Chinese economy. On one hand, domestic consumption remains deeply damaged, with retail sales contracting 0.6% y/y in May, underperforming consensus estimates. Conversely, industrial production maintained its robust growth trajectory at 4.5% y/y in May (above consensus of 4.3%), supercharged by massive state-level investments in 3D printing, lithium-ion networks, and advanced industrial robots. This bifurcation suggests persistent weak domestic demand, while state resources are being channelled to the external sector.
Global markets impact (last 24 hours)
Equities: The S&P 500 fell 0.6%, and the Nasdaq 100 slid 1.9% on profit-taking across mega-cap tech and semiconductors (SOX - 5.7%). The Dow Jones Industrial Average rose 0.6% to lead US indices toward a record high, boosted by a powerful defensive rotation into cyclical and financials. The Stoxx Europe 600 inched higher by 0.3% to a record high.
Fixed Income: Sovereign bond yields dropped as tumbling crude oil prices eased long-term inflation fears. The benchmark 10-year US Treasury yield fell 3 basis points to 4.44%. Germany’s 10-year Bund yield slipped to 2.94%, almost a one-month low, while Britain’s 10-year Gilt yield held near 4.81%.
FX: The US Dollar Index remained little changed. The euro ticked up 0.2% to trade at $1.1608, while the British pound hovered at $1.3427, inching up slightly above its 20-day moving average. The Japanese yen weakened slightly to 160.47 per US dollar near the prior critical intervention level of 160.65, following BoJ’s decision to end its JGBs tapering programme from April 2027.
Commodities: WTI crude oil fell 5.6% to settle at $76.61/bbl, and Brent fell below $80 on Persian Gulf de-escalation. Precious metals gained a modest lift from declining sovereign bond yields, with spot gold climbing 0.5% to settle at $4,331/oz but still below the 20-day moving average ($4,395/oz).
Asia Pacific impact
- Mixed performances in Asian equities on shifting factors: Asia-Pacific equity bourses mixed in early trading. Japan’s Nikkei 225 rallied by 0.4%, looking to set another fresh all-time high milestone at 70,000 on the backdrop of a restrained 10-year JGB yield at 2.62% (below its 30-year high of 2.81% printed in May 2026). Profit-taking was seen in semiconductor- and technology-heavy South Korea’s KOSPI and Taiwan’s TAIEX, with intraday losses of 0.2% and 0.8%, respectively. Meanwhile, the defence-oriented Singapore’s STI soared to 0.8% towards a new intraday record high of 5,160.
- Aussie dollar supported by RBA hawkish hold: The Australian Dollar whipsawed and ended Tuesday’s session almost unchanged at 0.7067 against the greenback as market participants digested RBA Governor Bullock’s “hawkish cautious” messaging, with the possibility of further monetary policy tightening in Australia if inflation pressures resurface.
Top 5 events to watch today
- UK Core Inflation Rate (May) - 2:00 pm SGT (consensus: 2.7% y/y, Apr: 2.5% y/y) Impact: GBP/USD, GBP crosses, UK Gilts, FTSE 100
- US Retail Sales (May) - 8.30 pm SGT (consensus: 0.5% m/m, Apr: 0.5% m/m) Impact: USD, US stock indices, short-term US Treasuries
- EIA Weekly Stockpile Change - 10:30 pm SGT Impact: WTI and Brent crude
- Fed Interest Rate Decision & Economic Projections - 2:00 am SGT, Thursday Impact: All asset classes
- Fed Press Conference - 2.30 am SGT, Thursday Impact: All asset classes
GBP/USD Braces for Breakout as Fed and UK CPI Draw Near
Key Highlights
- GBP/USD attempted a fresh increase and tested the 1.3460 resistance.
- A key contracting triangle is forming with resistance at 1.3450 on the 4-hour chart.
- The UK Core CPI could increase 2.7% in May 2026 (YoY).
- The Fed might keep interest rates unchanged from 3.75%.
GBP/USD Technical Analysis
The British Pound found support near 1.3320 against the US Dollar. GBP/USD climbed above 1.3400 and 1.3420 before it faced hurdles.
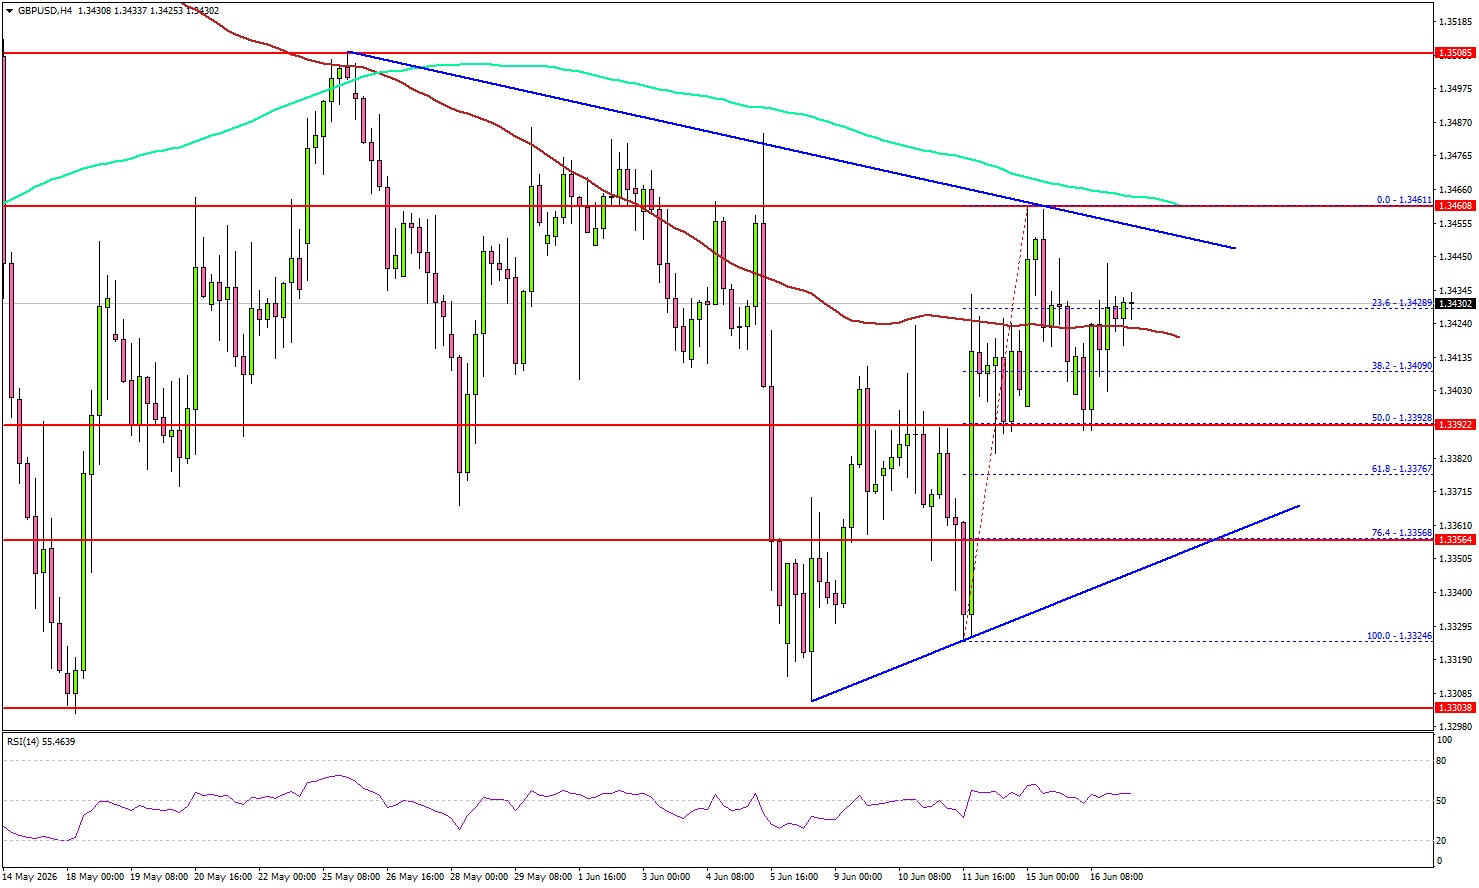
Looking at the 4-hour chart, the pair traded above the 100 simple moving average (red, 4-hour) but failed to surpass 1.3460 and the 200 simple moving average (green, 4-hour). There is also a key contracting triangle forming with resistance at 1.3450.
To continue higher, the pair must settle above the triangle resistance and the 200 simple moving average (green, 4-hour). The next major resistance might be 1.3500.
A close above 1.3500 could open the doors for a larger increase. In the stated case, GBP/USD might rise toward 1.3600 or even 1.3650. If there is a fresh pullback, the bulls might remain active near the 50% Fib retracement level of the upward move from the 1.3324 swing low to the 1.3461 high at 1.3390.
The first major support might be near 1.3355. A close below 1.3355 could push the pair into a bearish zone. The main support could be near 1.3300. Any more losses might set the pace for a test of 1.3200.
Looking at EUR/USD, the pair started a recovery wave above 1.1575 but faces many hurdles near 1.1625 and 1.1650.
Upcoming Key Economic Events:
- UK Consumer Price Index for May 2026 (YoY) – Forecast +2.9%, versus +2.8% previous.
- UK Core Consumer Price Index for May 2026 (YoY) – Forecast +2.7%, versus +2.5% previous.
- US Retail Sales for May 2026 (MoM) – Forecast +0.5%, versus +0.5% previous.
- Fed Interest Rate Decision - Forecast 3.75%, versus 3.75% previous.
Japan Exports Beat Expectations as AI Demand Offsets War-Related Disruptions
Japan's exports rose 17.0% yoy in May, accelerating from 14.8% yoy and exceeding expectations of 16.2% yoy, marking a ninth consecutive month of growth. Strong demand for semiconductors and electronic components linked to the global artificial intelligence boom helped offset disruptions caused by the US-Israeli conflict with Iran and the temporary closure of the Strait of Hormuz. Exports to the United States increased 12.5% yoy, while shipments to China rose 17.9% yoy.
However, the headline strength masked a much softer picture underneath. Export volumes rose just 0.5% yoy, suggesting much of the increase was driven by higher prices rather than stronger underlying demand. A weaker Yen and elevated commodity prices boosted the value of both exports and imports. Electronic components remained a bright spot as demand from AI and data-center investment continued to support pricing for memory chips and non-ferrous metals.
Imports rose 12.5% yoy, slightly below expectations of 12.8% yoy. Despite a collapse in crude oil import volumes, higher energy prices kept import values elevated. Crude oil imports fell -57.3% in volume terms and -28.5% in value terms, while the per-unit cost in Yen reached a record high. Imports from the Middle East plunged -61.9%, partially offset by a 24.0% increase in imports from the United States
Japan recorded a trade deficit of JPY 378.7bn, narrower than the expected JPY 564.6bn shortfall. The data suggest Japan's trade sector remains resilient, but much of that resilience continues to rely on favorable pricing effects and AI-related demand rather than broad-based growth in export volumes.
| Indicator | Apr | May | Expected |
|---|---|---|---|
| Exports Y/Y | 14.8% | 17.0% | 16.2% |
| Imports Y/Y | 9.8% | 12.5% | 12.8% |
| Trade Balance | JPY 301.9B | -JPY 378.7B | -JPY 564.6B |
Elliott Wave Forecast: Gold (XAUUSD) Impulsive Structure Supports Bullish Continuation
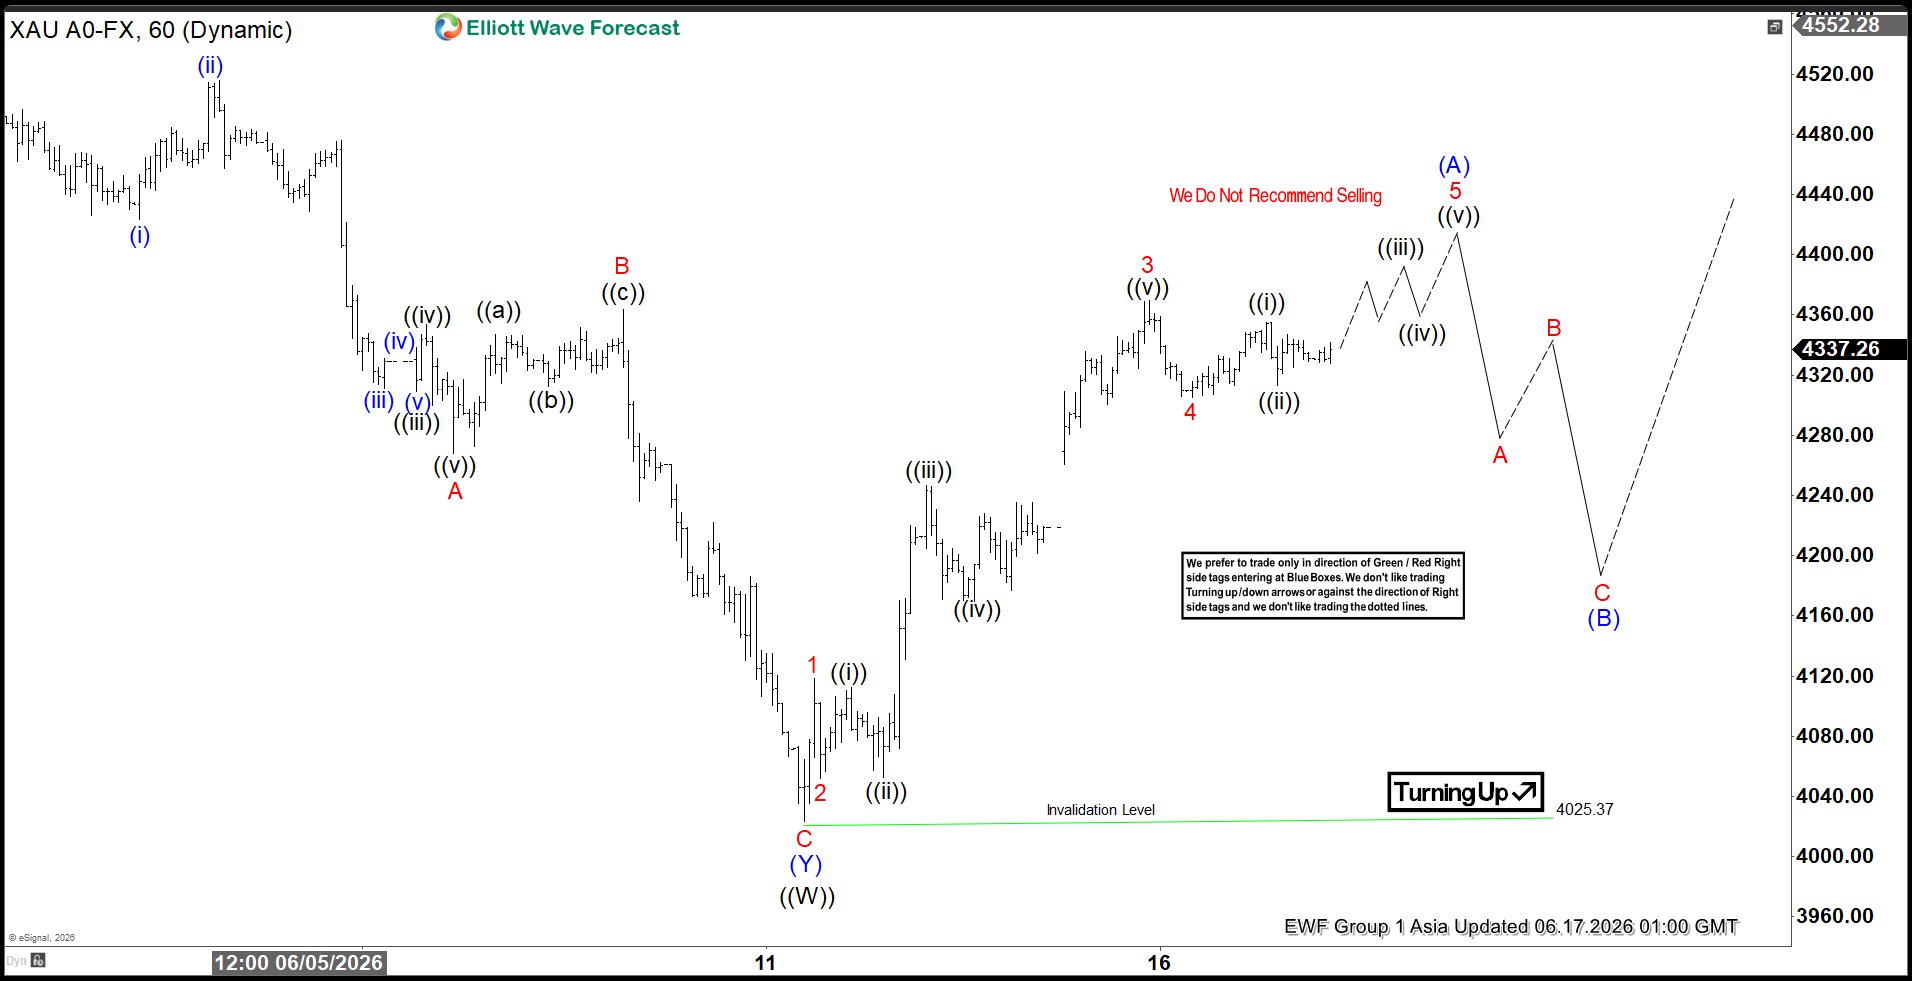
Gold (XAUUSD) has completed its cycle from the April 17 peak and is now positioned for a corrective rally in three waves. The decline from that peak ended at $4025, which marked the completion of wave ((W)). From this low, the market began a corrective phase in wave ((X)), unfolding as a zigzag structure. Within this formation, wave (A) is developing as a five‑wave impulse, providing the initial leg of the correction.
From the June 11 low at wave ((W)), the first impulse wave advanced to $4118.14. A pullback in wave 2 followed, reaching $4051.88. The metal then resumed its upward trajectory, with wave 3 extending sharply to $4369.45. A subsequent retracement in wave 4 found support at $4305.21. The expectation is for gold to continue higher in wave 5, thereby completing wave (A) of the zigzag. Once this advance is complete, the market should enter wave (B), correcting the cycle from the June 11 low before resuming its rally in wave (C).
In the near term, the structural pivot at $4025 remains critical. As long as this level holds, dips are anticipated to find support within the typical three, seven, or eleven swing sequences. This framework suggests that corrective pullbacks will likely provide opportunities for renewed strength. The overall pattern highlights resilience above the $4025 low and maintains a constructive outlook for gold in the short to medium term. The sequence of waves continues to reinforce the bullish bias, with each retracement offering potential for continuation.
Spot Gold (XAUUSD) 60-Minute Elliott Wave Chart
XAUUSD Elliott Wave Video
https://www.youtube.com/watch?v=jLFDOkZJeNQ
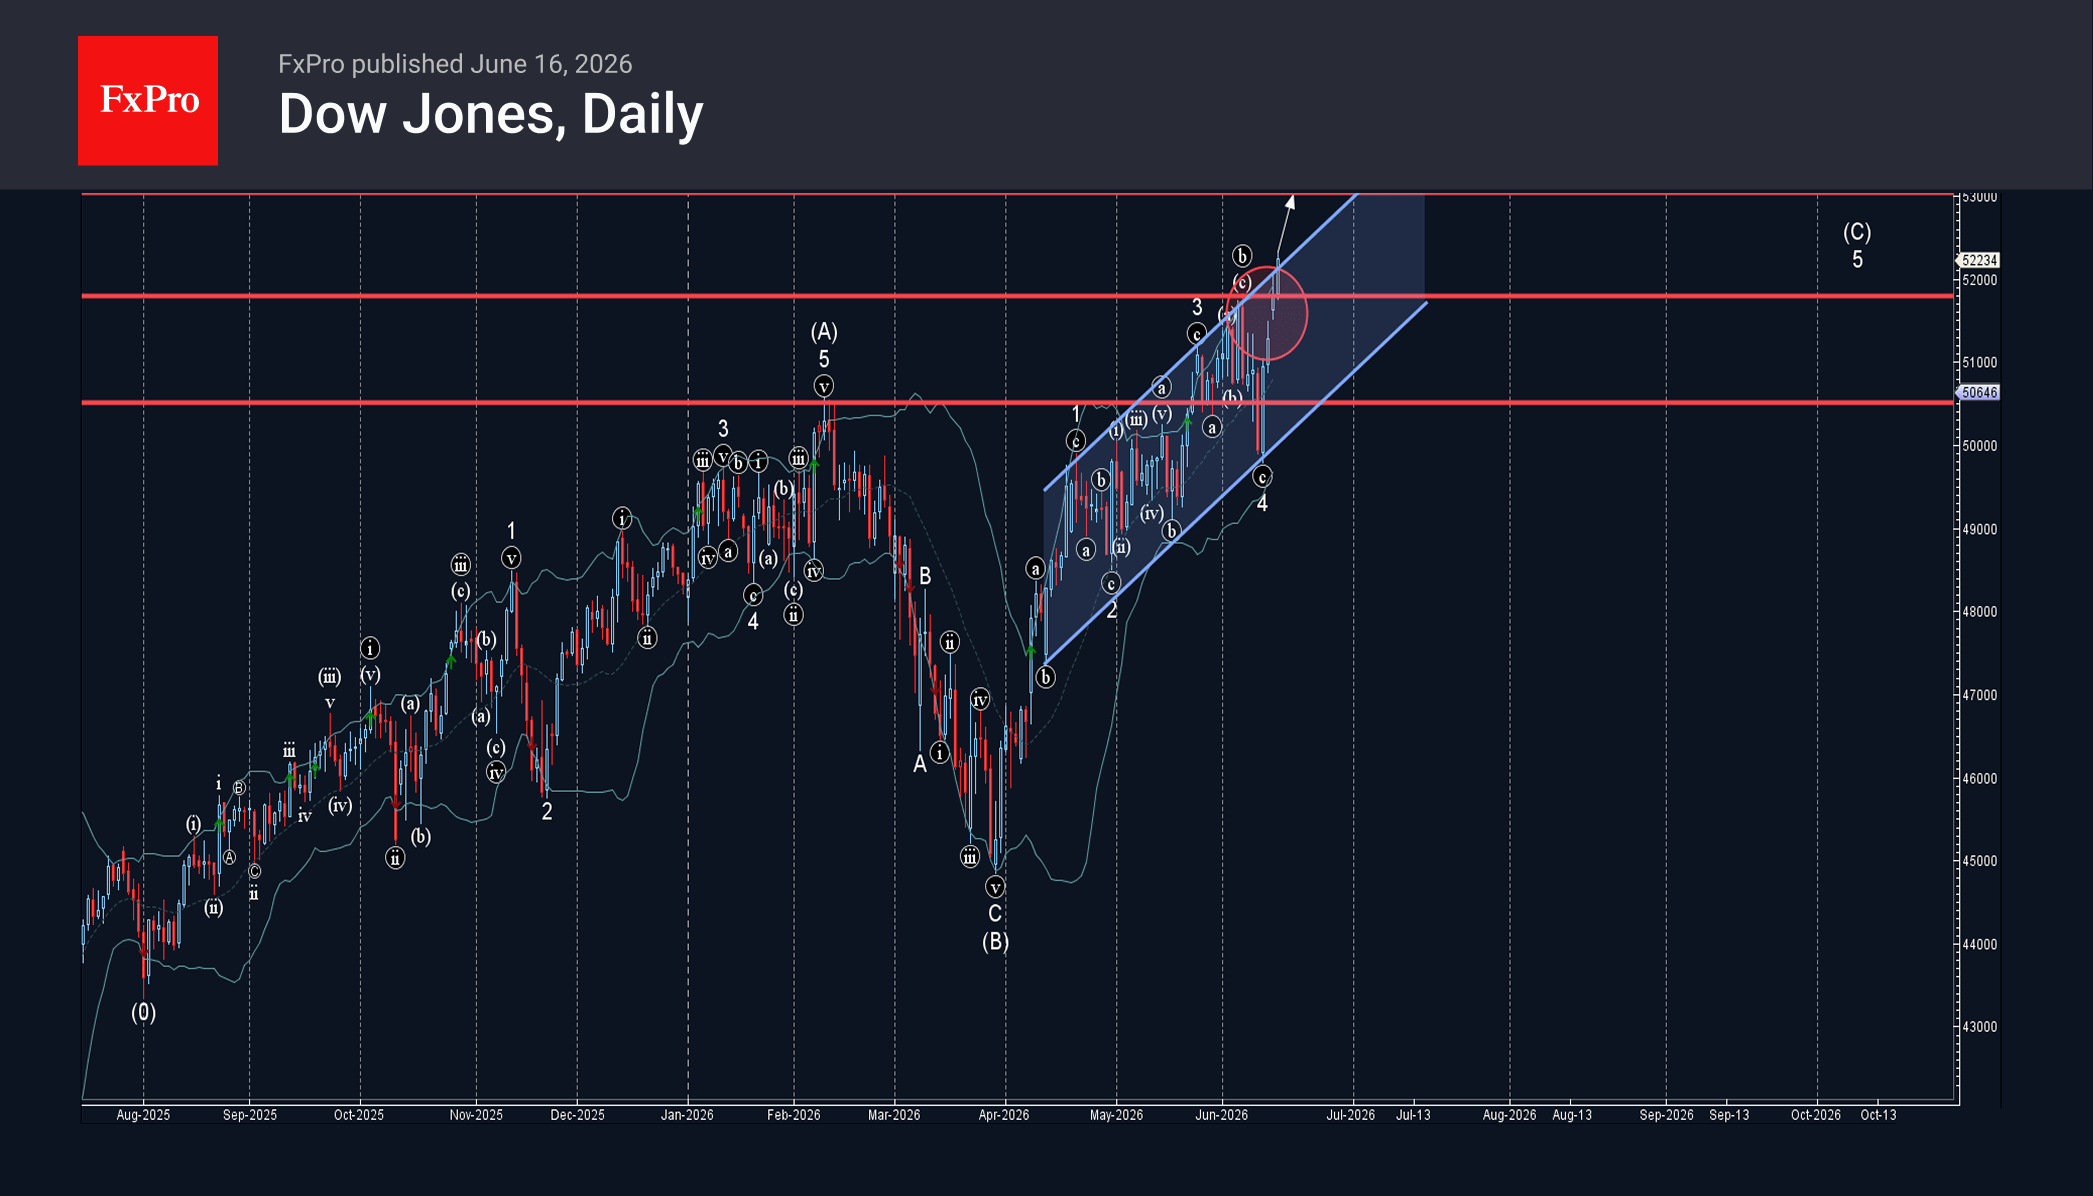
Dow Jones Wave Analysis – 16 June 2026
Dow Jones: ⬆️ Buy
– Dow Jones broke resistance level 51800.00
– Likely to rise to resistance level 53000.00
Dow Jones index recently broke the resistance zone between the resistance level 51800.00 (which stopped wave b at the start of June as can be seen below) and the resistance trendline of the daily up channel from April.
The breakout of this resistance zone accelerated the active minor impulse wave 5 of the sharp upward impulse sequence (C) from March.
Given the overriding daily uptrend, Dow Jones index can be expected to rise to the next resistance level 53000.00 (target price for the completion of the active wave 5).
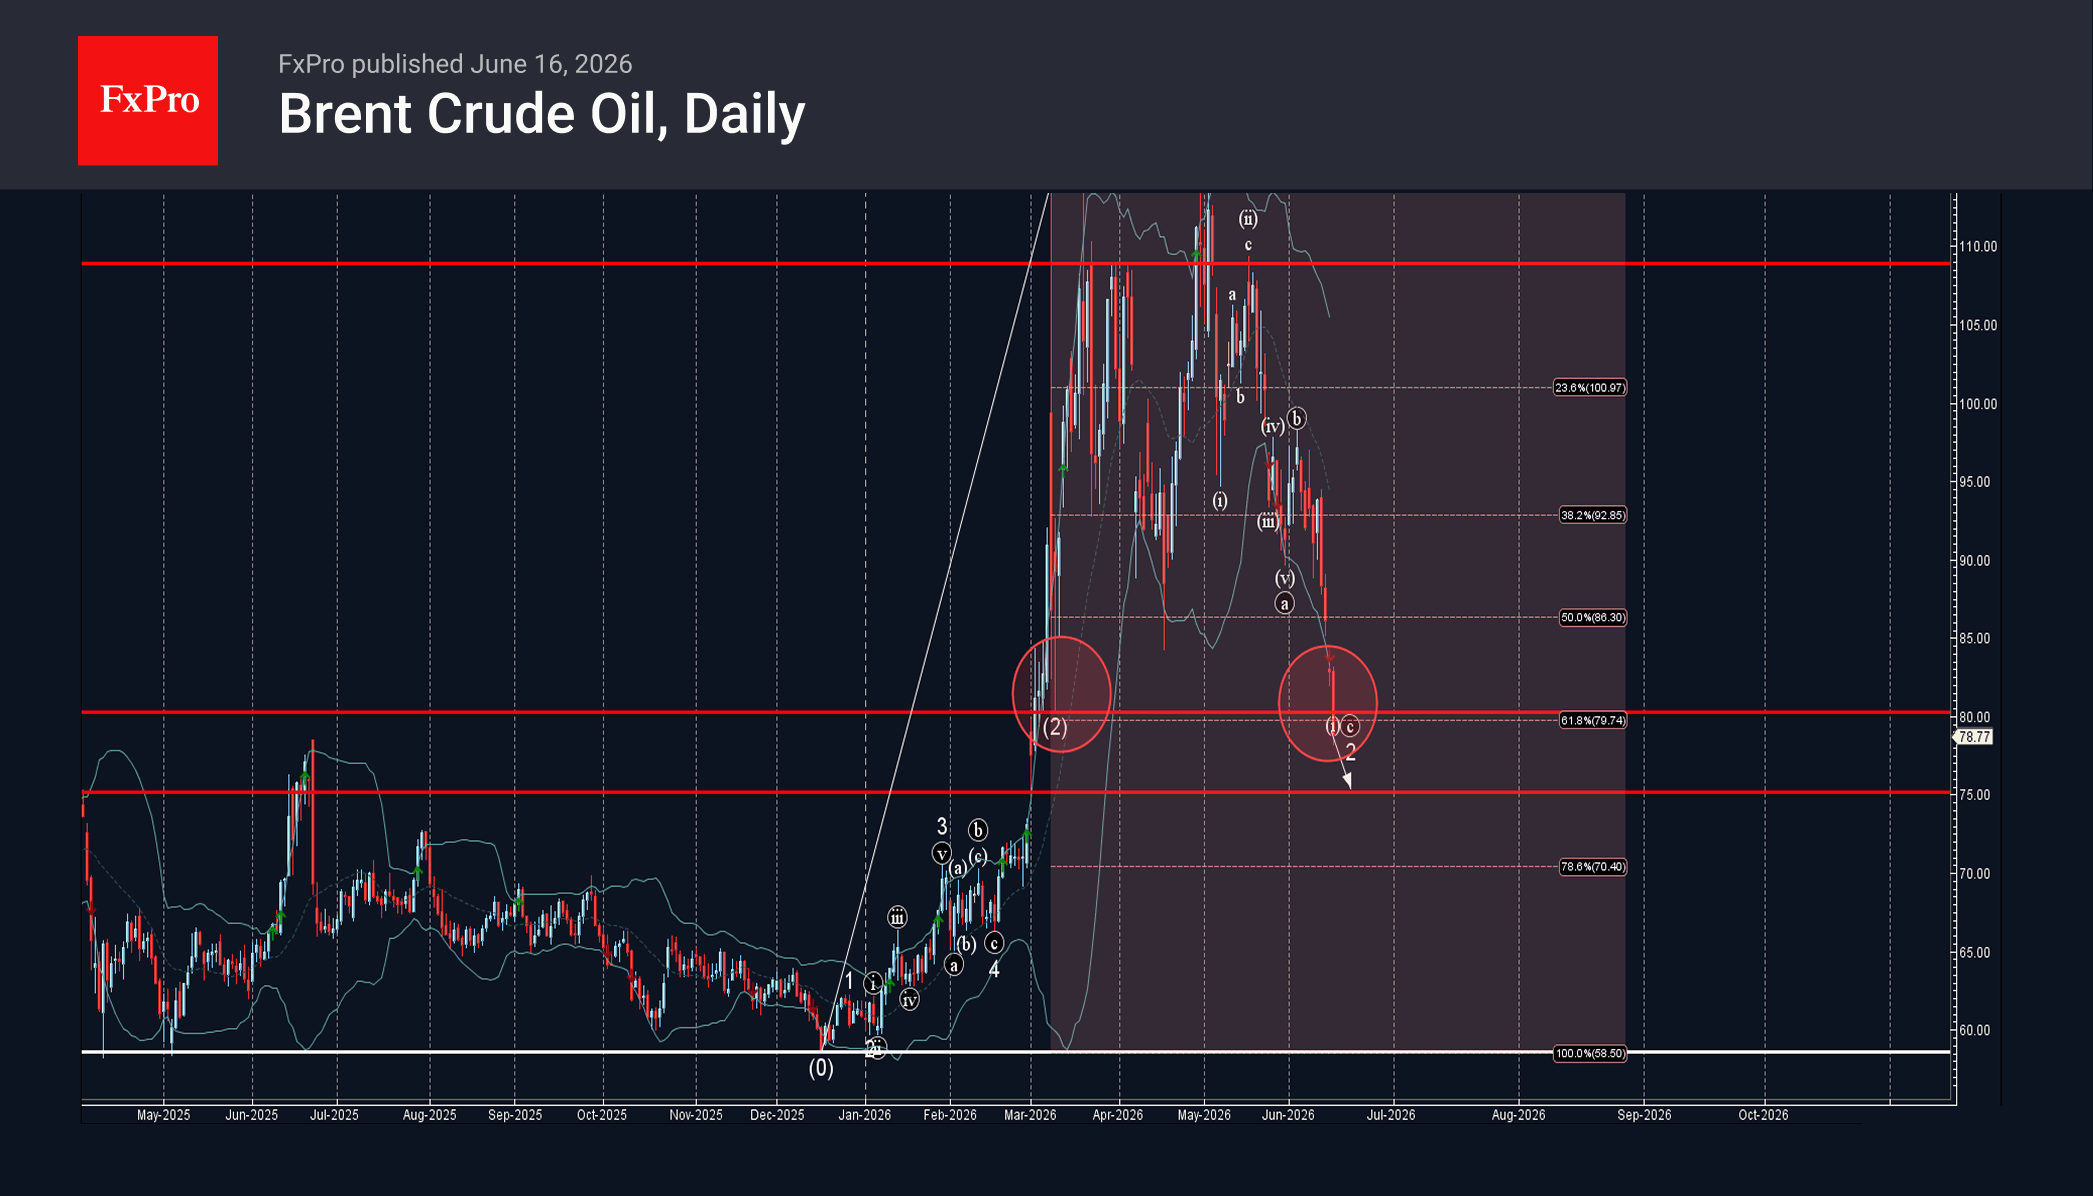
Brent Crude Oil Wave Analysis – 16 June 2026
Brent crude oil: ⬇️ Sell
– Brent crude oil broke round support level 80.00
– Likely to fall to support level 75.00
Brent crude oil recently broke the support zone between the round support level 80.00 (which stopped wave (2) at the start of March as can be seen below) and the 61.8% Fibonacci correction of the upward impulse from December.
The breakout of this support zone accelerated the C-wave of the active ABC correction 2 from the start of May.
Brent crude oil can be expected to fall to the next support level 75.00 (target price for the completion of the active wave c).
Eco Data 6/17/26
| GMT | Ccy | Events | Act | Cons | Prev | Rev |
|---|---|---|---|---|---|---|
| 22:45 | NZD | Current Account (NZD) Q1 | -1.01B | -1.19B | -5.98B | -5.64B |
| 23:50 | JPY | Trade Balance (JPY) May | -0.09T | -0.21T | 0.24T | 0.20T |
| 23:50 | JPY | Machinery Orders M/M Apr | 8.70% | 4.10% | -9.40% | |
| 00:30 | AUD | Westpac Leading Index M/M May | 0.00% | 0.05% | 0.10% | |
| 06:00 | GBP | CPI M/M May | 0.20% | 0.40% | 0.70% | |
| 06:00 | GBP | CPI Y/Y May | 2.80% | 3.00% | 2.80% | |
| 06:00 | GBP | Core CPI Y/Y May | 2.60% | 2.70% | 2.50% | |
| 06:00 | GBP | RPI M/M May | 0.20% | 0.70% | ||
| 06:00 | GBP | RPI Y/Y May | 3.10% | 3.30% | 3.00% | |
| 06:00 | GBP | PPI - Input M/M May | 0.20% | 0.50% | 2.40% | 2.60% |
| 06:00 | GBP | PPI - Input Y/Y May | 8.70% | 8.80% | 7.70% | 7.90% |
| 06:00 | GBP | PPI - Output M/M May | 0.50% | 0.50% | 1.40% | 1.50% |
| 06:00 | GBP | PPI - Output Y/Y May | 4.00% | 4.00% | 4.00% | 4.10% |
| 06:00 | GBP | PPI Core Output M/M May | 0.80% | 0.40% | 0.70% | |
| 06:00 | GBP | PPI Core Output Y/Y May | 2.30% | 2.40% | 2.60% | |
| 09:00 | EUR | Eurozone CPI Y/Y May F | 3.20% | 3.20% | 3.20% | |
| 09:00 | EUR | Eurozone Core CPI Y/Y May F | 2.60% | 2.50% | 2.50% | |
| 12:30 | CAD | New Housing Price Index M/M May | -0.30% | -0.10% | -0.40% | |
| 12:30 | USD | Retail Sales M/M May | 0.90% | 0.50% | 0.50% | 0.40% |
| 12:30 | USD | Retail Sales ex Autos M/M May | 0.80% | 0.50% | 0.70% | |
| 14:00 | USD | Pending Home Sales M/M May | 3.80% | 1.30% | 1.40% | 0.30% |
| 14:00 | USD | Business Inventories Apr | 0.50% | 0.50% | 0.90% | 1.00% |
| 14:30 | USD | Crude Oil Inventories (Jun 12) | -8.3M | -3.6M | -7.2M | |
| 18:00 | USD | Fed Interest Rate Decision | 3.75% | 3.75% | 3.75% | |
| 18:30 | USD | FOMC Press Conference |
| 22:45 | NZD |
| Current Account (NZD) Q1 | |
| Actual | -1.01B |
| Consensus | -1.19B |
| Previous | -5.98B |
| Revised | -5.64B |
| 23:50 | JPY |
| Trade Balance (JPY) May | |
| Actual | -0.09T |
| Consensus | -0.21T |
| Previous | 0.24T |
| Revised | 0.20T |
| 23:50 | JPY |
| Machinery Orders M/M Apr | |
| Actual | 8.70% |
| Consensus | 4.10% |
| Previous | -9.40% |
| 00:30 | AUD |
| Westpac Leading Index M/M May | |
| Actual | 0.00% |
| Consensus | |
| Previous | 0.05% |
| Revised | 0.10% |
| 06:00 | GBP |
| CPI M/M May | |
| Actual | 0.20% |
| Consensus | 0.40% |
| Previous | 0.70% |
| 06:00 | GBP |
| CPI Y/Y May | |
| Actual | 2.80% |
| Consensus | 3.00% |
| Previous | 2.80% |
| 06:00 | GBP |
| Core CPI Y/Y May | |
| Actual | 2.60% |
| Consensus | 2.70% |
| Previous | 2.50% |
| 06:00 | GBP |
| RPI M/M May | |
| Actual | 0.20% |
| Consensus | |
| Previous | 0.70% |
| 06:00 | GBP |
| RPI Y/Y May | |
| Actual | 3.10% |
| Consensus | 3.30% |
| Previous | 3.00% |
| 06:00 | GBP |
| PPI - Input M/M May | |
| Actual | 0.20% |
| Consensus | 0.50% |
| Previous | 2.40% |
| Revised | 2.60% |
| 06:00 | GBP |
| PPI - Input Y/Y May | |
| Actual | 8.70% |
| Consensus | 8.80% |
| Previous | 7.70% |
| Revised | 7.90% |
| 06:00 | GBP |
| PPI - Output M/M May | |
| Actual | 0.50% |
| Consensus | 0.50% |
| Previous | 1.40% |
| Revised | 1.50% |
| 06:00 | GBP |
| PPI - Output Y/Y May | |
| Actual | 4.00% |
| Consensus | 4.00% |
| Previous | 4.00% |
| Revised | 4.10% |
| 06:00 | GBP |
| PPI Core Output M/M May | |
| Actual | 0.80% |
| Consensus | 0.40% |
| Previous | 0.70% |
| 06:00 | GBP |
| PPI Core Output Y/Y May | |
| Actual | 2.30% |
| Consensus | |
| Previous | 2.40% |
| Revised | 2.60% |
| 09:00 | EUR |
| Eurozone CPI Y/Y May F | |
| Actual | 3.20% |
| Consensus | 3.20% |
| Previous | 3.20% |
| 09:00 | EUR |
| Eurozone Core CPI Y/Y May F | |
| Actual | 2.60% |
| Consensus | 2.50% |
| Previous | 2.50% |
| 12:30 | CAD |
| New Housing Price Index M/M May | |
| Actual | -0.30% |
| Consensus | -0.10% |
| Previous | -0.40% |
| 12:30 | USD |
| Retail Sales M/M May | |
| Actual | 0.90% |
| Consensus | 0.50% |
| Previous | 0.50% |
| Revised | 0.40% |
| 12:30 | USD |
| Retail Sales ex Autos M/M May | |
| Actual | 0.80% |
| Consensus | 0.50% |
| Previous | 0.70% |
| 14:00 | USD |
| Pending Home Sales M/M May | |
| Actual | 3.80% |
| Consensus | 1.30% |
| Previous | 1.40% |
| Revised | 0.30% |
| 14:00 | USD |
| Business Inventories Apr | |
| Actual | 0.50% |
| Consensus | 0.50% |
| Previous | 0.90% |
| Revised | 1.00% |
| 14:30 | USD |
| Crude Oil Inventories (Jun 12) | |
| Actual | -8.3M |
| Consensus | -3.6M |
| Previous | -7.2M |
| 18:00 | USD |
| Fed Interest Rate Decision | |
| Actual | 3.75% |
| Consensus | 3.75% |
| Previous | 3.75% |
| 18:30 | USD |
| FOMC Press Conference | |
| Actual | |
| Consensus | |
| Previous | |
Gold Is Finding Its Footing
Gold has surged at its fastest pace in two months following reports that Donald Trump has called off strikes against Iran. The precious metal extended its rally on news of a deal between Washington and Tehran. With tensions easing, the outlook for Gold is improving. After dropping 18% from its highs and hitting its lowest level since November 2025, investors are once again seeing reasons for optimism.
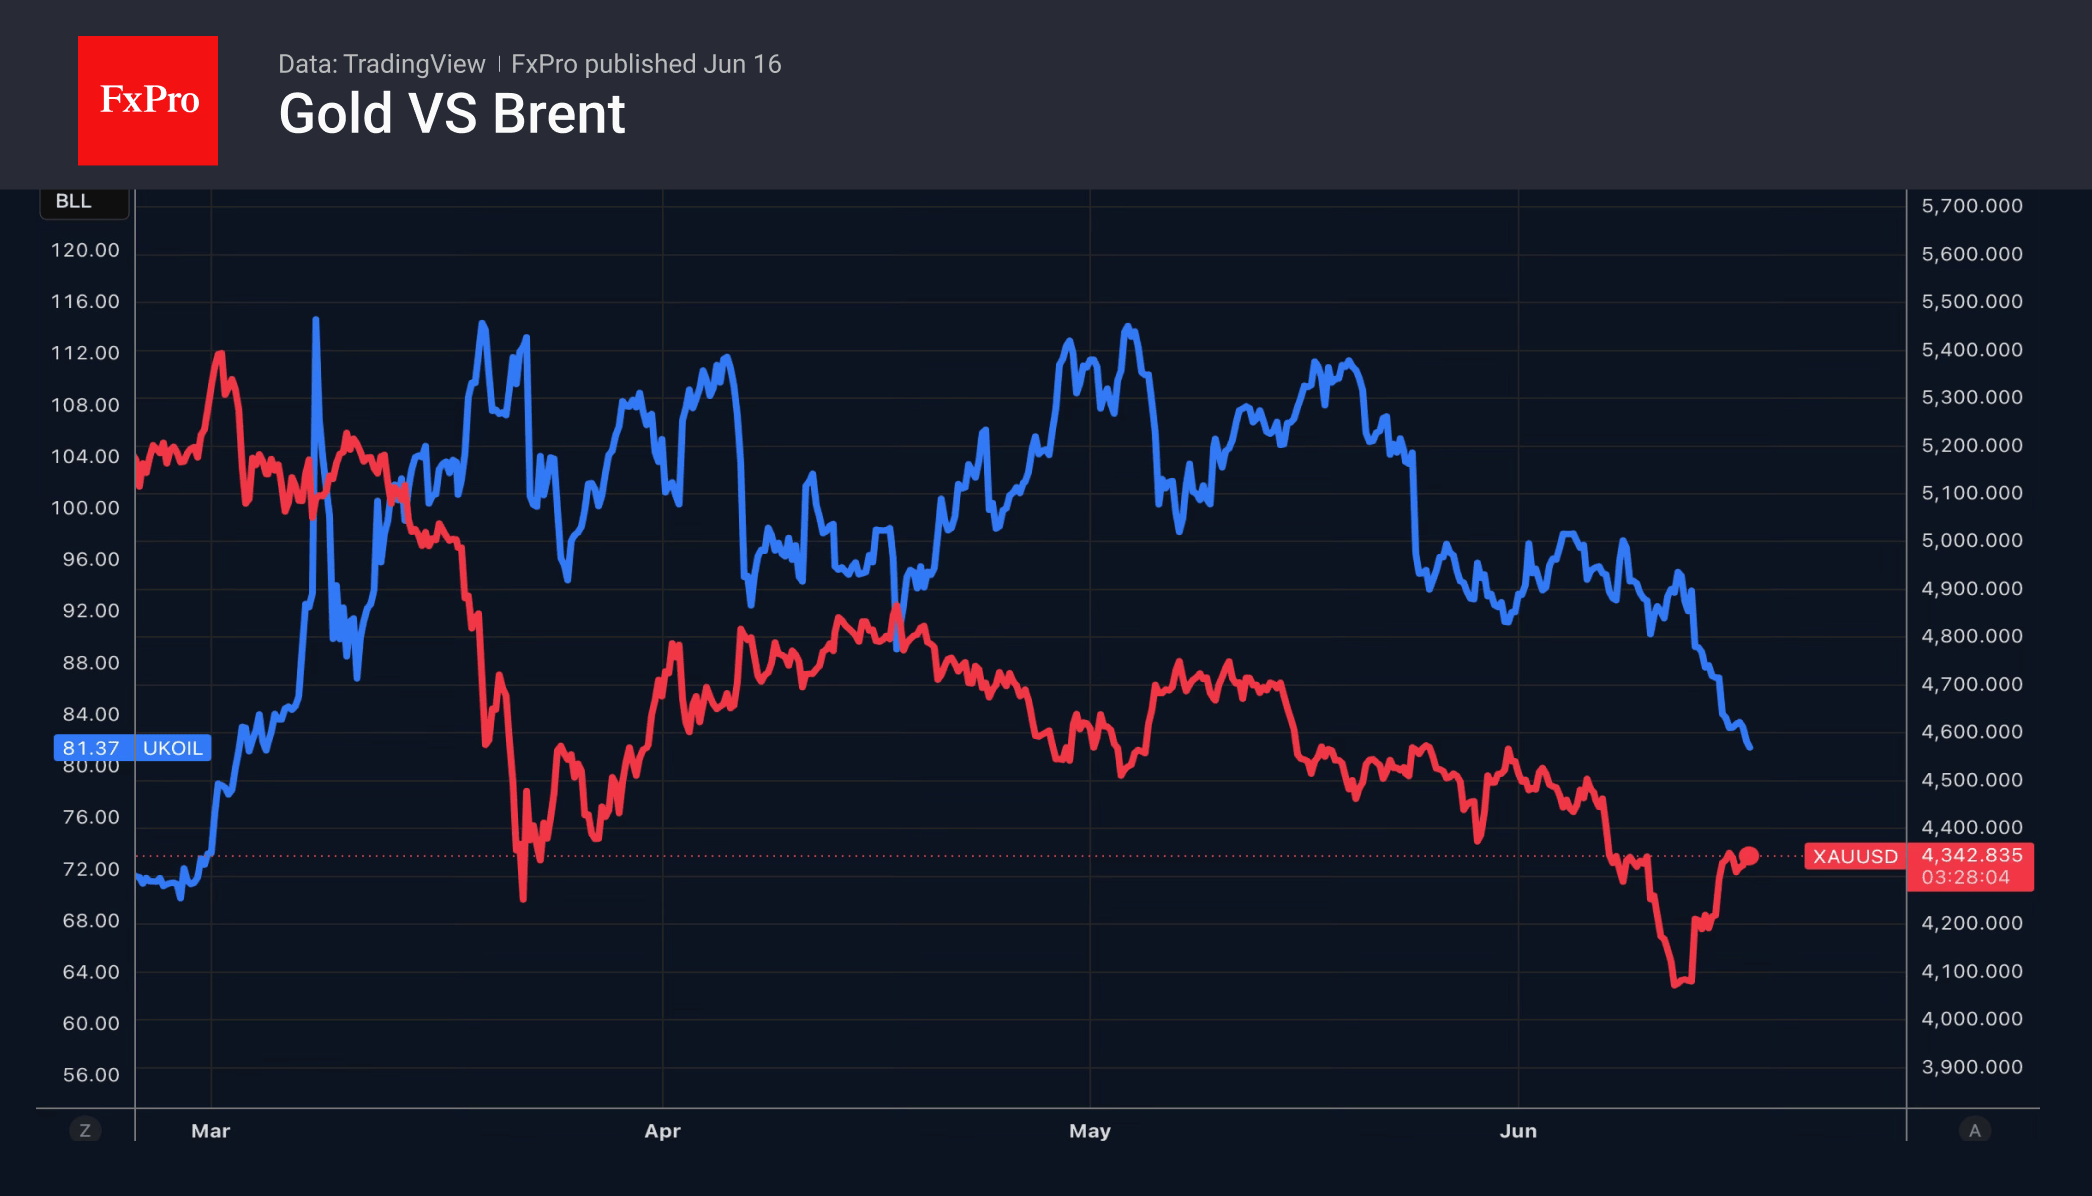
Since the start of the geopolitical conflict, the precious metal has moved in the opposite direction to oil, so the fall in Brent has allowed gold to find its footing. Higher energy prices heighten the risks of inflation becoming entrenched at elevated levels and increase the likelihood of the Fed tightening monetary policy. This creates a headwind for gold, whilst the end of the conflict in the Middle East becomes a tailwind.
The precious metal’s rebound is being driven by US stock indices returning to record highs. The history of gold’s transformation into a risky asset dates back to 2025. At that time, gold prices jumped by 65%, whilst the New York Stock Exchange mining index rose by a record 155%. Gold can also serve as a source of liquidity, with investors selling it during stock market downturns to meet margin requirements.
Another factor set to drive gold’s growth is increased demand for bullion from central banks. According to the WGC, 45% of the 76 central banks that responded to the survey plan to buy gold over the next 12 months. This is a record high since such surveys began in 2018. In emerging markets, this figure stands at 53%.
Taken together, easing tensions in the Middle East, lower oil prices, a reduced likelihood of further Fed tightening in 2026, stronger equity markets and robust central bank demand are creating a more supportive backdrop for gold, potentially paving the way for a broader recovery in prices.
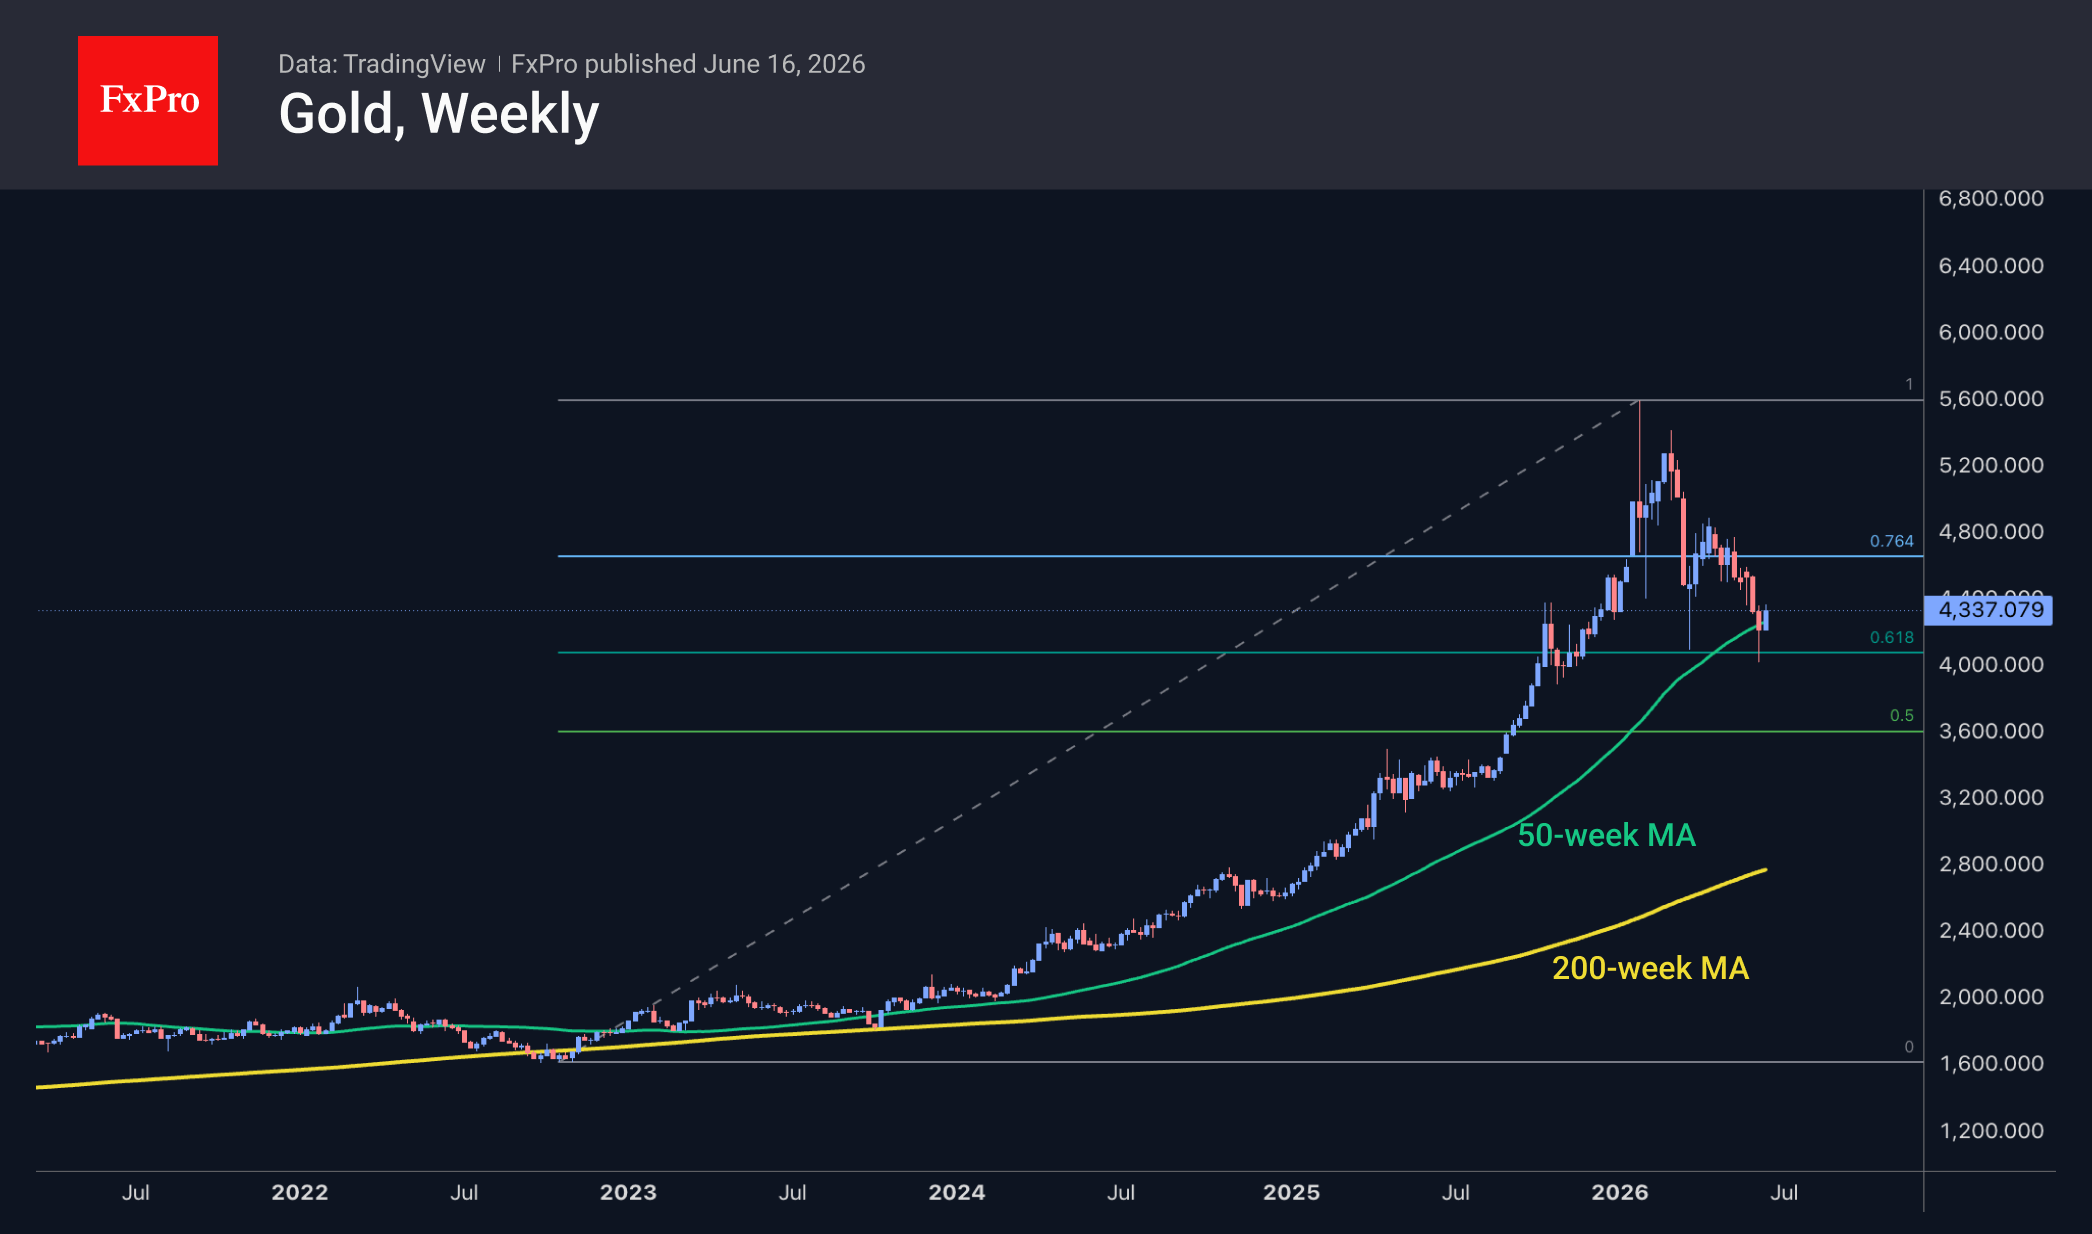
The technical picture also favours the bulls, showing a striking surge in buying activity from the 61.8% Fibonacci support level of the 2022–2025 rally. Further confirmation of the reversal comes from the bounce off the 50-week moving average, which turned sharply upwards after slipping at the start of June.
The FxPro Analyst Team
Sunset Market Commentary
Markets
Oil prices are correcting lower again today, with Brent crude testing the USD 80/bbl level for the first time since the Middle East conflict erupted in early March. Markets are still repositioning following the interim agreement reached between the US and Iran. We would caution against excessive optimism, as many issues still need to be resolved during what is reportedly a 60-day ceasefire extension. The fact that different versions of the agreement continue to circulate is not particularly reassuring. In terms of actual oil supply, it will likely take several weeks at a minimum before production and shipping flows recover meaningfully. Nevertheless, risk sentiment remains constructive for a second consecutive day, with the EuroStoxx 50 posting another record high, gaining 0.7%.
Yesterday's rally on Wall Street has shifted into a lower gear, with the Nasdaq opening little changed. Dollar resilience is keeping EUR/USD contained around 1.1600, while DXY remains near 99.6. The yen continues to receive little support from the widely anticipated BoJ rate hike to 1.0%, with USD/JPY trading back above 160. The ongoing decline in energy prices is compressing inflation risk premia and particularly weighing on the long end of yield curves. German yields are lower by around 3bps in the 10- to 30-year sector, while short-term yields have broadly stabilized. Money markets continue to price in one additional ECB rate hike later this year.
A similar bull-flattening pattern is visible in both the US Treasury curve, where yields are down 1.2-3.0bps, and the UK gilt curve, where yields are lower by 0.4-2.8bps, in otherwise technically insignificant trading. Central banks in both the US and UK meet tomorrow and Thursday, respectively. The Bank of England is expected to leave rates unchanged, while the Federal Reserve under Kevin Warsh is expected to remove its dovish bias from the policy statement. Warsh has promised a regime change at the Fed, including changes to how the institution communicates. This could affect the frequency of press conferences, which under Jerome Powell took place after every meeting, the number of public appearances by policymakers, and the future of the dot plot, particularly the interest-rate projections. Warsh has also expressed a preference for alternative inflation measures, such as trimmed-mean inflation, to gauge underlying price trends. He has repeatedly criticized the size of the Fed's balance sheet and favors a return to more traditional policy implementation through the policy rate. While such changes would take time to implement, markets are likely to focus on these issues during the press conference. Investors will also seek clues about Warsh's personal policy bias. Having been absent from monetary policy debates for an extended period, his stance remains difficult to assess, although the prevailing market view still leans toward seeing him as relatively dovish.
News & Views
The German ZEW expectations index rose sharply in June, increasing by 20.7 points to 10.5. The assessment of the current economic situation deteriorated slightly, falling 3.2 points to -81.0. According to ZEW, “The ZEW Indicator returns to positive territory as financial market experts expect the Iran conflict to be nearing an end. This is likely to ease the massive pressure on energy prices and inflation, benefiting energy-intensive industries and households while strengthening domestic demand.” Improved expectations were recorded across several sectors, including automotive, chemicals, pharmaceuticals and mechanical engineering. Expectations for private demand also improved substantially. However, despite these gains, sentiment balances in most sectors remain negative. The services sector improved modestly, rising to 16.7 from 13.2, while construction weakened sharply, falling 15.2 points to -12.0. Eurozone expectations also improved significantly, rising 18.6 points to 9.5, although the assessment of current conditions remained deeply negative at -43.4.
The National Bank of Poland today released core inflation data for May. Recall that Poland's statistical office had already reported softer-than-expected headline inflation, which fell by 0.3% m/m and slowed to 3.1% y/y. Core inflation excluding food and energy prices declined by 0.1% m/m and eased to 3.1% y/y. Inflation excluding administered prices fell by 0.4% m/m and slowed to 2.8% y/y from 2.9% previously. Trimmed-mean inflation stood at 3.3% y/y, while the monthly increase was limited to just 0.1%. The NBP targets inflation at 2.5% ±1 percentage point. In line with broader global market trends, Polish yields have fallen sharply in recent days as easing concerns over the Iran conflict and lower oil prices have reduced inflation fears.
At the June policy meeting, NBP Governor Glapinski indicated that policy rates were sufficiently high to stabilize inflation. Other Monetary Policy Council members have recently maintained a similarly cautious tone, with some suggesting a prolonged period of rate stability and others leaving open the possibility that the next move could eventually be a rate cut. The NBP policy rate currently stands at 3.75%. The PLN 2-year swap yield has declined from above 4.50% a week ago to around 4.03% currently. Meanwhile, the zloty continues to trade in a relatively tight range around EUR/PLN 4.25.
Oil Crashes Below $80, But Markets Hold Fire Ahead of Fed Decision
The biggest move in global markets is still happening in oil. The most important move may come tomorrow.
Brent crude plunged below USD 80 today, extending a dramatic collapse that began after the United States and Iran reached a provisional peace agreement over the weekend. The decline accelerated after President Donald Trump arrived at the G7 summit and declared that the peace framework had already been signed, adding that the Strait of Hormuz would fully reopen on Friday and remain free of Iranian tolls. With a formal signing ceremony scheduled in Geneva later this week, traders are increasingly treating the normalization of oil supply as a certainty rather than a possibility.
That helps explain why Brent's decline has become so relentless. Markets are no longer pricing a ceasefire. They are pricing ships moving freely through Hormuz again. They are pricing Iranian exports returning. They are pricing the gradual removal of a war premium that dominated energy markets for months. The peace trade is still alive, but at this stage it is largely concentrated in crude oil itself.
Elsewhere, the reaction has been surprisingly muted. US futures are little changed. European equities are modestly higher. Asian markets finished mixed. Currency markets have been even quieter, with most major pairs trapped within yesterday's ranges. In other words, investors appear to believe that the geopolitical story is largely understood. The focus has already shifted to what comes next.
Even central-bank decisions in Asia Pacific are quickly fading from view. The Yen's post-BoJ-hike rally evaporated almost as quickly as it appeared, while the Australian Dollar recovered after the RBA's widely expected hold. Today's currency rankings tell a story of hesitation rather than conviction. The Euro is narrowly leading gains, followed by Sterling and the New Zealand Dollar. The Swiss Franc sits at the bottom, while the Dollar and Yen occupy the middle ground. The differences between them are small, reflecting a market reluctant to take major positions ahead of Wednesday's Federal Reserve decision.
That caution looks justified. Markets broadly expect the Fed to keep rates unchanged at 3.50%-3.75%, but there is far less certainty about the message accompanying the decision. According to CNBC's latest survey, 88% of respondents expect policymakers to remove the easing bias that previously suggested the next move would likely be a rate cut. At the same time, 81% do not expect the Fed to go so far as to explicitly signal a future rate hike. That leaves investors bracing for a potentially hawkish shift in tone without a corresponding tightening signal.
The market spent the past three months asking whether peace would come to the Middle East. It increasingly believes that answer is yes. The next question is whether the Federal Reserve believes the inflation damage left behind by the conflict is beginning to fade. Brent crude is still trading the peace deal. By this time tomorrow, the rest of the market will likely be trading Kevin Warsh.
Bitcoin Rally Faces Two Major Hurdles Before Bullish Reversal Can Be Confirmed
Bitcoin has defended 60,000. Now it must prove the rebound is real. Improving risk sentiment and stronger ETF inflows have pushed prices back above 66,000, but two major resistance levels still stand between the current rally and a confirmed trend reversal. Read More.
AUD/JPY Weakens After BoJ Hike and RBA Hold, Risks Build Towards 112 and Below
The BoJ hiked. The RBA paused. AUD/JPY noticed. Neither decision surprised markets, but traders appear increasingly convinced that Japan's tightening cycle still has room to run while Australia's may be entering a pause. That shift is beginning to show up on the charts. Read More.
BoJ Reaches Key Milestone With First 1% Interest Rate Since 1995
A historic milestone, but not a policy surprise. The Bank of Japan raised rates to their highest level in 31 years, yet markets are paying closer attention to signs that future normalization could proceed more slowly. Read More.
RBA Holds at 4.35% but Keeps Tightening Bias Alive
The RBA paused, but it didn't sound comfortable. Policymakers held rates at 4.35% while warning that fuel costs are feeding through to broader inflation and that price pressures are likely to stay high for some time. The door to further tightening remains open, but not wide enough to make an August hike the base case. Read More.
German ZEW Sentiment Jumps to 10.5 as Iran Peace Hopes Lift Outlook
Investors are looking past today's weakness. ZEW sentiment surveys jumped back into positive territory as financial markets increasingly bet that the Middle East conflict is nearing an end and energy pressures will ease. Read More.
China's Retail Sales Fall for First Time Since 2022 as Domestic Demand Slumps
China's factories are producing more, but consumers are buying less. Industrial production beat expectations in May, yet retail sales fell for the first time since 2022 and investment weakened sharply. The gap between supply and demand is becoming harder to ignore. Read More.
USD/JPY Daily Outlook
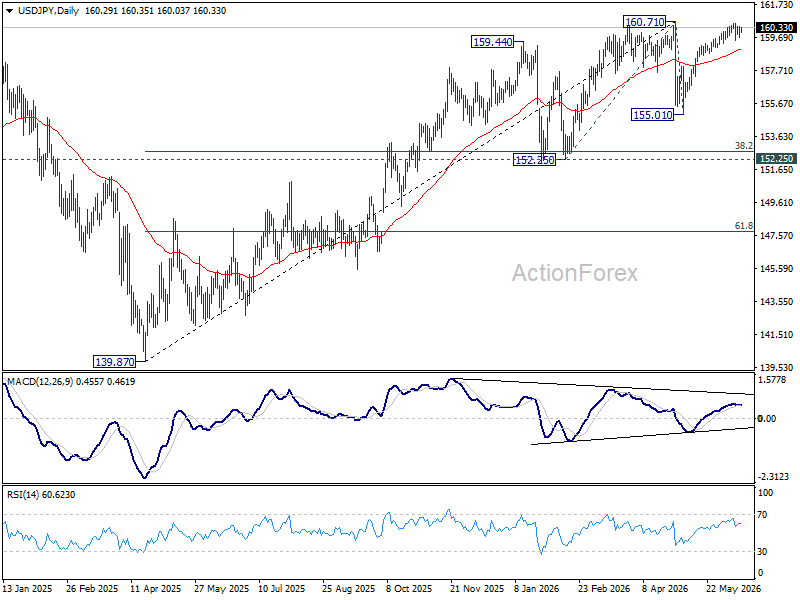
Range trading continues in USD/JPY and intraday bias stays neutral. On the downside, break of 159.54 will extend the fall from 160.58 short term top to 38.2% retracement of 155.01 to 160.58 at 158.45. However, decisive break of 160.71 will confirm up trend resumption. That should push USD/JPY through 161.94 to 100% projection of 152.25 to 160.71 from 155.01 at 163.47 next.
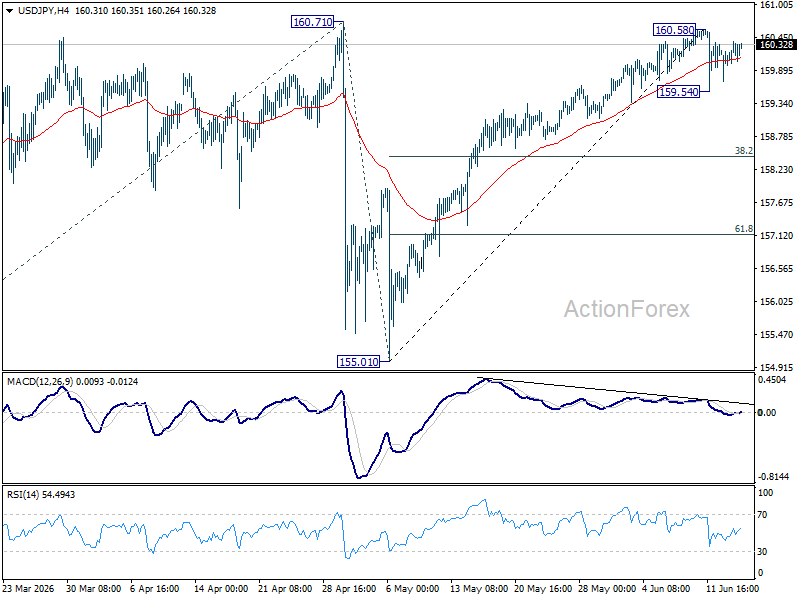
In the bigger picture, for now, corrective pattern from 161.94 (2024 high) is still seen as completed at 139.87. Rise from there is seen as resuming the long term up trend. So, break of 161.94 is expected at a later stage to resume the long term up trend. However, sustained break of 55 W EMA (now at 155.13) will dampen this view and bring deeper fall back towards 139.87 to extend the pattern from 161.94.