Sample Category Title
Oil Shocks Are Not What They Used to Be. Prices May Have Further to Fall
Over the past three months, oil markets have witnessed something extraordinary. The largest supply shock in history has — this time — failed to trigger a deep energy crisis. With only slight exaggeration, one could say that oil shocks are no longer what they used to be. Following the US-Iran agreement, it is now increasingly likely that conditions in the oil market will begin to normalise relatively quickly.
How fast could that return be? Given the unprecedented scale of the supply disruption, views differ considerably. We are, however, cautiously optimistic. If the Strait of Hormuz is safely navigable and shipping is no longer burdened by extraordinary costs, oil from temporarily shut-in fields could return to the market fairly quickly — within a matter of weeks. Pre-war production capacity could be restored within several months. Even that, however, may not be necessary to close the market deficit, as production outside OPEC has increased in the meantime, while oil demand has weakened.
Another positive factor is that, unlike in previous Middle Eastern conflicts, oil infrastructure has suffered only limited damage this time. The risk of long-lasting production losses therefore appears contained.
Still, the process of normalisation will be constrained by at least two factors. First, a risk premium is likely to remain embedded in prices over the coming months, reflecting persistent uncertainty about the precise terms of the agreement and its implementation. Over the longer term, Iran’s coercive leverage will likely remain a wild card: Tehran has demonstrated that it can bring the Strait of Hormuz under control relatively quickly.
Second, restoring stability to the oil market will require a rebuilding of inventories, which have been drawn down at a record pace over the past three months. In the world’s largest economies, inventories are now close to their lowest levels since at least 2003. Until commercial and strategic reserves are replenished, the oil market will remain vulnerable to renewed supply shocks.
At the same time, it is important to stress that the underlying fundamentals of the oil market have not changed materially. The long-run oil price remains relatively firmly anchored around USD 65 per barrel, broadly in line with the marginal cost of production for US shale producers. Moreover, the conflict in the Middle East has further weakened the OPEC cartel, following the departure of the UAE, which has a clear ambition to supply significantly more oil to global markets. If the supply side of the market fully normalises — including inventory levels — a return of oil prices to the USD 60–70 per barrel range is a realistic assumption.
This is also a crucial point from the perspective of the broader European economy. If an agreement is concluded swiftly and the Strait of Hormuz is reopened, the current energy shock would likely prove to have been temporary, limiting the further spilling-over effect on both inflation and economic growth. In that case, the recent rate increase by the ECB may be regarded as a measured and appropriate response to heightened uncertainty, while future policy decisions would remain guided by incoming data rather than signaling the start of a tightening cycle.
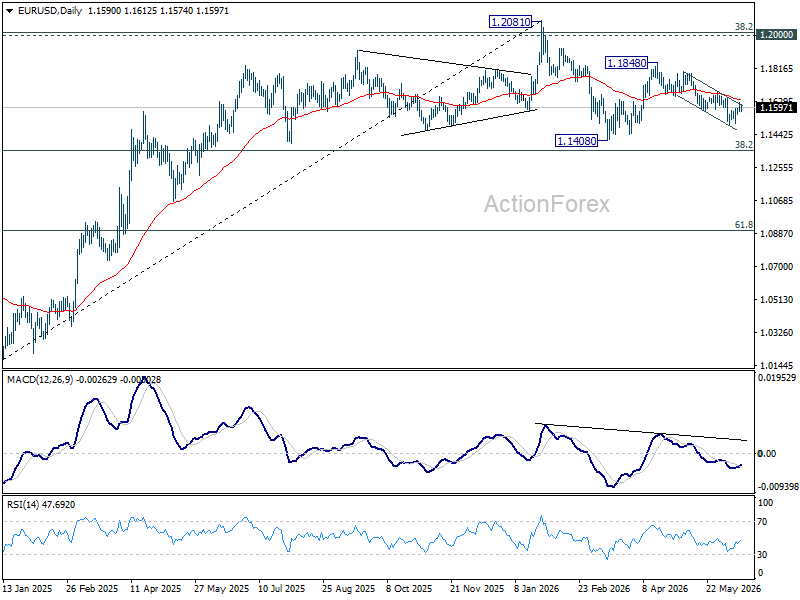
EUR/USD Daily Outlook
Intraday bias in EUR/USD stays neutral at this point, as range trading continues above 1.1499. Risk will stay on the downside as long as 1.1685 resistance holds. Break of 1.4992 will resume the fall from 1.1848 to retest 1.1408 low next.

In the bigger picture, the strong support from 38.2% retracement of 1.0176 to 1.2081 at 1.1353 suggests that the pullback from 1.2081 is more likely a corrective move. Strong support was also found in 55 W EMA (now at 1.1547). Focus is back on 1.2 key cluster resistance level. Decisive break there will carry long term bullish implications. Nevertheless, break of 1.1408 support will revive the case of medium term bearish trend reversal.
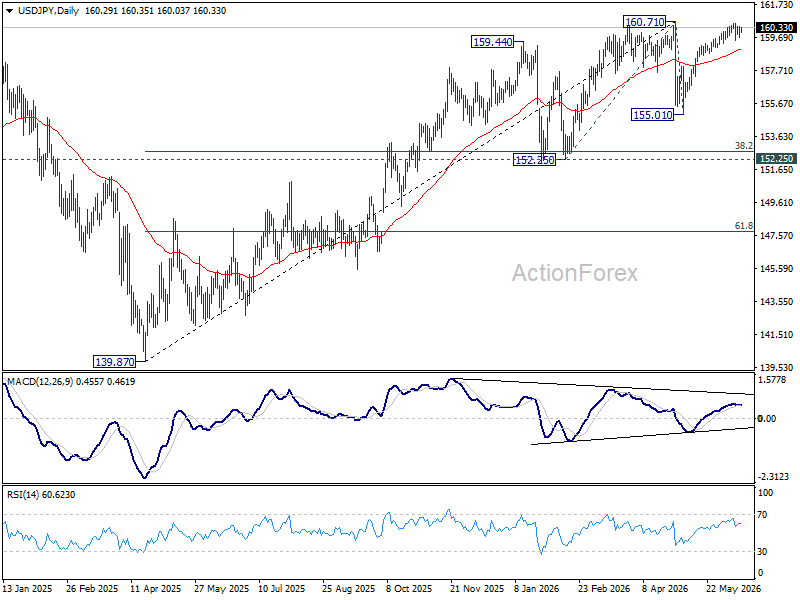
USD/JPY Daily Outlook
Range trading continues in USD/JPY and intraday bias stays neutral. On the downside, break of 159.54 will extend the fall from 160.58 short term top to 38.2% retracement of 155.01 to 160.58 at 158.45. However, decisive break of 160.71 will confirm up trend resumption. That should push USD/JPY through 161.94 to 100% projection of 152.25 to 160.71 from 155.01 at 163.47 next.
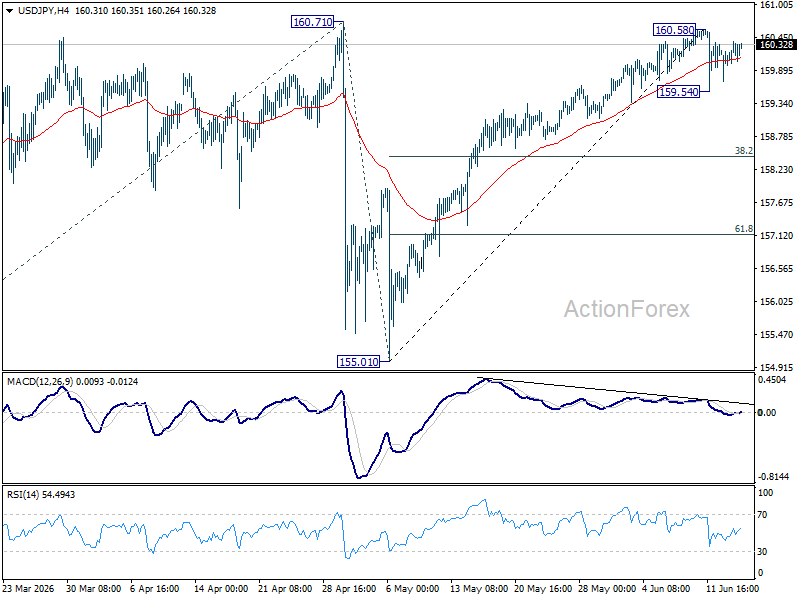
In the bigger picture, for now, corrective pattern from 161.94 (2024 high) is still seen as completed at 139.87. Rise from there is seen as resuming the long term up trend. So, break of 161.94 is expected at a later stage to resume the long term up trend. However, sustained break of 55 W EMA (now at 155.13) will dampen this view and bring deeper fall back towards 139.87 to extend the pattern from 161.94.
GBP/USD Daily Outlook
Intraday bias in GBP/USD stays neutral as sideway trading continues. Risk will stay mildly on the downside as long as 1.3508 resistance holds. Firm break of 1.3300 will resume the decline from 1.3657 to 1.3158 support next. However, break of 1.3508 will turn bias back to the upside for retesting 1.3657 instead.
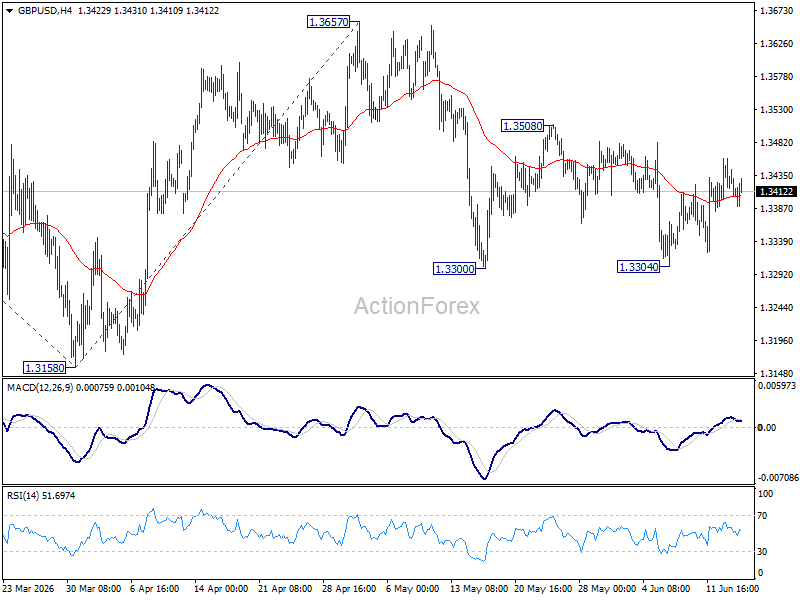
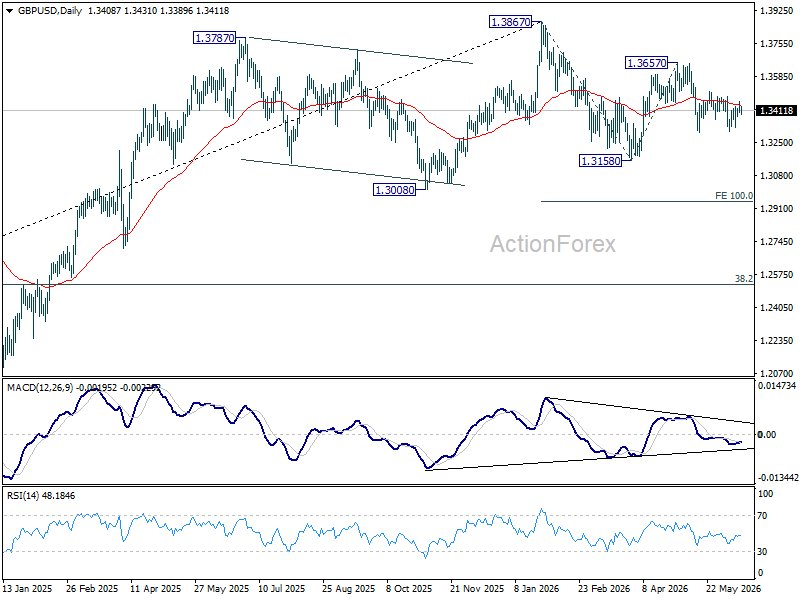
In the bigger picture, price actions from 1.3867 are a corrective pattern within the broader up trend from 1.0351 (2022 low). With 1.3008 support intact, medium term bullishness is maintained and break of 1.3867 is in favor for a later stage, towards 1.4248 key resistance (2021 high). However, firm break of 1.3008 will at least bring deeper fall to 38.2% retracement of 1.0351 to 1.3867 at 1.2524, with increased risk of bearish reversal.
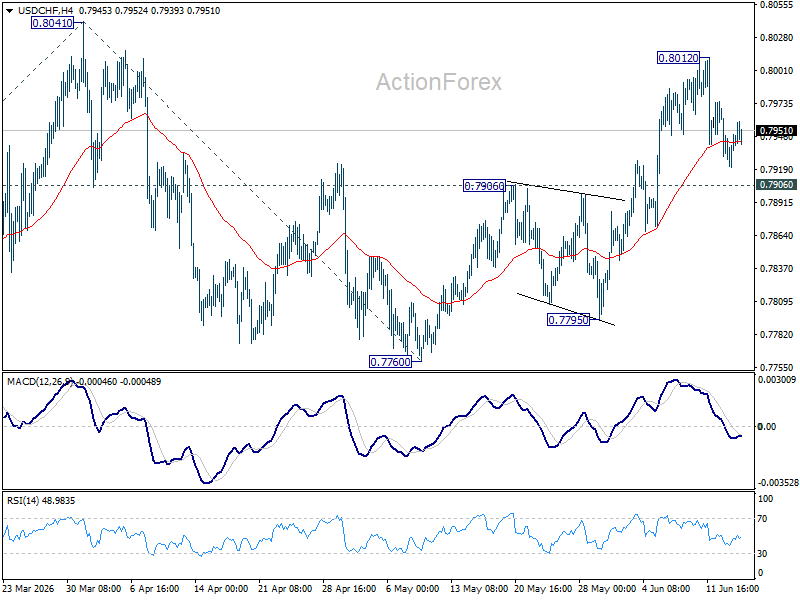
USD/CHF Daily Outlook
Intraday bias in USD/CHF remains neutral and more consolidations could be seen below 0.8012. Further rise is expected with 0.7906 resistance turned support intact. Above 0.8012 will bring retest 0f 0.8041 high. Firm break there will resume the rise from 0.7603 and target 100% projection 0.7603 to 0.841 from 0.7600 at 0.8198 next. However, sustained break break of 0.7906 will turn bias back to the downside for 0.7795 support instead.
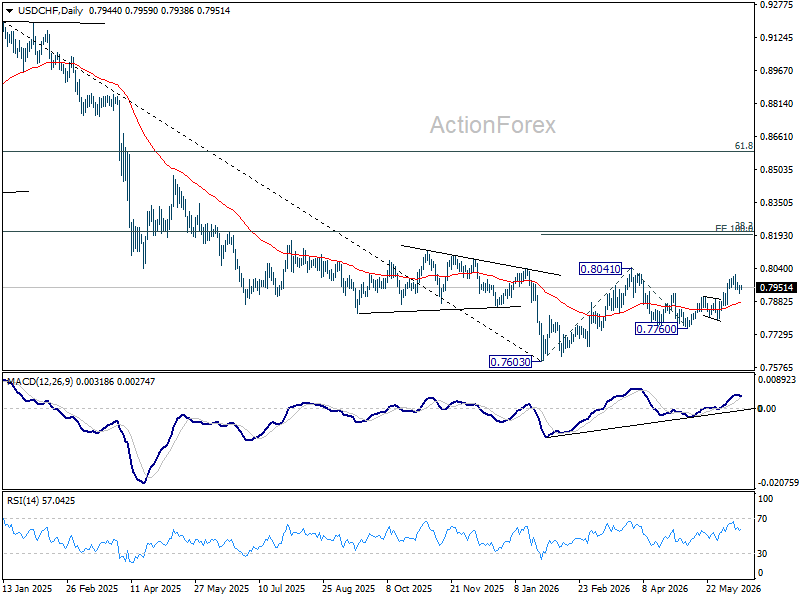
In the bigger picture, while a medium term bottom was formed at 0.7603, it's still early to call for bullish trend reversal. As long as 38.2% retracement of 0.9200 (2025 high) to 0.7603 at 0.8213 holds, the larger down trend could still continue through 0.7603 at a later stage. However, firm break of 0.7603 will argue that the trend has reversed and turn focus to 0.8332 support turned resistance (2023 low) for confirmation.
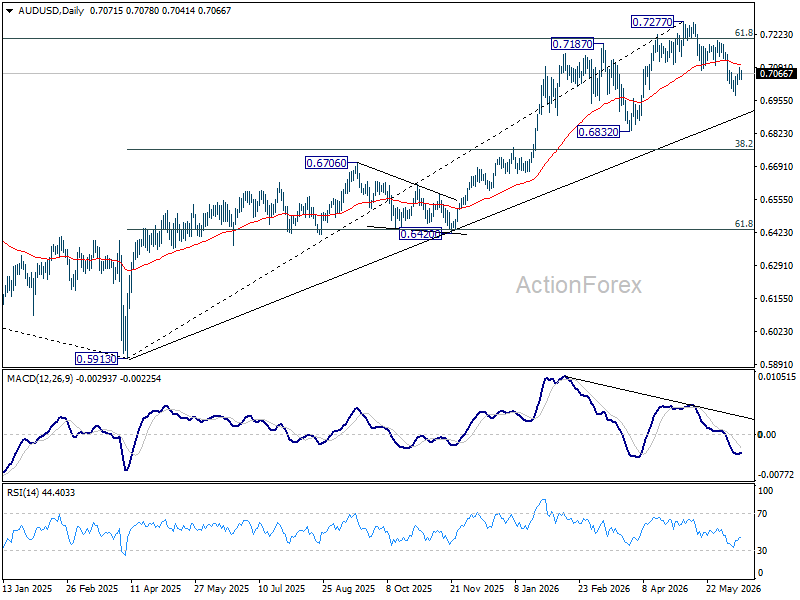
AUD/USD Daily Report
Intraday bias in AUD/USD stays mildly on the upside at this point. Fall from 0.7277 might have completed as a three wave correction at 0.6977. Further rise would be seen to 0.7200 resistance. On the downside, though, break of 0.6977 will resume the fall towards 0.6832 support.
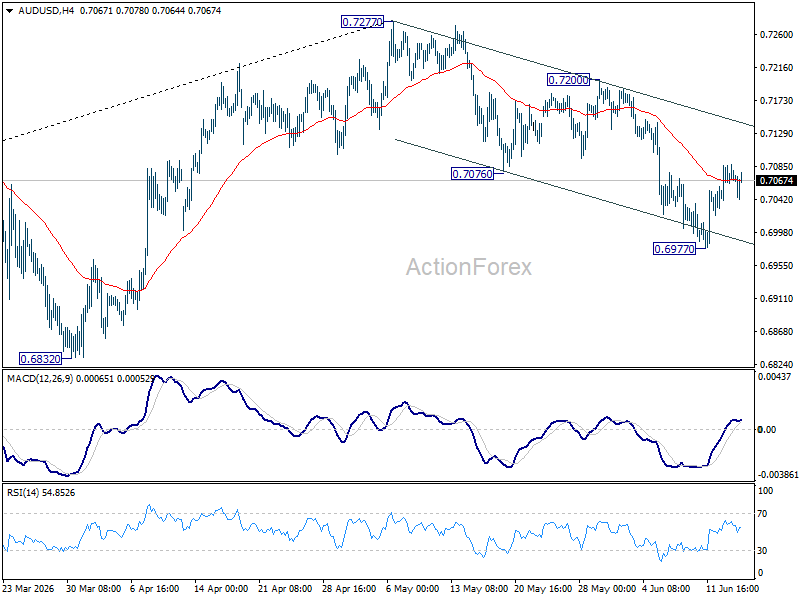
In the bigger picture, considering bearish divergence condition in D MACD, a medium term top could be formed at 0.7277 after failing to sustain above 61.8% retracement of 0.8006 (2021 high) to 0.5913 (2024 low) at 0.7206). Deeper fall could be seen to 38.2% retracement of 5913 to 0.7277 at 0.6756 as a correction. But strong support should be seen there to bring rebound. Consolidations would continue below 0.7277 for a while.
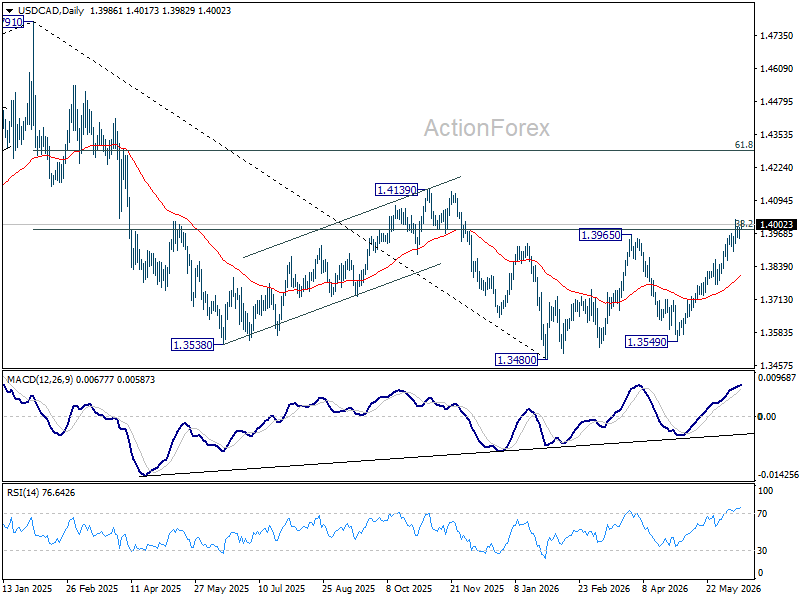
USD/CAD Daily Outlook
Intraday bias in USD/CAD remains neutral at this point. Further rise is expected as long as 1.3897 support holds. On the upside, sustained break of 38.2% retracement of 1.4791 to 1.3480 at 1.3981. Decisive break there will carry larger bullish implications and target 61.8% retracement at 1.4290 next. However, firm break of 1.3897 will turn bias back to the downside for deeper pullback.
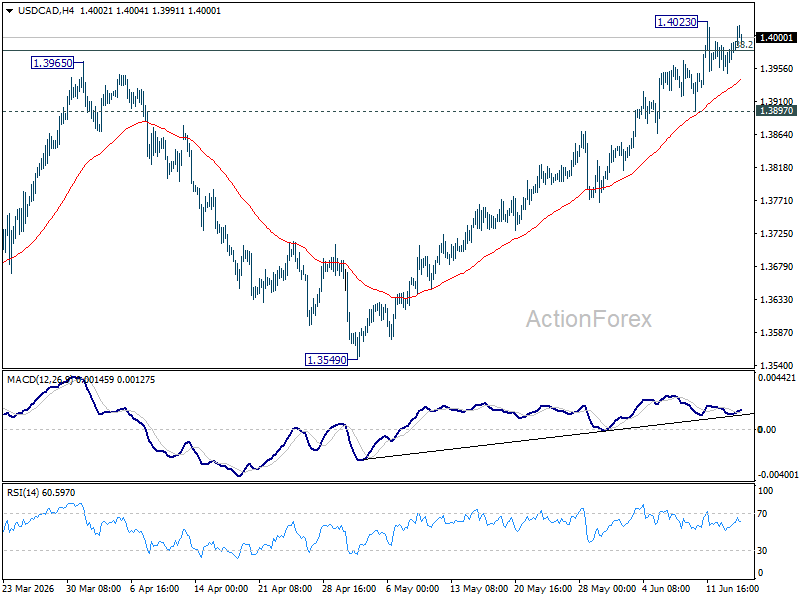
In the bigger picture, price actions from 1.4791 are seen as a corrective pattern to the whole up trend from 1.2005 (2021 low). Rejection by 38.2% retracement of 1.4791 to 1.3480 at 1.3981 will keep the decline intact, and bring another fall through 1.3480 at a later stage. However, firm break of 1.3981 will argue that the decline has completed, and set up further rise back to retest 1.4791 instead.
GBP/JPY Daily Outlook
Intraday bias in GBP/JPY remains neutral at this point. On the upside, above 215.59 will resume the rise from 210.43 to retest 216.58 high. On the downside, break of 212.90 will resume the fall from 215.59 to 211.23 support first.
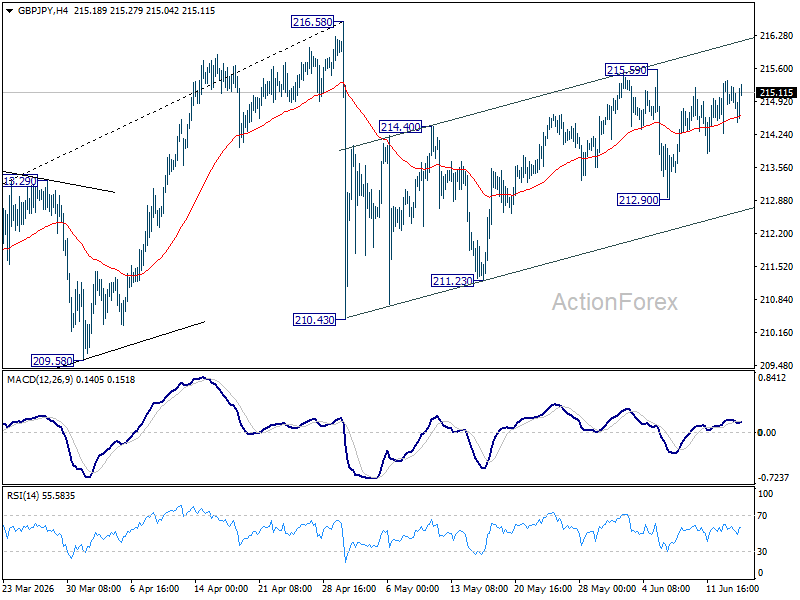
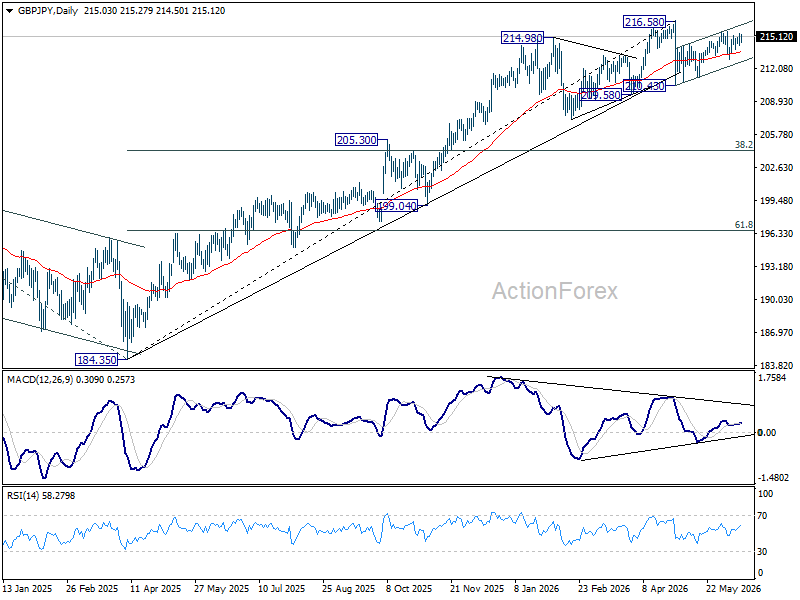
In the bigger picture, there is no clear sign of trend reversal yet. The long term up trend could still extend to 61.8% projection of 148.93 (2022 low) to 208.09 (2024 high) from 184.35 at 220.90 on resumption. However, sustained break of 55 W EMA (now at 207.11) will argue that it's already in medium term down trend for 184.35 support.
EUR/JPY Daily Outlook
Intraday bias in EUR/JPY stays neutral first. On the upside, firm break of 186.18 will resume the rebound from 182.01 to retest 187.93 high. On the downside, break of 183.95 will resume the fall from 186.18 to 182.01 support and below.
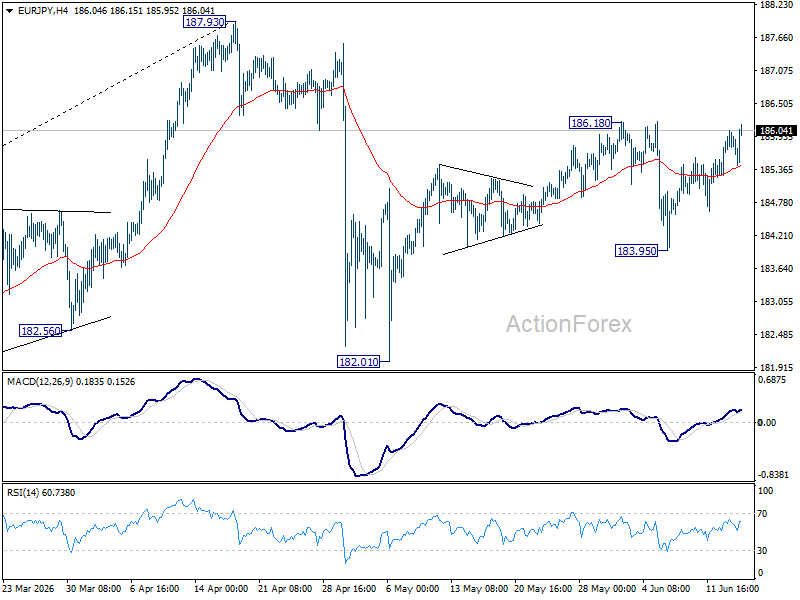
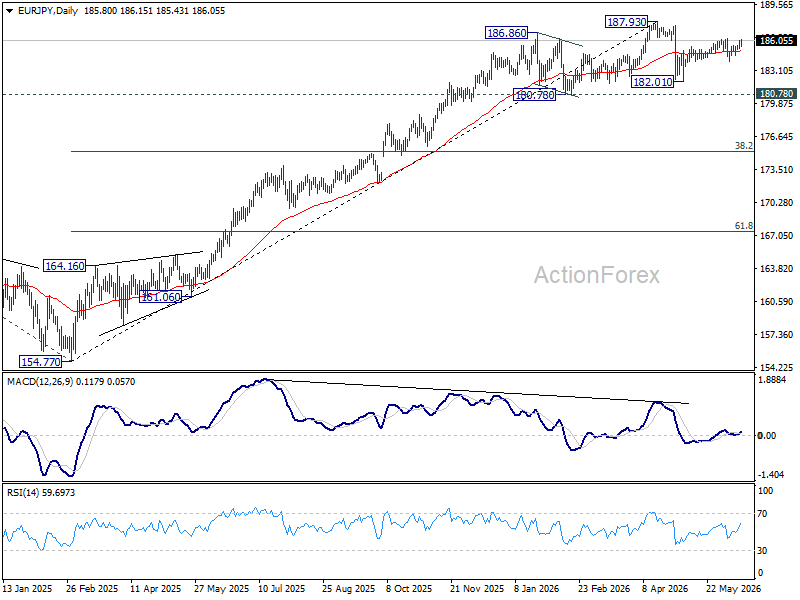
In the bigger picture, there is no sign of reversal yet. Uptrend from 114.42 (2020 low) is still expected to resume at a later stage to 78.6% projection of 124.37 (2022 low) to 175.41 (2025 high) from 154.77 at 194.88. However, sustained break of 55 W EMA (now at 179.23) will argue that it's already in a medium term down trend to 175.41 resistance turned support and below.
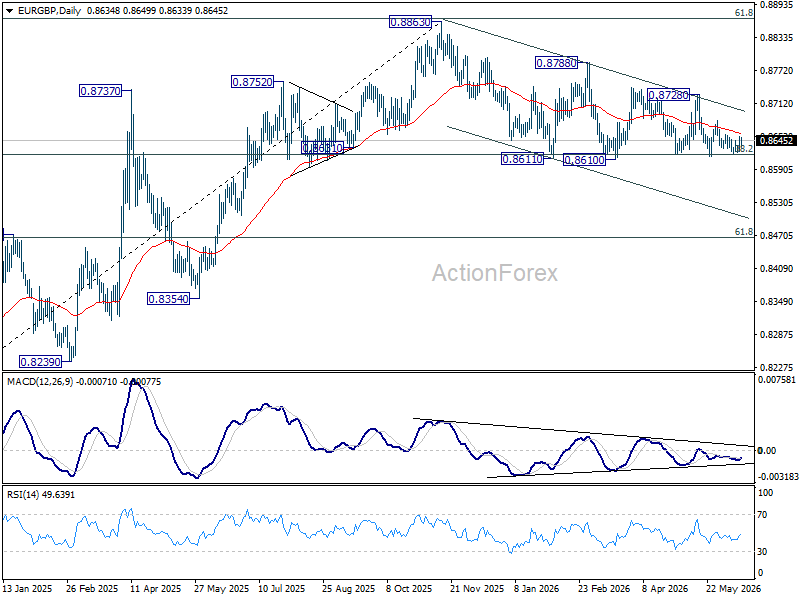
EUR/GBP Daily Outlook
Range trading continues in EUR/GBP and intraday bias stays neutral. On the downside, decisive break of 0.8610 support will revive the case of bearish trend reversal. However, on the upside, break of 0.8680 resistance will bring stronger rebound back to 0.8728 instead.
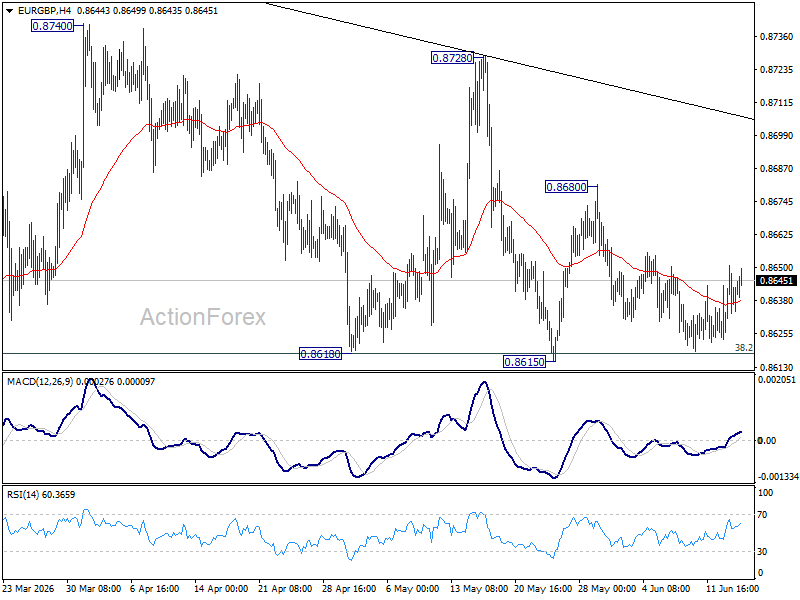
In the bigger picture, focus is staying on 38.2% retracement of 0.8821 to 0.8863 at 0.8618. Strong rebound from there will retain medium term bullishness. Rise from 0.8221 should resume through 0.8863 at a later stage. Nevertheless, sustained break of 0.8618 will confirm that whole rise from 0.8221 has completed at 0.8863. Deeper decline should then be seen to 61.8% retracement at 0.8466 at least.