
Sample Category Title
EUR/AUD Daily Outlook
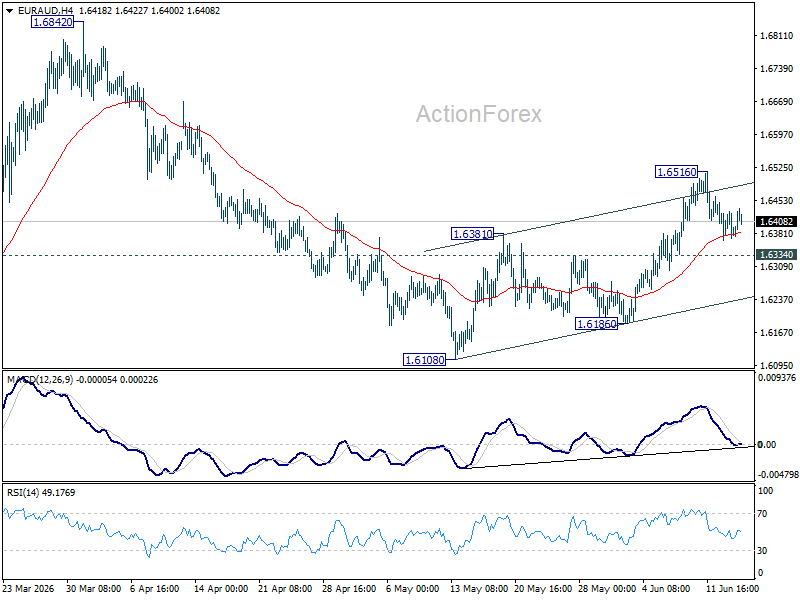
EUR/AUD is staying in consolidations below 1.6156. Intraday bias remains neutral for the moment. Further rise will remain in favor as long as 1.6334 minor support holds. Above 1.6516 will resume the rebound from 1.6108, and target 1.6842 resistance. However, firm break of 1.6334 will turn bias back to the downside for 1.6108/6186 support zone instead.
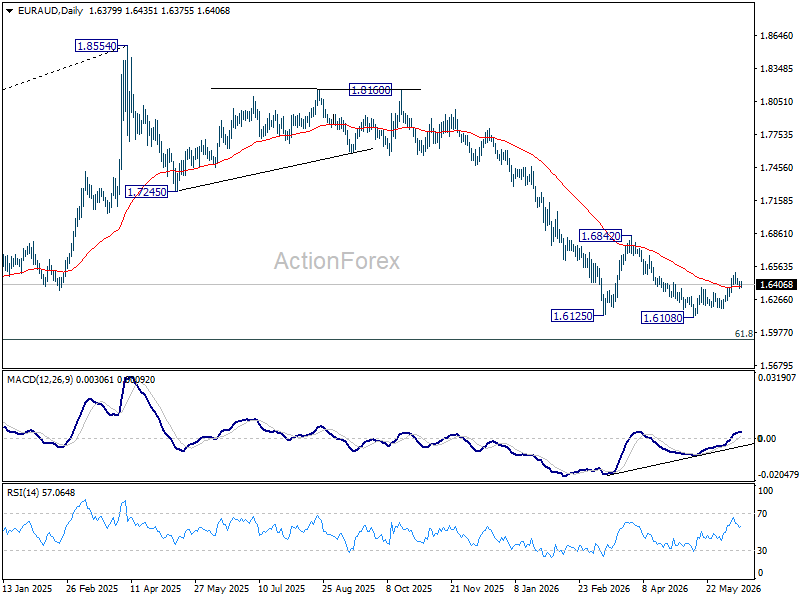
In the bigger picture, outlook will stay bearish as long as 1.6842 resistance holds. Fall from 1.8554 (2025 high) is expected to continue to 61.8% retracement of 1.4281 to 1.8554 at 1.5913. Decisive break there will pave the way back to 1.4281 (2022 low). However, firm break of 1.6842 should confirm medium term bottoming, and bring stronger rally.
EUR/CHF Daily Outlook
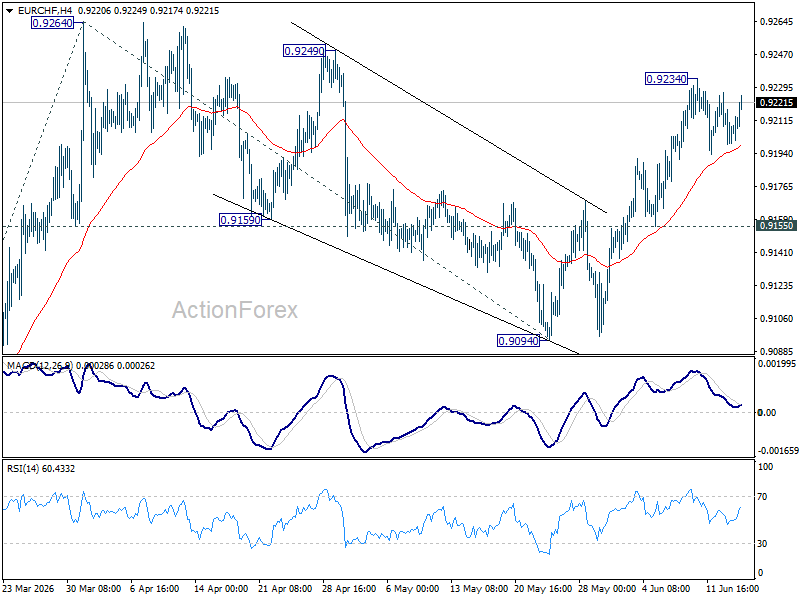
EUR/CHF is still bounded in consolidations below 0.9234 Intraday bias stays neutral at this point. Outlook is unchanged that corrective fall from 0.9264 should have completed at 0.9094. Above 0.9234 will bring retest of 0.9264 first. Firm break there will resume the rally from 0.8979 to 100% projection of 0.8979 to 0.9264 from 0.9094 at 0.9379. Risk will now stay on the upside as long as 0.9155 support holds.
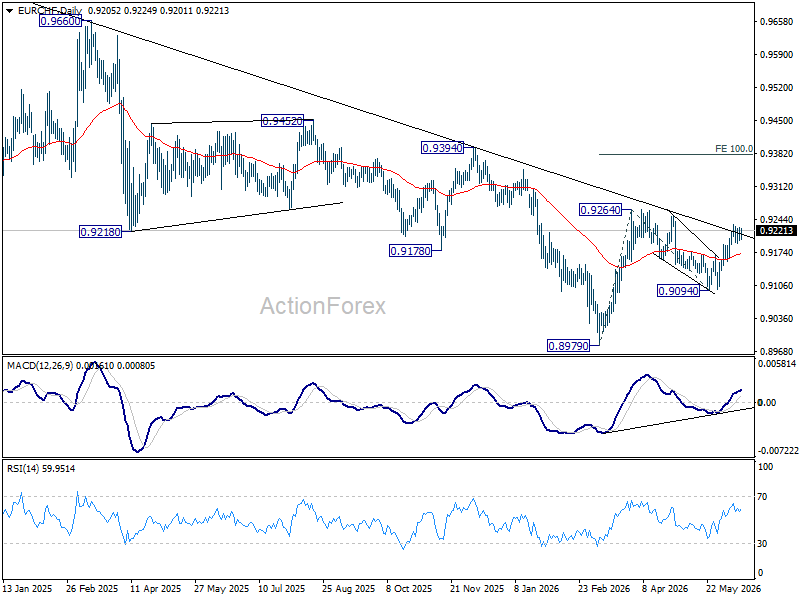
In the bigger picture, as long as 0.9394 resistance holds, down trend from 0.9928 (2024 high) could still be in progress. Firm break of 0.8979 will confirm down trend resumption. However, decisive break of 0.9394 will be an important sign of medium term bullish reversal.
Bitcoin Rally Faces Two Major Hurdles Before Bullish Reversal Can Be Confirmed
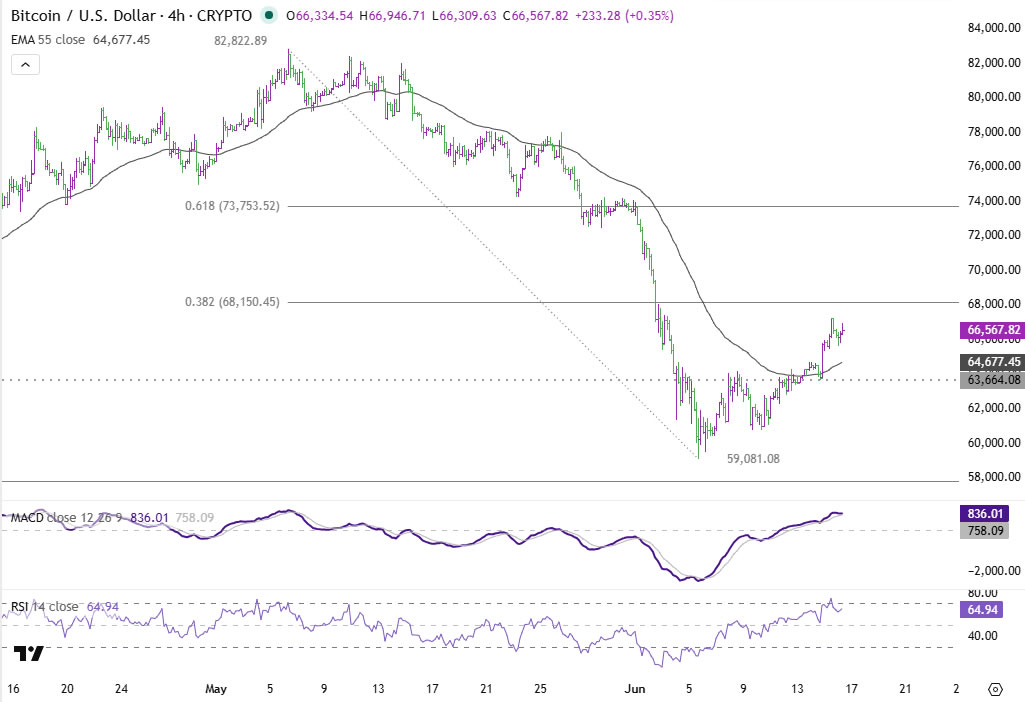
Bitcoin has extended its recovery this week, climbing back above the 66,000 level as risk appetite improves across financial markets. The rebound has been supported by a combination of easing geopolitical tensions following the US-Iran peace agreement, renewed enthusiasm for growth assets after the highly anticipated SpaceX market debut, and signs that institutional demand may be stabilizing after weeks of persistent outflows from spot Bitcoin ETFs.
The improvement in ETF flows has been particularly encouraging for crypto bulls. US spot Bitcoin ETFs recorded net inflows of USD 85.9m on a single day late last week, marking the strongest daily intake in roughly a month. While one day does not establish a trend, it suggests institutional investors may be becoming more willing to add exposure as broader market sentiment improves. Combined with the relief rally sweeping equities and other risk-sensitive assets, this has helped Bitcoin recover from recent lows.
Nevertheless, the recovery still faces significant technical tests before it can be considered a genuine trend reversal. The first hurdle lies at 38.2% retracement of 82,822 to 59,081 at 68,150. Rejection at this Fibonacci resistance, particularly if followed by a break of support at 63,644, would suggest the current advance is merely corrective. Under that scenario, a retest of 59,081 would likely follow quickly, with renewed pressure on the key psychological 60,000 level.
The second and arguably more important barrier sits at the falling 55 D EMA (now at 70,851). Even if Bitcoin clears the retracement resistance, failure at the 55 D EMA would keep the broader bearish structure intact and suggest further consolidation is needed before a sustainable rally can develop. In contrast, a sustained break above the moving average would represent a significant technical improvement and shift attention back toward resistance at 82,822.
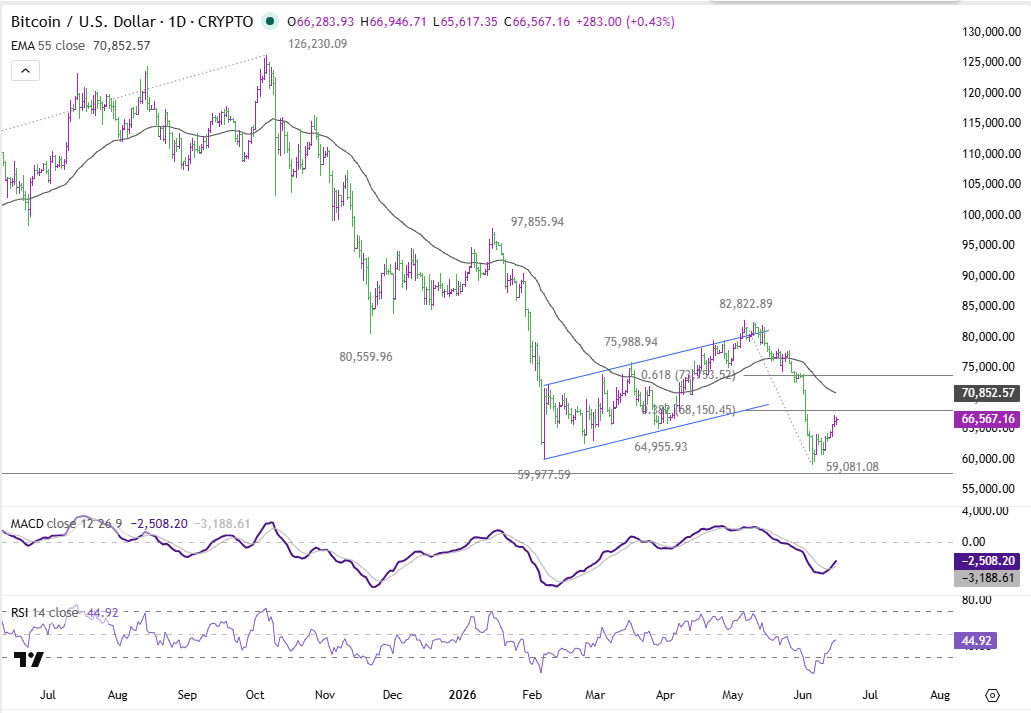
For now, the defense of the 60,000 area is an important positive development. However, Bitcoin still needs to prove it can do more than rebound from oversold conditions. Until 68,150 and 70,851 are decisively overcome, the recovery deserves respect, but a full bullish reversal cannot yet be assumed.
Brent: the Key to the Mystery Lies in Taco
- It wasn’t just the US and China that contributed to the fall in oil prices.
- Traders bet that Trump always chickens out.
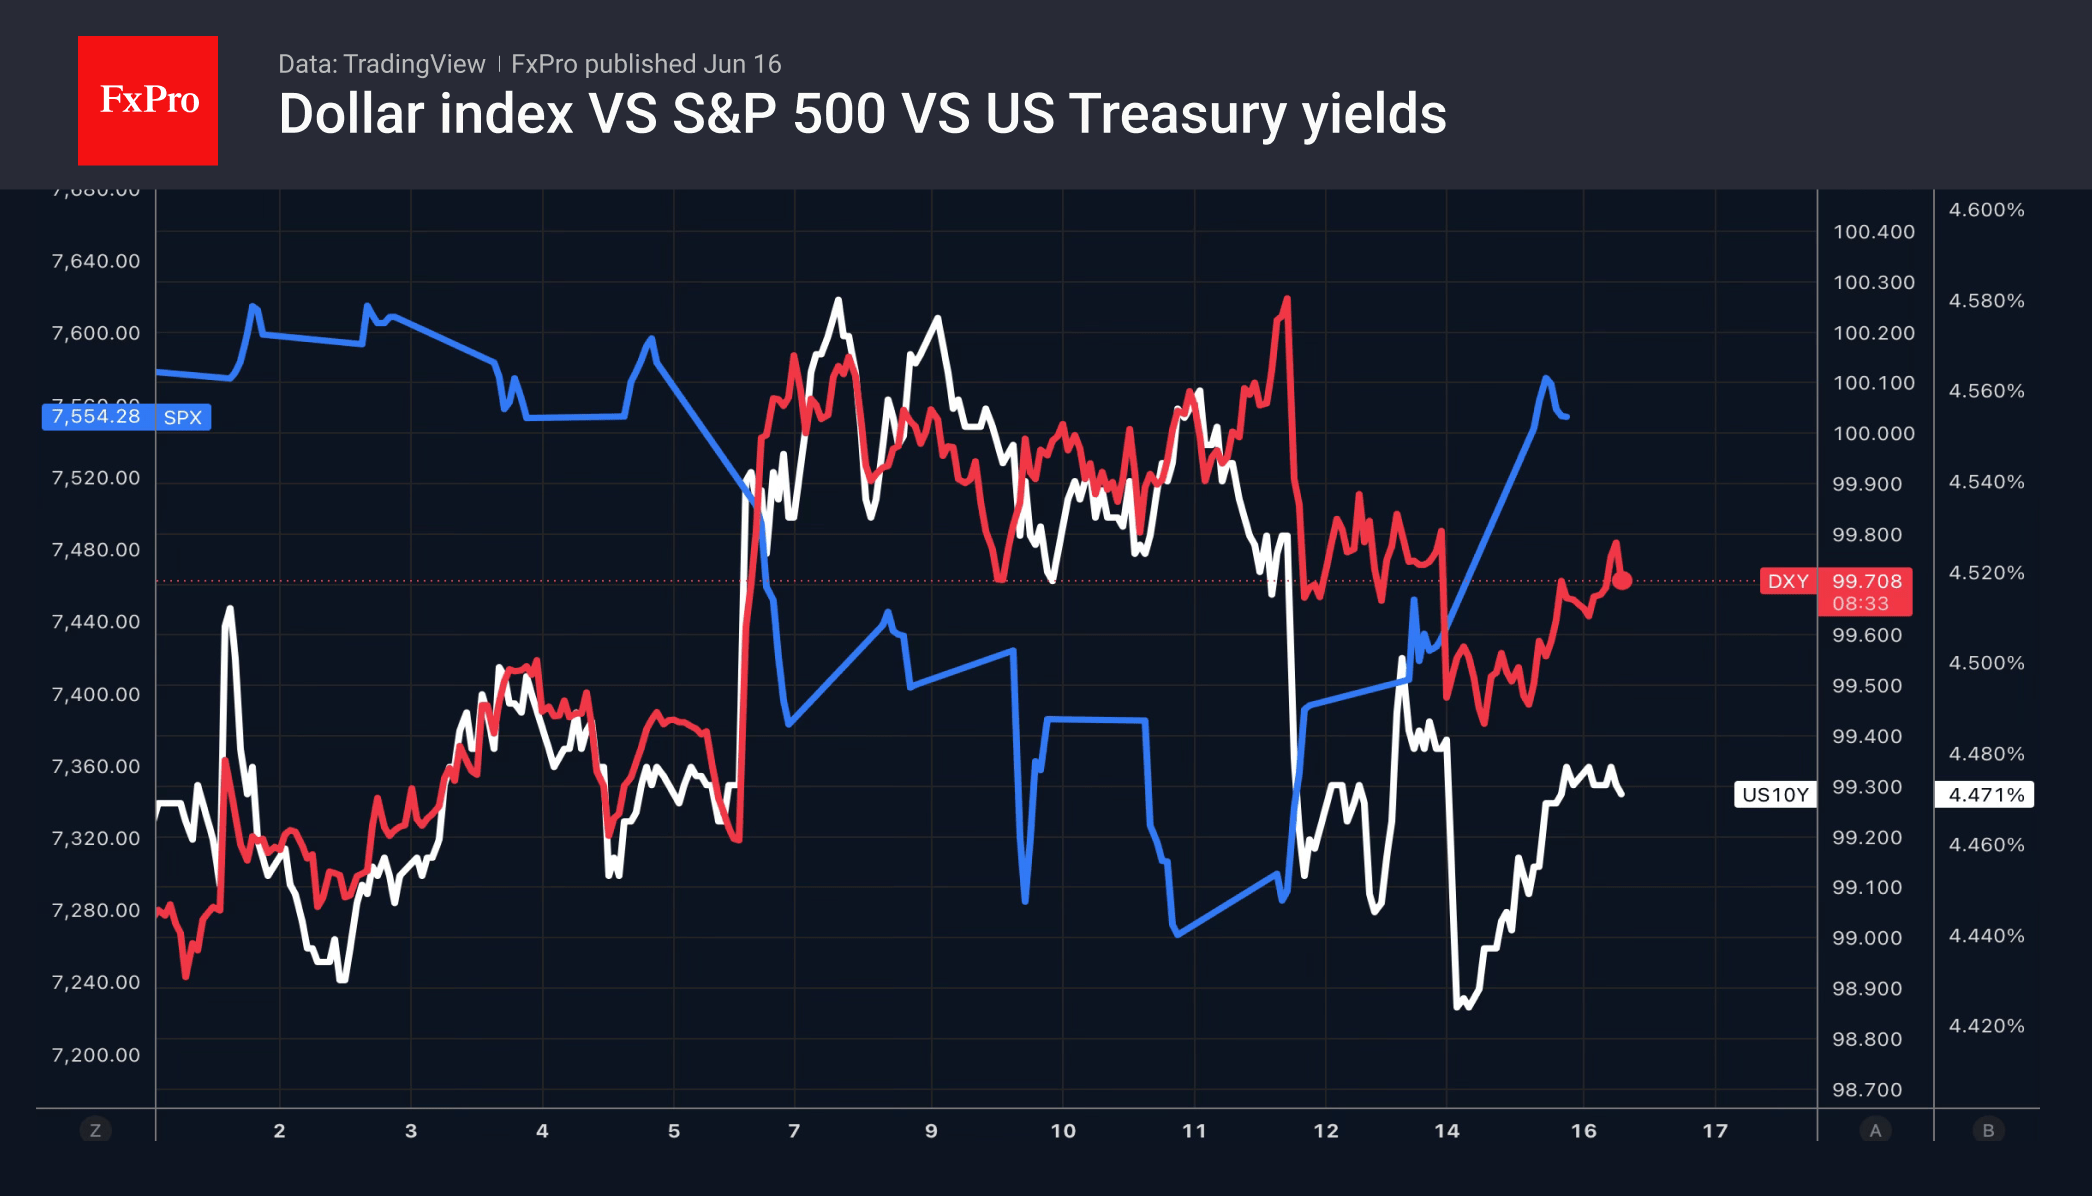
The US dollar quickly recouped some of its losses as markets began to doubt the effectiveness of the US-Iran deal. Each side is presenting the agreement as a victory for itself, and the disagreements remain. Uncertainty is once again working in favour of the greenback, whilst the rally in stock indices and the fall in oil prices are pulling it in the opposite direction.
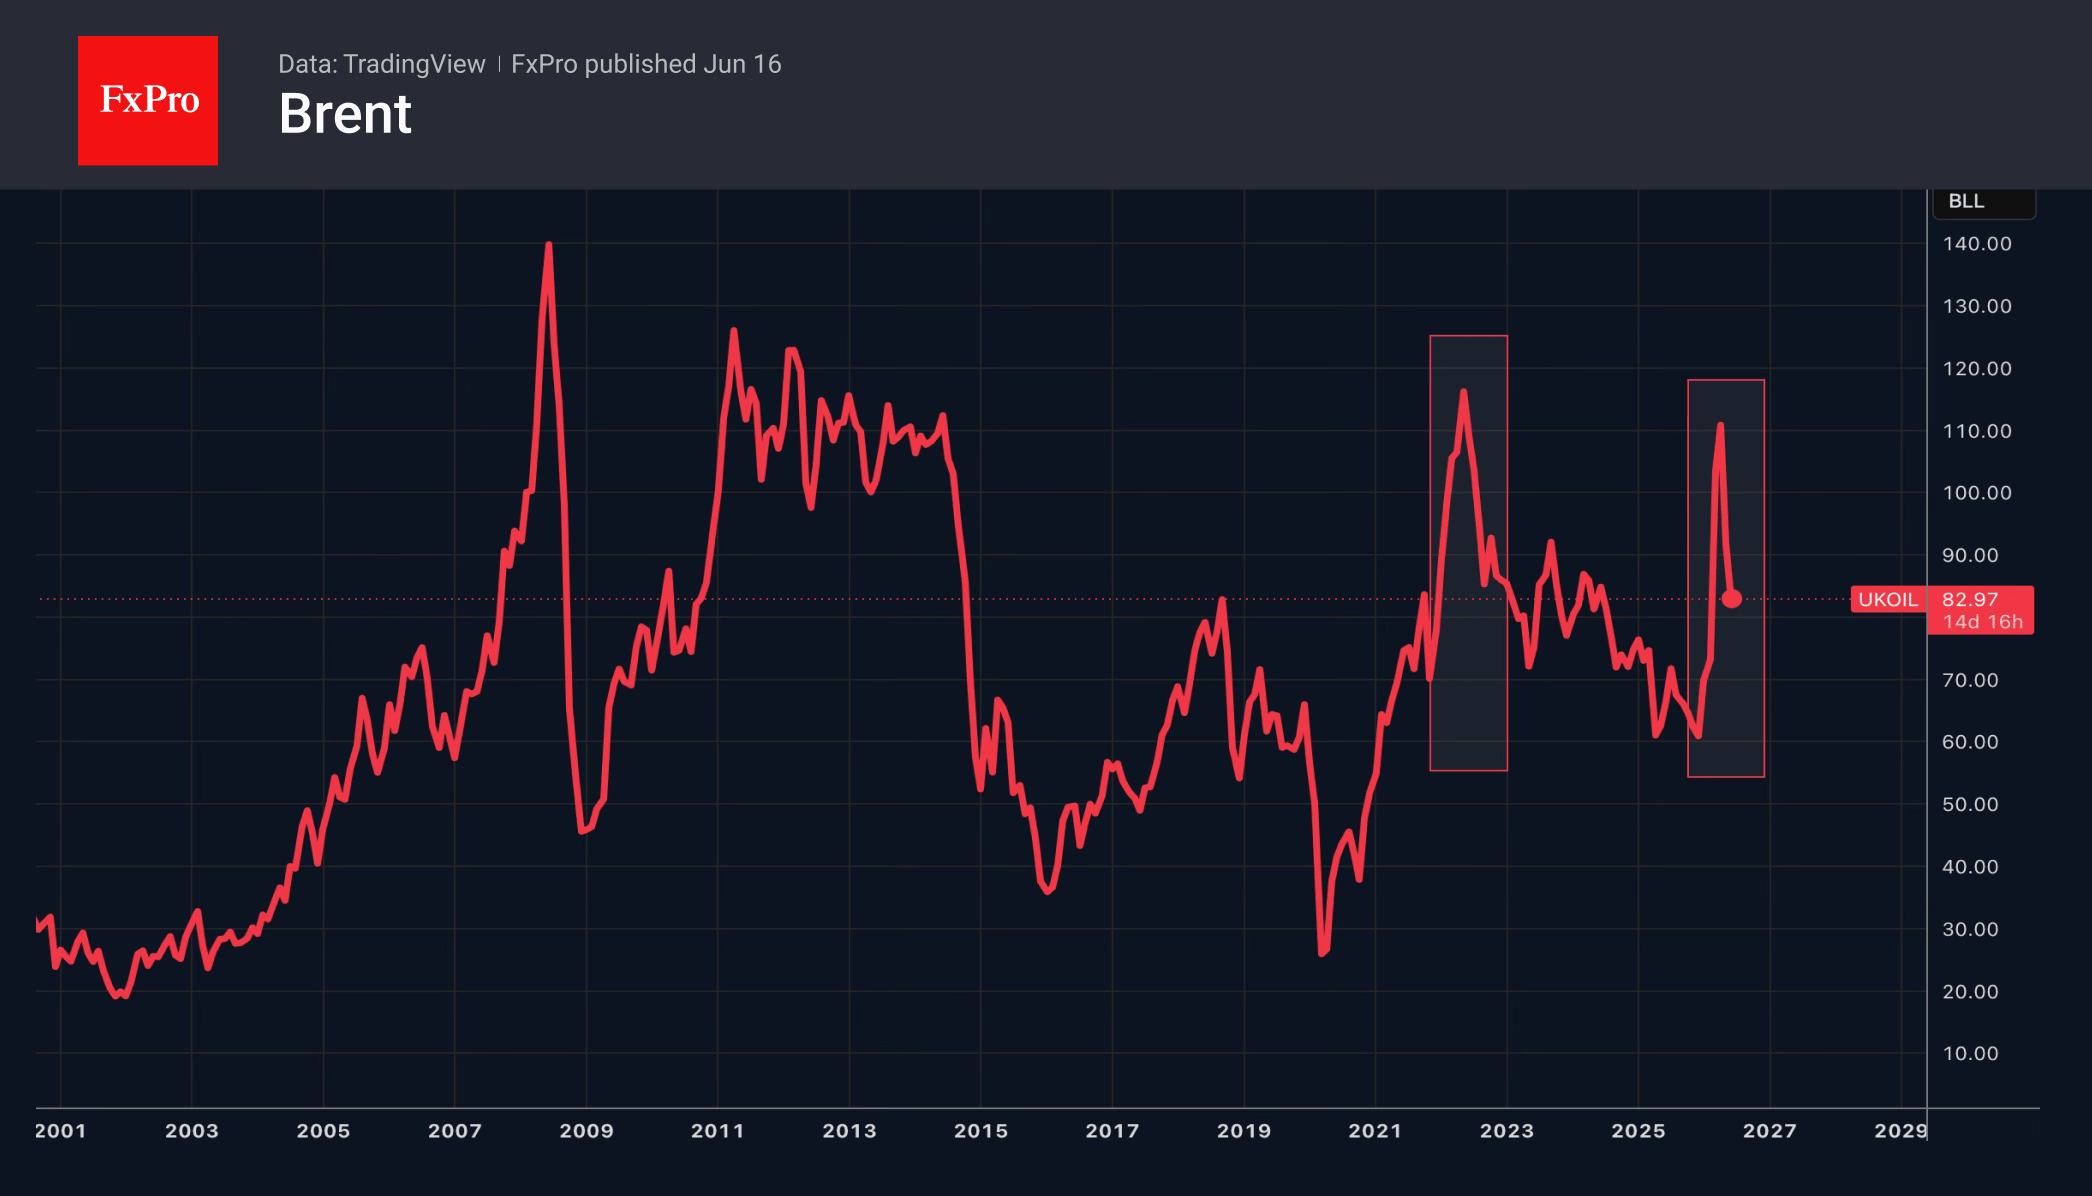
Brent’s decline to its lowest levels since early March leaves a mixed impression. On the one hand, Morgan Stanley and Goldman Sachs’ downward revisions to North Sea crude forecasts to $80 per barrel in the fourth quarter suggest that geopolitical risks are receding into the background. On the other hand, investors were confident that, even after the deal is concluded, oil prices would not quickly return to pre-war levels.
Restoring the Gulf states’ damaged infrastructure will take months. A rapid return of the Strait of Hormuz to full capacity seems unlikely. The Kalshi betting market believes this will not happen before early August. Global oil reserves are close to critical levels. US strategic reserves have plummeted to a near-record low of 340 million barrels.
Before the conflict in the Middle East, a blockade of the Strait of Hormuz was considered an apocalyptic scenario. In 2022, amid events in Ukraine, Brent soared to $137 a barrel amid fears that Russia, which exports 7.5 million barrels a day, would be cut off from the market. In the case of the world’s key oil artery blockade, the figure was twice as high, yet Brent crude rose only to $120.
Undoubtedly, China’s 29% drop in May imports to an eight-year low, record US exports, the depletion of global stocks, and a decline in global demand due to high prices all played a part. However, one must not underestimate TACO trading or the likelihood that Trump always chickens out. It was precisely this that prevented Brent from soaring when the US resumed bombing Iran.
The White House talks a lot about peace, but for now, the deal appears to be a strategic retreat. The Americans’ military objectives remain unmet. Will the fading of TACO help oil find its bottom?
The FxPro Analyst Team
Crypto: Growth Without the Euphoria
Market Overview
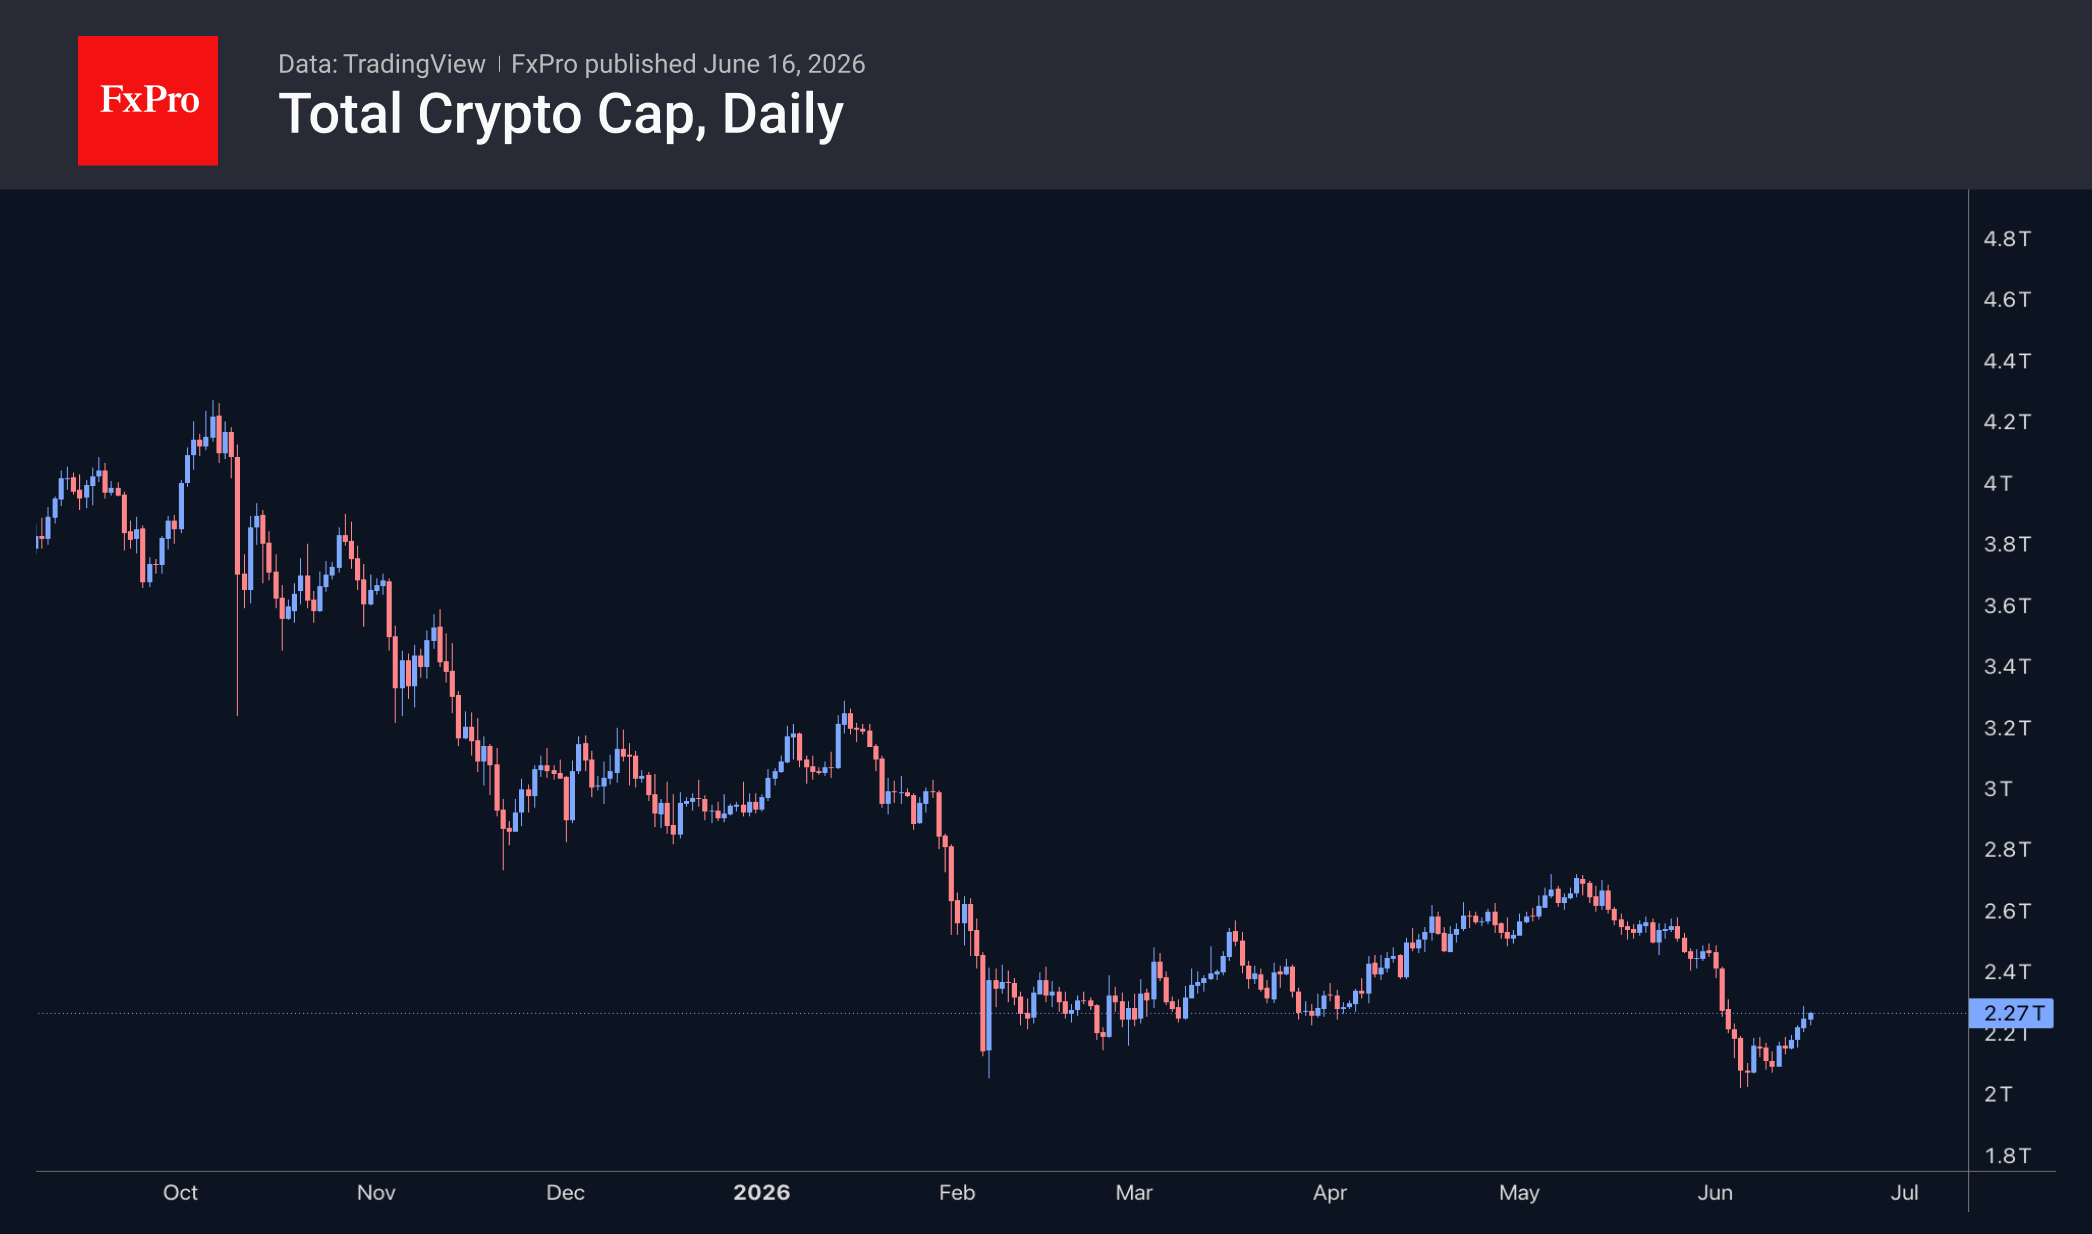
The crypto market capitalisation rose to $2.3 trillion by the end of Monday, before falling back to $2.27 trillion at the time of writing. The market recovery trend continues, but the relatively cautious pace of growth suggests we are far from euphoria. This looks more like a phase of asset consolidation by major players, which means the rally will have to wait a while. Among the most active coins, the growth leaders were Stellar (+14.8%), Uniswap (+14.2%) and Aave (+7%). The underperformers were Toncoin (-5.6%), Official Trump (-3.3%) and The Graph (-3.2%).
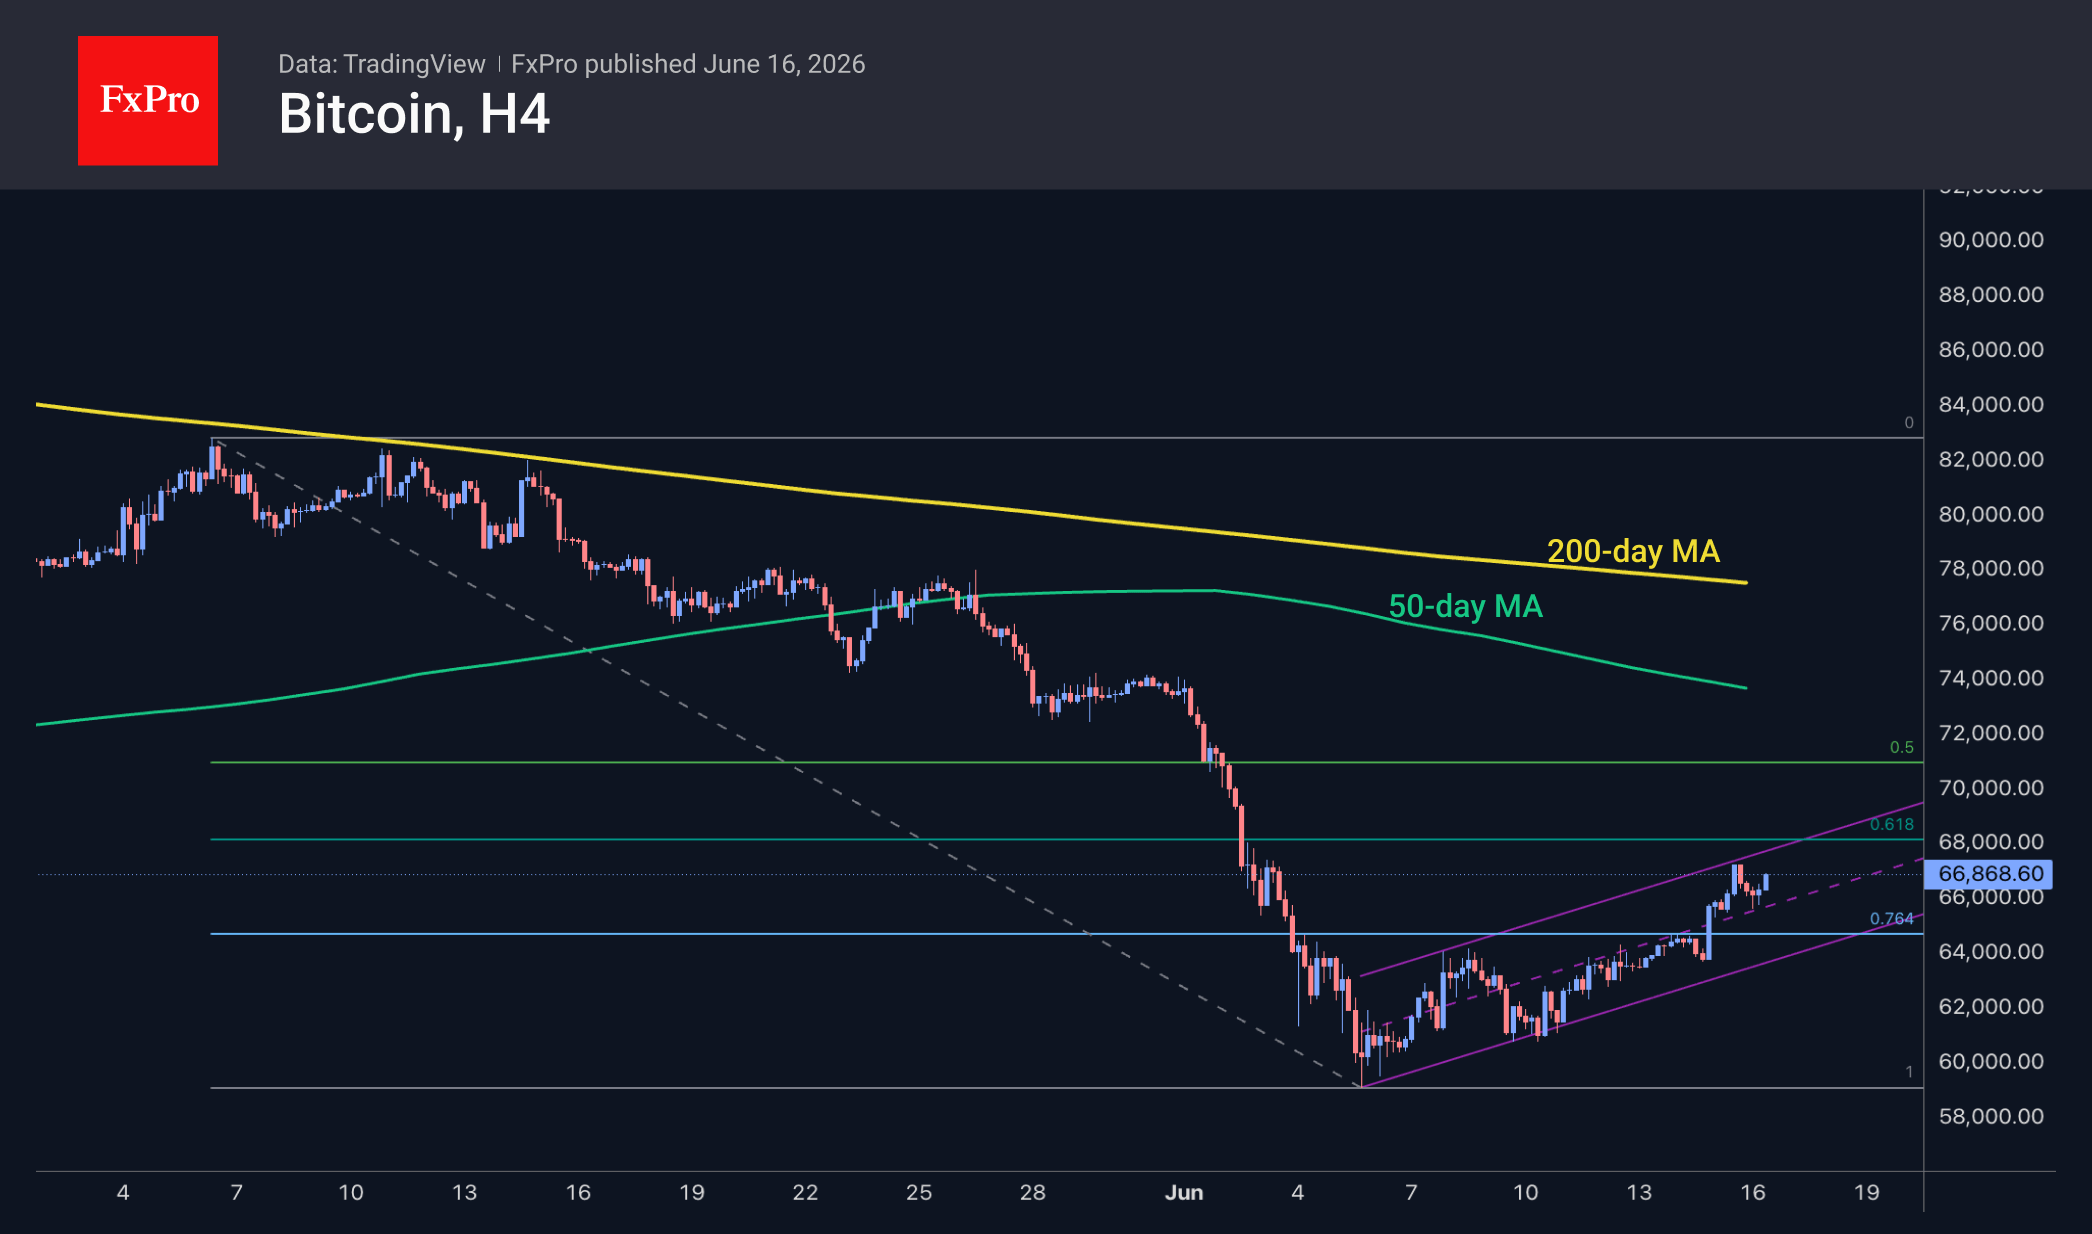
Bitcoin is trading near $66.3K, up just under 1% over the past 24 hours, but some distance from Monday’s intraday highs, which were approximately $1K higher. The price rise is occurring within a channel that formed 10 days ago. On Monday, the price confirmed this channel by touching and pulling back from its upper boundary, but it remains at the top of the range. Provided the positive momentum continues, we see the $68K area (the 61.8% Fibonacci retracement level) as the nearest technical resistance to price growth. A more distant signal of market strength would be a firm consolidation above the 50-day moving average, which currently exceeds $73K.
News Background
CryptoQuant notes that inflows of bitcoins to crypto exchanges from long-term holders have reached their lowest level since 2015. Selling pressure is easing, and the number of bitcoins held by long-term holders has reached a new all-time high of 15.8 million BTC.
Relai expects Bitcoin’s bearish trend to end once the phase of major investment in artificial intelligence concludes. Capital may begin to flow back into the leading cryptocurrency as early as next year.
Strategy purchased an additional 1,587 BTC last week for $100 million at an average price of $63K per coin. The company now holds 846,842 BTC, purchased for $64.1 billion at an average price of $75.6K per Bitcoin.
BitMine has increased its Ethereum holdings to 5.62 million ETH, having purchased approximately 0.08 million ETH over the past week. BitMine’s reserves have reached 4.66%, with plans to acquire 5% of the Ethereum supply.
The FxPro Analyst Team
German ZEW Sentiment Jumps to 10.5 as Iran Peace Hopes Lift Outlook
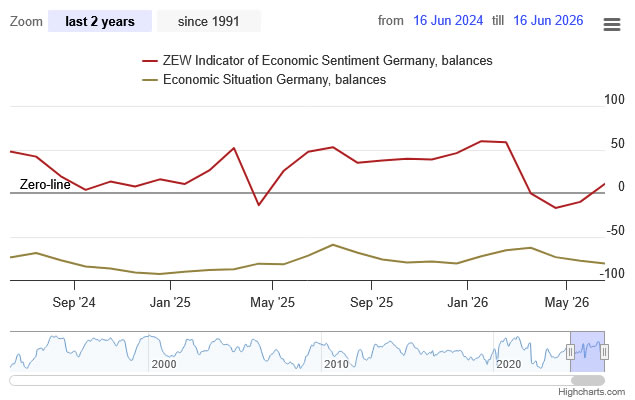
German investor sentiment improved sharply in June, with the ZEW Economic Sentiment Index surging from -10.2 to 10.5, far exceeding expectations of -6.0 and returning to positive territory. The Eurozone-wide measure showed a similar improvement, rising from -9.1 to 9.5, also well above forecasts. However, assessments of current economic conditions continued to deteriorate, with Germany's Current Situation Index falling from -77.8 to -81.0 and the Eurozone gauge slipping to -43.4.
According to ZEW President Achim Wambach, the dramatic improvement in expectations reflects growing confidence that the conflict between the United States and Iran is nearing an end. He noted that easing geopolitical tensions could reduce pressure on energy prices and inflation, benefiting both energy-intensive industries and households while supporting domestic demand.
The improvement was broad-based across several key sectors. Expectations for the automotive industry rose by 21.9 points, while chemical and pharmaceutical companies gained 16 points and mechanical engineering improved by 9.2 points. Sentiment toward private demand also strengthened by 11.7 points.
However, most of these sectors remain in negative territory, highlighting that optimism is recovering from a weak starting point rather than signaling a full-fledged rebound. Construction was the notable exception, with sentiment falling sharply, likely reflecting the impact of the ECB's recent interest rate hike on financing conditions.
| Indicator | May | June | Expected |
|---|---|---|---|
| Germany ZEW Economic Sentiment | -10.2 | 10.5 | -6.0 |
| Germany Current Situation | -77.8 | -81.0 | -77.0 |
| Eurozone ZEW Economic Sentiment | -9.1 | 9.5 | -7.2 |
| Eurozone Current Situation | -41.4 | -43.4 | N/A |
USDJPY Driven by Emotions: Bank of Japan Raises Rate to Highest Level Since 1995
The USDJPY pair declined to 160.13 on Tuesday after two highly volatile trading sessions. Investors remain focused on the Bank of Japan’s latest policy meeting.
The regulator raised its key interest rate by 25 basis points to 1.0%, the highest level since 1995. This move is intended to help contain inflation and support the national currency, which has remained under pressure for most of the year.
In recent weeks, the yen has been actively used in carry trade operations: investors borrowed funds in the low-yielding Japanese currency and invested them in higher-yielding assets. This increased pressure on the JPY despite the Bank of Japan’s gradual policy tightening and repeated currency interventions by Tokyo.
The main reason behind the yen’s weakness remains the significant interest rate gap between Japan and the US. As long as US rates remain substantially higher than Japanese rates, the dollar retains a structural advantage.
The market is also closely watching developments in the Middle East.
Investors expect the US and Iran to sign an agreement in Switzerland at the end of the week. If the deal is reached and leads to the reopening of the Strait of Hormuz, it could ease tensions in global markets and reduce demand for safe-haven assets, including the US dollar.
USDJPY Technical Analysis
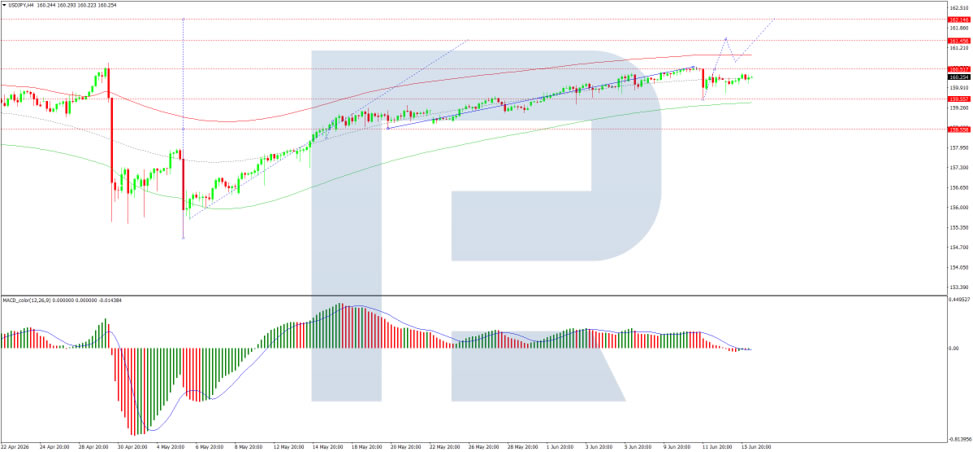
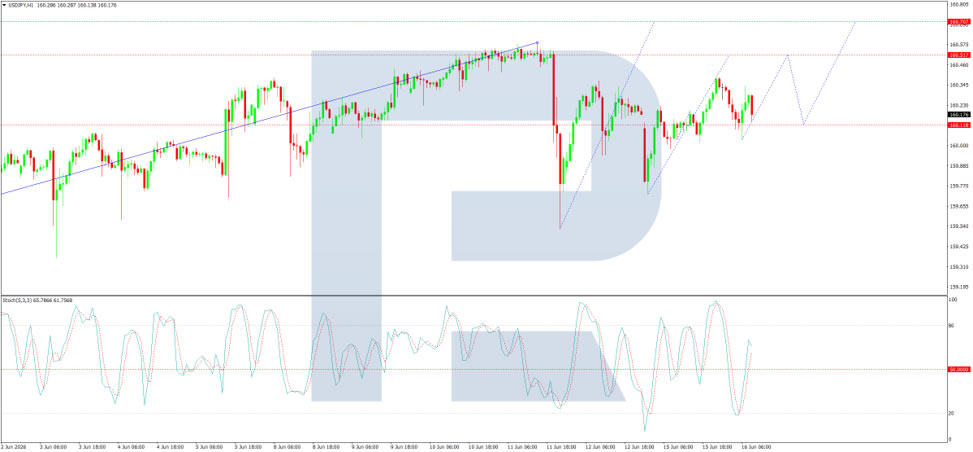
On the H4 chart, USDJPY has formed a consolidation range around 160.20. After breaking upwards, the pair is developing a growth wave structure towards 161.50. Today, we expect this target to be reached, followed by a decline towards 160.30. Technically, this scenario is confirmed by the MACD indicator: its signal line is above zero and pointing firmly upwards, reflecting potential for the continuation of the growth wave.
On the H1 chart, the market is forming a growth structure towards 160.51. After that, a correction towards 160.20 may be considered. The pair is then expected to rise towards 160.70, with the potential to continue the trend towards 161.50.
This scenario is supported by the Stochastic oscillator: its signal line is above 50 and moving firmly upwards towards 80, indicating that short-term upside potential remains intact.
RBA Holds at 4.35%, Ready to Hike if Needed
RBA holds cash rate steady at June meeting as expected, strikes a hawkish tone with rate hikes still on the table.
As was all but universally expected, the RBA Monetary Policy Board (MPB) held the cash rate steady at 4.35% at its June meeting. But in a move that was less surprising to us than to some in the market, it explicitly signalled that further hikes remain on the table.
The final sentence of the media release added the clause “including increasing the cash rate target further if required” to the usual remark about doing what is needed to achieve its policy goals. In the opening statement to the post-meeting media conference, Governor Bullock repeated this point. This drafting decision is unusual for an RBA statement, and a stronger steer than in recent communication. It suggests that the MPB wanted to hose down recent speculation that they are done hiking rates.
We therefore retain our view that further cash rate increases are coming. If we are right that the June quarter result for trimmed mean inflation will again be strong, the next hike will come at the August meeting. A longer pause is possible if the next few inflation prints are less alarming, but the direction of travel is still most likely up. We expect it will take a further unexpected weakening in the domestic economy – and a better inflation outlook – to entirely prevent further cash rate hikes from here.
The post-meeting statement highlighted the RBA’s key view that inflation was too high, and a period of slower growth would be needed to get inflation back to target. The RBA continues to view the Australian economy as facing capacity pressures, and only able to grow by about 2%yr before inflation rises. This is in line with previous RBA messaging, though lower than our own view.
The MPB has not been as spooked by the recent data flow on the household sector and labour market as market pricing implied it would be. The RBA’s forecasts, which were based on an assumed path for the cash rate of one-and-a-bit hikes, already envisaged some slowdown. Indeed, the RBA regards the labour market as still a bit tight at the current unemployment rate, a point the Governor noted in the media conference.
The energy price shock is seen adding to the pre-existing inflation problem. Energy and “most related” commodity prices were mentioned as still being above pre-war levels, and – consistent with our own Market Outlook forecasts – the recovery following resolution of the conflict is expected to be gradual.
The discussion of the real side of the economy was sanguine. The slowdown in consumer spending was “as expected”, comments on the housing market suggested little alarm, and most labour market indicators were seen as “resilient”. In the media conference, the Governor stated that it was too early to say what the effect of recent macro policy changes, including the rate rises as well as the Budget, would be on the housing market.
The tone of the discussion on pass-through of the energy shock to other prices was also more hawkish than previously. The May post-meeting statement described “early signs” that firms were looking to pass through higher costs to their own prices. This month, these were “signs”, not “early signs”, and some of the price increases were noted as already occurring, especially in new housing construction. This language is important given the importance the MPB is placing on ensuring the current energy price shock does not become embedded in ongoing inflation. Also noteworthy in the media conference, the Governor highlighted that firms can only pass on higher costs into their own prices if demand is strong enough that consumers will accept that. The comments in May that passing on costs was “reasonable” were not repeated; rather, pass-through was an “expected” reaction by businesses, especially small businesses given this is “their livelihood”.
Overall, this meeting’s outcome and communication were in line with our existing view of the RBA’s analysis of the economy. The MPB has not been spooked by recent soft data, seeing these outcomes as a necessary part of the slower growth needed to get inflation down. It is more concerned about upside risks to inflation than downside risks. And it is now seeing more pass-through into prices, especially in housing construction, as we first flagged in early April .
Sunrise Market Commentary
Markets
The Bank of Japan lifted its policy rate as widely expected from 0.75% to 1.0%, the highest level since 1995. The board voted 7-1 in favor, with board member Asada, appointed by Prime Minister Takaichi, supporting the status quo. Governor Ueda is hospitalized and did not cast a vote. The policy statement highlighted that the BoJ will continue to raise the policy rate and adjust the degree of monetary accommodation given that underlying CPI has been approaching 2% and financial conditions have been accommodative. The latter is a tweak from the April statement, which still mentioned significantly low real interest rates, and suggests the central bank may be approaching more neutral policy settings. When it comes to inflation, labor shortages continue to be strong, supporting the virtuous dynamic between wages and prices and resulting in rising medium- to long-term inflation expectations. Underlying CPI is expected to hit the 2% price stability target between the second half of fiscal 2026 and fiscal 2027 and remain around that level thereafter. Companies are also seen passing on higher energy costs at a relatively fast pace. Apart from the interest rate decision, the BoJ announced that it will reduce the planned amount of its monthly JGB purchases by about JPY 200 billion each calendar quarter until January-March 2027. From April 2027, monthly JGB purchases will be around JPY 2 trillion. The Japanese yield curve is bear steepening this morning, with yields rising by as much as 9.4bps at the 15-year tenor. The Japanese yen is going nowhere and remains stuck above the USD/JPY 160 threshold that prompted FX intervention at the end of April. Japanese money markets see the next rate hike, with an 84% probability, by the December meeting.
Brent crude continues to trade near the USD 83/bbl area where it started the week in response to news that the US and Iran will sign an interim deal in Geneva on Friday. Apart from ongoing bullishness in equity markets, fixed income and FX markets are treating the development cautiously as the devil may be in the details. EUR/USD is back below 1.1600. The 60-day ceasefire extension intended to facilitate a nuclear agreement appears rather tight, while it will also take time for oil flows through Hormuz to normalize. From a risk perspective, the balance has shifted from continued "hope for a deal" to "fear that the deal could derail". Today's economic calendar contains second-tier data such as Germany's ZEW investor confidence survey as markets count down to Kevin Warsh's first meeting as Fed Chair.
News & Views
The Reserve Bank of Australia (RBA) kept its policy rate unchanged at 4.35%. The decision follows 25bps rate hikes at the first three meetings of 2026 as capacity pressures pushed inflation higher. Recent data indicate that inflation remains too high, with some firms experiencing cost pressures from higher energy prices and other commodities and passing these costs on through higher prices for goods and services. At the same time, financial conditions have tightened in response to previous rate hikes, with the RBA seeing signs that consumer spending growth is slowing and that housing market momentum has shifted toward price declines in some capital cities. The central bank also noted a somewhat higher-than-expected unemployment rate. The RBA remains focused on ensuring that inflation does not become embedded through the pass-through of higher oil prices. To achieve this, demand growth needs to slow to reduce capacity pressures and bring inflation back to target. The Bank reiterated that policy is well positioned to respond to future developments, including raising rates again if necessary. After trading around 4bps higher ahead of the decision, the Australian 3-year yield eased afterward and is currently little changed near 4.43%. The Australian dollar also softened modestly toward AUD/USD 0.7050.
A series of Chinese economic releases published this morning showed a mixed and increasingly divergent picture of the Chinese economy. Retail sales unexpectedly declined by 0.6% y/y in May, with year-to-date growth slowing to 1.4%, suggesting continued weakness in domestic demand. Fixed asset investment contracted further to -4.1% y/y year-to-date from -1.6% previously, while property investment also deteriorated further to -16.2% year-to-date. Some weather-related disruptions may have contributed to the weakness in demand indicators. Both new home prices (-0.2%) and existing home prices (-0.26%) continued to decline on a monthly basis. The unemployment rate eased slightly from 5.2% to 5.1%. On the other hand, the supply side of the economy continues to perform better. Industrial production rose 4.5% y/y in May from 4.1% previously, indicating that exports and AI-related industries continue to support activity even as domestic demand struggles to regain momentum. After touching its strongest level since February 2023 yesterday, the yuan eased marginally this morning, with USD/CNY trading around 6.761.
GBP/USD: Consolidation Ahead of the Bank of England Decision
The Bank of England is due to hold its next policy meeting on 18 June. According to a Reuters poll conducted between 5 and 12 June, all 65 economists surveyed expect the Bank Rate to remain unchanged at 3.75%, although around 40% of respondents anticipate at least one rate increase before the end of the year. Domestic data are also weighing on sterling: UK GDP contracted by 0.1% in April, marking the first monthly decline since August last year, while a Bank of England survey showed a notable rise in household inflation expectations amid the conflict in the Middle East. Uncertainty surrounding the monetary policy outlook, coupled with weakening macroeconomic data, is creating a mixed backdrop for the pair.
Technical Picture
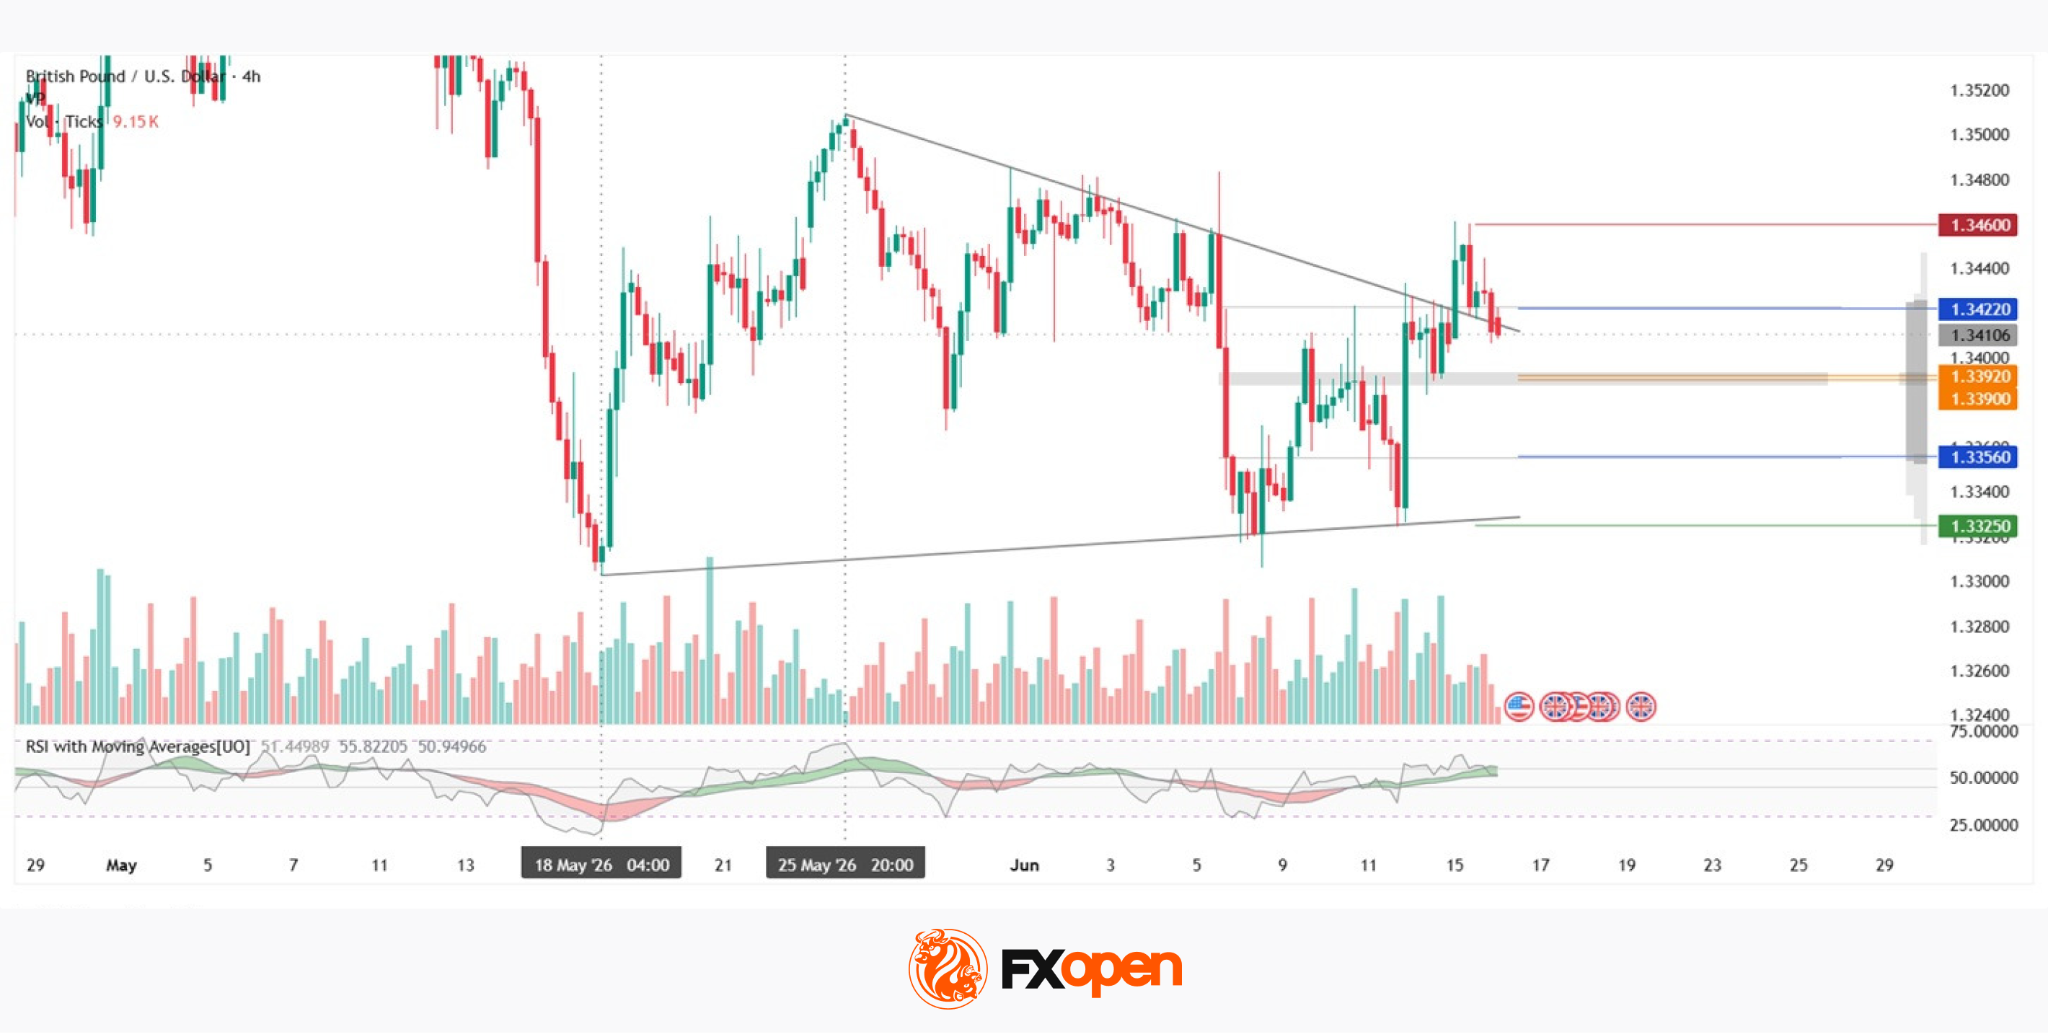
On the four-hour chart, GBP/USD has formed a pattern resembling a descending triangle, with the upper boundary declining steadily while the lower boundary remains broadly horizontal. The pattern developed following the decline that began on 25 May and could be interpreted by market participants as a continuation formation within the broader downtrend that has been in place since the start of the year. At present, the price is attempting to return to the triangle range after briefly moving above the upper boundary and subsequently retreating.
The resistance area around 1.3460 remains relevant if the price fails to establish itself below the upper boundary of the profile at 1.3422 and the Point of Control (POC) zone at 1.3390–1.3392. On the downside, support in the 1.3325 area could become the nearest target in a bearish scenario should the lower boundary of the profile at 1.3356 be breached.
RSI + MAs are currently reading 51, 55 and 50. All three lines are clustered around the neutral zone, providing no clear directional signal.
Key Takeaways
The neutral readings of RSI + MAs, together with the possibility of the price returning to the triangle range following the recent pullback, contribute to an uncertain technical picture. The Bank of England's decision on 18 June and the accompanying policy guidance are likely to be the key factors shaping the pair's near-term direction.
Trade over 50 forex markets 24 hours a day with FXOpen. Take advantage of low commissions, deep liquidity, and spreads from 0.0 pips (additional fees may apply). Open your FXOpen account now or learn more about trading forex with FXOpen.
This article represents the opinion of the Companies operating under the FXOpen brand only. It is not to be construed as an offer, solicitation, or recommendation with respect to products and services provided by the Companies operating under the FXOpen brand, nor is it to be considered financial advice.